THE VALUE OF PRE...ENGINEERING TESTS II PREDICTING FRESHMAN SCHOLASTIC SUCCESS IN. AN ENGINEERING CURRICULUM A THESIS.
|
|
|
- Catherine Hodges
- 5 years ago
- Views:
Transcription
1 THE VALUE OF PRE...ENGINEERING TESTS II PREDICTING FRESHMAN SCHOLASTIC SUCCESS IN. AN ENGINEERING CURRICULUM A THESIS Plesented to the Paaulty of the Division of Gxaduate Studies. ft Geoxgia School of Teohnology In Partial Fulfillment of the Requixements for the Degree Master of Science in Industrial Management By James William Sweeney June 1848
2 THE VALUE OF P1M3IGINEERING TESTS IN PEED' CTING FRESHMAN SCHOLASTI C SU MESS IN AN ENGINEERING CURRI CULUM Approved : A Date Approved by Chairman
3 AOKNOVIEDGKENTS On the completion of this work I wish to express my sincerest thanks to Dr. Joseph E. Moore, not only for his suggestion of the problem, but also for his most valuable aid and guidance in its prosecution. I should also like to thank Professor Edward A. Gaston Jr. for his wise counseling, and my wife, Shirley Simpson Sweeney, for her invaluable assistance with the laborious tabulations.
4 iv TABLE OF CONTENTS' PAGE Acknowledgments *** o. The. Problems, Definitions, and Statistics 1 Analysis of the Distributions 11 Prediction 15 Conclusions 23 'ummary 25 BIBLOGRAPHY 26 APPENDIX I, Tables 27 APPENDIX IIy Graphs and Charts 37 Amin= III, Calculations 51
5 LIST OF T_ABLES TABLE NO, PAGE 1. Summary of the Statistical Calculations Scattergram, P.R.I. total vs. Point Avg Soattergram, A.C.E. total vs.-engl. Oracles Scattetgram, A4.6..: total vs.. Math. Grades Soattergram, P.LI. Math vs. Math Grades SCattergram,- total vs,' Point Avgs Scattetgram, P.E.I. Matirvs. Math Gtade l Out-State 33 S. Scattergrat, P.E4L-Sbien, Comp. vs.engl. Grades 34 9, Scattergram, COmp. vs. Math Grades Scattelgram, P. E.L. Math,vs.- Math Grades,- In-State 36
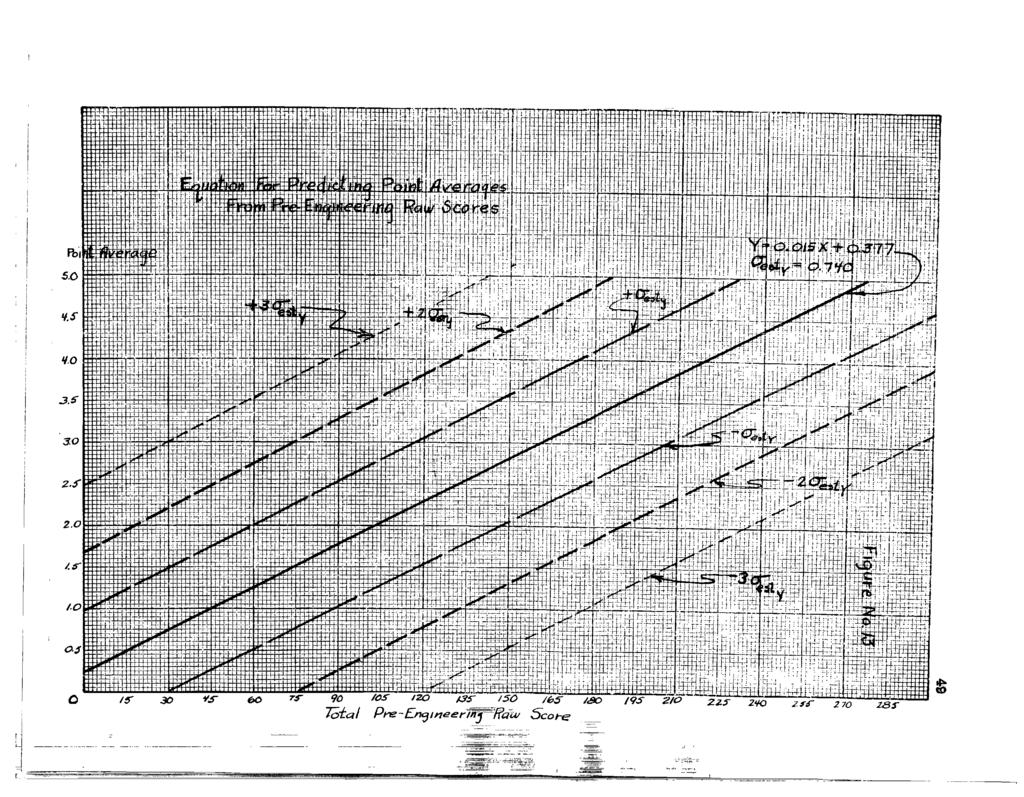
6 vi TABLE OF FIGUBES FIGURE NO. 1. Distribution of Total P.E.I. SOOIGS PAGE Distribution of the Total A.C.E. Scores Distribution of the Grade.Point Avgs. 39, 4. Skewness Test of Grade-Point Avgs Distribution of PX.I. Math. Scores (Total) Distribution of LLI. Math. Stores (ln-state ) Distribution of P.LI. Math. Scores. ((Oat-State) Distribution of P.Li, Scien. Compr. Scores Distribution of math. 101 Grades (Total) Distribution of Math. 101 Grades (In-Statsl, Distribution of Math Grades (Out-State) Distribution of English 101 Grades (Totall Equation for P±edioting Pt. Avgs. from Totals Equation for Predicting Pt. Avgs. from A.C.E. Totals 50
7 INDEX OF CALCULATIONS. PAGE` Distribution of Total P.E.I. Scores 51 Distribution of Total A.C.E. Scores 52 Distribution of P.E.I. Math Scores (Total), 53 Distribution of P.E.I, Math Scores (In-State) 54 Distribution of P.E.I. Math. Scores (Out-State) 55 Distribution of P.E.I. Scion. Compr. Scores, 56 Total P.E.I. Scores vs. Point Averages 57 Total A.O.E. Scores vs. Point Averages 59 Total A.C.E. Scores vs. Math. 101 Grades 61 Total A.C.E. Scores vs. English 101 Grades 63 Total P.E.I, Math. Scores vs.. Math. 101 Grades 65 In-State P.E.I. Math. Scores vs. Math Grades 67 Out-State P,E.I, Math, Scores vs. Math. 101 Grades, 69 P.E.I. Scion. Compr. Scores vs. English 101 Giades 71 P.E.I. Scion,. Compr. Scores vs. Math, 101. Grades, 73,
8 TM VALUE OF PRE-ENGINEERING TESTS IN PREDICTING FRESHMAN SCHOLASTIC SUCCESS fl AN ENGINEERING CURRICULUM THE PROBLEMS, DEFINITIONS, AND STATISTICS' This study was undertaken to determine the relationship or lack of relationship between the scores attained on the psychological tests administered to the freshman class of September 1947 prior to admittance, and the scholastic success of this group during their first quarter of freshman work in the engineering curriculum at the Georgia School of Technology..Such relationship as was found, was examined to determine whether it was of sufficient signifieance to justify the prediction of scholastic success from the scores attained on these psychological tests. The battery of psychological tests which were administered to this group of students under study consisted of: (I) The American Council on Education Psychological Examination. (2) The Pre-Engineering Inventory. (3) The Silent Reading Comprehension Test. (Van Wagenen-Part I.) (4) The English Placement Test. (Georgia Tech's own.) (5) The Study Habits Inventory. (Wrenn.) The American Council on Education Psychological Examination and the Pre- Engineering Inventory were selected from this battery of five tests for investigation. These tests were selected because the limitations of this study would not allow the investigation of all the tests administered, and of the five, the A.C.E. and the P.E.I. were thought to be the most important and comprehensive. The American Council on Education Psychological Examination is
9 Composed of the following six sections:: (1) Arithmetic (2) Linguistic Completion (3) Figure. Analogy' Same andqpposite word COmparison (5) NUmber Series (6) Verbal Analogy In contrast to the Pre-Engineering Inventory Tests, which was designed to measure specific aptitudes and achievement, The American Council on Education Psychological Examination is primarily an instrument to measure the general level of intelligence of the individual. The Pre-Engineering Inventory is a series of tests developed jointly by the Engineers Council for Professional Development of the American SOciety for Engineering Education, and The Carnegie Foundation for the Advancement of Teaching. This series of tests was primarily designed to measure aptitjaes and achievement and to aid in the selection and guidance of engineering students. As outlined in the prospectus of the Pre-Engineering Inventory, issued by The Carnegie Foundation for the Advancement of Teaching, the Pre-Engineering Inventory Tests are thus described: - These tests measure important components of your general scholastic ability; your knowledge of word meanings; your ability to read scientific materials accurately and carefully; your comprehension of what you have read; your ability to interpret graphs, charts, tables, and figures;; your ability to relate what you read to your previous training in science and mathematics; your ability to deal with quantitative concepts of a practical and abstract nature; your ability to comprehend and apply physioal principles and solve problems involving mechanical principles; and your ability to visualize form and detail from plan figures. Success in college can be measured by two possible criteria. Freeman, as reported by Segel, indicated that the best criterion of
10 success,in college was survival. 1 Segel, however, believed that there was not sufficient evidence to warrant changing the criterion of college success from scholarship in college level work to the length of time the student is able to maintain his residence. He argued that a student might develop lazy habits rather than those of scholastic diligence; that unpredictable factors not all connected with scholastic aptitude might terminate a student's residence; and thirdly, the correlation between mental tests and survival have been less than that between such tests and scholarship. Segel reports that Edgerton and Toops have found that the correlation between the Ohio Psychological Examination, using percentiles, and the point-hour-ratio of marks averages 0.45; the correlation between persistence in college and the Ohio test was only Accordingly, the measures of college success in_this study are the marks obtained in individual courses taken during the first quarter work of the freshman year, and the overall grade-point average achieved for all subjects taken during the same period. English and Mathematics were selected as most representative of the courses contained in the freshman curriculum. The grading system at the Georgia School of Teohnology at the time this study was made, consisted of six classifications: :. AA-Superla, A,Excellent, B-Good, 0-Passing, 70,Barely Passing, and F=Pailing. For purposes of determining the grade-point average for the entire number of courses taken the above letter grades are assigned the 1Segel, David, Prediction of Saccess in College, (U.S. Dept. of the Interior, Office orrauca ion, e in 9 o. 15). pp Ibid, p. 7.
11 following values AA-5, Ate, G..2, D-1, and P The numerical grade pointaverage is determined by multiplying the numerical equivilant of the letter grade attained in a course by, the number of credit hours which that course contributes towards a degree; and dividing the'sam of. these products for all courses taken by the total number of credit hours taken. Thus, the possible range of the grade-point is from.00 to The population under consideration in this study consisted of 979 students in the first quarter freshman year of the Engineering curriculum at the Georgia School of Technology. Of this number 51 percent were registered as Georgia residents and 49 percent were registered as Outof-State students. Approximately 70 percent of the population were nonveterans, and approximately 30 percent were veterans. Of the 979 students which comprised the population a maximum of 4.5 percent of the scores were rejected as incomplete and were not included in the calculations. Thus, the minimum population in any of the distribution; except where the population was divided into in-state and out-state students, contained 935 subjects. The distribution of the in-state group contained 454 students, and the out-state group contained 471 students. In order to achieve a measure of uniformity, and lessen the chance of confusion, the symbols and fortulae as outlined by Garrett have been 4Tor the purpose of this'stady the letter grades were assigned the followingmumerioal values:: AA,13,, A,54 E-4, 04, D-2, F-1., Thus a Mean of 2.70, where letter grades are being used,.would be interpreted as a high D. (1.70.)
12 followed throughout. 4 The arithmetic mean, M, is defined as the sum of the separate scores Or other measures divided by their numbers. 5 The mean in these calculations was determined for grouped data by the formula: M= AM -frci. AM is the mid-point of the class interval in which the mean is assumed to be. The score correction, ci, is equal to the algebraic sum of the deviations of the class intervals from the assumed mean, divided by the number of the population: and this fraction multiplied by the size of the class interval. The standard error of the mean, Oil, was determined by the formula: cy- CT being the standard deviation of the population and N, the number of scores in the population. The calculated mean, plus or minus two standard errors of the mean, should contain the true mean of the population 58 times out of a The standard deviation is defined as the root-mean-sauare of the deviation from the arithmetic mean'. 7 It is determined for grouped data by the formula:: V " L - 4Garrett, Henry L., Statistics, in Psycholo y and Education. (Long.,- mans, GXeen and CO., N. Y., 316 Ed., 1947). 6Garrett, Henry E., Ibid., p All results, of equations used in this study are stated plus or minus two standard. errors thus taking in 98 probablecases out of a Arkin, Herbert, and Colton, Raymond, An Outline of Statistical Methods, (Barnes and Noble, N. Y., 4th Ed T
13 in which Cfdris the sum of the product of the frequencies in the class intervals times the square of the intervals from the assumed mean. The standard deviation is less affected by samplging errors than is the mean deviation or the quartile deviation and is the measure of variability customarily employed in research. 8 The standard error of the standard deviation for grouped data is calculated by the formula:: C7- V 261/-0 thus, the true standard deviation will 98 times out of a 100 lie within the limits of the. computed standard:deviations plus or minus two standard errors of the standard deviation. The relationship, ottore accurately the association, between statistical series may be established and measured by means of the co- efficient of correlation. 9 When the relationship between two sets of measures is linear, the correlation may be expressed by the uproductmomentft coefficient of correlation. Perfect relationship is expressed by a coefficient of 1.00 and a complete lack of relationship is indicated by a coefficient of.00. Thus, if a correlation lies within the limits of.00 to 1:00 there is implied some degree of positive association;: the degree of association depending upon the size of the coefficient. When a negative, or inverse, association is perfect the coefficient is equal to (-) Garrett, Henry E., op. cit., p Arkin, op. cit., p. 74.
14 The calculation of the coefficient of correlation by the "produ moment" method was used in the calculations of this study. The formulah for determining this coefficient is: (77/ in which the )(4/ is the: prouct deviation of the intervals from the assumed mean. The standard error of the coefficient of correlation was determined by the formula: Crt- A r V N The calculated coefficient of correlation, plus or minus two times this standard error would, 98 times out of a 100, include the true coefficient of correlation. The significance of the calculated coefficient of correlation was tested by the use of the null hypothesis. Assuming the population r to be zero, the method consists of comparing the t-value for the obtained r with the tla to be expected by chance at the %,05 and.01 limits. 10 The t-value for a given r is found by the formula: 1_ N- V 1 in which r is the calculated coefficient of correlation and N is the number of scores in the population, If the t-value for the calculated r is larger than the t-value expectei by chance at the.05 level, the coefficient of correlation is said to be significant. If the t-value for the calculated r is larger than the t to be expected by chance at the See Crarrett, op. cit., p. 190, Table 29, for value of t for the degrees of freedom at various levels of probability.
15 limit; the coefficient of correlation is said to be highly signifioant. Thus, if a t-value for the calculated r exceeds the t-value to be expected by chance at the.01 level, the null hypothesis is clearly disproven, chance between the two statis- and evidence of a relationship not due to - tioal series is said to exist. 11 Because the formulae used in the determination of the "product moment"` coefficient of linear correlation assumes a normal distribution of the data, it is necessary to test the statistical series which are being correlated for a measure of skewness. In the normal curve the mean, the median, and the mode all coincide and there is a perfect balance between the right and the left halves of the figure. A distribution is said to be skewed when the mean, the median, and the mode fall at different points in the distribution, and the balance is shifted to one side or the other. It is important to know whether the skewness which often occurs is a real divergence from the normal form, or whether the divergence is the result of chance auctuationsarising from chance causes and is not significant of a real discrepance. 12 The skewness, SK, is determined by the formula: - 5 k Pqo Pio psi) in which P90, P50, and P10 represent the 90th, 50th, and 10th percentiles. The percentiles are calculated by the formula:: iit llibid., p. 299, Table 49, in which the levels of significance for degrees of freedom, (N-2), is read directly in values of r. 12 Garrett, Henry E., op. cit, p. 119.
16 where p is the percentage of the distribution wanted, P. Ine lower limit of the class interval upon which Pp lies, plt the part of N to be counted off in order to reach P P, F the sum of all scores won intervals below I, fp the number of scores within the intervals upon which Pp falls, and i is the length of the class intervals. 13 The standard error of the measure of skewness is determined by means of the formula:: 0 K 0..5" I S- 5 0 V N in which D=Pso --Pio. By dividing the measure of skewness by the standard error of the measure of skewness, a t-value is obtained which, when compared with the t-value that can be expected due to chance, will determine whether the distribution is significantally skewed, or the skewness present is due to chance. The raw scores obtained by each student in the psychological tests considered in this study were recorded on a 3x5 card fox each individual student. On the same card the grades obtained by the individual in the courses ',taken= during his first quarter of freshman work were entered. His grade-point average was ale() entered on the card and an identifying mark was placed on the card classifying the student as either an in-state or out-state student. 13 Ibid., p. 78.
17 10 In order to collect the data in such a manner as to facilitate the statistical calculations a scattergram of the type illustrated in Tables 'Jo. 2 through 10 was devised. In this scattergram the class intervals containing the psychological tests scores were placed on the X, or horizontal axis, and the class intervals of the measure of scholastic success were placed on the Y, or vertical axis. The scattergram also contains the frequencies of the class intervals, (f), the prodact of class interval frequency and the squaxe of the class interval deviation from the assumai mean, (fd2 ), and the total of the class interval product-moments about the assumed mean Bixy). The cumulative frequencies, (of), for both the X and axes, are illustrated in Tables Nos. 2 arid 6 in the bottom and fax right columns.. From each individual card, the score obtained in the psychological tests and the degree of scholastic success attained, were entered in the proper class intervals on the scattergram. When the entire population had been entered the remaining columns of the scattergram were calculated and filled in. The totals, as contained in the boxes in the lower righthand corner of the scattergram, were then used in the statistical formulae.
18 ANALYSIS OF THE DISTRIBUTIONS' Figures Nos. 1, 2, and 8 indicate that the distribution of the psychological tests scores, with the- exception of the Pre-Engineering Inventory Mathematics distributions (total and out-state) adhere closely to the normal curve. The smoothed carve on Figures numbers 1, 2, 3, 5, 6, 7, 8, and 12 is the normal curve of the formula:: calculated and plotted around the arithmetic mean of the actual distribution. In the following table, the t-values,obtained for the calculated degree of skewness of each of the psychological test distributions is compared with the t-value that could be due to chance at the 0.5 level. Table No. 11 Comparison of Calculated t-values of Skewness With t-values Due to Chance at 0.05 Level Psy. Test Distributions t *0* P.E.1.2btal ;96 P,E.I.Math(Total)', 2.503** I.Math (In-State) P.E.I.Math (Out-State), 2.268** 1.97 A.C.E.Total F.E.I.Scien. Comp * See Garrett, op.cit., p. 190 Table 29. * * Indicates significant skewness. The t-value for skewness obtainei for the total raw score distributions of the A.C.E, tests and the F.B.I. tests were and res -oectively. This would indicate that the amount of skewness exhibited by these distributions is most probably due to chance and that the deviations from the normal are not significant. In the case of the distribu-
19 tion of the Scientific COmprehension (20e Figure No. 8) raw scores the t-value of the computed skewness for the distribution was found to be This is fax below the chance t-value of 1.96 and this distribution also exhibited a: igh degree of normality. In the distribution of the P.E.I. Mathematics total raw scores, (See Figure No. 51 the distribution sufficiently deviated from the normal to indicate that the exhibited skewness was not due to chance. Then the F.B.I. Mathematics total raw scores was broken down into two separate distributions, the one containing the raw scores of the in-state students (See Figure No. 6) and the other (See Figure No. 7) containing the raw scores of the aut=state students, it becomes apparent that the significant skewness exhibited by the distribution of the total scores of the F.B.I. Mathematics is being caused by the significant skewness of the out-state distribution and lack of significant skewness of the in-state distribution; The t-value of the calculated skewness of the P.E.I. Mathematics distribution for in-state students is This t_ value, being fax below the t-value of chance, indicates a high degree of normality and lack of significant skewness. The distribution of the Mathematics scores for out-state students has a t-value of calculated skewness of 2.27, which would indicate a significant amount of skewness. The difference in the normality between the in-state and out-state distributions would seem to indicate that there is a selection factor or process operating against the out-state students between their high school level and their matriculation at. the Georgia School of Technology. The mean for the distribution of the F.B.I. Mathematics tests snores for the out-state students is , while the mean for the distribution of the
20 in-state students is ? 4 This would seem to indicate that the ecteetingprocess is eliminating from the out-state population the individuals who would ordinarily be in the lower score intervals. The high degree of normality exhibited by the instate students indicate that there is probably no selection factor operating to eliminate or screen out the lower level students between the high school and college level. Concerning the measures of scholastic success used in this study, only the grade-point average distribution exhibited sufficient normality to give a reliable coefficient of correlation, It can be observed from Figure No. 3 that the distribution of the grade-point averages compares exceptionally well with a normal curve fitted about the mean of the distribution. Then the frequencies of the class intervals are plotted as percentages of the total population (N) on a logarithmetic-probability graph, as illustrated in Figure No. 4, it can be seen that the distribution of the grade-point averages is very nearly normal. On this type of chart the plotted frequency percentages will form a straight line if the distribution is normal, and as the distribution deviates from the normal, the plotted percentages will tend to arrange themselves in the form of an aurve. The distribution of the Mathematics 101 grades total, as shown on Figure No. 9, indicates by inspection a high degree of deviation from the normal.. In the case of the in-state students, Figure No. 10, the distri-- 14 If the difference between the: of the samples is more than 3 times the standard errors c&tii6 me4n, the difference is said to be statistically significant.. In thi,e case the difference between the means was 4.79: times the standard erroi.
21 bution of the grades can in no way be reconciled with a normal curve. The distribution of the Mathematics 101 grades for the out-state students, Figure No. 11, seems to exhibit a lesser degree of deviation from the normal distribution, but the deviation in these cases is sufficient to warrant a lack of confidence in the calculated correlation coefficients between these distribution and those of the psychological tests. The distribution of the English 101 grades, in comparison to the Mathematics 101 grades, exhibit more normal characteristics, but there is sufficient deviation from a normal distribution to again warrant a lack of confidence in the significance of the obtained coefficient of correlation,
22 15 PREDICTION The prediction of success in a college curriculum has been attempted in previous' studies using many different measurements as predictors. Porter, investigating 638 students admitted to the freshman class in the College of Engineering at The Carnegie Institute of Technology, found the best preiic-- for of scholastic success throughout the entire college curriculum to be scholarship during the first quarter of the freshman year. He also found, that high school scholarship correlated higher with scholarship while in attendance at C.I.T. than performance on tests of general scholastic aptitude or achievement tests administered:upon admission.. 16 Pierson found, at the University of Utah, that the best single predictor of scholastic success in a college engineering curriculum was the 16 high school grade-point average. He stated, however, that although he found the high school grade-point ratio to be the best indicator of probable success in college courses in Engineering at the University of Utah, it was not comprehensive enough to be used as the only selective criterion. He further stated, that this index of general scholarship should be supported by scores made on a battery of achievement and intelligence tests, such as the Pre-Engineering Inventory, 17 and further by some measure of a studentte patterns of interest. ie ''''Porter, James 14 Jr. Me Predictionof College Success in an Engineexing.Ourriculum,"' The American Psycholbaist, Vol. 1, No. 7, (July 1946), p Pierson, George A., esehoel Marks and Engineering" Educational and PSychological Meaddrement, Vol. VII No. S, (Antumn-1947)], p Tha,Pre-Engineering Inventory referred. to by Pierson, Ibid., p.617, is the same'battery of psychological tests used in this study.
23 It is necessary, before attempting to determine what instrument should be used in prediction, to determine the purpose for which the prediction is to be used. A prediction of the probable scholastic sucoess of a student should be determined for one of two purposes. The first to screen out students who will not be able to successfully complete the requirements set by the institution for a degree; or secondly, if all students are to be admitted, to determine that portion of the applicants which will probably encounter the most difficulty and to prepare such students for work on the college level by extra attention or remedial cour se s. If the policy of a college is to allow entrance to a large number of students with the expectation that a fait number of them will fail, the predictive instrument need not be so highly predictive. However, if the aim of the college is to pick out only successful candidates to start with, the finest predictive instrument for measuring aptitude available would probably not be entirely adequate. /8 It has not, nor will it probably be in the near future, the policy of the Georgia School. of Technology to attempt to pick out only those students for admission who will be, almost to a certainty, successful in the engineering curriculum. In fact, the entrance requirements at the Georgia School of Technology, at present, requires that a student must be graduated from a properly accredited high school with a record high enough to indicate that he is prepared for college work and to have taken subjects 19 in high school sufficient to satisfy the required units. 18 Segel l David, op. cit., p Bulletin of The Georgia School of Technology, ( ), p. 46.
24 l'7 The vast difference in the quality of the high schools within the state of Georgia is probably great enough to cast serious doubt upon the use of high school references as a predictive instrument. The difference in high school teaching methods and marking methods would, in itself, make the possible error in an attempt to predict college scholastic success so large that the attempt would likely be more or less futile. At this point it is interesting to note that Pierson found the first quarter college total grade-point average was much - more efficient in predicting future success in Engineering than the marks earned in individual subjects. 2C) Porter also found that the scholarship shown during the first semester of the freshman year at the Carnegie Institute of Technology to be the best single index of 'achievement during the student's period of attendance. 21 It would, therefore, be of great value if the population of this study was followed through the entire period of residence at the Georgia School of Technology to determine if the scholarship shown during the the first quarter of the freshman year at,zeorgia School of Technology is, as indicated by the other studies, the best single predictive instrument. This study has been limited to the determination of which of the two psychological tests, the A.C.E. and the best measures the probability of success during the first quarter at the Georgia. School of Technology. The Pre-Engineering Inventory battery was broken into separate tests scores and the predictive value of the mathematics and the scientific comprehension parts was separately determined. 20 Pierson, George A., op. cit., pp Porter, James M. Jr., op. cit., p. 278.
25 The method used for determining scholastic success from a score attained on a psychological 'beet was a regreedion equation of a linear fort. The methods for determining the linear regression equation, as 22, outlined by Garrett, were followed. The score-form regression equation as outlined by Garrett is Y - r 0- m In this equation, Y is the dependent variable which is o be predicted from ah independent variable X.. Applying this equation to the present problem X becomes the raw score obtained on the psychological tests and Y the probable success of the student within the limits of the standard error of estimate, The coefficient of correlation, r, in the above equation is that measure of relationship found to exist between the psychological test scores and the measurement of scholastic success of the group under study. The ai ls the standard deviation of the measure of scholastic success, and ce;c is the standard deviation of the distribution of the psychological test scores. Nixie the: arithmetic mean of the scores made on the psychological tests and Inis the arithmetic mean of the measure of scholastic success.. The standard error of estimate is determined by the equation: : Sty= CT; V I I -2- In this,iormula,crix is again the standard deviation of the distribution of the measures of scholastic success. 22 Garrett, Henry 4., op, cit., p. 310.
26 19 The standard error of estimate is calculated in order to indicate the accuracy with which we are able to predict a dependent Y from an independent X. Y, plus or minus one standard error of estimate, indicates that in 84 chances aat of 100 the dependent variable will fail within these limits. With Y, plus or minus two standard errors of estimate, the chances are 98 times out of a 100 that the dependent variable will actually be within these limits, and if three standard errors of estimate are used 23 the dependent variable will fall within the limits, for practical uses, to a certainty. On Figures Nos. 13 and 14, the lines of regression have been drawn in and the limits of one, two, and three standard errors of estimate have been added as indicated by broken lines. It will be noted from the formula 24 for the standard error of estimate, that wx approached zero the standard error of estimate increases so markedly that predictions from the regression equation range all the way from almost a certainty to what is virtually a guess. The significance of an r with respect to predictive value may be accurately guaged by the extent to which r improves our prediction over a mare guess. Thus, when r =.00 our estimate of a person's. Y score is not aided at all by a knowledge of hid X score. When r = 1.00 the standard error of esti-, 25 mate is zero and the Prediction of Y from X' becomes almost a certainty, Assuming the Measure of success to be predicted as being the grade- Point average to be expected during the first quarter of freshman college 23 The chances, axe out of a 100 at three standard error of estimates. 24 of. ante, p. 25 Garrett, Henry E., op. cit., p. 321.
27 20 work, the regression equation fez predicting the dependent variable from the total raw score made on the A.C.E. Nychological EXaminations was found to be: 0. zo X 0. 2: 417 The standard error of estimate, when r = 0.456, and the standard deviation equals , was found to be 0).865. This equation is illustrated in Figure No. 14, It will be noted from this figure that the slope of the regression line and the large standard error of estimate creates a serious doubt concerning the predictive value of the A.C.E. total raw scores in determining a studentl's probable point average. As an example; if a slightly above average student were to attain a score of 112 on the A.C.E, tests it could be expected 98 times out of a 100 that he would make a grade-point average of between 0;263 and If the problem of general prediction is considered the lower limit would, for all practical purposes, indicate no chance of success while the upper limit would indicate that it is possible that this student would be in the upper ten percent of his olass. It also is impossible to predict a probable grade-point average above The regression equation for predicting scholastic success las indicated by the grade-point averages i from the raw scores attained on the P.E.I. tests was determined and illustrated as shorn in Figure No. 13. In this case the dependent variable X can be predicted from the equation::.o.0 X + 0:377 The standard error of estimate was found to be '0.740, and I is 0.646; Figure No. 13 clearly indicates the superior predictive quality of this
28 equation over the equation illustrated'in Figure No. 14. The standard error'of estimate is smaller and the slope of the regression lineis more within the range of the grade-point average ordinate. Three examples of students scoring in the lower, middle, and upper range of the P.E.I. Tests are to be discussed and their positions illustrated. As an example, let us assume that a student falling in the lower fourth of the test range (See Figure No. 14) scored 75 on the P.E.I. test. This student will most probably earn a grade-point average of This represents'the best guess on the basis of the average performance of the group of students in this study. It can also be said that his grade-point average will not, 84 times out of a 100 exceed 2.24 nor be less than It is, for practical purposes, a certainty that his grade-point average will not exceed The student who makes a middle range score of 150 on the P.E.I. test will most probably complete his first quarter with a grade-point average of The chances are 84 times out of a 100 that his gradepoint average will not be less than 2.06 nor greater than It is certain that this student will not make a grade-paint average of less than If a student earns a total raw score of 225, placing him in the high range of the test, he will most probably make a first-quarter grade point average of and the chances are 84 times out of a The average score on the is
29 that he will not make less than 3.36 nor more than 4,; -84. It is certain that he will not make a grade-point average of less than The remaining regression equations, as illustrated in Table No, 1, were not farther investigated because of the size of their standard error of estimates.
30 23 CONCLUSIONS., The results of this study would seem to indicate that the Pre- Engineering Inventory total raw scores furnish the best tool, of those investigated, in predicting scholastic success in the first quarter of freshman work of the Georgia School of Technology. The American Council on Education Psychological Examination scores would seem to be a second best predictor of scholastic success. The A.C.E, test, due to a relatively low coefficient of correlation and a consequently large standard error of estimate, is less useful than the P.E.I. test for the purpose of this study. The evidence presented by this study would seem to indicate that the Pre-Engineering Inventory test is the best single predictor of probable scholastic success in terms of grade-point averages, of those investigated. The line of regression (Figure No. 14) extends throughout the entire range of possible' grade-point averages. Thus, all of the predicted probable grade-point averages will be within the artificial limits,z0 to 5.00, of the grade-point system. The standard error of estimate of the P.E.I. test in predicting grade-point averages is the smallest, 0.740, of all of the combinations investigated. The amount of expected deviation of the actual gradepoint average from the predicted, is therefore less and the chances of accuracy increase..pa It is obvious that neither of the psychological tests investigated in this study will predict, with any reasonable certainty, absolute scholastic success. However, on the basis of the evidence presented by
31 this study it is felt that the Pre-Engineering Inventory raw soores,could be used to determine that portion of the entering freshman whose lack of either aptitude or preparation would warrant giving such students Special attention. If it were decided, for instance, that all students who attain a raw score of less than 75 on the Pre-Engineering Inventory, should be given non-.credit remedial courses, it is possible that the chance of these students failing out of school might be considerably reduced. The Pre-Engineering Inventory Tests measures both aptitude and achievement. It is possible that the large standard error of estimate of prediction is due to a significant difference between the pre-college training of the individual students. If a portion of the students have had an intensive four year technical high school training it is possible that they would make a relatively high score on the Pre-Engineering Inventory Tests, due to their achievement, and not necessarily due to a high natural aptitude or rate of learning. These students with a high achievement but a low aptitude would probably show up well in the Pre- Engineering Inventory scores, but could 'de poorly in the actual college level work. Conversely, a student with a general high school eaucation, and possibly only a three year period of high school training l night show up very poorly in the Pre-Engineering Inventory scores due to a low achievement, and yet, due to a high natural aptitude be successful in the college level work. Therefore, if the population under study were to be broken down into independent homogenous groups on the basis' of pre-college training, it is probable that a predictive value for the Pre-Engineering Inventory test would be of much greater significance. This refinement, however,
32 25 was beyond the scope of this study. In summary, this study offers evidence that : (1) There is a statistically reliable difference between the in-state and out-state student scores on the Pre- Engineering,,Mathematics test; the oat-state students earning the higher mean. score, (2). Of the measures used, the Pre-Engineering Inventory total raw snores. appears to be the best single indicator of probable. scholastic success in the first quarter of the freshman year, (3 ) The PrO4ngineeting Inventory total raw scores. are not sufficiently reliable.to be used as a single method, of prediction for the purpose of screening applicants. (41 These tests may be used as eandands, for' singling out the following groups students:: (0 Those who may ;squire extra attention or remedial non-credit courses to improve their scholastic average. (b) Those who could most probably profit from enriched' courses taught at a higher level. (5) It appears from the normality of the overall grade-point' average, that this measure might prove to be the best predictor of future success in subsequent quarters.
33 BIBLIOGRAPHY.Akin, Herb ert, and Colton, Rymond,:i vtline of,statistical Methods (;Barnes and Noble, N. 1., 4th.12: Fisher ) A. A., Statistical MethOdstor Research Workers, (Oliver and Boyd, London, 10th Ed., Retisad, 1946). (iwett, Henry E., Statistics tn P'S, cholo!y and EduCation, (Long- Mans, Green and Co. : N, Y., 3rd Ed., 1947)). 'Pierson, qe9r,ge A., "School Marks and Engineering'', Educational liallea2210,2292; Measurement, Vol. VII, No. 3, (AUtumn 1917Ypp POrter, - James M. rthe Prediction of CollegeAi4ess in an Engineering Curriculum,* The Ameristspjm21?koAsI4 Vol. 1., No. 7, (July 1946),
34 Table No. 1 M I( cr Cru 7 Zr Re1res yual /. /06 IsOS t-.o%2 gy t / Lto_ovv 0.64/ e 0.77 y= o 0/ /C 2. 25'.7/7 1'/.265/ _t 0./2V /- SS- 0 ± o.s'qy / o.or7 0.6/7 1' Y= X 0, 73V /.070 a 31.67V ±./. 2CC 2. Carta/26 /3.070 to P t 0.0f0 0.$%7 r0.0 6 Fr Y= o osv x 0 9/.3- /./ /7S -t /3-.570:r f o,57/ _ro.ovy i: loe.fsv-t Vi EP ' : f. 0/0 /.370 ± r.6..05i 0. 65" X k/,1 /12/ O / A a 99 9 /,290 to. / /../3y 2.975/! / / /.20k /R- f 0. * 7. i09,00s4 vzr / e2 1-/-0/o et o.0 4P1 o. '1.r6 1' o S. 39: /./0.1r t /6. 96Z to-77? - / / a. 5-// ± " 3r. s",s-f 1 /08, 2.5V..f 0.08r /7.0/ eVy /3.5".7-2! a.062- O.,-/za V Sf 0.,a3x vg 1.10/ X - 0, a y o. 3" 7 )1 - o ,Fso 0- y- o. U33X /.2ze 1. P.E.I. Total Against Grade-Point Averages 2. P.E.I. Math Against Math 101 Grades (In-State) 3. P.E.I. Math Against Math 101 Grades (Out-State) 4. P.E.I. Math Against Math 101 Grades (Total) 5. A.C.E. Total Against Math 101 Grades 6. Lea. Total Against English 101 Grades 7. A.C.E. Total Against Grade-Point Averages 8. P.E.I. Scientific Comprehension Against Faglish 101 Grades 9. P.E.I. Scientific Comprehension Against Math 101 Grades * The Mean for this population, as calculated by the University of Chioage (3/31/48), was ; the mean for a population of 34,658 on the same test was and the standard deviation (o) was 25.15
35 Scatterirom Table Na. Z. ys / o S6-67 o est- 79 O z-/a3 ior-fis /16-,27 /2e-oy /5-2463/0-/ts /76 -/17 niv /v? 200-2// O O U / / S" c) 0 z.16 cl `1 / y '7' { ki f /6,/ /or 966 y.a V/ 0 0 Q / / 0 2- / 3 'C 3 2- / O O / /7/ , V O / Z / 0 3 s- /2- (-/ 6 3 c) 6 O q /ky Ily 94/ y 0 0 / / 2 / 3 3 /2- /r /2-8' 7,-5" 2 Ci / 2 0 / 72r 7r Loy kill 25, z.g. p /0 15-_ t? / // // 26 to-i.y 5" /2 / /4I / /1 2 / /4/ /( 6 / / / O 0 /i1f z 2-2g z? 7 6 t5- / 0 0 o 176 -/ 25' 2/ 22-2 /2- // / / O a C7 ils z/ 2_2- / / 2-0 CD 0 C7 co 0 mg kly -Ix /76 -II a7( ,/ oil, /16y /4 9 /5- /3 /L // / / 0 p C:, 99 --V -3% /5-1), as'y /52- ao.y g- /5" / / O O O 0 CD C) 0 0 s, - - zds/ 5- /0 /0 CS TX q 69 g'r 97 fl?- 9/ /oo k- 7 7z_ Vz_ 4' 1, 25- As - 3 z_ / 966 S7 q666 d X fd s -16/ /72.7 /796 /600 //O / / 2-3 9/ i 6 7 > y /0 // -Mg - 2g 0 /00 /741 2/6 /bi- 220 /3-0 / // "8 Ye 0 /00 3Y / S 576 z5/ Ail /20 41r 73 I - / o go 3 fro /r /1Y - 78" //0 /3". / Lig 116,66 1)( Pf 6/5- Cfx 23 5.? 23 / 9 Z- 2ffo 377 Y7S Fzs / 936 9s-/ y c, 96S 566 Total Pre-Engineering Row Scores 13clinst Point Averages
36 5calterq rani 72161e /1/0-65" Z '77 7k ,6-A5 An -A" /0 11-1/3 /151- /pr ao yos-/z4-...r/ ire /17 /97 /se II d -CN as a / / a / / 7 - z 9 g S y zar V/6 ac/ 8 / / /,5" If 2 Z./ 9 z.c/ O 23 /7 /2 / 2 /? 2/9 // /3 3z W Ys. 41/ z, /2- /0 /z- / C) 0 0 I) 2- /'7 /0 z q /7 /.5- /7 /3 e 2- / / O hr6 -/ ? F 45- /3 A /0 /7 /1 // /2- '? ' / 0 / ? 536 / , z- 76 / tl" zi I-2v /34.6 /63$4 dx _ / g- 9 /0-6,d1 /45 --/Off / r0 Y,66" 2 yy Yzo 32V $ 1/ /Yy y 927 /sic, zip() 2o s-f- 2s60 2 2?9,6 2704) /9F1/ < /3 2- Are' 5D e o /5" > 2 SO 2"7 220 /6sy To al ACE Wow Scores alai En/115h 01 6r-acles
37 Scatter rom Ta b le!d. 1/ / g54-8y /0/ /02-10/0i--113 // 1/ -II? /20-/1.5" 2,6-/3/ /32- /37 /3k-isq /Y1/-/V9 /Z -11 J 1 fleli flci:1- fx9 API' 7 o 0 / / / s" g 7 26/ 3-ic A 0 0 / / / s- 2.- /0 7 r s / G/ Sl / / 3 / 7 /3-1g /`7 /7-7 (S-,./ / VO /510 /C.1 5:36 C / /7 3y /7 24 /9 // /0 9 6, 22_ y D 2_ 7 6 zo z.6 /6 /ef. 29 2_2- /2 9 //,5" y / - z z a /F /q z/ 2- V c." /7 / 2- S 6" L _ sy.,iy /on' ft V 2-3 y /D6 9 Y1 951 eft Z 6'/ J1, S z 1 0 / z 3 "/ s /0 9.so /963 t/7 fxj), -/of /2-b S /SI/ 3/F ve Le 3zy 2S0 25-y7 C.c1 2-2,5- Y3Z 37 > /5-6 ' / /6 20Sr z6zy 29J6 052:15, /9,73 Lki /6s 92- /y1/ YO / --//y -go --/gr -//.. " 30 yl 2z_ /3.5-28'D 7ff- Tobi Wow Score igotrisl Mothemdics /01 arades
38 Q 5cattergram Table Aii) 5,s-y /o-14, ,/ 3.5:,-rq YO- VS4 i'd - 4`?,51) <5.--sil /5 / / Lib? 70 - i,) Citi Tii cii ilci.;- /1( 1 cf i ii A 1 o o 0 / / C / ---<- 2_ 3 - f `I (7 / 2S 3 X f4 25-Z WC, 9,5"6" A B o o o / 0 Z / g / " /O / y?, i- y 7 2- o, -, 0, --- /j 2- zyy _5-23- /$ / VO / /yo, 1,c.) 3s- k-66 C 0 D / 2 // // '' if V6 zl Jr 27 /1 F.F" '/ Y 0 U / / / I 0 0 1/6 -/ -2/6 z/6 394" W7 F /3 fx / 1/ cl Ik -7 -f;f SC g6 '/3 /0 3V 6Y /0 2- / 1 / /Y6 1/ ef, - yes- -.Zs - 29z -/ -1/ /32_ r5-67 3SI 26 /? 2 y 0 / 2_ g / / 0 CD 28/ lak-/ I/ /off z I - V /976-1,4 686 /2-zy /700 /632- /oi, SYY /17 0 es- 20i 306 "//6 5'Z5-7Z /96 xt-i /51 cf 3'z 9.5" SW 363 2/1-./..s" V6 7,5- /ocy /Z5 //6 2/1' 339 Y.ex- Gd kl (P70 gay 930 9Y 9s/ Total PE.I. Mathematics Maihernahcs c
39 I/ S / 0 7Z e ? o c, C) f.o-vf u 0 / 0 0 / / / / / 0 / COttercirCiirl Tc,61e. N. 6 ye-/o/»y-ul izo-ar /-0 -/Y3 riey-/yf / d ftictfl X c- ) c ) 0 / o/ / s/ ii /6 6f ii'y / 0 / Y, $ / / /71 /9s" i Arg 32 Z 77 / / "' ly.2 // /6--i1 r, / 0. i y / ' /33 // ::363 //2. 03: /21 //:97 72; 12//e? -3/ i 1 2/27 :v 2' ::: /2- //1/3077 I? /1;;) 1:2_ 2- /27/0 - L. 04; //1/1:639:/ 11 C7 :1 S 13:119:://10:942:726 :0,7 9:v -3 Of-oy 7 '7 /0 // f 4/ 300,V? 3 V 3 / 0 / O / C 5-1/ -270 /35-0 7/0 f ' Sr 6 d), S 5-7r /o6 9S r /s y/ 36 2,F-- -1 d / a-19 s- 6 7 s -/f(f-0 J BIZ 20 77,4 --/12-- /62-2/0 -/52- -/ly - /-re -7,5-0 fxcl,(2- / /050 40ii ( 95" 0 /06 / / / /269 /o7s- /v76 /764 / ,5-27 GO2_ 5'02_ 395" v /Jo =27z /6 5,1 --// /V Lou cf,, 26,S3 9.s /33 /9/ "5" y,x Y 73/,/O ecs NSF %'o 95e Taal A.C.E. Raw Scores ATinst PoinE. Averages
40 s-q /0-19 /s--/q zo i/ 5CattergraM Table No.7 25=2? 30-3V yo-v# Vs--0? -512-SY 5:5"-SF 60 -oy / o 0 fy 6111 flid, fitly fxli /t 3 1/2- /zc / A /.2_ z 6 a 3 Z / 2_ G1- /36 /yz_ 4(57 a 0 oo / 3 9 ig /3 y C / 7/ /D Y " /3 /9 22-2/ /6 5- G /2 Y 0 a 0 35' / /7 /q q /v 6 5- y O / 0 0 /00 -/ -700 /00 7/ 2-2-F Z 7 / / 6 /3 3 / VYV /28- fs ft Y2-- 3/ 23 /6 /.2 U / /77/ 1 --/751fli5 8' / 3 -z -/ 0 / 2-3 L/ k --/i - VS -/soi - /50 -/ sell 93 9z fi 7 0 &D o? 4)(42-7Z '/ ) _ /6s- 27y 36e Vac 36c, 0 65/ 32.2C zy >O /51Y /13 /-7Y Ve a -2- / e 0 ' 1,Y0 eflt 2_ 1/ 31" /5-3 z2-3 z% 3'V s.ft. 92/ YYY Y60 wo ' 7/ Out of Sicite Students PEI Mufhehiatics Scare acioinst Naihematics 101 Crudes
41 5catterg raw Table No. 8 (-) // /2-17 a :SS 36 - W SY-Sy b- 7/ 7Z cr - - trj LI (1-1 RR G 0 / 0 o 0 fi / 0 B / z,5"-- c / '2- /9 zsi 141 gi' CD 0. y //. 2- II 2_ 2 ( Jo 2: 4-1 / z / L., - T yy 2-3 / / C) / Sil 2 /08 z/6 z Zzz- 3y /% /3 25-3o 3/ 31 /3 /2 k- / /bb' z/30 F 6 /S 2 b z 6 ie /3 6 / o 0 / Y 3-2S7 'co 3/ 67 8o 1/1 /17 1/7 /23 I/O 7/ /7 // 2_ 9,./o //63 /6/Z y -3 -z -/ (7) / Z ae ', -// /3z_ k6 66 / Yi6 /BO /y15 - /24-0 9Y? 416f /17 0 Po 2sy oy sze y ye ij Y6 228' 215 2er IL!/ 6y /z /2-3 /2? 5-0 SY 28 /6/2-5/5- /02- /8"2-- Z93 %'O,S ej/ e77 9/0 92f 93k 990 P E.I. Scientific Comprehension A gainst English 101 grades
42 MI Sca t te rqra rn r#0.9 a - d & Ii - 17 if-z Z - `7`1 5 2, -- V 7 ca-- S-35Y -51 6O / ,f--zy cy v -r-,,, d, -1 i d, c.41.,,,, / Cm 2 z / 2.5"-- b / 3 / / 2v3 /6r I) B 0 / S" 7 // /2. /6 // 2 I/ 25 s / 2- / / / 58' 2-// /3$- /7 /y 5- I/ 3 a /Vs / /6/3 /Y3 /> C _ 2_ /y ,/ 2? ? 7 3, C D 0 Ay y 7 3 / Z_Z 3.0 F /1 in zq 3/ 33 ZO // 3 o / / S Z- /ay / //3 //5- // 7 /26 /07 7/ /7 // 7 9`/P - V31 I )931 /952- ds - 7 -C _ - 1 o / Z jd1. -?r Y /7 `13/ 6,r6 /fry- is-do /32,. /0/7 4/ OCI /ZY:f :: /2- Y1:- / b /2,1 2/6..yro 367- zrs /yr l o /z? //z_ 2D 7ff 3,5 /952- PE.I. 5cierifific Comprehension Plainst Mathematics races
43 O _ y 6... y to..4, J.,_ rii zo_ s j, Scat terei ram y-to.4, ctle Aio. /0 d ? W-y9 sip-sy fs"-sy 00-6S, 6.5"--b9 7o "Ci j Iticiti kid; 2 Xv (- fi fill o 0 o 0 0 / 2-2- '2- / / 'I 2- / 24 /53,ey R o a 0 o Z- / 1 2. r c., / 2 _ " /0 it /54 `;' / j /7 /z / C) 2 6 I y il Ys CO 2. if 6 /0 / f / / 3 3 2"" 2- C CI /495 k) C3 32 q 0 / 2-6- / 2-- zy C7 /7 1/ 2- / / C2 0 0 ig, -- / _ilc //6 /U // / / 22-4/ / / 0 0 / /2-,e;',S? /53 /2- Z6 / 52. s i/ 66 3 // /0 2_ A93/ /z95 clx -6 -S - c/ S- C 7 f-ada - V6V -// :6 60 Li Ig 2-4/ -3/ ,1(' 2 25/ 76 0 GO /72- ire /76 z fol /3r z/3 /0 6/ 0-45' Z1 72-2eS>VG /z y.3 C e /30 / 242., 324 3S-6 yz9 5'9.9 ' qgi 41-ky In 5tclie 5i1.4cients PE.I. PlOthenliAices Scores aq Hanle VildiG araci e s

44 NNENNENNONINENENENNINMEEMMOIMMI III! IMAM MU MEMNE. MO1 MM 51MMMUT'nell M NM ME 2JD EM IM MEMEMMEMM NE 11 hb MEMO M M.1 00 MEE E LI NUMMI' _MUM =ler UM ME so / Immo MEM MI i sus EINE r Inn mil UM Igli m MI rimii EN m IMP " : "UM IIIIIIIIII EMI ling. mom N I MPN. MS ME I 1 MN S //6 / Total P.E.1. Score II ME MN Mini _ MINNEN pip g I Ell mg domprapprponormo: il aginilkita _Ailliligiiiiiiiiiiiii III IL Ilaima II RI m IMO ILI ' id- 1JAH _t_i a_ -IF-1- Mill r WI :11 ISMER MEM "1 MEM MN MEM +MEM ME E C:: M LIM 1 M -I MEM ELME WENN, illiiii IIII EMI II prprauri, ilismilim...., r-- IL -1-,,, 1-' IIIIIIII II NE... mm PEMM.. MAME SE ] MIMIIIMIUMI NEMMENINN NEM...NEES MENEM =MUM /2 ZI 236

45 r -17-r771 11; tfr fib -r: T-ft_ 1 11 'L t', I IL; r ; L tit ' 1 11H ti 11 t i11 11_ ; -14 ;II 1111P, , ,1 ; t: 1;,1 i 'Hohilac;;,. 11-1_11:111 ;Holl it!wa y `; : 1 1-1t 1 ti ' , ; 1 ; L1 J1111E 1d 1H _1-1...; j; " ,Ert ; l ei 110 }; ; P; r j ; ' ' 1.-; 1 ; ; I-! 1.1k I.1j ;HI H:; 1 ;01 80 so " j 1_1+1 /38, 81 94, /02 /08 //Y /20 /26 /37 /5O /56 Total ii.c.e. Raw Sco res

46 IIIIIIIIIIIIImmlim V" MEM m Lill momm mg im um IIIIM 1 Num.TMUMVIMA Ent. W 220 M MEMO MIME MOM MOM 2,MEMEM MTh :I... C. iligemploal... MISIMMEMOMM MOMMEMMEMMEMM ME II!pop Empurps A', as II Aiiiiiiiiii III 1 'III.11 mu Ian II.... mill iii.. NIP. 11, MUT II... Ili:II.. EBB E WEE PAO ao 0 a i.0 El I ERN 1 ft -IA - ME COM 11h BIM O Point Averages MEM EM MEN' 1711MIIMM ftlim IIMEN rmil..bii 1 NM II... m..= mamma= rninommum r tim... ma mmou mumuumm om_ am m mm ommummumm IIMMEMMEMEM MO EMU SM ERI IIMMUMOMM as.. III : inio=m1:::: I guirmempiebb,lhaminunimen f0 IIIII... mum MU MA MS 50

47 40 0 O slairjamillfilltinoli inilleillanlinellalminlilljellnli Ir....m m seffilmielar 1""'ffars._ IIIIII IIIIIIIIIIIMMIIIIII IIIIIIIIIIIIIIIIIIIIIIIIIIII IIIIIIIIIIIIII ql, ,9L9,91, 'LI... LI RN... ImmIne MUM INIMMElinj5 IMBEIIIRIFOOM EMEMNIMMUM MOOM O MMMEMM UMO MMMMMMM moomm:222mmoin guram aun =ir...wreku MENNE Ulla MEN. aril NFU MUM NATI NNE mom sums...ns man Imo MEM Ta Mirardiiiiii OMEN NEM EMMEN hirulimmmlatiliiiiii...m...3. FA' mr MMMMMM... MMMMMMMM m":11p.mw." I dME IIIIIIIIIIIIIIIIIIIIIIIIIIIIIIIIIIIIIIIIIIIIIIIIIIIIIIIIIIIIIIIIIIIIIIIIiIIIIIIIIIIIIIIIIII b namminmmi MINNIE NIIII nl ENIII7 Amnion ME M M Ni IMOMMMIIIMOMIMMIIIMMUMM IS IIIIIIIMIIIIMOOOMMBEIRMIIIMMINMOOPISOM MONIMOIN OMOMMOMINNOMMOMMEMMOMMOOM NA WM MOMMINIMMOMMOMMOMMEIMMOOMMEIMMINIMMUNIMOMMEMMOOMMOMMOM MaiminsmommEMEMEMBOIMMEmsmimmom mummummummmum immilnismommommommunommemosimommormommeimmiiiiiiiiiimium MMMMMM MUNIMMOINNOMMEIMMUOMOIMMOOMMMEMEMMERIPAIIMOMMEMEMEMINEE 11= MMMMM =MN MUM WWEIIMMIIMMO IMMOMEMMEMEMMENNIMMUMMIMMOMOMMMIIMMOOMMMOMMMEMMIEEMNUMEMEMIO M ME OIUMINIMUMMEUMMEMIIM MM % MMMMMMMMMMMMMMMMMM IIMUNIIMUME IMMEMMUMMOUNOMMISMOIMMENEMONNUMMOMMEMEMMONNUM MUMMINUMMOI mommimmmellimmmommom... MMMMMMMMMM II M am...m.ammim...m....minommalimumm..." muman.. _.mmm...r.m....w... mm..ww.mmwmeimimmommilmmilimmimommmimm mmumimplamlinomms mmimmilmommimmiumm MmirAmilimminimmaimmmmummionnimmilimplemmmilmmm %. "71;a6,Z11111E6"ṙa ;;;;;;;;;; IIIINLIIMUM ATIIMMITI " Taa; ETA; Nan ;;;eemmomemmommmom MO rgra. MEER MEM MMOOMMEMOOMMEMMMEMOMMMUMEMEMOMMOMMOMMOMEMOMMEMMINIMMMOMMOIMMOMMEIMME MM M. MOMMEMOMMOMMEMMEMMEME MOMMEMMOMMOMMOMMIUMMMOMMWAMEMMIMEMEMOMMEIMEMMOMMOMOMMOIMMEMMEMMEMM MOMMOMMOOMMIMMOMME MOMMEMMOMMOMMUMMOOMMEMSMEMMIWAMMOMMIMMENIMMEMIMMEMMOMMEMEMMEMMEMMINIMME MMMMMM UMMEMEMOMMUMMUMM MMMMMMM MMOMMEMMOMMIMMUMMENOMME MIEMMINIMMISMOMOMMOMMEMMEMEMM INOMMIOMMIIMEOMMINNEMMEM MMMMMMMMMM MA MMMMMM MENIMMWAMMIENMEMMOMEMMEMMEMO Rim MMMMMMM EMME mom. MOM: dlomemeempoommoomminuomme MMMMM MOMMINEMEMOMOMMBMOI. OEMENNMPIIMOMMEMIUMEMMO NM MMMMMM IIIMEMEEMEUMEM MMMMMMMMMMMMMMMMMMMMMMMM MMUMMONOMMUME:::11 M an ONIMMUMUMMOMIEREBEIIMMOMOOMMEMMENIMMIUMOMMINUMME OM MIEMISMIINooNIMOW11111Ell mmmmmi mmall 0 Maigiomm iom1mmem MEM nmrnmoomomm= Moms OMMEMBEEMMOMMEMOMMOMMEMOIEUMOMMOOMMEMMIOMEMMUMM OMINUMMONOEmmomillEMMOMOOMMOMEMMEMMINOWOMMUMEMNIMM MIIMMUMEUXIIIMMEMMONOMMO MINIM= MMMMMMM W MMMMM MM - a r.zsg= nom MAIII:JIL9111 Illami... INN MMMMMMM mommrdosomolomm000mmmminomoommommummommoomommoimomrnommmumummoi INIII MMMMMM MEEK/A MO ION M MMMMM NM= EMNIMOMIN MMMMMMMMM Ir. M 111 lialr=1=0 101 MAI IIMMII OIMPOIMEMIT O 1112:1 EMMIM 11 M 11 : IMIIINUIIIIIIIMMISIIMMIIIIMMMIIIMINIMINSIMMINIIIIIII UM NUOMNIMMIIMEN MU sm. 1.11:1 monommo MMMMMM Nom MMMM ogolooniummononlingino MMMMMM 111: osignonnogilmonmlionnisomoonsomo ossonnonommmo monlimmollisno no MMMMM mongolism MMMMM soon MMMMM A Noon gosumnog mamummummann Baimulosmom wift.mnimingsgionsomsmonmossolognmomomonsoonnimom nimmosons EISEMMUM MMEMUMMEMMUMOOMME%...imimmemmssm...m.. MMMMM sum MMI 6 1=11=MINI A miogimmias milmumummommummommirmlimmommommummumummummirommumnimmillimmummilm mommommomm wirmassamissumoniniumessminummiummumunani MISEMSOMMIIIIIOn MOSEMSMEMS wrinnemiiiiimminiinfainio MEI= MEM Man MEI NM III NM MBIIII mai m Ton ne. m...mm...wr... IMMEMISSONMEMPISMISEMMOSEMIIMMIIMMIMMEISEMMESMIMMIll ammi =Li m......m HEM MIMIIIMIS MEM a mm...m.. ww.. mm um... ''''''munimolia...mmm mil.rnimm.0 Y.... Ma=....Immo=...m... ral=====1:121211=========1:21= ml...amm...immi mig.mo....m... gm IIIIIIIMMOS mommonnommulmononligliononnummsmomsoog:1112m11112osomoem mionimmumom E1 Immillrimmii noonnownomommonomognonommoommi mommonniminmooms ummisloomormasmosonomanonmommonommomommonosommomnommommossmo ommgon m OMMUNIMIIMMOMMIMOMMEMOIMOMPONOMMONOMMEMEMEMOMMMUMEMEMOMMEMMEME m NSIOUNIMOMMUMOME MEMEMINM OMMEMOMMOP%MOMOMMEMEIHOWOMMEMMONOMMOMMINIMMOMOOMMIOMMOIMINEOMUMMOMIEMOOMMOOMMEMEOMEMOMOMUMEREMEMM mmnmmmrtimmmmn IIMMIMUMMEMIMMOMMOMMMIOMOMOMOMMISOMIN OMMEMMAIMIMMEMIMOMMOOMMOIOMEmOOMMIMMEMOKOMMIOMMIN ill MMOMMOMMMIUMMOMMENIIMMUMMOMOMOMMO msrammaimmummormumnommunsinn IIP ill a" '""m"""11: 2&"4=11Wiril...mmwm!!!=m gimp Eh= 'AI= LIM 161:11 mmummumnummlimmuminfts...mmumm N PAL M EP BM Fird'eml _ms WrIa= NE NEW... MIONMENEMNUMEMINIOMMEMMOMMEMMIUMN AMMIUMIONIUMM W SIIMMOMIMMUMMESAMMIMMEMM IMIIMMIMMIIIM M IMMISMOMMOVISM MEMEMEMONNOMINOOMOSHOMIOMMENNEMMISMINOMMIONOMMUMMIUMESSENNIONSONOMMINNUMMENOMMENN / HUME MUMMA MIME MOM EH MIMI= NMI IM MEI NMI III. MUM IMPRIMIS! Mil MI gra= MUM MEW= :=1.1=1=1:1Z M MIN =11111i = M MMI HIM SE MRS MEM REMS1 CCM=.2111M IIIIIIIIIIIIIIIIIIIIIIIIIIIIIIIIIII E IIIIIIIIIIIIIII IIIIIIIIII N INNEN' M ENN i1 IN Of O H O qrocie- Point Averac.ie O

48 EMI! eeimum.milms 111 uranran :0 ima%"17 NW en111wilenggral W4 im-m.....: a =A INIell elea /11 le woe. ErikL lirmellal SI. Ill tr4 LA 17." II n --1. lernne n.. I-1.9. Walk jral LIMA... Le elelillileelle Ewa= x :..anird...aim r11:117.fin Ptaff "76" e r...m..a.n.... ffle LIL : EH : nava= 0..: F. R..4 r. : waa. a al 0 ha.... ca. r "" rj re I rti P. I r.il ME "1. 7.*=.4 FAS: i. 4" I'M i 1 1"4" MII a e' =:11:...=... fil Irlant ee/lielellnall "ere=11:11 ' rawirnal fitern: 69:0961e... gr..,......,,,,.,...,..,....s Num= :n. ::: l MB MAIO lallee Ile eal11 SWa :neig. W IMMass......mil% VIM= '. rjarimalla:mum IMIXIIIra a eliiiinell SIMMS lellatenimi a = elleele JO SW MMMMM I... -=1...mna wad= B ham=1 "'I...,....,,, s,,m 11...m munsamen sn L.munit... o MEW S mm""...un =am si saran lelle 1111 lmen UM ene Ill : a 1111W_ IIII.". lilt e 11=1"r...11 int, ma i a : 11=In=ix, r= calusdass mamma lunsulasen = ulna= I m I.. 1.= iiirefar& :...M.9 %owl. : radan r gin rirel rre4 1: hain :m ::..d gamuma 11:4-,0.juti :Am rek Bugg r1:1..a, nazi marat: Lipmr. man Siida :Z.. 9 :rxre rin... am...." s.sona l e, To=,...:= attrim: anial a:ma Y.... rarlimill.1111kald mum= se Il ell es eell aemiimii ellegliall Canl:1111 I18. IOI CI an munti.. Kona Fifa %Ea

49 /0 /6-20 2S- 30 3r 0 00 P.E.I. Mathematics Raw Scor',..1

50 I I,,, _ ' r 74 1:1 1i. r ' 7 3 O...L.,_ 1 7L n ",_ -f ' ".,. _: : IT _ II I -I 1. 1 t.._ 1 8 di. -,d "ft Eli d.. 3 n, - gi`-i Lli.:1.± -..mdlii t. _ 1 Tr ; ii 1- :[ I illi I 11. I I 1 Ii im i upill - --iii- - - i ; --, 1. 1 ri- - ii -_,_-_tt - a, -- 1 FL mullp lqiiiiipm.., i_, II iiiiiiiii i i..,. i, - 11 _ -_- _,...- ri i ii - liill i lilt,,. I_, I! Ili. _.. _.,_,. _. --f_ - - i -Ibq, LI.. ilimih 7 r,1l1 r -.. 1,_ _ inil -1:1P :Lid 1; ; ' - -, Il l 4 -ft : :I II -, I i i I - - I. - I ' I I I e Jo. i" iiiilil milligni 4 - I I I I I I i" --Ln r - ; Hi r [ t7-1- TizTL' F ,1- --, 1,74-1:± '1411,. 1 ici- I r.,77, 7,-171 L ft,- I f LE - -E -'--i- It_17N L-ViiliF,-14 '1_1 - ' - -4 P;q7. -H--r- :,4-1 17! 11 H ±714-1: r+rr+ 1 I; Li.. I qlt i 1777;7 i Able itielli9' Fig / P-111:1-11.!Pg 2 1.2" : 4 p i ; iiiil "Ilogr immall = I ' t 41. P1 LLH 14.E o f ±1: t ii:- " 1 :1 _I_ - - t- _ -,--, 1-77r I F= -n L.1:.s, i.i- _ 11 -.", - i I it -77: LE: r:ri i -,- : 17: " " ' -7-', L _ r i._ -, I -1=E L- 1-4L-141, # FLF. LL r -:,-,-.t.:.--=-- :---,-- i-. -7= 1:447 1-k-H.-+_57+1 Zpitt,74: 12: :141-, ##_, 1 -±7 7TH-7 1 RT l - ri ,.._ LaLEI: I- ry! -.;; A_. 1...,... _..._._ '-'-' "----t - -,--t-i-;--h ! [117_ lit : _, _ i, :. I.,, ill i-,_,... 1 i. il I ' h 4,..t i[ 1._... _... [-r= F7-7 1 ' I_ i _:: i IN. 1 i 81.1 'HT - F 4- FIT,,!_l " in.. -i T' - ' -.'-._ I I il J- - I- _ ; I: I -r ; :1 IA *ifi -,Lh-, ' r44.4 i i :4'1 4 - ii.1. 1.: H Li 4 l' I I :..!IT 1. 4 I 7"--1. ". 1 Rail -._ -1+-it_ -i-i-h,-4 t, alonq -i : i' - T, ' 1-'1_4 :' ill '1--It-4- I fil,:i I li - I T 'I , - I - I -, a II: ra. I --1 -, - -i - :- ' ' - H --if-4-2- :-_, 1,. 2.1 ',4-1--H' , 1-'1 -, F : F,. i: : ] t t di _ri pg. -t-] 3,-- -! LI---,, tli - i jth 1 _,-,,._ i.,'l.is-t F -,- 4 I. ' - 11H it. [Pi 4-- ill _ ' l 'v -r - ji i th I m i-.. - _02-iii-r 1 T4--i] -..,, 1 -- i. q i H -Hill, lin-i-p-,--,4 ll 1 i it. _ ri_t - FL: :_,, -- r -,,,-- I i - II I, I, -t- _t_. H., - T -1 Th' 'l l,. f 11 T4 WON. i - 1, j j-,-, _-_ I,, 11 " fillt r -t-' t rirti -- a -*LI *VJ mu t - -,c -p _1-, sril RBI _ F i t '1 iti - # , t r-f 1-1:1 IIIM i '4-1 Lt_ +HI_ %--H,4 I- :,_1 a,-.jt_l,, t- _1- _11--,-, Er 44 I i -, - 1. tt. -;.1T-4.-f-i -i -+- t 1- I,.-I f Et -21r--- _,m ti -,- 4-i- --'- i t-1--, -,-- : _ ass _ - MI t ' 14 SS 2 re - _ A 1- -I g 4 Ni i-i.si --rti - -7r- inta r. Ea ' '-' 1 rt,-, a,, D-,T -.I1. -;1-.z.,- L ;4, 411- H, ti , L t, -- _,-., H. -.', 1,-- ' 4 1.-, T 4_ 4; 1,, ' i i ;Hip:- _i 41 --: - _i 4 -r I' ,-t--;: ittr-rt t 0 III Lt_ as,...c i_:,_ -, 1-'4 - r tt:!---; '" I -JET' '11-_,,raut.:: Ti 'il IY.,,-r.,q'.1 _,_ 1, q. q_ J tr- =IF t-li 4- I : -t4 _ : nun: N J- wali I li.,4 r fir--1 T '7I- 14 sr. + ' I 7-1 " Crorilin 0!" ' r ' 0: q, ' t r -t t -I t t1- -' 1 -. : t 7N4 Ugl:12 RIME ESL, :Rho Immo 71-i--F-17 '7- t. J1 J mg lil 4 ' -.1 :Elu l 011:11 -t-.. --'-'.n... III :14: 1 ta M I: :11 Il 1.7._ r -. U L-I L 4.-i JO "fl ZS 30 3T HZ) 4/5- SD f-,0 i-. 70 P.FJ. Mathematics Raw Sco res ],-: -, i i-. Fr-Tff:A -,,_ i-t-, :_t:77, :-._.77 Frt-i-H7 r-i H +71 _...1 Lt 1.H I I I I I :17 1 H , T , -11±, Vrt-, rt Tr" - 11 ii_. :.r _771.i::. 4i : I 4. t..li 4 7J

51 66 Raw Sc ores

52 4,-, ', ' ' I ' : ' ',.. ' ' ' ' '.,, ' ' : ',,,, ' ' ', ',, "4 41,.142_,-44-. l',.. t444 -:,u,s 4 -,-,-- i ::rer een: --1- P.- SUM 1...,_ ens. am:al Ms MI AM 2170 II: 1-: :4-1- 7" -7. i I 1-H,7, -,-, en 4- '± 1:1111:, : : -- A;1 _ Lilt -, I-- --! ii l rti - HT, i-- - r IL 1 I th 1 I ' L. i 1 c - di '--t - I -Lititilt L - I `f.1 - i;,' - t l 'Hi, 44, F ' + 1 t FlItli t r d il Elam. ' 21-_ar: '. H A.'1-. 4, I ' I. - ' '---'-, r, --, '. 1 I --4,, 4_,..i..._, 18" Ulrill..e., leglifirql : ii i : 7, ' 1--k-r-1" ' ' " I i la - -,-, Len.: p:!::pi:?, A H-H..." 4. -t- ti I , 4444,-4 1 I 4 Hil--. -t-,,,,.."- ' H-1-4 ' --r Tt---r-'... ' 1--1-k -4 utila1:,,.. 1 '-" r: r-rf. F-!-F, '.. Ism,I_L-ft - 'l- WI'---ITH,-M---F-1 1-1, ',_, '. URI Lan t _,_ ',_.-T *-1-1 IL,,, rit-,-,,,--,-,-,--.. r 71.,..... ta Fra I 1-; j T- 1.Tr if 1 A ' I ' i 4, I H , till ,r,f1; t L 4, 1 i7t 4.1.tvf! _ _0 1 (r 1-i-111,1 Ltd.; 1. F ri 11 l'l!ad :14-H4: H-44,H-rr Hi..,...,_-_,..4.H * :' : I H--4-H--' -'.7-!, 1 -, ii.1 nratirl; 1 ' ' r ' : LL-,^-r"-1-^. :Z:--. 1I- ' 4 --' ' ' ;f-j. r..,-,. 47:4_7, -1-44;:-Fri: -r,,,,-' ' tr - +f t_th:!"_1-1_ 4 -_ '''''..., -447-IT ti-r,--i Iii- -"H, -HH-i--j:H4 -,,,-,--,- -F---,-F--.:--,4 t, , :'=" T...tr-,E- ',-!, -[_: L r.--;. 1,,,,--i ' ,-- ; 'I ''''r,-:z-4 ' - --, _..-- SMIIIII/.. ALiL 01. IS14.1 tir. / ' ',, -r- -:- -12_77L- 4.11_ '-'r H--'-4-i,-,H,-' -r. 1.± -`,--, '61,1'4,,-,-1,_,_, _4 :_..,_,_! t.'. 1! :1:1' -1 2?0 = -4"-^- i- '-^'- i+-,- ' ---, -1-,--1-,,, _ M INZINEMINIMIIMM,,_,... i I,. yid I Ti H -- --,-,-p-m-r ,1-±-.- rinsomum wien.±.4.. l _,,3_,.. : J.4.,. 3_3_,1 _3 i,-'1"-i---1=:.. t...,...:- t----3-, r-rr 1 ',.ff-t-i-r _ir..42-n, 1-.,-t---- -,-- :-, ri-,-- 4.7,71,4,-.,-L-41.,..,-,-, I. 3..:_:411 -,, _,±2_74;_iTb ' _7.2.:ti--471-, -P_,_-;.:,_5:7 -,-'4-r_ -2--,1- WWII =....A.im...,. : --:_--'t--2-h' "-i.-7:,-,±t'l` - SUISEEHES -' H--, ' :_u:, ;, : _:_,_1.4_ --7.1, - _Li...,ii..,.. _ rz -,,,. + H,.:4_,-.- -r--r i-`-r-,--, --i-h---h ,-i- _i_._:. um 01=4:""mm= " L--- `-'-1-r, '4414-4, 1' -m-4 1±-±-T +.:Li-r ', 1111Enualir Oa 4 to, H- ' 1-, f ' : -'-' : -r LT;, 1-H,_ - _, r-e,_ ;0.11if I!-I-, i... _,..,..,,,...,,_,,,_ pir.:-cii, _,. 4 =-F 1-r,,- --i.. :11""19...",... I, '.:11.. r.- -n- '. --.,-.! -.,..; i_: ZY0. -i--,. i f ra..,... -H-4- F- '!,. i ' ' r, -. r -r L-1 tariumurom EC M= i-,1-4f4_11_ MIIMERMIHM L_LfL_L-4 --' 4 1 ' - 4,4± _, 4_ -, L Hat. t-., r -re.=. -1Url-H r_..,,- - -,-,-, -- Ti I "--1-'- 1-, -4- FL -, r-,--- I ' iu --44, H-,, ' '. -_t H-r '-i- 1-,, , -4-iril, --,-r- - -,--r---,1 - --, -r- ' f' i,4- _._r., _I. Ewa 01,.. -,-,- _,,, - : r : r:. -H-, : -.. " SP j,, -r- r-.; i Illft 111 n ,, -,--,.,' ' it.,, , T -,. -+, -- r'' : ' -, _±... -I--, 1- R---,_,. ' L -i-th.4.,---_,,.. r..7-h , -4-; --,-.._,.4 _ '.-,,- i-- -i-1 tt!-,.., "4-.. M.. ' -i-- A :11/ M1. '-` ' ' -1 -f 1, 1 1r. OurrillvN.r4-1 1: , 1-414,,.,., - --f-,,., r-,-.,_ I, :, f-r ri r: { H4 rm ilia.= iimiia -1-- /*0 r. ; ' 1-4:, - -Irr; ;--4--"-1 t_ttht-l. rr t rir : 1_.. j, 1 r _, i , its 4 -- SE._,--Hi --1-± '-f_t j. -,+, rt- ' -1-,-C HH 1. 1:: H. mou rn H-, ' P...4. :_i ct,-h -,-. H - i t-± H.ri-h + "J:-,-._...L., +. n *-1-3 r.- _1 _.444-, -,41- _, t-'! H-.! ', L /60 +-I ;.-7-L i - -,-,, r,_2 so I , _ H, rU+ AnaHUMi1 "-- T' '19 sijmrommlum lumens mmill iilli o -.+:,- H- r--,, L E L I r'.t ma In, 1 *vi I,, -, cinga*..... H IN 1-- imumnse 14.:_l_ H-Lt-t 2i: re F j-11-' ELMS / V0 ffi WI I. ems=n , : ' H-H H.,.! _, 1111 Onlir 114/111 MUMM I 47-H. -r'--- NEE UM ' i_,_,_,l 1;M... C13111'.. ' t- 0 11=r19111LIVE=1:11:rgral _M j111 ' = Fa :: inal= 1 :=1 raill M I iii = ' k' miniiiturgnrmr-olinnn..1. r 4-T-4-7. I 1H rams. '4-211 a. ma I 1 N. a ' A N. ablir. ea II a la SS 1 M., = ornmautusaii = elliklirli...was.....c: 120.1,..WEIH H-f-i,.. E. H...:: ne:reennenielii 'H., - r :...! M,. o n _ _,._,.,, H Hs -E, 1111=11111:111 i fl li i1 11 EMU MEISMISIIINEIS MI " 11" wjararimm.. ormanadan C US 1-4, NMI EU -I I- MVIIII MLI aroma sus: VS ,111, SUS 1111.k..... WHISISSIMEHmmISMUN.,. x-ialli in. Julh::53:. /00 a L.; 1-11r - -r MIN MBES r Hs., Al all=manalarmaasin esimusausa An= I a Nal 1.111:11Ella mmill11crim= as - am Au MESSIAH' IIIIM Flow MIIMISEMIIII MI EU millnrillis fweirsarilzmil 111 Ill 44_ NUMMI _, SIVEMSmm 1113 MUSIV IIII..roari. -:: EIVIIMMI Ma mans.,. i ill FIIIIIIIMCIII ImErL4... larni11.0,... ISMS Ri SI Il NM MI MIThill SUBS 11U11111 zoirafform" IMEM J...._!. MIS, ' M millea Ilk -,-] i- _El 1.. Inp, IIIII I: il ala S li OUP rdi Eon Fa Insmsmlnue ESSIUMMITH... ''''''' E._ llti 1111 VIL A 1 MUM" I -.I' '.:1-- - V fr,--t ---r" -', -1 M91 E j E: SNE II Iql t 1, _,_.. H _+ r i---. a NOE nurim:v.:in=...nr IN ' KIL :ill Hr-r-H.-, ai. 1 LT.=,,...=: AllA,_I : + li -1--H. 60 H4- Mill iii La I ms. -1-r lirme _ i---' _,,,4 ILW lie "4--ttl' -1-tH-' :--1 t,,. n-i WHIMS 4- UM,.,...-_. : I-,. r r. 1 ' 1 :6 1111! '. L._, I I- man i *I = iminw 4c) 1-7-1' t-',1 ', H --L. H... { LI q_,_ 4., I: W1 as.4.._ 4._.44 -±- _ VA! 1_ ri _rt_i_t, i _I_ i-r.1_. MI, saw himhild I: nues.sass --' L:_- -i-,---,-'- Uso vis..i :, i,,_ 1 -t-',, n o w --, a _ L vs. mul,,, i '' CIE a ili,f! _Vei t-k J r- -,-,. _...,,-,- -9. i I. : :_,.,,-, r-r-:-'-' i-r--- ret r - 1 moms amus e:no 20.., I-1, f- rir.1 nig. a, i-,,..-c : F iin : aiises. mi.! i. _r.. lirmllaim zugurn.. a,!.."r.-4.- k. rt r _, km : ;H 4 -. kii- r MUM 1 SS I 4_ sm.t.... :::,.11: ji A MMMMM am.:::.:... JIM I. le :a. :::iiiiiii:::=6.411momumma: i l sm. SHIM. I r...r ili I.: :: M INIM :.::::.,n 0 F D C 3 FI I t i r :i 114t i i I:TH IF 111 1: tinlii : th lii-f.tollp, Pi-Fil-T-H ritii ; * il ff rt: if-f'4 [ 1 1. ii i12 11 r W ,!--y 4-r 17_1 t[f_ Li 1 _, I ' I--,.1. ',, ! TEL-ft -1 Ft+ '1' rig ricatheonaitcs 101 Grades --1 Pitf: L t. t-l r=fir is,1:,4!:_c_ 44-44:1: 4.4.-_,.. LLL "4" -A-4. _ J i-i 11-1, 1H-IT 7: i L -4-H f ±irr, -7= N -H -1+

53 46 :::::61" nmal:::2222 ::::::: MIKEWES4gORIERI: mulamemasmom : Immillemmarnarnamemjgamli :: ilavalaml::::;:i IMMO MISMIRMISOUNDIO OISSUBMIUMMOMMEM meglaimmummilm. M Y MEM WiliaiUMMIMIRM MN 40KOMMOMINSEWOMOS =1:112Lirjajaa isi IMMEMOSullaSIMUJM: BEMU MINIUMNUM IA NM 0sg11111 MtplIptiLAMMITIMUMNIRE IMMIRMIMMIUMM udmirrnlin.,,mumtga..n...nm Miln C21.2.W22222" INI /11111 jna11 IIIIIIam 11IONWMP IIIVII 411MIUM1112.9= IlimMinIllml. WM:: =JIM...j SI.. max unntnnmon: m.-rowerni WWI. Mlle w.a7.. mama =14r1 111=1111E r I II1111M OWE =1 Al cm MON EF"...lan 1...aim.,, Mar 1=1:Zera r ri LumrMar rai rm I XIIIIMI 1 nz.din... mg_ PIC MACCAVISIII.911 IIII:=INAIL= I 11 EL'. rrrrrrrrrr rrarroprop r r 1 MMMMM.1101 OW 1 11F =1:::::: wa n= :mom.:n.q.... Urn caremparn., ,,,..am.,...n. ;,,h,...,:nurant...au.i.n n ja M MMMMM 1 = - M NN m rmaurrorrxr rrirrorr.111:26 MMMM E WWI _ 1=1111 urrrougrun at m:: :: MUMMIES. alt IllaNall iif1111wi rel ini = a1 anit OW MI II LwJ 1W Lenonn 1 IMIIIMM: err. rarr rom mire al rr111 =1 INTREILfahl1 lzillm ::::: 11WIEWN111 2 BoORMAINO a1 A 4.1:m ailing.' mftimmsmmewous:11: KM 22 EMINSIMMINIMIIII III M MMIMMMOIMMOM UMMINIMUMUMBOWEMM =mu ggrniummemomummem =21:::: Nan EljaMOMEMILI:... giummuumm..... maul...:: anummusacii m.. -mut III_ nimeinnlimmigimplinmei EMEAKENUMWOMMUNRIM IDE OM MB MISMIESIOMIIMM EV REMINIUMMEMMUMUNM OREMANORM:12=11 1:::::::::EMOURNMUM ni ael MIllosi_rammot rararrrromm nu MIN Ma:V:2=j:: munarawm 20 mrissains41mi!1 MI again a Vile= U BLREMIn:, - "...,,.1- rirt---' -j--# _1:-.+1 1,-Tfr-4 -, 71-i `'- 11_, '-' ---' p-1--, 4:: h' _L..t rasisammillesmaal norrlsourrini rourommu MI -.{ , ' -:..1- -,.:-4-, CLIMMMOUMUMOKMOWIN 61111:111111:::: +4,.-, en n IF= swim wslain.:..._m.i In IL mom ran...8:9 ening jel VW" in NEW MMMMMMMMM WO rms. on MN " m rem MMMMMM arm rr min rarellmol; Um" so r cou II_M sommo mrore MMMMM or oromtro armour ir mae Ver :: $. :MX= :111 =MUM MMMMM :::1 O P IMIs tai Limns lirgal n r-in ni...'gy m onntrannna arrdzibm:se qra: n...arnu.n..81 =MI :::a Mr% mai...a on...: rrromorrrrr in nor 1111MI naelml 2222:: Orr 11 MIA rams 40..,*..m mu 111WI amemona MIPS r1c = it111111=1 III CU 2221: %1 111.=, =:. USW it. -mlithiliiii EIRM01811UVRVI SI I MI II SEWN -_,:._ e MM MMMM 1111n :7 1E4ffir. nun MMMMM MM MMMMM M M C Ilaiheniatocs 101 arades AA

54 ', J ' - ;:;14-A I. :,..t. LT:2L /6._:....._. /0 i ill: 4, :.L. '-','!- 1--tr''', ' ' _ _.`,., r.,-..u.., : _..... i -....,.. _ _,._ -.--_- _-._,..._ : 14 / 11H : 'r.-.. -:'.. -.7,_,.. t4 '....L...L_ 4-,..,.-:_-.:._.;_...i...:_: L. '.1,0.I., fi 4 I- :_ _.... : ::-. 12::::: _....._., ' _L,L.,..._...2.-_,.,..._...L-..., c - _L , tt_ r.: -:,-... _,.t-:-...-.: t 7 '..... _....!A : 1-1 I ;...-- ". 1 - IE: ::;,.:.., I i-,.l, I 1 ' '- ''.,;.....,..._1,.. 4..t... i'..! '.; A 1!! ,-,----,--r- :- -:1- --,- --,---t- 1-;t ; 7 ; ; ;!' "' 1-_,-,.,21-_ :-- -.ft _,... q.t.. r- - 1 rrr -,.,...-i.... '... / ; - 3 4:4 ;-_, _ +=IT --t-, irt -, ' tir , -i-.., --! -..,47;...- -,_ ;, t1-if:..-...j:.: 1..r L., :1.T.1,...-,.....,....., t-_-_: -.1":- 1_, I Irt -.1.:-,4 -.t '-, -,_-': L 3. -.:1-1'.,. 'j.": -.tt-"7:0- * *.±4 - r..:' ' t r`s'.. =:. :.7...r... -.:...! , tr, - r _i_......_, I i Hi' 1 _: i i. -, 1! ; i It -11-j-11.-ti - tecii 4J; -Ltrat...f 1 -; ',... 't;_c -_,-±,--_"_-J-- _ --.:-_::_- :4-.;:_,..,.,."_-_-"±:E :::`,:.-_-.T,, '.. q0.....,_ :: r...,"--. -:- 1., _, ' -,....., ' '-. ' ' ',:i.- 1.L ,-4J Ft..1":27:-.7.:.- '..."...:_:..r. :..1...:. :r..., : :":-. -_- :1:.:., L.,...r.: ' "'L.:7' -'-.- '.. i - -- ' ' ' 1 '-'r-, - -- kift: -: tri:-;.,..--,..:4-i-h-hi'l. - 1-ttlIff :-._L ' ' ,_ 4 j -- :4--- " ' L-CEr -t-.-_-r-j-t-c-:::::c_.. r.ct--..t.-1-_-.-1;_.. L-.-.: t., Li IJ 1,1 11 Ii T i,---" --,-, - - r I iii i ; 1 i! I..L H.._..._... _ : , 14-1].,.,,., :111.1 ;. I, r : 1..., ' /-, -.1 :. r -, , _..... ",_-_, H., t Ji 1-1 I LEE.. :.: 1. ri. 11 1:1.c, -rit -l-t- _. I :,. -'.., Li.l. -: : : r --- " ---,'. :-.. r ICH1 voi.1 a L -- ge --a - I r_i_ F1-2, :.... I:: :: I 1 i 4-1 '1-- 4, --- -t 4.4,..., 71": ICi I. : I..._ E74.,..: r... -,-: :-._:--_;.0:,, - -, J-:.:1.:_,-.. : :11 - ', -4, : '-,..4 `!.... t,,-, -,- ' : r 1,0-:,.,-: :. i --,,,.,-, 0 r 1 -, I r.h --- :,`,. -.1.`", -:, :4:0 L : LI 1 ij ;1:1:4 J1 1-_i -,... f_ 4 ' j- J -j 4.. ri-4144-j h7t-f-! ' t.' UXLUiLi 111 r7 : : j.t 4 j ;11 1 -i i 1 4-j j --7--: , i,. 14 til -- ' 4!--; ' i-4 :_t.e., ,-.L7.r".; -', ', c: r_ -- t-'4,--.--4,,-:,.::-",-, L. 43+ : 171 j. 4 iltt-ilt--, :11:017,1 t_k. '. ' ' ' -'t -', ',' i". '. :', i ', I_ it '..,. rir,' i 7 4,-t- t -,,,I;:-.1.1/- :--.. ' : :::..;...1:ki. r...f.-i... J. - 4-: 4: f,.- - Hri' LL ` ' ' I- -. I :'-' t,--;: '-,- r 1. 7t -I.::.: tr-i 41:: - j I- tr:liih-. ' 1- ; Li. r* i_ ::12'-. '. L f,. f.l -,-,-.1-,1-1-- :, - - -, r -` - -'- - _,_,-+ -,, -., -,-i-r ert -,.._, LL I.- MEI i.- -, 11 i'','_' - 1- r-l - rit,^.- -.-:- -t-,. -,- -...,. r -t i r l { /-.4_;#4... : :-: L- L,...1-:-4-,.- -,,..._t-...,..._,_ -_,,..,.:-_- 4 r. 7 'F. _, :- -4- : Cif... L t- I t. i.i ' E L... ',---it-t-t-t L, _-i,. 4- -,. -, ;-- -rt:1 IT, I,..:.". :1-.r.ct. L0.-.1-:"Iir 4. -,-, _,_ ft, - ;1: IC-... ': tr:::. -' 1 r. - - '.,--1-., 17'4:'., r-. I-1-,_ ' rt.,-, _-1J. -.4 rev _..:.0 I. t --, 1..._Itt '...t.tv.ti -+,.....,... ; -,--L f tti --_Ltt::tt. ill -i.[ L- 1_ L..t_o, _ 4-"" _,. _: '.... Nous ' " t -4.,';.:" i go i ems mil.c-f..j- Ari,. [11- _t-' ' 1:. /0 -.-±4,--1-,-, --- _..: ' -r, ' _,. _LJ. T'..,_ , -: ' ;.-... '+ ' r -,..:- - ', ,_c," -,-t --1, ' ilf.. -' -tc' fj..._ --L. Lt.' f. T+1,-- -t-i -F sax - 'f : c'-',"-t-s4 -'-'--.. ;,.1,,,-.; ;--,.- I ' r -.., t a LT I i :.1 r i_ I., li r-, -- L-f-,..-,, t i. ---'-rir a L r- 1 i.t '- -J- f '. r 1,,-, 1-- mr.:e. LL,_-t-_, r,. 1,. i NA i +A -:fl1-71:r0:-eii-44, , I.' I 1.!...f !III. -Cc -.t... T.t. tt:l:.:r. '--,-' 4- - ± -[-L -,-i- -[ -.:1 I: 4_. 1;....t. t: -I Ti. ' '`I--"j.11-4_,.:-. ' -1',Tt7,--E _...L._ 1 L : ::,- 1.i, 1. '.._ _i,....!.: L',..., t._, 4- E.4:t-ii-_eiir±,ilt, 7',-, _1.1. : r I 41 ti - -:-. -; } -,..., ft ,- ti: f-, _..:1-,-; t-,l,n-1,-- -,-,4tt - - ' : - r:':: :LI. Lr i 11.. i t r -: -r - E t r_i-_-:,_,._ -1-'- F...':1.L : ' F - - sou '...,..., _, I' _. _,..,...,_,_ti.l1: Ett1., = 7'.- N-.._ 1.i-,- 1+E. i L. -.1.:' A - -t..-_,-_,-.,.,,., :-.1-.,-_. -, ; 4. :-L: -. -t 1 t.,;,:..-,;_, -,-LE.LI_D-.:4-.L:. g101i"i Of Ofallt I ii IJI 111: II 1161 Illffl_ 1 ::Lga:.::::::::::... m: 0 -tir i'-:t 1f us ::.1...1:31"11::::..11:: :II 1...:: r :Lilt 1...1:1....:...:::: f4 A,. Mathematics 101 rades ' UL UL,4 1J-1 EP: 7!Ai it7± EL H. i r_t EFF7 777! :Ht 1 :1H- H :4-;-" ; 1414,11 Iii:4-17,7.,, j-l -r- i r r-i rt4ttl : Ezf S :til kl -v 1 illhz_i] Li.: : EE jh 4,4 ITN; 11E :2 1- ;J: , r- ih L' LJ 1E- ' 41474: - :-4. i- 1-1 iiti it=th F-1.1=41= 7-14=1 :±r. *:--tt ,- -- ". Mg: 174.±-i -i t rr.* H- -.' - ri:1 171 Lr. J-1 1-=11 F1-4-7-±TF44 E l±, ; 44 [43- Lr..1.!71! -J4 7=1=,-1 r. -. '-7.:,,r,_ t -r i

55 ,-,-,-- in ow u= H a...1_ 1:::=0:11. Ilemmommoria = MINIMI m aj= m MIIMINIIIIMBErant IM isp "...1.4, %-_%g...mem6,,..,... sm r,..,i...1w M. NaM Ei= WINIMMEIB XIIMMIMIIMMIIMM IB MAM: AR". IIIMMINIIIMMNIMIEllt imrn...=.1.41.:o,. a..... MIIMINSWEI11 MN MIIIIBINIMMOOM MIBMIMMIIM rmaili alinmamo. rmssonmara. ruiranimmunin3mnif... 11, -.mi val.. illx=11 MI M MOI19 EN PIIIIIIIIMITIMMIIIIIIIIIMBIll Ell alm. IIIIMMfl CU InglIIMIIMIIIIMIIIIIIIIIMM10111,..r3:11.,n,..8-9r , :r '.. ':I?,gLL.,i:.'-:Smr.L.unm :..,::.1.'r;jiI.;.9PP,,_.,.V atamin ' L1r17:! I :Ur:n:1 C
56 ri

57 Ni.NM m Via="511iridlinigRts"'-' -09, Erffil " DI aid-.. a.atm girrilit-r5!-. pal : nerm:r Ll IBM ito s th-ir I rs loll ir.z. i unwriginigiror 11;11:1PIP. la.d.: harbh pn114:-zuritn:u.. : kir "24 4ET.;:nridghlak Enn: ILL tan in I q:11:41. planikh ve BMW ill 1.11 I I /co 'O. //a pis " 2c> / 1 / Total A.C.E. Row Score ii{ me0741;2 irjrnimur iiEne AILL: :0.. /60
A L A BA M A L A W R E V IE W
 A L A BA M A L A W R E V IE W Volume 52 Fall 2000 Number 1 B E F O R E D I S A B I L I T Y C I V I L R I G HT S : C I V I L W A R P E N S I O N S A N D TH E P O L I T I C S O F D I S A B I L I T Y I N
T h e C S E T I P r o j e c t
 T h e P r o j e c t T H E P R O J E C T T A B L E O F C O N T E N T S A r t i c l e P a g e C o m p r e h e n s i v e A s s es s m e n t o f t h e U F O / E T I P h e n o m e n o n M a y 1 9 9 1 1 E T
176 5 t h Fl oo r. 337 P o ly me r Ma te ri al s
 A g la di ou s F. L. 462 E l ec tr on ic D ev el op me nt A i ng er A.W.S. 371 C. A. M. A l ex an de r 236 A d mi ni st ra ti on R. H. (M rs ) A n dr ew s P. V. 326 O p ti ca l Tr an sm is si on A p ps
A Gentle Introduction to Gradient Boosting. Cheng Li College of Computer and Information Science Northeastern University
 A Gentle Introduction to Gradient Boosting Cheng Li chengli@ccs.neu.edu College of Computer and Information Science Northeastern University Gradient Boosting a powerful machine learning algorithm it can
Secondary Support Pack. be introduced to some of the different elements within the periodic table;
 Secondary Support Pack INTRODUCTION The periodic table of the elements is central to chemistry as we know it today and the study of it is a key part of every student s chemical education. By playing the
OH BOY! Story. N a r r a t iv e a n d o bj e c t s th ea t e r Fo r a l l a g e s, fr o m th e a ge of 9
 OH BOY! O h Boy!, was or igin a lly cr eat ed in F r en ch an d was a m a jor s u cc ess on t h e Fr en ch st a ge f or young au di enc es. It h a s b een s een by ap pr ox i ma t ely 175,000 sp ect at
P a g e 5 1 of R e p o r t P B 4 / 0 9
 P a g e 5 1 of R e p o r t P B 4 / 0 9 J A R T a l s o c o n c l u d e d t h a t a l t h o u g h t h e i n t e n t o f N e l s o n s r e h a b i l i t a t i o n p l a n i s t o e n h a n c e c o n n e
Mathematics. Algebra I (PreAP, Pt. 1, Pt. 2) Curriculum Guide. Revised 2016
 Curriculum Guide. Revised 2016") Mathematics Algebra I (PreAP, Pt. 1, Pt. ) Curriculum Guide Revised 016 Intentionally Left Blank Introduction The Mathematics Curriculum Guide serves as a guide for teachers when planning instruction and
Mathematics Algebra I (PreAP, Pt. 1, Pt. ) Curriculum Guide Revised 016 Intentionally Left Blank Introduction The Mathematics Curriculum Guide serves as a guide for teachers when planning instruction and
COWLEY COLLEGE & Area Vocational Technical School
 COWLEY COLLEGE & Area Vocational Technical School COURSE PROCEDURE FOR Student Level: This course is open to students on the college level in their freshman or sophomore year. Catalog Description: INTERMEDIATE
Uncertainty and Graphical Analysis
 Uncertainty and Graphical Analysis Introduction Two measures of the quality of an experimental result are its accuracy and its precision. An accurate result is consistent with some ideal, true value, perhaps
psychological statistics
 psychological statistics B Sc. Counselling Psychology 011 Admission onwards III SEMESTER COMPLEMENTARY COURSE UNIVERSITY OF CALICUT SCHOOL OF DISTANCE EDUCATION CALICUT UNIVERSITY.P.O., MALAPPURAM, KERALA,
UNIT 3 CONCEPT OF DISPERSION
 UNIT 3 CONCEPT OF DISPERSION Structure 3.0 Introduction 3.1 Objectives 3.2 Concept of Dispersion 3.2.1 Functions of Dispersion 3.2.2 Measures of Dispersion 3.2.3 Meaning of Dispersion 3.2.4 Absolute Dispersion
79 1,2 jj8 STATISTICAL PROPERTIES OF ALLOCATION AVERAGES DDC. Research Memorandum C-, Behavioral Science Research Laboratory ,*., U S.
 ,*., Research Memorandum 68-13 STATISTICAL PROPERTIES OF ALLOCATION AVERAGES ID DDC C-, U S. Army.A'ifox public releoael D.tbution Unlimited Behavioral Science Research Laboratory December 1968 79 1,2
Black White Total Observed Expected χ 2 = (f observed f expected ) 2 f expected (83 126) 2 ( )2 126
 2 f expected (83 126) 2 ( )2 126") Psychology 60 Fall 2013 Practice Final Actual Exam: This Wednesday. Good luck! Name: To view the solutions, check the link at the end of the document. This practice final should supplement your studying;
Psychology 60 Fall 2013 Practice Final Actual Exam: This Wednesday. Good luck! Name: To view the solutions, check the link at the end of the document. This practice final should supplement your studying;
Review of Statistics 101
 Review of Statistics 101 We review some important themes from the course 1. Introduction Statistics- Set of methods for collecting/analyzing data (the art and science of learning from data). Provides methods
0 0'0 2S ~~ Employment category
 Analyze Phase 331 60000 50000 40000 30000 20000 10000 O~----,------.------,------,,------,------.------,----- N = 227 136 27 41 32 5 ' V~ 00 0' 00 00 i-.~ fl' ~G ~~ ~O~ ()0 -S 0 -S ~~ 0 ~~ 0 ~G d> ~0~
P a g e 3 6 of R e p o r t P B 4 / 0 9
 P a g e 3 6 of R e p o r t P B 4 / 0 9 p r o t e c t h um a n h e a l t h a n d p r o p e r t y fr om t h e d a n g e rs i n h e r e n t i n m i n i n g o p e r a t i o n s s u c h a s a q u a r r y. J
Electrodynamics and Microwaves 17. Stub Matching Technique in Transmission Lines
 1 Module 17 Stub Matching Technique in Transmission Lines 1. Introduction 2. Concept of matching stub 3. Mathematical Basis for Single shunt stub matching 4.Designing of single stub using Smith chart 5.
401 Review. 6. Power analysis for one/two-sample hypothesis tests and for correlation analysis.
 401 Review Major topics of the course 1. Univariate analysis 2. Bivariate analysis 3. Simple linear regression 4. Linear algebra 5. Multiple regression analysis Major analysis methods 1. Graphical analysis
PSYCHOLOGICAL STATISTICS
 PSYCHOLOGICAL STATISTICS B Sc. Counselling Psychology 011 Admission onwards II SEMESTER COMPLIMETARY COURSE UIVERSITY OF CALICUT SCHOOL OF DISTACE EDUCATIO CALICUT UIVERSITY.P.O., MALAPPURAM, KERALA, IDIA
Lab Day and Time: Instructions. 1. Do not open the exam until you are told to start.
 Name: Lab Day and Time: Instructions 1. Do not open the exam until you are told to start. 2. This exam is closed note and closed book. You are not allowed to use any outside material while taking this
COWLEY COLLEGE & Area Vocational Technical School
 COWLEY COLLEGE & Area Vocational Technical School COURSE PROCEDURE FOR COLLEGE ALGEBRA WITH REVIEW MTH 4421 5 Credit Hours Student Level: This course is open to students on the college level in the freshman
JEFFERSON COLLEGE COURSE SYLLABUS MTH 110 INTRODUCTORY ALGEBRA. 3 Credit Hours. Prepared by: Skyler Ross & Connie Kuchar September 2014
 JEFFERSON COLLEGE COURSE SYLLABUS MTH 110 INTRODUCTORY ALGEBRA 3 Credit Hours Prepared by: Skyler Ross & Connie Kuchar September 2014 Dr. Robert Brieler, Division Chair, Math & Science Ms. Shirley Davenport,
Time: 1 hour 30 minutes
 Paper Reference(s) 6684/01 Edexcel GCE Statistics S Silver Level S4 Time: 1 hour 30 minutes Materials required for examination papers Mathematical Formulae (Green) Items included with question Nil Candidates
COWLEY COLLEGE & Area Vocational Technical School
 COWLEY COLLEGE & Area Vocational Technical School COURSE PROCEDURE FOR ELEMENTARY ALGEBRA WITH REVIEW EBM4404 3 Credit Hours Student Level: College Preparatory Catalog Description: EBM4404 ELEMENTARY ALGEBRA
Lab Day and Time: Instructions. 1. Do not open the exam until you are told to start.
 Name: Lab Day and Time: Instructions 1. Do not open the exam until you are told to start. 2. This exam is closed note and closed book. You are not allowed to use any outside material while taking this
COWLEY COLLEGE & Area Vocational Technical School
 COWLEY COLLEGE & Area Vocational Technical School COURSE PROCEDURE FOR Student Level: This course is open to students on the college level in their freshman year. Catalog Description: MTH4410 - INTERMEDIATE
Analysis of Variance and Co-variance. By Manza Ramesh
 Analysis of Variance and Co-variance By Manza Ramesh Contents Analysis of Variance (ANOVA) What is ANOVA? The Basic Principle of ANOVA ANOVA Technique Setting up Analysis of Variance Table Short-cut Method
COWLEY COLLEGE & Area Vocational Technical School
 COWLEY COLLEGE & Area Vocational Technical School COURSE PROCEDURE FOR Student Level: College Preparatory ELEMENTARY ALGEBRA EBM4405 3 Credit Hours Catalog Description: EBM4405 - ELEMENTARY ALGEBRA (3
Time: 1 hour 30 minutes
 Paper Reference(s) 6684/01 Edexcel GCE Statistics S2 Gold Level G3 Time: 1 hour 30 minutes Materials required for examination papers Mathematical Formulae (Green) Items included with question Nil Candidates
4.01 Elements, Symbols and Periodic Table
 .0 Elements, Symbols and Periodic Table Dr. Fred O. Garces Chemistry 00 Miramar College.0 Elements, symbols and the Periodic Table Aug The Elements: Building block of Matter The periodic table of the chemical
Unit 1.1 Equations. Quarter 1. Section Days Lesson Notes. Algebra 1 Unit & Lesson Overviews Mathematics Variables and Expressions
 Unit 1.1 Equations Quarter 1 Section Days Lesson Notes 1.1 1 Variables and Expressions 1.2 1.3 1 Solving Equations by Addition, Subtraction, Multiplying or Dividing 1.4 1 Solving Two-Step and Multi-Step
JEFFERSON COLLEGE COURSE SYLLABUS MTH 110 INTRODUCTORY ALGEBRA. 3 Credit Hours. Prepared by: Skyler Ross & Connie Kuchar September 2014
 JEFFERSON COLLEGE COURSE SYLLABUS MTH 110 INTRODUCTORY ALGEBRA 3 Credit Hours Prepared by: Skyler Ross & Connie Kuchar September 2014 Ms. Linda Abernathy, Math, Science, & Business Division Chair Ms. Shirley
Chemistry 1 First Lecture Exam Fall Abbasi Khajo Levine Mathias Mathias/Ortiz Metlitsky Rahi Sanchez-Delgado Vasserman
 Chemistry 1 First Lecture Exam Fall 2011 Page 1 of 9 NAME Circle the name of your recitation/lab instructor(s) Abbasi Khajo Levine Mathias Mathias/Ortiz Metlitsky Rahi Sanchez-Delgado Vasserman Before
Algebra I. Mathematics Curriculum Framework. Revised 2004 Amended 2006
 Algebra I Mathematics Curriculum Framework Revised 2004 Amended 2006 Course Title: Algebra I Course/Unit Credit: 1 Course Number: Teacher Licensure: Secondary Mathematics Grades: 9-12 Algebra I These are
Metallurgical Chemistry. An Audio Course for Students
 Laval University From the SelectedWorks of Fathi Habashi February, 1987 Metallurgical Chemistry. An Audio Course for Students Fathi Habashi Available at: https://works.bepress.com/fathi_habashi/27/ METALLURGICAL
o Alphabet Recitation
 Letter-Sound Inventory (Record Sheet #1) 5-11 o Alphabet Recitation o Alphabet Recitation a b c d e f 9 h a b c d e f 9 h j k m n 0 p q k m n 0 p q r s t u v w x y z r s t u v w x y z 0 Upper Case Letter
Math 221, REVIEW, Instructor: Susan Sun Nunamaker
 Math 221, REVIEW, Instructor: Susan Sun Nunamaker Good Luck & Contact me through through e-mail if you have any questions. 1. Bar graphs can only be vertical. a. true b. false 2.
Instructions. 1. Do not open the exam until you are told to start.
 Name: Lab Day and Time: Instructions 1. Do not open the exam until you are told to start. 2. This exam is closed note and closed book. You are not allowed to use any outside material while taking this
Undergraduate Notes in Mathematics. Arkansas Tech University Department of Mathematics. College Algebra for STEM
 Undergraduate Notes in Mathematics Arkansas Tech University Department of Mathematics College Algebra for STEM Marcel B. Finan c All Rights Reserved 2015 Edition To my children Amin & Nadia Preface From
F l a s h-b a s e d S S D s i n E n t e r p r i s e F l a s h-b a s e d S S D s ( S o-s ltiad t e D r i v e s ) a r e b e c o m i n g a n a t t r a c
 a r e b e c o m i n g a n a t t r a c") L i f e t i m e M a n a g e m e n t o f F l a-b s ah s e d S S D s U s i n g R e c o v e r-a y w a r e D y n a m i c T h r o t t l i n g S u n g j i n L e, e T a e j i n K i m, K y u n g h o, Kainmd J
L i f e t i m e M a n a g e m e n t o f F l a-b s ah s e d S S D s U s i n g R e c o v e r-a y w a r e D y n a m i c T h r o t t l i n g S u n g j i n L e, e T a e j i n K i m, K y u n g h o, Kainmd J
Author : Dr. Pushpinder Kaur. Educational Statistics: Mean Median and Mode
 B.ED. PART- II ACADEMIC SESSION : 2017-2018 PAPER XVIII Assessment for Learning Lesson No. 8 Author : Dr. Pushpinder Kaur Educational Statistics: Mean Median and Mode MEAN : The mean is the average value
Psych Jan. 5, 2005
 Psych 124 1 Wee 1: Introductory Notes on Variables and Probability Distributions (1/5/05) (Reading: Aron & Aron, Chaps. 1, 14, and this Handout.) All handouts are available outside Mija s office. Lecture
CATAVASII LA NAȘTEREA DOMNULUI DUMNEZEU ȘI MÂNTUITORULUI NOSTRU, IISUS HRISTOS. CÂNTAREA I-A. Ήχος Πα. to os se e e na aș te e e slă ă ă vi i i i i
 CATAVASII LA NAȘTEREA DOMNULUI DUMNEZEU ȘI MÂNTUITORULUI NOSTRU, IISUS HRISTOS. CÂNTAREA I-A Ήχος α H ris to os s n ș t slă ă ă vi i i i i ți'l Hris to o os di in c ru u uri, în tâm pi i n ți i'l Hris
School District of Marshfield Course Syllabus
 School District of Marshfield Course Syllabus Course Name: Algebra I Length of Course: 1 Year Credit: 1 Program Goal(s): The School District of Marshfield Mathematics Program will prepare students for
STANDARDIZATION OF BLENDED NECTAR USING BANANA PSEUDOSTEM SAP AND MANGO PULP SANTOSH VIJAYBHAI PATEL
 STANDARDIZATION OF BLENDED NECTAR USING BANANA PSEUDOSTEM SAP AND MANGO PULP BY SANTOSH VIJAYBHAI PATEL B.Sc. (Hons.) Horticulture DEPARTMENT OF POST HARVEST TECHNOLOGY ASPEE COLLEGE OF HORTICULTURE AND
Chapter 3 Data Description
 Chapter 3 Data Description Section 3.1: Measures of Central Tendency Section 3.2: Measures of Variation Section 3.3: Measures of Position Section 3.1: Measures of Central Tendency Definition of Average
Executive Committee and Officers ( )
") Gifted and Talented International V o l u m e 2 4, N u m b e r 2, D e c e m b e r, 2 0 0 9. G i f t e d a n d T a l e n t e d I n t e r n a t i o n a2 l 4 ( 2), D e c e m b e r, 2 0 0 9. 1 T h e W o r
Gifted and Talented International V o l u m e 2 4, N u m b e r 2, D e c e m b e r, 2 0 0 9. G i f t e d a n d T a l e n t e d I n t e r n a t i o n a2 l 4 ( 2), D e c e m b e r, 2 0 0 9. 1 T h e W o r
SUPPORTING INFORMATION ALGEBRA II. Texas Education Agency
 SUPPORTING INFORMATION ALGEBRA II Texas Education Agency The materials are copyrighted (c) and trademarked (tm) as the property of the Texas Education Agency (TEA) and may not be reproduced without the
9 Correlation and Regression
 9 Correlation and Regression SW, Chapter 12. Suppose we select n = 10 persons from the population of college seniors who plan to take the MCAT exam. Each takes the test, is coached, and then retakes the
7.2. Matrix Multiplication. Introduction. Prerequisites. Learning Outcomes
 Matrix Multiplication 7.2 Introduction When we wish to multiply matrices together we have to ensure that the operation is possible - and this is not always so. Also, unlike number arithmetic and algebra,
Dr. Junchao Xia Center of Biophysics and Computational Biology. Fall /1/2016 1/46
 BIO5312 Biostatistics Lecture 10:Regression and Correlation Methods Dr. Junchao Xia Center of Biophysics and Computational Biology Fall 2016 11/1/2016 1/46 Outline In this lecture, we will discuss topics
Ø Set of mutually exclusive categories. Ø Classify or categorize subject. Ø No meaningful order to categorization.
 Statistical Tools in Evaluation HPS 41 Fall 213 Dr. Joe G. Schmalfeldt Types of Scores Continuous Scores scores with a potentially infinite number of values. Discrete Scores scores limited to a specific
Chapter 9. Correlation and Regression
 Chapter 9 Correlation and Regression Lesson 9-1/9-2, Part 1 Correlation Registered Florida Pleasure Crafts and Watercraft Related Manatee Deaths 100 80 60 40 20 0 1991 1993 1995 1997 1999 Year Boats in
May 2015 Timezone 2 IB Maths Standard Exam Worked Solutions
 May 015 Timezone IB Maths Standard Exam Worked Solutions 015, Steve Muench steve.muench@gmail.com @stevemuench Please feel free to share the link to these solutions http://bit.ly/ib-sl-maths-may-015-tz
Chapter 12 The Atom & Periodic Table- part 2
 Chapter 12 The Atom & Periodic Table- part 2 Electrons found outside the nucleus; negatively charged Protons found in the nucleus; positive charge equal in magnitude to the electron s negative charge Neutrons
Glossary. The ISI glossary of statistical terms provides definitions in a number of different languages:
 Glossary The ISI glossary of statistical terms provides definitions in a number of different languages: http://isi.cbs.nl/glossary/index.htm Adjusted r 2 Adjusted R squared measures the proportion of the
Software Process Models there are many process model s in th e li t e ra t u re, s om e a r e prescriptions and some are descriptions you need to mode
 Unit 2 : Software Process O b j ec t i ve This unit introduces software systems engineering through a discussion of software processes and their principal characteristics. In order to achieve the desireable
Algebra II: Course Map--2013
 Algebra II: Course Map--2013 Course Title: Algebra II Text: Algebra 2 (Holt, Rinehart and Winston) Duration: Two semesters Frequency: One class period daily Year: 2013/2014 Areas to be evaluated: Simplifying
Using the Periodic Table
 MATH SKILLS TRANSPARENCY WORKSHEET Using the Periodic Table 6 Use with Chapter 6, Section 6.2 1. Identify the number of valence electrons in each of the following elements. a. Ne e. O b. K f. Cl c. B g.
Experimental Uncertainty (Error) and Data Analysis
 and Data Analysis") Experimental Uncertainty (Error) and Data Analysis Advance Study Assignment Please contact Dr. Reuven at yreuven@mhrd.org if you have any questions Read the Theory part of the experiment (pages 2-14) and
Experimental Uncertainty (Error) and Data Analysis Advance Study Assignment Please contact Dr. Reuven at yreuven@mhrd.org if you have any questions Read the Theory part of the experiment (pages 2-14) and
13.7 ANOTHER TEST FOR TREND: KENDALL S TAU
 13.7 ANOTHER TEST FOR TREND: KENDALL S TAU In 1969 the U.S. government instituted a draft lottery for choosing young men to be drafted into the military. Numbers from 1 to 366 were randomly assigned to
11.5 Regression Linear Relationships
 Contents 11.5 Regression............................. 835 11.5.1 Linear Relationships................... 835 11.5.2 The Least Squares Regression Line........... 837 11.5.3 Using the Regression Line................
Big Data Analysis with Apache Spark UC#BERKELEY
 Big Data Analysis with Apache Spark UC#BERKELEY This Lecture: Relation between Variables An association A trend» Positive association or Negative association A pattern» Could be any discernible shape»
Matrix Operations and Equations
 C H A P T ER Matrix Operations and Equations 200 Carnegie Learning, Inc. Shoe stores stock various sizes and widths of each style to accommodate buyers with different shaped feet. You will use matrix operations
Linear Equations. 196 minutes. 191 marks. Page 1 of 50
 Linear Equations 196 minutes 191 marks Page 1 of 50 Q1. The perimeter of this L-shape is 56 cm. Not drawn accurately Set up and solve an equation to work out the value of x. x =... (Total 4 marks) Page
Marketing Research Session 10 Hypothesis Testing with Simple Random samples (Chapter 12)
") Marketing Research Session 10 Hypothesis Testing with Simple Random samples (Chapter 12) Remember: Z.05 = 1.645, Z.01 = 2.33 We will only cover one-sided hypothesis testing (cases 12.3, 12.4.2, 12.5.2,
Marketing Research Session 10 Hypothesis Testing with Simple Random samples (Chapter 12) Remember: Z.05 = 1.645, Z.01 = 2.33 We will only cover one-sided hypothesis testing (cases 12.3, 12.4.2, 12.5.2,
STAT FINAL EXAM
 STAT101 2013 FINAL EXAM This exam is 2 hours long. It is closed book but you can use an A-4 size cheat sheet. There are 10 questions. Questions are not of equal weight. You may need a calculator for some
Future Self-Guides. E,.?, :0-..-.,0 Q., 5...q ',D5', 4,] 1-}., d-'.4.., _. ZoltAn Dbrnyei Introduction. u u rt 5,4) ,-,4, a. a aci,, u 4.
![Future Self-Guides. E,.?, :0-..-.,0 Q., 5...q ',D5', 4,] 1-}., d-'.4.., _. ZoltAn Dbrnyei Introduction. u u rt 5,4) ,-,4, a. a aci,, u 4.](/thumbs/92/109036622.jpg "Future Self-Guides. E,.?, :0-..-.,0 Q., 5...q ',D5', 4,] 1-}., d-'.4.., _. ZoltAn Dbrnyei Introduction. u u rt 5,4) ,-,4, a. a aci,, u 4.") te SelfGi ZltAn Dbnyei Intdtin ; ) Q) 4 t? ) t _ 4 73 y S _ E _ p p 4 t t 4) 1_ ::_ J 1 `i () L VI O I4 " " 1 D 4 L e Q) 1 k) QJ 7 j ZS _Le t 1 ej!2 i1 L 77 7 G (4) 4 6 t (1 ;7 bb F) t f; n (i M Q) 7S
te SelfGi ZltAn Dbnyei Intdtin ; ) Q) 4 t? ) t _ 4 73 y S _ E _ p p 4 t t 4) 1_ ::_ J 1 `i () L VI O I4 " " 1 D 4 L e Q) 1 k) QJ 7 j ZS _Le t 1 ej!2 i1 L 77 7 G (4) 4 6 t (1 ;7 bb F) t f; n (i M Q) 7S
Lab Day and Time: Instructions. 1. Do not open the exam until you are told to start.
 Name: Lab Day and Time: Instructions 1. Do not open the exam until you are told to start. 2. This exam is closed note and closed book. You are not allowed to use any outside material while taking this
PhysicsAndMathsTutor.com. Mark Scheme (Results) Summer Pearson Edexcel GCE in Mechanics 1 (6677_01)
 Summer Pearson Edexcel GCE in Mechanics 1 (6677_01)") Mark Scheme (Results) Summer 2016 Pearson Edexcel GCE in Mechanics 1 (6677_01) Edexcel and BTEC Qualifications Edexcel and BTEC qualifications are awarded by Pearson, the UK s largest awarding body. We
Mark Scheme (Results) Summer 2016 Pearson Edexcel GCE in Mechanics 1 (6677_01) Edexcel and BTEC Qualifications Edexcel and BTEC qualifications are awarded by Pearson, the UK s largest awarding body. We
Last 4 Digits of USC ID:
 Chemistry 05 B Practice Exam Dr. Jessica Parr First Letter of last Name PLEASE PRINT YOUR NAME IN BLOCK LETTERS Name: Last 4 Digits of USC ID: Lab TA s Name: Question Points Score Grader 8 2 4 3 9 4 0
ON DIVISION ALGEBRAS*
 ON DIVISION ALGEBRAS* BY J. H. M. WEDDERBURN 1. The object of this paper is to develop some of the simpler properties of division algebras, that is to say, linear associative algebras in which division
Essentials of expressing measurement uncertainty
 Essentials of expressing measurement uncertainty This is a brief summary of the method of evaluating and expressing uncertainty in measurement adopted widely by U.S. industry, companies in other countries,
PROGRAM EVALUATION: COMPUTER AND ELECTRONICS TECHNOLOGY. OIR Report No
 PROGRAM EVALUATION: COMPUTER AND ELECTRONICS TECHNOLOGY OIR Report No. 07-06 COMPUTER AND ELECTRONICS TECHNOLOGY, A.A.S., ELECTRONICS TECHNICIAN, CERTIFICATE FALL 2001 TO FALL 2005 Office of Institutional
Algebra 2 Mississippi College- and Career- Readiness Standards for Mathematics RCSD Unit 1 Data Relationships 1st Nine Weeks
 1 st Nine Weeks Algebra 2 Mississippi College- and Career- Readiness Standards for Mathematics Unit 1 Data Relationships Level 4: I can interpret key features of graphs and tables in terms of the quantities.
High School Algebra I Scope and Sequence by Timothy D. Kanold
 High School Algebra I Scope and Sequence by Timothy D. Kanold First Semester 77 Instructional days Unit 1: Understanding Quantities and Expressions (10 Instructional days) N-Q Quantities Reason quantitatively
PRACTICE TEST ANSWER KEY & SCORING GUIDELINES INTEGRATED MATHEMATICS I
 Ohio s State Tests PRACTICE TEST ANSWER KEY & SCORING GUIDELINES INTEGRATED MATHEMATICS I Table of Contents Questions 1 29: Content Summary and Answer Key... iii Question 1: Question and Scoring Guidelines...
4 Grouping Variables in Regression
 4 Grouping Variables in Regression Qualitative variables as predictors So far, we ve considered two kinds of regression models: 1. A numerical response with a categorical or grouping predictor. Here, we
Chem Exam 1. September 26, Dr. Susan E. Bates. Name 9:00 OR 10:00
 Chem 1711 Exam 1 September 26, 2013 Dr. Susan E. Bates Name 9:00 OR 10:00 N A = 6.022 x 10 23 mol 1 I A II A III B IV B V B VI B VII B VIII I B II B III A IV A V A VI A VII A inert gases 1 H 1.008 3 Li
Module 1 Linear Regression
 Regression Analysis Although many phenomena can be modeled with well-defined and simply stated mathematical functions, as illustrated by our study of linear, exponential and quadratic functions, the world
Ohio s State Tests ITEM RELEASE SPRING 2017 GRADE 8 MATHEMATICS
 Ohio s State Tests ITEM RELEASE SPRING 2017 GRADE 8 MATHEMATICS Table of Contents Questions 1 22: Content Summary and Answer Key... iii Question 1: Question and Scoring Guidelines... 1 Question 1: Sample
STANDARDS OF LEARNING CONTENT REVIEW NOTES. ALGEBRA I Part II 1 st Nine Weeks,
 STANDARDS OF LEARNING CONTENT REVIEW NOTES ALGEBRA I Part II 1 st Nine Weeks, 2016-2017 OVERVIEW Algebra I Content Review Notes are designed by the High School Mathematics Steering Committee as a resource
QUANTITATIVE TECHNIQUES
 UNIVERSITY OF CALICUT SCHOOL OF DISTANCE EDUCATION (For B Com. IV Semester & BBA III Semester) COMPLEMENTARY COURSE QUANTITATIVE TECHNIQUES QUESTION BANK 1. The techniques which provide the decision maker
Statistics 100 Exam 2 March 8, 2017
 STAT 100 EXAM 2 Spring 2017 (This page is worth 1 point. Graded on writing your name and net id clearly and circling section.) PRINT NAME (Last name) (First name) net ID CIRCLE SECTION please! L1 (MWF
Overview of Dispersion. Standard. Deviation
 15.30 STATISTICS UNIT II: DISPERSION After reading this chapter, students will be able to understand: LEARNING OBJECTIVES To understand different measures of Dispersion i.e Range, Quartile Deviation, Mean
PELLISSIPPI STATE COMMUNITY COLLEGE MASTER SYLLABUS CALCULUS III MATH 2110
 PELLISSIPPI STATE COMMUNITY COLLEGE MASTER SYLLABUS CALCULUS III MATH 2110 Class Hours: 4.0 Credit Hours: 4.0 Laboratory Hours: 0.0 Revised: Fall 2012 Catalog Course Description: Calculus of functions
WISE International Masters
 WISE International Masters ECONOMETRICS Instructor: Brett Graham INSTRUCTIONS TO STUDENTS 1 The time allowed for this examination paper is 2 hours. 2 This examination paper contains 32 questions. You are
Mark Scheme (Results) June Pearson Edexcel International GCSE Mathematics A (4MA0) Paper 4HR
 June Pearson Edexcel International GCSE Mathematics A (4MA0) Paper 4HR") Mark Scheme (Results) June 016 Pearson Edexcel International GCSE Mathematics A (4MA0) Paper 4HR Edexcel and BTEC Qualifications Edexcel and BTEC qualifications come from Pearson, the world s leading learning
Mark Scheme (Results) June 016 Pearson Edexcel International GCSE Mathematics A (4MA0) Paper 4HR Edexcel and BTEC Qualifications Edexcel and BTEC qualifications come from Pearson, the world s leading learning
Algebra 1 Syllabus
 Algebra 1 Syllabus 2017-18 dennis_jenkins@crpusd.org Welcome to algebra, a course designed to prepare students for geometry and any other courses taken after it. Students are required by the state of California
Lab 5. Simple Pendulum
 Lab 5. Simple Pendulum Goals To design and perform experiments that show what factors, or parameters, affect the time required for one oscillation of a compact mass attached to a light string (a simple
Your use of the JSTOR archive indicates your acceptance of the Terms & Conditions of Use, available at
 Regression Analysis when there is Prior Information about Supplementary Variables Author(s): D. R. Cox Source: Journal of the Royal Statistical Society. Series B (Methodological), Vol. 22, No. 1 (1960),
79 Wyner Math Academy I Spring 2016
 79 Wyner Math Academy I Spring 2016 CHAPTER NINE: HYPOTHESIS TESTING Review May 11 Test May 17 Research requires an understanding of underlying mathematical distributions as well as of the research methods
375 PU M Sc Statistics
 375 PU M Sc Statistics 1 of 100 193 PU_2016_375_E For the following 2x2 contingency table for two attributes the value of chi-square is:- 20/36 10/38 100/21 10/18 2 of 100 120 PU_2016_375_E If the values
Mathematics Standards for High School Financial Algebra A and Financial Algebra B
 Mathematics Standards for High School Financial Algebra A and Financial Algebra B Financial Algebra A and B are two semester courses that may be taken in either order or one taken without the other; both
CENTRAL TEXAS COLLEGE-FORT RILEY SYLLABUS FOR DSMA 0301 DEVELOPMENTAL MATHEMATICS II SEMESTER HOURS CREDIT: 3 FALL 2014 SYLLABUS (08/11/14 10/05/14)
") CENTRAL TEXAS COLLEGE-FORT RILEY SYLLABUS FOR DSMA 0301 DEVELOPMENTAL MATHEMATICS II SEMESTER HOURS CREDIT: 3 FALL 2014 SYLLABUS (08/11/14 10/05/14) Instructor: Kenneth Kolembe E-mail: Kenneth.Kolembe@ctcd.edu.
CENTRAL TEXAS COLLEGE-FORT RILEY SYLLABUS FOR DSMA 0301 DEVELOPMENTAL MATHEMATICS II SEMESTER HOURS CREDIT: 3 FALL 2014 SYLLABUS (08/11/14 10/05/14) Instructor: Kenneth Kolembe E-mail: Kenneth.Kolembe@ctcd.edu.
AP Final Review II Exploring Data (20% 30%)
") AP Final Review II Exploring Data (20% 30%) Quantitative vs Categorical Variables Quantitative variables are numerical values for which arithmetic operations such as means make sense. It is usually a measure
AP Final Review II Exploring Data (20% 30%) Quantitative vs Categorical Variables Quantitative variables are numerical values for which arithmetic operations such as means make sense. It is usually a measure
Scatterplots. STAT22000 Autumn 2013 Lecture 4. What to Look in a Scatter Plot? Form of an Association
 Scatterplots STAT22000 Autumn 2013 Lecture 4 Yibi Huang October 7, 2013 21 Scatterplots 22 Correlation (x 1, y 1 ) (x 2, y 2 ) (x 3, y 3 ) (x n, y n ) A scatter plot shows the relationship between two
INTRODUCTION TO ANALYSIS OF VARIANCE
 CHAPTER 22 INTRODUCTION TO ANALYSIS OF VARIANCE Chapter 18 on inferences about population means illustrated two hypothesis testing situations: for one population mean and for the difference between two