M alaya Saurava D ash
|
|
|
- Barbara Allison
- 5 years ago
- Views:
Transcription
1 SYNTHESIS AND ELECTRICAL CHARACTERISATION OF LANTHANUM DOPED BARIUM TITANATE ZIRCONATE A thesis submitted to NIT Rourkela in partial fulfillment of the requirement for the degree of D octor of Philosophy In E lectrical E ngineering B y M alaya Saurava D ash Department of Electrical Engineering National Institute of Technology Rourkela , India March 2009
2 To my parents with love
3 Acknowledgement First of all, I would like to express my deep sense of respect and gratitude towards my guide Prof (Dr) Saradindu Ghosh and Dr Japes Bera, who have been the guiding force behind this work. I want to thank them for introducing me to the field of Dielectrics and Insulation and giving me the opportunity to work. I am greatly indebted to them for their constant encouragement and invaluable advice in every aspect of my academic life. Their presence and optimism have provided an invaluable influence on my career and outlook for the future I consider it my good fortune to have got an opportunity to work with such wonderful persons. Next, I would like to express my respects to Prof(Dr.) P. K. Nanda, Prof(Dr.) J. K. Satapathy and Prof(Dr.) S.K. Bhattacharya for teaching me and also helping me how to learn. They have been great sources of inspiration to me and I thank them from the bottom of my heart. I would like to thank all faculty members and staff of the Department of Electrical Engineering and Ceramic Engineering, N.I.T. Rourkela for their generous help in various ways for the completion of this thesis. I would also like to mention the names of Prof (Dr.) S. Adak, Dr. S. Pratihar and Dr. K. B. Mohanty for helping me a lot during the thesis period. I would like to thank my classmates, especially Yugo, Rana, P.K. Kanungo and P. K. Roy from whom I learned a lot and whose companionship I enjoyed so much during my stay at NIT, Rourkela. I am especially indebted to my parents for their love, sacrifice, and support. They are my first teachers after I came to this world and have set great examples for me about how to live, study, and work. Malaya Saurava Dash Roll No: Dept of EE, NIT, Rourkela
4
5 ABSTRACT BaTi 0.6 Zr 0.4 O 3 powder was prepared from powders containing barium oxalate hydrate, zirconium oxy-hydroxide and titanium dioxide. Barium oxalate hydrate and zirconium oxy-hydroxide were precipitated from nitrate solution onto the surface of suspended TiO 2. Phase formation behaviour of the materials was extensively studied using XRD. BaTiO 3 (BT) and BaZrO 3 (BZ) start forming separately in the system upon calcinations in the temperature range o C. BT-BZ solid solution then forms by diffusion of BT into BZ from 1050 o C onwards. The precursor completely transforms into BaTi 0.6 Zr 0.4 O 3 (BTZ) at 1200 o C for 2 hours calcinations. The activation energy of BT (134 kj mol -1 ) formation was found to be less than that of BZ (167.5 kj mol -1 ) formation. BTZ formation requires kj mol -1 of energy. The sintering kinetics of the powder was studied using thermal analyzer. The mean activation energy for sintering was found to be 550 kj mol -1. Lanthanum doped BaTi 0.6 Zr 0.4 O 3 compositions Ba 1-x La x Ti 0.6[1-(5x/12)] Zr 0.4 O 3, Ba 1- xla x (Ti 0.6 Zr 0.4[1-(5x/8)] )O 3 and Ba 1-x La x (Ti 0.6[1-x/4] Zr 0.4[1-x/4] )O 3 with x = 0.005, 0.01, 0.02, 0.05 and 0.1 were synthesized. Perovskite phases were observed for all compositions without existence of any secondary phases. A gradual shift of diffraction peak to the higher angle with increasing lanthanum percentage reveals the contraction of perovskite lattice. The sintering behaviour was studied using thermal analyzer. Sinterability of the dielectrics decreases with increasing lanthanum substitution. The frequency dependence of dielectric permittivity and tan δ of the ceramics were investigated. It was found that both dielectric permittivity and tan δ decreases with increase in lanthanum percentage. Room temperature permittivity of lanthanum doped dielectrics was highly stable against change in frequency. The resistivity and current density were measured for the ceramics. It was noticed that resistivity decreases slightly at 0.5 atom % lanthanum substitution and then gradually increases with increasing the concentration. Dielectric measurements were carried on porous samples. It was noted that dielectric permittivity decreases and tan δ increases with increase in porosity.
6 The temperature dependence of dielectric permittivity and tan δ of lanthanum doped BaTi 0.6 Zr 0.4 O 3 samples has been investigated. The results show that the phase transition temperature T m shifts towards low temperature with increasing La content. The dielectric response of the ceramics at various frequencies shows a diffuse phase transition around the transition temperature T m. The degree of diffuseness of the phase transition implies the existence of a composition-induced diffuse phase transition of the ceramics where relatively large separation between maximum of real and imaginary parts of dielectric spectrum exist. The transition temperature T m is moved toward higher temperatures with increasing frequency. A γ value of 1.89 from modified Curie-Weiss law implies diffuse phase transition behaviour of the ceramics and show relaxor-like behavior with a strong frequency dispersion of the T m. The ceramics obey the empirical Vogel Fulcher relation, which again confirms the relaxor behavior.. In recent years, significant progress has been achieved in the development of a class of artificial intelligent systems. This growing new class of technology has been applied successfully to a wide variety of applications. Artificial neural networks (ANNs) are relatively new computational tools and their inherent ability to learn and recognize highly non-linear and complex relationships makes them ideally suited in solving a wide range of complex real-world problems. Over the last decade chemistry became a field of their wide application. Nevertheless, few have been known of the application of ANN modeling technique in inorganic ceramic materials. The experimental results of undoped and lanthanum doped BaTi 0.6 Zr 0.4 O 3 were analyzed by back propagation (BP) network modeling. The combination of ANN parameters for best result in modeling was identified. The modeled values closely follow the experimental values suggesting the effectiveness of the proposed modeling and indicate that the ANN with BPA can be used for estimation of electrical properties of the dielectrics. Thus, ANN based modeling proved to be a very useful tool in dealing with problems encountered in dielectric ceramics.
7 CONTENTS Acknowledgement Certificate Abstract Table of contents List of figures i ii iii v viii CHAPTER 1 INTRODUCTION AND BACKGROUND 1.1 Introduction Ferroelectricity and polarization Perovskite crystal structure and ferroelectricity Ferroelectric phase transitions and Curie-Weiss law Characteristics of relaxor ferroelectrics Structural origin of relaxor ferroelectrics Organisation of the thesis 11 CHAPTER 2 LITERATURE REVIEW 2.1 Introduction Synthesis of Ba(Ti,Zr)O Synthesis of La doped Ba(Ti,Zr)O Effect of Zr in Ba(Ti,Zr)O Effect of La doping in Ba(Ti,Zr)O Effect of porosity on the electrical properties Artificial neural network application Summary and scope of work Objectives of present work 22
8 CHAPTER 3 SYNTHESIS AND CHARACTERISATION OF POWDER 3.1 Introduction Ba(Ti 0.6 Zr 0.4 )O Experimental procedure Results and discussion Conclusion La doped Ba(Ti 0.6 Zr 0.4 )O Introduction Experimental procedure Results and discussion Conclusion 45 CHAPTER 4 ELECTRICAL CHARACTERIZATION 4.1 Introduction Dielectric properties Experimental procedure Result and discussion Conclusion Effect of porosity on dielectric properties Experimental procedure Result and discussion Conclusion Relaxor study of lanthanum doped BaTi 0.6 Zr 0.4 O Experimental procedure Result and discussion Conclusion Resistivity and current density at low electric field Introduction 77
9 4.5.2 Experimental procedure Result and discussion Conclusion 83 CHAPTER 5 ARTIFICIAL NEURAL NETWORK MODELLING 5.1 Introduction Multilayer Feedforward Network ANN modeling Result and discussion Conclusions 96 CHAPTER 6 MAJOR CONCLUSIONS AND FUTURE WORK 6.1 Introduction Summary Conclusions Future work 99 REFERENCES 100 RESEARCH PUBLICATIONS 107
10 LIST OF FIGURES Fig.1.1 Dipole placed at distance r. 2 Fig.1.2 ABO 3 perovskite-type unit cell. 3 Fig.1.3 Relative permittivities measured along a and c directions of a poled tetragonal BaTiO 3 crystal versus temperature. 5 Fig.1.4 Temperature dependence of dielectric permittivity and spontaneous polarization for (a) first, (b) second and (c) relaxor ferroelectric. 5 Fig.1.5 Variation of the dielectric properties of a relaxor ferroelectric with temperature at frequencies of 1KHz to 1MHz, (a) dielectric permittivity and (b) dissipation factor. 6 Fig.1.6 Temperature dependence of reciprocal permittivity of Pb(Mg 1/3 Nb 2/3 )O 3. 7 Fig.1.7 (a) Free energy V s polarization in the phenomenological theory (b) Local atomic potential along a line through two off-centered B-sites. 9 Fig.1.8 Temperature dependence (a) dielectric constant and (b) tan δ of BaZr 0.4 Ti 0.6 O 3 measured at different frequencies. 10 Fig.3.1 DSC-TG tracing of precursor powder for Ba(Ti 0.6 Zr 0.4 )O 3 synthesis. 28 Fig.3.2 XRD pattern of (a) precursor powder and precursor calcined at (b) 400 o C, (c) 700 o C, (d) 1200 o C. 29 Fig.3.3 XRD patterns of precursor powder calcined for 2h at (a) 600 o C, (b) 700 o C, (c) 800 o C, (d) 900 o C, (e) 1100 o C, (f) 1200 o C and (g) for16h at 1200 o C. 30 Fig.3.4 Non-isothermal transformation kinetics of precursor in static air. 31 Fig.3.5 Arrhenius dependence of reaction rate on calcinations temperature for the transformation of precursors to BaTiO 3 ( ) and BaZrO 3 ( ) and then to BaTi 0.6 Zr 0.4 O 3 solid solution ( ) and their calculated activation energy (AE). 33 Fig.3.6 Shrinkage curves for Ba(Ti 0.6 Zr 0.4 )O 3 ceramics at different constant
11 heating rates. 35 Fig.3.7 Data in figure replotted according to equation (3.9). 35 Fig.3.8 Determination of activation-energy at different constant heating rates for the shrinkage data obtained non-isothermally represented in Fig Fig.3.9 XRD patterns for (a) raw precursor and precursors calcined at (b) 400 o C, (c) 700 o C, (d) 1200 o C of the composition Ba 0.98 La 0.02 (Ti Zr 0.4 )O Fig.3.10 XRD patterns of Ba 0.98 La 0.02 (Ti Zr 0.4 )O 3 precursor powder calcined for 2h at (a) 750 o C, (b) 850 o C, (c) 1000 o C, (d) 1100 o C and (e) calcined for 4h at 1200 o C. 42 Fig.3.11 XRD patterns for Ba (1-x) La x Ti 0.6[1-(5x/12)] Zr 0.4 O 3 with x values (a) 0, (b) 0.005, (c) 0.01, (d) 0.02, (e) 0.05 and (f) Fig.3.12 XRD patterns for Ba 1-x La x (Ti 0.6 Zr 0.4[1-(5x/8)] )O 3 with x values (a) 0, (b) 0.005, (c) 0.01, (d) 0.02, (e) 0.05 and (f) Fig.3.13 Shrinkage curves for the composition Ba 1-x La x (Ti 0.6 Zr 0.4 ) 1-x/4 O 3 with x values (a) 0, (b) 0.02 and (c) 0.1 at heating rate of 10 o C/min. 44 Fig.4.1 Flow chart for specimen fabrication, sintering and characterization 47 Fig.4.2 Typical sintering profile of BTZ specimens at 1300 C for 4hrs. 49 Fig.4.3 Schematic electrode arrangement on the sintered pellet sample. 51 Fig.4.4 SEM micro structure of Ba (1-x) La x Ti 0.6[1-(5x/12)] Zr 0.4 O 3 with x values (a) 0, (b) 0.005, (c) 0.01, (d) 0.02, (e) 0.05 and (f) Fig.4.5 SEM micro structure of Ba (1-x) La x (Ti 0.6 Zr 0.4[1-(5x/8)] )O 3 with x values (a) 0, (b) 0.005, (c) 0.01, (d) 0.02, (e) 0.05 and (f) Fig.4.6 EDX spectra of Ba (1-x) La x Ti 0.6[1-(5x/12)] Zr 0.4 O 3 with x values (a) 0 and (b) Fig.4.7 Relative permittivity of Ba (1-x) La x Ti 0.6[1-(5x/12)] Zr 0.4 O 3 as a function of frequency with x values (a) 0,(b) 0.005, (c) 0.01, (d) 0.02, (e) 0.05 and (f)
12 Fig.4.8 Relative permittivity of Ba (1-x) La x (Ti 0.6[1-x/4] Zr 0.4[1-x/4] )O 3 as a function of frequency with x values (a) 0,(b) 0.005, (c) 0.01, (d) 0.02, (e) 0.05 and (f) Fig.4.9 Relative permittivity of Ba (1-x) La x (Ti 0.6 Zr 0.4[1-(5x/8)] )O 3 as a function of frequency with x values (a) 0, (b) 0.005, (c) 0.01, (d) 0.02, (e) 0.05 and (f) Fig.4.10 Relative permittivity at 5MHz of Ba (1-x) La x Ti 0.6[1-(5x/12)] Zr 0.4 O 3 with different lanthanum percentage. 57 Fig.4.11 Relative permittivity at 5MHz of Ba (1-x) La x (Ti 0.6[1-x/4] Zr 0.4[1-x/4] )O 3 with different lanthanum percentage. 57 Fig.4.12 Relative permittivity at 5MHz of Ba (1-x) La x (Ti 0.6 Zr 0.4[1-(5x/8)] )O 3 with different lanthanum percentage. 58 Fig.4.13 tan δ of Ba (1-x) La x Ti 0.6[1-(5x/12)] Zr 0.4 O 3 as a function of frequency with x values (a) 0,(b) 0.005, (c) 0.01, (d) 0.02, (e) 0.05 and (f) Fig.4.14 tan δ of Ba 1-x La x (Ti 0.6[1-x/4] Zr 0.4[1-x/4] )O 3 as a function of frequency with x values (a) 0,(b) 0.005, (c) 0.01, (d) 0.02, (e) 0.05 and (f) Fig.4.15 tan δ of Ba 1-x La x (Ti 0.6 Zr 0.4[1-(5x/8)] )O 3 as a function of frequency with x values (a) 0, (b) 0.005, (c) 0.01, (d) 0.02, (e) 0.05 and (f) Fig.4.16 tan δ at 5MHz of Ba (1-x) La x Ti 0.6[1-(5x/12)] Zr 0.4 O 3 with different lanthanum percentage. 60 Fig.4.17 tan δ at 5MHz of Ba 1-x La x (Ti 0.6[1-x/4] Zr 0.4[1-x/4] )O 3 with different lanthanum percentage. 61 Fig.4.18 tan δ at 5MHz of Ba 1-x La x (Ti 0.6 Zr 0.4[1-(5x/8)] )O 3 with different lanthanum percentage. 61 Fig.4.19 Variation of relative permittivity with porosity in Ba (1-x) La x Ti 0.6[1-(5x/12)] Zr 0.4 O 3 with x values (a) 0.0, (b) 0.005, (c) 0.01, (d) 0.02, (e) 0.05, (f) 0.1 at 5MHz. 65 Fig Variation of relative permittivity with porosity in Ba 1-x La x (Ti 0.6[1-x/4] Zr 0.4[1-x/4] )O 3 with x values (a) 0.0, (b) 0.005, (c) 0.01, (d) 0.02, (e) 0.05, (f) 0.1 at 5MHz. 65 Fig Variation of relative permittivity with porosity in
13 Ba 1-x La x (Ti 0.6 Zr 0.4[1-(5x/8)] )O 3 with x values (a) 0.0, (b) 0.005, (c) 0.01, (d) 0.02, (e) 0.05, (f) 0.1 at 5MHz. 66 Fig tan δ as a function of frequency for Ba 0.9 La 0.1 Ti Zr 0.4 O 3 with apparent porosity of (a) 7% (b) 11% and (c) 30%. 67 Fig Variation of tan δ with porosity in Ba 1-x La x (Ti 0.6 Zr 0.4[1-(5x/8)] )O 3 with x values (a) 0.0, (b) 0.005, (c) 0.01, (d) 0.02, (e) 0.05, (f) 0.1 at 5MHz. 67 Fig Relative permittivity and tan δ as a function of temperature for the composition Ba La Ti Zr 0.4 O Fig Relative permittivity and tan δ as a function of temperature for the composition Ba 0.95 La 0.05 Ti Zr 0.4 O Fig Relative permittivity and tan δ as a function of temperature for the composition Ba 0.9 La 0.1 Ti Zr 0.4 O Fig Ln(1/T-1/T m ) Vs Ln(1/ε-1/ε m ) for the composition Ba La Ti Zr 0.4 O 3 ( ) and Ba 0.95 La 0.05 Ti Zr 0.4 O 3 (Ο) at 11KHz. 73 Fig Tm versus Ln(v) for (a) Ba La Ti Zr 0.4 O 3 and (b) Ba 0.95 La 0.05 Ti Zr 0.4 O Fig.4.29 Resistivity of the composition Ba (1-x) La x Ti 0.6[1-(x/4)] Zr 0.4(1-(x/4)] O 3 with different lanthanum percentage at an electric field of 2.5 KV/cm. 81 Fig.4.30 Current density and resistivity with electric field for the composition Ba 0.9 La 0.1 Ti Zr 0.39 O Fig.4.31 Current density and resistivity with electric field for the composition Ba 0.95 La 0.05 Ti Zr O Fig.4.32 Current density and resistivity with electric field for the composition Ba 0.98 La 0.02 Ti Zr O Fig. 5.1 A schematic multilayer feed-forward network. 85 Fig. 5.2 Feed forward network used in modeling. 91 Fig. 5.3 RMS error as a function of number of iteration. 92
14 Fig.5.4 Relative permittivity as a function of frequency for Ba (1-x) La x Ti 0.6[1-(5x/12)] Zr 0.4 O 3 with x value (a) 0, (b) 0.005, (c) 0.01, (d) 0.02, (e) 0.05 and (f) Fig.5.5 Enlarged view of relative permittivity as a function of frequency for for Ba (1-x) La x Ti 0.6[1-(5x/12)] Zr 0.4 O 3 with x value Fig.5.6 tan δ as a function of frequency for Ba (1-x) La x Ti 0.6[1-(5x/12)] Zr 0.4 O 3 with x value (a) 0, (b) 0.005, (c) 0.01, (d) 0.02, (e) 0.05, (f) Fig.5.7 Estimated values of relative permittivity as a function of frequency for Ba (1-x) La x Ti 0.6[1-(5x/12)] Zr 0.4 O 3 with x value (a) 0, (b) 0.005, (c) 0.01, (d) 0.02, (e) 0.03, (f) 0.04, (g) 0.05, (h) 0.06, (i) 0.07, (j) 0.08 and (k) Fig.5.8 Comparison of experimental and estimated relative permittivity at 5MHz for Ba (1-x) La x Ti 0.6[1-(5x/12)] Zr 0.4 O 3. 96
15 CHAPTER 1 INTRODUCTION AND BACKGROUND 1.1 Introduction Ferroelectric materials, due to its properties, are used in many applications. Some of the applications include multilayer capacitor, ferroelectric memories, actuator, transducers, detectors, electro-optics, etc. Volumetric efficiencies with low cost make these materials, suitable for electronic and optics applications. It has been extensively used in ferroelectric memories like dynamic random access memory, static random access memory, ferroelectric random access memory etc. Electro-optic applications like wave guides, optical memory and displays, in general use ferroelectric materials. Again medical ultrasound, gas igniter, displacement transducers, accelerometer, impact printer pronounce its applications. Recent interest in the field of ferroelectricity is highly centered on relaxors. These materials have wide range of applications in various devices like microelectromechanical systems, actuators, capacitors, detectors and too many. Barium titanate zirconate, a relaxor ferroelectric, find applications in dynamic random access memories, field tunable device and actuators. The intent of this chapter is to provide a brief description of ferroelectricity and relaxor behaviour in dielectrics. 1.2 Ferroelectricity and polarization Ferroelectricity is a phenomenon which was discovered by Valasek in 1921[1]. Since then, many essential features of the ferroelectric phenomenon were studied and described. Rochelle salt (NaKC 4 H 4 O 6 4H 2 O) was the first material found to show ferroelectric properties, such as a reorientable spontaneous polarization (P s ), on cooling below a transition (Curie) temperature. In the ferroelectric phase, relative displacements of ions inside the unit cell results in reversible spontaneous dipole moments (Fig.1.1). The polarization (P) that arises due to dipoles is described by following equation;
 as: D = χ χ 0 E = χ 0E+P (1.2) where χ 0 and χ are the free space and relative susceptibilities, E is electric field, respectively [2, 3]. 1.")
16 qr P = (1.1) V where q is the electric charge on the displaced ion, r is the relative displacement, and V is the volume of the unit cell. Fig.1.1. Dipole placed at distance r. This moment is related to the electric displacement (D) as: D = χ χ 0 E = χ 0E+P (1.2) where χ 0 and χ are the free space and relative susceptibilities, E is electric field, respectively [2, 3]. 1.3 Perovskite crystal structure and ferroelectricity Most of the useful ferroelectrics, such as barium titanate, lead titanate (PbTiO 3 ), lead zirconate titanate, lead lanthanum zirconate titanate, and potassium niobate (KNbO 3 ) have the perovskite structure. The perovskite, ABO 3 type structure consists of corner sharing oxygen octahedra (BO 6 ) arranged in three dimensions with smaller, highly charged cations (B: Ti 4+, Zr 4+, Sn 4+, Nb 5+, Ta 5+, W 6+, etc.) located in the middle of the octahedra and larger cations with smaller charge (A: Na +, K +, Ca 2+, Ba 2+, Pb 2+, etc.) in between the octahedra. The structure is shown in Fig.1.2. Most perovskite-type ferroelectrics are compounds with either A 2+ B 4+ O 2-3 or A 1+ B 5+ O 2-3 formula [4]. The perovskite structure can be also regarded as a close-packed arrangement of large A and O ions with smaller B ions filling the octahedral interstitial positions. The structure with cation substitution, may lead to more complex compounds, such as
17 (K 1/2 Bi 1/2 )TiO 3, Ba(Ti,Zr)O 3, Pb(Fe 1/2 Ta 1/2 )O 3, Pb(Co 1/4 Mn 1/4 W 1/2 )O 3, Pb(Mg 1/3 Nb 2/3 )O 3, and Pb(Zn 1/3 Nb 2/3 )O 3 [4, 5]. Fig.1.2. ABO 3 perovskite-type unit cell Barium titanate (BaTiO 3 ) perovskite, the first ceramic material that exhibit ferroelectric behavior, was reported in 1945 [6]. Barium titanate became one of the most extensively studied ferroelectric materials due to its better ferroelectric properties, chemical and mechanical stability [7]. Above 120 C (Curie temperature, T c ), barium titanate has a cubic structure and possesses no spontaneous dipole due to its centrosymmetric structure. Below 120 C, it changes to a tetragonal phase, with an accompanying movement of Ti atoms inside the O 6 octahedra. The dipole moment may be considered to arise primarily due to the movement of Ti atoms with respect to the O atoms in the same plane, but the movement of the other O atoms (i.e. those O atoms above and below Ti atoms) and the Ba atoms are also relevant.
18 1.4 Ferroelectric phase transitions and Curie-Weiss law On decreasing the temperature through the Curie point, a ferroelectric crystal undergoes a phase transition from a non-ferroelectric phase to a ferroelectric phase. The variation of the relative permittivity (ε r ) with temperature for BaTiO 3 ferroelectric crystal is shown in Fig.1.3. It shows that structure changes from paraelectric cubic phase to the ferroelectric tetragonal, orthorhombic, and rhombohedral phases. Near the phase transition temperatures, thermodynamic properties including dielectric, elastic, optical, and thermal constants show an anomalous behavior. Transition into a ferroelectric phase occurs differently in different type of ferroelectric materials. These transitions may be of first order or second order in classical ferroelectrics [7]. The temperature dependence of the relative permittivity above the Curie point (T>T c ) in most ferroelectrics is governed by the Curie-Weiss law [8]: C ε = ε o + (1.3) ( T To ) where ε is the permittivity of the material, ε 0 is the permittivity of the vacuum, C is the curie constant and T 0 is the Curie-Weiss temperature. The Curie-Weiss temperature T 0 is, in general, different from the Curie point T c. For first order transitions T 0 <T c, while for second order phase transitions T 0 =T c [8, 9]. The order of the phase transition is defined by the discontinuity in the partial derivatives of the Gibbs free energy (G) of the ferroelectric at the phase transition temperature [10]. For an n th order phase transition, the n th order derivative of G is a discontinuous function at the transition temperature. Thus, spontaneous polarization and strain change continuously at the phase transition for a ferroelectric with the second order phase transition and are discontinuous at the phase transition temperature for first-order ferroelectrics. Schematic temperature dependence of the dielectric permittivity and spontaneous polarization (P s ) for first-order, second-order and relaxor ferroelectric is shown in Fig 1.4.
19 Temperature, T ( o C) Fig.1.3. Relative permittivities measured along a and c directions of a poled tetragonal BaTiO 3 crystal versus temperature [11]. Fig.1.4. Temperature dependence of dielectric permittivity and spontaneous polarization for (a) first, (b) second and (c) relaxor ferroelectric [10].
20 1.5 Characteristics of relaxor ferroelectrics Relaxor ferroelectrics can be distinguished from normal ferroelectrics by the presence of a broad, diffused, and dispersive phase transition on cooling over Curie temperature. The ferroelectric properties of relaxors are dependent on the measurement frequency. The temperature T m at maximum ε r, shifts to higher temperatures and that for dielectric loss shifts to lower temperature (Fig.1.5) with increasing frequency [12]. For relaxors, which have a diffuse phase transition, the remanent polarization (P r ) gradually decreases to zero on changing the temperature towards T max [13]. There have been numerous theories proposed to explain the relaxor properties, such as compositional fluctuations model [12], super-paraelectricity model [14] and random local field model [15]. Fig.1.5. Variation of the dielectric properties of a relaxor ferroelectric with temperature at frequencies of 1KHz to 1MHz, (a) dielectric permittivity and (b) dissipation factor [12].
21 1.6 Structural origin of relaxor ferroelectrics Relaxor ferroelectrics are a class of ferroelectrics that have a diffuse permittivity maximum which is frequency dependent. Lead magnesium niobate (PMN), Lead lanthanum titanate zirconate (PLTZ) and Lead zinc niobate (PZN), are some of the examples of relaxors. For many practical applications, a very broad permittivity maximum is desirable. Diffuseness can be achieved by making the material deliberately inhomogeneous. As shown in Fig.1.6, the permittivity of a ferroelectric with diffuse Fig.1.6. Temperature dependence of reciprocal permittivity of Pb(Mg 1/3 Nb 2/3 )O 3 [12]. phase transition (DPT), does not follow the Curie-Weiss law above T m. The extrapolated Curie-Weiss temperature (T o ) is necessarily higher than the temperature of the permittivity maximum T m. Relaxors exhibit abnormally strong frequency dependence (dispersion) in the low temperature permittivity; to the extent that T m is shifted upward with frequency. This is illustrated in Fig. 1.6 using data of Pb(Mg l/3 N 2/3 )O 3. A correspondingly dispersive behavior is also found in the dielectric loss, as expected from the Kramers- Kronig relations for the dielectric response. However, the peak temperature for dielectric loss does not coincide with T m. Thus, understanding the origin of dispersion in relaxor is very much interesting and important. Perovskites that contain A-site Pb cations with the general formula of Pb(B x B 1- x )O 3 and (Pb,La)(Zr 1-x Ti x )O 3 series figures prominently as the most widely used
22 relaxors. For Pb-containing perovskites, the strong Pb-O-B coupling must be broken in order to render the material relaxant. This can be achieved by substitution of Pb 2+ cation on the A -site or by the use of an oversized B cation to attract Pb 2+ cation away from the undersized B cation. In the phenomenological theory of ferroelectricity, there exists an energy barrier Φ b between the un-polarized and polarized state. On an atomic level, ferroelectrically active B cations in most, if not all, occupy off-centered sites even at temperatures well above T c. In the polarized state, the energy degeneracy of bifurcated states is broken by the Lorentz field in the polarized region. In Fig.1.7(b) the energy of the field bias is denoted as U and the modified hopping barrier is denoted as V o. The relaxor behavior that shows both temperature diffuseness and frequency dispersion is possible only if V o is sufficiently small and broadly distributed. In addition, since all relaxors are solid solutions, U must be relatively large in order to effect hopping in this relatively random environment. It turns out that the relative sizes of B and B have a profound effect on the Pb- O-B coupling and the associated relaxor behavior in Pb(B x B 1-x )O 3. In the case, in which the B cations are larger than the B cations, then the six O 2- surrounding a B cation are pushed outward. This has the consequence of decoupling Pb from the smaller B ion. It is then possible for B to have a lower V o and make such perovskites with oversized B cations to be relaxors. This is indeed the case, for example, Pb(In 1/2,,Nb 1/2 )O 3, Pb(Zn 1/3 Nb 2/3 )O 3, Pb(Co 1/3 Nb 2/3 )O 3 and Pb(Ni l/3 Nb 2/3 )O 3 are all relaxors [16]. On the other hand, if the B cation is smaller in size than the B cation, as in Pb(Fe l/2 Nb 1/2 )O 3, then Pb is attracted to the larger Nb, so the Pb-0-Nb coupling remains intact. Therefore, relaxor behavior is not expected. The requirement of a sufficiently small V o demands for B cations be decoupled from Pb. It is only possible if Pb is attracted to an oversized B cation. It has been noted that relaxors having B cations decoupled from Pb, all lack long-range order.
23 Alloying also contribute inhomogeniety in the structure. All the A-site alloying, regardless of type (e.g. donor La 3+, acceptor Na + ) [17, 18] lowers T m, and increases diffuseness and dispersion. This can be entirely attributed to the replacement of Pb which weakens both U and V o locally, while the random locations of Pb replacement broadens the energy spectra. This is termed as the A-site dilution effect. Alloying always reduces the relative fraction of each of the constituent phases in the total assemblage. However, large size difference between B and B destroys the random environment and the diffuse phase transition [19]. Fig.1.7. (a) Free energy V s polarization in the phenomenological theory. (b) Local atomic potential along a line through two off-centered B-sites [19]. Lead free perovskite like BaTi 0.6 Z 0.4 O 3, also shows relaxor properties. A broad dielectric anomaly coupled with the shift of dielectric maxima towards a higher temperature with increasing frequency indicates the relaxor behaviour (Fig1.8) of this composition. The index of relaxation (γ) and broadening parameter ( ) were estimated through linear fit of modified Curie-Weiss law and were found to be 1.79 and 76K
24 respectively. Again a remarkable good fit to the Vogel Fulcher relation further supports strong relaxor nature [20]. Fig.1.8. Temperature dependence (a) dielectric constant and (b) tan δ of BaZr 0.4 Ti 0.6 O 3 measured at different frequencies [20]. For the iso-valent substitutional B-site solid solutions in BaTiZrO 3 type perovskites, this is in good agreement with the fact that the dilution of ferroelectric character does not occur when the substitution Zr 4+ for Ti 4+ is weak. It is noted that, the size of Zr 4+ is higher than that of Ti 4+. Introduction of over size Zr 4+, dilutes TiO 6 linkage. For small substitution rates, the richest Ti compositions, make possible the displacements of the cations and preserve the long-range spontaneous polarization. The strong quenching effect of Ti makes it difficult to allow relaxor behavior. However, at higher substitution rate, over a critical concentration, relaxor behavior is observed. Regarding the strong decreasing of T c with increasing Zr, it is due to the larger size of Zr 4+ than that of Ti 4+, entailing a decrease of its displacement in the octahedron [21, 22].
25 1.7 Organization of the thesis The thesis has been divided into six chapters: Chapter 1 presents a brief introduction of ferroelectricity, relaxor behaviour and organization of the thesis. Chapter 2 deals with detailed literature review. Attempts have been made to systematically classify the available information under different sections. This chapter incorporates background information to assist in understanding the aims and results of this investigation, and also reviews recent reports by other investigators with which these results can be compared. Chapter 3 enunciates with the detail of synthesis and powder characterization related to this research work. Chapter 4 describes the electrical characterisation, which has been divided into four sections. First one speaks about the dielectric properties. Second section explains about the effect of porosity on the dielectric properties. Third section describes about the relaxor behaviour of lanthanum substituted BaTi 0.6 Zr 0.4 O 3. Fourth section narrates about the resistivity and current density characteristics at low electric field. Chapter 5 elaborates about artificial neural network modeling and its application in predicting the dielectric properties of the ceramics. Chapter 6 summarizes the concluding remarks and the scope of future work. A complete list of references has been given towards the end of the thesis. Finally, a concise list of publications in peer reviewed international journals related to present research work has been presented at the end.
26 CHAPTER 2 LITERATURE REVIEW 2.1 Introduction Barium titanate zirconate Ba(Ti,Zr)O 3 (abbreviated as BTZ) is one of the relaxor ferroelectrics used as base material for DRAM storage capacitors, decoupling capacitor, field tunable element, oscillators, filters, phase shifters etc [23-27]. Low dielectric loss and high breakdown strength make BTZ an efficient alternative to barium strontium titanate (BST) ceramics. Lead free relaxor materials would be particularly interesting for environmental-friendly applications [28]. Many researchers were interested in iso-valent or alio-valent substitutions in perovskite like BTZ, to alter its characteristics [29-31]. There are different synthesis procedures available in the literature for BTZ. Zirconium concentration plays an important role in the properties of BTZ. Porosity brings changes in the electrical properties of dielectrics. Artificial neural network application in different material characterization procedure will be of great interest. In this chapter, an attempt is made to provide a review for the synthesis, effect of zirconium, lanthanum and porosity on the properties of BTZ ceramics. 2.2 Synthesis of Ba(Ti,Zr)O 3 Analytical grade BaCO 3, ZrO 2 and TiO 2 were used by Moura et.al. [32] to synthesize BTZ by solid state route. The powders were homogenized in a ball mill using isopropyl alcohol. After calcination, the powders were compacted in the form of pellets by isostatic pressing. The pellets were sintered at 1550 o C for 4h in static air. The BTZ were prepared via conventional mixed-oxide method by Nanakorn et.al. [33]. The starting materials BaCO 3, TiO 2 and ZrO 2 were weighed based on the stoichiometric compositions of Ba(Zr x Ti 1-x )O 3 with different x values. The weighed batches were ball-milled for 24h. After drying, the powders were calcined at temperatures ranging from 1150 o C to 1250 o C for 2h. The calcined powders were again ball-milled for
27 24h, dried and pressed into disks. The pellets were sintered at temperatures ranging from 1300 o C to 1450 o C for 2h. The raw precursors used by Reymond et.al [34], include BaCO 3, ZrO 2 and TiO 2 powders. The powders were first mixed, ball milled and calcinated at 1200 o C for 15h, then pressed into disk and sintered for 4h at 1400 o C. Tang et.al [26] prepared BTZ by taking weighted amounts of the appropriate proportions of high purity barium acetate, zirconium n-propoxide and titanium n- butoxide. Acetic acid and 2-methoxyethanol were selected as solvents. Barium acetate was dissolved in acetic acid, and the two alkoxides were dissolved in 2-methoxyethanol, respectively. By controlling the hydrolysis condition of the complex solution, a BTZ gel was formed. The dry gel was then annealed at 1100 o C for 5h in atmosphere. After grinding, BTZ powders were obtained. The powders were pressed into disks and sintered at 1400 o C for 5h. BTZ was synthesized by Dixit et.al [35] from barium acetate, zirconium n- propoxide, and titanium isopropoxide. Stoichiometric amount of barium acetate was dissolved in warm acetic acid through continuous stirring. Ethylene glycol was added to the solution for complete dissolution of barium acetate in acetic acid. Inside a moisturecontrolled glove box, stoichiometric amount of titanium isopropoxide and zirconium n- propoxide was co-dissolved and chelated with acetic acid. Finally, the Zr Ti complex sol was added drop wise to barium acetate solution at room temperature with continuous stirring. Samples were calcined at 1100 o C for 2h in air for complete perovskite phase formation and better crystallinity. The high-temperature calcination was necessary, as at temperatures below 1100 o C, BaCO 3 and small amount of other undesirable phases (viz. BaTi 2 O 4 ) were present. [Ba(CH 3 COO) 2 ], [Zr(OC 3 H 7 ) 4 ], and [Ti(OC 3 H 7 ) 4 ] were used as starting materials by Zhai et.al. [36] and acetic acid was used as solvent. Veith et.al [37] and Tang et.al [38] prepared BaTiZrO 3 ceramics by sol gel processes.
28 BTZ were synthesized through the polymeric precursor method (PPM) by Marques et.al. [39]. Barium carbonate, titanium(iv) isopropoxide, zirconium(iv) tetra-nbutoxide, ethylene glycol and citric acid were used as starting materials. Titanium citrate and zirconium citrate were formed by the dissolution of, respectively, titanium(iv) isopropoxide and zirconium(iv) n-propoxide in water solutions of citric acid, under constant stirring. These solutions were homogenized and were mixed. The citrate solution was stirred for some hours at 60 o C to yield a clear and homogenous solution. Barium carbonate was dissolved in water, after then it was added in a stoichiometric quantity, to the titanium zirconium citrate solution. After homogenization of the solution, ethylene glycol was added to promote the citrate polymerization by the polyesterification reaction. The citric acid ethylene glycol ratio was fixed at 60:40. The solution became more viscous with heating at around o C. High-purity BaCl 2.2H 2 O, ZrOCl 2.8H 2 O and TiCl 4 were used as precursors by Reddy et.al. [40]. TiCl 4 was diluted with distilled water to avoid the precipitation during usage as it is highly hygroscopic and susceptible to precipitation of Ti(OH) 4 with atmospheric water at room temperature. The dilution procedure consists of adding the concentrated TiCl 4 slowly to the distilled water, which is kept close to freezing temperature, under the constant stirring conditions. This results in the diluted TiCl 4 solution, which needs to be used immediately as its shelf-life is only a few hours at room temperature. Equal molar concentration solutions of diluted TiCl 4 and ZrOCl 2 were mixed thoroughly and then, BaCl 2 solution added to this mixture. The mixing of these solutions was continued for 1h. NaOH with different molar concentrations was used for precipitation. NaOH solution was heated to 75 o C and ph is maintained at >12. The precursor solution mixture was added to NaOH at the rate of 25 ml/min and precipitated. The precipitate was immediately washed to remove the chloride ions and to neutralize the ph. The washed precipitate was dried at room temperature initially to confirm the phase formation and subsequently dried in an oven at 100 o C for 10h for quick drying. Chemical co-precipitation method was used by Woo et.al. [41] to synthesize compositionally modified BTZ powders. A peroxo-complex solution of BaZr x Ti 1 x was
29 prepared by adding hydrogen peroxide (H 2 O 2 ) into mixed aqueous solution of BaCl 2, ZrOCl 2 and TiCl 4. The Ba/(Zr x Ti 1 x ) andh 2 O 2 /(Zr x Ti 1 x ) molar ratios were fixed. Amorphous BaZr x Ti 1 x peroxo-hydroxide precipitate was formed by adding the peroxocomplex solution of BaZr x Ti 1 x in an ammonium solution. The final ph of the solution was maintained at 12. The coprecipitated precursor was used as the starting material for the hydrothermal synthesis. In hydrothermal synthesis, the suspension including coprecipitated precursor was charged into a teflon-lined autoclave of 300 ml capacity with a fill factor of 80 vol. % in the presence of Ba(OH) 2. The Ba(OH) 2 was used as a mineralizer. The Ba(OH) 2 /BTZ molar ratio was fixed at 2. The resulting ph in the aqueous solution obtained by addition of Ba(OH) 2 was Subsequently, the reactor was heated to temperatures between 100 and 130 o C for various reaction times with autogeneous pressure. Maximum autogeneous pressure was 1.5 MPa at 130 o C. The reaction products were filtered and washed with distilled water to remove soluble components, including excess Ba 2+ and Cl and then dried at 90 o C for 12h. The hydrothemally synthesized powders were pressed in the form of discs under a pressure of 80 MPa and sintered at 1150 o C for 1h. 2.3 Synthesis of La doped Ba(Ti,Zr)O 3 The starting material BaCO 3, TiO 2, La 2 O 3 and ZrO 2 were used by Aliouane et.al. [30] to obtain Ba 1 x La 2x/3 (Ti 1 y Zr y )O 3 by conventional solid-state reaction route. The ceramics were processed from powders calcined for 12h at 1200 o C, then uniaxially pressed into disks. Finally, they were sintered for 2h at 1400 o C. Similarly Chou et.al. [31] prepared samples by the conventional solid-state reaction method, using BaCO 3, ZrO 2, TiO 2 and La 2 O 3. Powders of the composition (Ba 1 x La x )Zr 0.2 Ti 0.8 x/4 O 3 were weighed and mixed for 24h using alcohol and zirconia milling media. After drying, the mixtures were calcined at 1300 o C for 4h. The obtained powders were pressed into disc-shaped pellets at 100 MPa. The green pellets were sintered at 1600 o C for 4h.
30 2.4 Effect of Zr in Ba(Ti,Zr)O 3 In perovskites, the relaxor behavior mainly occurs in lead-based compositions (PMN, PLZT, etc.), with more than one type of ions occupying the equivalent sixcoordinated crystallographic sites [5]. Though the large family of lead-based perovskites and relaxors has shown a great potential, lead-free compositions in these families will be of interest because of the obvious environmental concern in the future. Barium strontium titanate (BST) is ahigh-k (dielectric constant) material commonly used to replace silicon dioxide (SiO 2 ) as the dielectric in advanced memory devices. [26]. The high dielectric constant, high breakdown strength, low leakage current combined with low dissipation factor makes BST one of the promising candidates for dynamic random access memory (DRAM) applications [42]. In spite of this, BST does not provide good electrical properties at high electric field and loss is high. Recently, BTZ has been chosen as an alternative to BST in the fabrication of ceramic capacitors, dynamic random access memories and tunable microwave devices. The solid solution of barium titanate BaTiO 3 and barium zirconate BaZrO 3, i.e., Ba(Ti,Zr)O 3, shows great similarity to the BST solid solution [43, 44]. In the para-electric state, just above the T c, BTZ are attractive candidates for making dynamic random access memories and tunable dielectric devices. It provides high dielectric constant, low leakage current and low dielectric dispersion against frequency. While it is difficult to achieve high-quality Pb-based relaxor, Ba(Ti,Zr)O 3 havehigher success in fulfilling those goals. In general Zr 4+ is chemically more stable than Ti 4+ and has a larger ionic size to expand the perovskite lattice [24, 45-51]. It is believed that the conduction by electron hopping between Ti +4 and Ti +3 if any, would be supressed by substitution of Ti with Zr [27]. Zr content strongly influences the evolution of the microstructures that is homogeneous and crack-free [35]. Substitution of Ti 4+ with Zr 4+ exhibits several interesting features in the dielectric behavior of BaTiO 3 ceramics. The nature of the ferroelectric phase transition at the transition temperature (T m ) of BTZ bulk ceramics is known to change strongly with Zr content. The phase transition temperature (T m ) is
31 suppressed with increasing Zr content. When the Zr content is less than 10 at. %, the BTZ ceramics show normal ferroelectric behavior and the dielectric anomalies corresponding to the cubic to tetragonal (T c ), tetragonal to orthorhombic (T 2 ), and orthorhombic to rhombohedral (T 3 ) phases have been clearly observed [52]. For Zr contents of 8 at. %, the BTZ bulk ceramics show a broad permitivity-temperature (ε~t) curve near T m, which is caused by the inhomogeneous distribution of Zr ions on Ti sites and mechanical stress in the grain [49]. As the Zr content increases, the phase transition temperatures approach each other, until at a Zr content of 20 at. %, only one phase transition exists [44]. BTZ with 20 at. % of Zr, shown a ferroelectric to paraelectric transition in the vicinity of room temperature. The degree of diffuseness of the phase transition is more pronounced for higher Zr content, implying the existence of a composition-induced diffuse phase transition of the ceramics with Zr from 20 to 35 at. %. At around 27 at. %, Zr-doped BTZ ceramics exhibit typical diffuse paraelectric to ferroelectric phase transition behavior, whereas Zr-richer compositions exhibit typical relaxor-like behavior in which T c shifts to higher temperature with increase in frequency [52].high tunability and figure of merit for BTZ compositions makes the ceramics promising materials for tunable capacitor applications [26]. More importantly BTZ shows very stable and highly insulative characteristics against applied voltage without any sign of abrupt increase of leakage current or electrical breakdown [27]. 2.5 Effect of La doping in Ba(Ti,Zr)O 3 For the stoichiometric compositions Ba(Ti 1 y Zr y )O 3, in the well-known binary system BaTiO 3 BaZrO 3, the perovskite phase exists for 0<y<0.42 [23]. Concerning the non-stoichiometric compositions, (Ba 1 x La 2x/3 x/3 )(Ti 1 y Zr y )O 3, from defect chemistry viewpoint, the room temperature tetragonal symmetry was confirmed in 0<x<0.35 and
32 0<y<0.25 [30]. In (Ba 0.95 La 0.1/3 )(Ti 1 y Zr y )O 3 for the smallest substitution in A-sites, associated with relatively small substitutions in B-sites (0.05<y<0.15), the temperature dependence of ε r at different frequencies exhibited no significant dispersion. This was not the case for the temperature dependence of ε r. Frequency dispersion was detected in the range of hz.however, for the two parts of dielectric permittivity, one single peak was observed and the temperature where the maximum of dielectric constant occurs was independent on frequencies. A very small deviation from the Curie Weiss law was noticed. Such behaviour indicated a relatively diffuse phase transition; however the ferroelectric phase was not a relaxor. Upon further increasing substitutions in B-sites (y=0.20 and y=0.25), the frequency dispersion becomes stronger and was accompanied with a shifting of T m to higher values for increasing frequencies. The value of the Curie temperature T 0 was greater than that of T m. This behaviour characterizes a ferroelectric relaxor [30]. In (Ba 0.9 La 0.2/3 )(Ti 1 y Zr y )O 3, the temperature and frequency dependences of ε r and ε r exhibited only one phase transition. With increasing y, the ε r peak became more and more smooth and the frequency dispersion stronger. A deviation from the Curie Weiss law was found. The value of T m decreased when y increased. The increasing degree of frequency dependence, which can be observed below T m was in agreement with a relaxor behaviour [30]. In (Ba 1 x La 2x/3 )(Ti 1 y Zr y )O 3 with 0.15<x<0.35 and 0.05<y<0.35, for higher composition ranges of x, the behaviour of the transition temperature was the same as that of the previous line (x=0.10), indicating clearly a relaxor behaviour. The strong frequency dispersion was observed particularly at the low-temperature slope of the peak of ε r [30]. Recently, the ferroelectric relaxor behavior and dielectric properties of Ba 1 x La x Zr 0.2 Ti 0.8 x/4 O 3 ceramics, with the Ti-vacancy defects compensation model, have been investigated by X. Chou et.al [31]. La 3+ ions substitute for A-site Ba 2+ ions to form solid solution and induce the occurrence of ferroelectric relaxor behavior. The temperature dependence dielectric constant and loss reveals that Ba 1 x La x Zr 0.2 Ti 0.8 x/4 O 3 ceramics have a typical relaxor behavior and diffuse phase transition characteristics and
33 the degree of ferroelectric relaxation behavior is enhanced with the increase of La dopant concentration. The Curie temperature (T c ) of Ba 1 x La x Zr 0.2 Ti 0.8 x/4 O 3 ceramics is remarkably shifted to lower temperature and the dielectric constant can be tailored from thousands to hundreds with the increase of Lanthanum. The dielectric loss of the ceramics is obviously improved by La doping. 2.6 Effect of porosity on the electrical properties It is well known that the relative permittivity decreases with increasing porosity in polycrystalline ceramics. The porosity introduces in-homogeneity in bulk, which alters the mechanism of leakage [53]. The incorporation of pores significantly degrades the electrical characteristics and breakdown strength of the material. However, using various levels of porosity in order to alter the effective dielectric constant in the same material allows patterning different dielectric constants into a single material. Thus, controlling the porosity can yield a spectrum of dielectric constants from a single material [54]. Enhanced electric field in the pores increases the probability of bond breakage on the pore walls and leads to the lowering of the overall breakdown strength [53, 55]. 2.7 Artificial neural network application BaTiO 3 based materials are widely used as positive temperature coefficient resistance (PTCR) thermistors and as multilayer ceramic capacitors (MLCC) [56]. In order to satisfy different requirements and to enhance the dielectric performance of this kind of material, addition of different dopants is usually an effective way. However, because the dielectric properties of the material are very sensitive to the dopants and there may exist complex reciprocal actions between them, it is usually difficult to explain their functions in the system. The ever-increasing need to discover ceramic formulation with good electric properties requires considerable precise mathematical models in general. It would be intractable for us to develop a reliable modeling for the ceramic compounding without enough knowledge before doing the job by using conventional method. Computer modeling is becoming more and more important to scientists and engineers in allowing them a way to picture what might be happening. But very few are known of the use of artificial neural network (ANN) technique in ceramics although it is often
34 invoked in diverse areas in chemistry. As reviewed by Zupan et.al. [57], its application can improve, shorten, or bring new insight into old ways offhand ling experimental data. For the last couple of years, extensive research works has been carried out on the application of neural network in various fields. As a result, the literature on neural network is growing very rapidly. Artificial neural network have been tried successfully on a very wide range of applications [58] including machine vision [59], speech processing [60, 61], sonar analysis [62], radar analysis [63], pattern recognition [64], robotic control [65] etc. In electrical power systems, artificial neural network have been used for accurate load forecasting [66-69], security evaluation [70, 71], capacitor control [72], alarm processing [73] etc. In high voltage systems, applications of neural network have been reported for pattern recognition of partial discharges [74, 75]. Other applications of neural network include pattern recognition and classification, voice and image processing, prediction [76], digital communications [77], and nonlinear system identification and control [78]. Artificial neural network has emerged as a highly effective tool suitable to perform non-linear, complex, and dynamic tasks with high degree of accuracy. This technique is endowed with certain unique attributes: the capability of universal approximation, the ability to learn from and to adapt to its environment, and the ability to invoke weak assumptions environment, and the ability to invoke weak assumptions generation of the input data. It is capable of learning complex input output mappings from a set of training data and it has built-in capability to adapt to the changes in the environment [76]. Among the various neural network structures, the multilayer feed forward network is used for supervised learning. To determine the connection weights of the network, the back propagation algorithm [79] is employed in the training process. The convergence property of the learning process is affected by various network parameters. Many problems such as classification, transformation, and modeling can be handled by this type of network. Abundant examples can be easily seen in subfields of
35 chemistry (analytical, organic, pharmaceutical and biochemistry) and chemical engineering, etc. However, very few literatures are available in the field of ceramics. Hechi-Nielsen et.al. [80]had proved in 1989 that a continuous function in closed interval can be approximated using a three-layer feed forward network with back propagation (BP) of errors. It does not require knowledge of the mathematical function known in advance. 2.8 Summary and scope of work The solid state synthesis has advantages with respect to the use of relatively lowcost raw materials and simple processing steps. On the other hand, chemical solution methods produce more homogeneous, finer particle size and low impurity level powders. So, to get some of the benefits of the solid state and chemical route, a synthesis method in between the two routes may be adopted for economic production of the dielectrics. Literature review shows that lanthanum substitutions enhances the relaxor properties and suppress the dielectric losses in ferroelectric ceramics. So, there is enough scope to study the effect of lanthanum substitution in BTZ ceramics. Conventional ceramic processing of dielectrics leads to a porous body. The incorporation of pores significantly degrades the electrical characteristics of the dielectrics. Therefore, the study related to the effect of porosity on dielectric properties of BTZ ceramics will be of great interest for its practical applications. Artificial neural network with back propagation learning has emerged as a highly effective technique suitable to perform non-linear, complex, and dynamic tasks with high degree of accuracy. It has been used in diverse areas of science and technology to predict the function, where equation describing the function is unknown. So, it will be interesting to apply artificial neural network technique in predicting electrical properties of BTZ ceramics.
36 2.9 Objectives of present work Based on the review of literature, the objectives for the present investigations are listed as follows: Synthesis of Lanthanum doped BaTi 0.6 Zr 0.4 O 3 dielectrics through modified solid state route. Electrical characterization of Lanthanum modified BaTi 0.6 Zr 0.4 O 3. Study the diffuse phase transition and relaxor behaviour of modified dielectrics. Study the effect of porosity on the electrical properties. Apply artificial neural network technique to predict the dielectric properties.
37 CHAPTER 3 SYNTHESIS AND CHARACTERISATION OF POWDER 3.1 Introduction The BaTiO 3 BaZrO 3 solid solutions were conventionally synthesized through solid state route [81-83]. Chemical solution methods are also used to produce more homogeneous, finer particle size and low impurity level powders than that produced by the solid state method [38, 84, 85]. Precursors like, barium acetate, zirconium propoxide and titanium n-butoxides, used in chemical route, are relatively costlier and the chemical method is more complex. On the other hand, the solid state synthesis has advantages with respect to the use of relatively low-cost raw materials and simple processing steps. In the present synthesis Ba(NO 3 ) 2, ZrOCl 2.8H 2 O, TiO 2 and La 2 O 3 (In case of La doped BTZ), powders are used for the preparation of BTZ and La doped BTZ to get some of the benefits of both solid state and chemical route. Use of TiO 2 powder, instead of its organometallic salt, can effectively reduce the powder synthesis cost. This type of powder synthesis has been reported earlier in the literature especially for SrTiO 3 and BaTiO 3 [86, 87]. 3.2 Ba(Ti 0.6 Zr 0.4 )O 3 Aqueous solution of Ba(NO 3 ) 2 and ZrOCl 2.8H 2 O are used to precipitate barium oxalate hydrate and zirconium oxy-hydroxide onto the surface of suspended TiO 2 particles, to get more homogeneous mixing of raw materials than that obtained in solid powder mixing. Reports on BTZ formation from barium oxalate hydrate, titanium dioxide and zirconium oxy-hydroxide precursor mixture is not available in the literature. In the present work, the Ba(Ti 0.6 Zr 0.4 )O 3 powder was synthesized from the precursor containing solution precipitated barium oxalate hydrate, zirconium oxy-hydroxide and TiO 2. The decomposition behavior of precursor was investigated. The BTZ solid solution formation mechanism and its kinetics were studied. Finally, the sintering kinetics of the powder was investigated Experimental procedure
38 Powder synthesis: Analytical grade barium nitrate (Ba(NO 3 ) 2 ), titanium dioxide (TiO 2 ), zirconium oxy-chloride (ZrOCl 2.8H 2 O), ammonia (NH 4 OH) and oxalic acid ((COOH) 2.2H 2 O) were used as raw materials in this process. All the chemicals were from Merck, India (GR grade with 99% purity). To prepare 20gm Ba(Ti 0.6 Zr 0.4 )O 3, mol of barium nitrate, mol of titanium dioxide, mol of zirconium oxy-chloride and 0.08 mol of oxalic acid were taken. An aqueous solution of 0.12 M barium nitrate was prepared using de-ionized water in a glass beaker. The exact molar concentration of the solution was determined by the chemical analysis. Required amount of ZrOCl 2.8H 2 O was dissolved in the above barium nitrate solution with constant stirring. Appropriate amount of TiO 2 was added to 0.15 M oxalic acid solution with continuous stirring to form a suspension. The suspension was treated in ultrasonic bath for 10 min to break soft agglomerates. The solution containing barium nitrate and zirconium oxy-chloride was added drop-wise into the suspension of TiO 2 in oxalic acid solution under vigorous stirring. Finally, the ph of the resultant mixture was adjusted to 8 by adding ammonia solution. This process precipitates barium oxalate hydrate and ZrO(OH) 2 on the surface of TiO 2 (acting as seed) particles by heterogeneous nucleation. It is well known that heterogeneous nucleation is used in coating of ceramic particles with another ceramics. The necessary condition is that the super-saturation must be controlled so that only heterogeneous nucleation on the seed takes place. If super-saturation is too high, homogeneous nucleation may take place [88]. In the present case super-saturation was suppressed and controlled by the use of dilute solutions. The resulting precipitate was filtered out and then washed repeatedly using deionized water followed by isopropyl alcohol. The precipitate was dried at 50 o C for 24 h in an oven. The filtrate solution was chemically analyzed to find out the presence of Ba +2 and Zr +4 ions. No evidences of their presence were identified within the limit of chemical analysis. For Ba +2 ions, the filtrate was titrated by standard EDTA solution after mixing with few ml of NH 4 Cl-NH 4 OH buffer and solochrome-black-t indicator. For Zr +4, first
39 the filtrate was concentrated by boiling and then phosphoric acid was added. No precipitate of ZrP 2 O 7 was found. Decomposition behaviour: The dried powder was characterized by differential scanning calorymetry (DSC) and thermo gravimetric (TG) analysis using NETZSCH STA, Model No 409 C, in air atmosphere with the heating rate of 10 o C/min. DSC is a thermo analytical technique in which the difference in the amount of heat required to increase the temperature of a sample with respect to reference (here Al 2 O 3 ) are measured as a function of temperature and time. When a material undergoes physical or chemical change it absorbs or releases thermal energy. Exothermic or endothermic changes are shown in opposite directions in DSC graph. This technique is excellent for determining the presence and quantity of hydrated water and gives an idea about decomposition behavior, phase transitions, formation of products, etc. TGA is a simple analytical technique that measures the weight loss (or weight gain) of a material as a function of temperature. As materials are heated, they can lose weight due to drying, or by decomposition reactions that liberate gasses. Some materials can gain weight by reacting with the atmospheric gases in the testing environment. Phase and crystallite size analysis: Phase content of precursor and phase formation behaviour in calcined precursor samples were analysed by the powder x-ray diffraction performed with a Philips diffractometer (model: PW-1830, Philips, Netherlands). For quantification of the diffracted x-rays, an electronic detector is placed on the other side of the sample from the x-ray tube, and the sample is rotated through different Bragg s angles. The goniometer keeps track of the angle, and the detector records the x-rays in units of counts/sec and sends this information to the computer. The operating parameters were; 40 kv and 35 ma with the Cu target, a step size of 0.02 (degree) and a count time of 4 s per step. After scan of the sample, the x-ray intensity (counts/sec) was plotted against the angle two-theta (2θ). The angle (2θ) for each diffraction peak was then converted to d-spacing, using the Bragg equation.
40 The identification of different phases was carried out by Hanawalt method using Philips high score software. The powder pattern is characterized by a set of line position 2θ and a set of relative line intensities I. But the angular positions of the lines depend on the wavelength used, and a more fundamental quantity is the spacing d of the lattice planes forming each line. Each pattern is described by listing the d and I values of its diffraction lines. Each substance is characterized by the d values of its 3 strongest lines. The d values together with the relative intensities are sufficient to characterize the pattern of an unknown. The crystallite sizes of the precursor and calcined powder samples were determined from x-ray line broadening using the equation as follows: 0.9λ t = (3.1) BCosθ Where, t is the crystallite size, λ is the wavelength of the radiation, θ is the Bragg s angle and B is the full width at half maximum. Line broadening due to instrument was subtracted from the peak width before calculating the crystallite size using the following formula: B 2 = B 2 meas-b 2 equip (3.2) Where, B meas = measured full width at half maximum from peak, B equip = instrumental broadening [Standard silicon sample was used, whose B value was at 2θ= 29 for (111) reflection]. structure: Lattice parameters were determined using following relationship for cubic a [ λ ( h + k + l )] = (3.3) 2 4[ Sin θ ] Where, a is lattice parameter, λ is the wavelength of the radiation, θ is the Bragg s angle and (hkl) is Miller index.
41 Densification study: Densification kinetics of compact samples was investigated by NETZSCH dilatometer model DIL 402 C. In the dilatometer, the specimen is kept in a specimen holder in the centre of the furnace. The linear dimensional change i.e. shrinkage or expansion of the specimen is transmitted through the push rod (pressed against the sample inside the furnace) to the measuring head. The linear variable differential transducer (LVDT) details the change in length and produces an analogue signal through a measuring amplifier. The digitally displayed signal is in analogue form on a recorder. The calcined powder was ball milled for 24 hours inside polyethylene jar using zirconia balls and acetone as medium. The milled powder was dried at 50 o C. The dried powder was then mixed with 0.5 wt.% PVA. The powder was then granulated by sieving and the granules were uniaxially pressed to square rods at 3.5 ton pressure by cold isostatic pressing. The rod sample was having width and breadth of 5mm and length of 20mm. The measurement was carried out from room temperature to 1300 o C at different heating rates; 5, 10, 15 o C per minute in air atmosphere Results and discussion Decomposition behaviour: The decomposition behavior of precursor was characterized using thermo-gravimetric (TG) analysis and differential scanning calorimetry (DSC) from room temperature up to 1300 o C. Fig.3.1 shows the DSC-TG tracing of the precursor as a function of temperature. TG graph shows the weight loss in various stages. The first major weight loss of about 2.9% within the temperature range o C, corresponds to an endothermic reaction in the DSC curve. This weight loss may be attributed to the decomposition of BaC 2 O 4.xH 2 O to BaC 2 O 4. The second weight loss of about 2.4% appearing in the temperature range o C, corresponds to a small endothermic reaction in the DSC curve. This weight loss may be attributed to the dehydration of ZrO(OH) 2 to ZrO 2. The third major weight loss of about 8.7% is found in the temperature range o C, which corresponds to an exothermic reaction in the DSC curve. This weight loss may be attributed to the decomposition of barium oxalate to barium carbonate as per the reactions:
42 BaC 2 O 4 BaCO 3 +CO (3.4) 2CO+O 2 2CO 2 (3.5) Reaction (3.4) is an endothermic one. However, at the same time CO is converted exothermically to CO 2, taking oxygen from air. The huge exothermic peak appears at 508 o C is due to the reaction (3.5), which suppresses the endothermic peak of reaction (3.4). A sharp endothermic peak at 811 o C corresponds to the polymorphic transformation of whitrite to α-baco 3 [81]. The fourth major weight loss of about 14%, started from around 700 o C, is due to the decomposition of BaCO 3 and formation of BT and BZ. The figure also shows that the BaCO 3 decomposition completed up to 1000 o C. However, in pure BaCO 3 the decomposition peak occurs at about 1187 o C. This indicates that BaCO 3, which formed intermediately in the precursor, decomposes at lower temperature due to the presence of acidic TiO 2, fine particle size and better homogeneity in the mixture [87].
43 Fig.3.1. DSC-TG tracing of precursor powder for Ba(Ti 0.6 Zr 0.4 )O 3 synthesis. To understand the fundamental issues of BTZ formation, the precursors were heated in air at different temperatures and then were analyzed by XRD. Fig. 3.2 shows the XRD patterns of the precursor heated at different temperatures. The analysis of raw powder shows the presence of BaC 2 O 4.0.5H 2 O (PDF No ) and TiO 2 (Fig. 3.2(a)). The presence of ZrO 2 C 2 O 4.xH 2 O type phases in the precursor had not been detected within the limit of XRD. BaC 2 O 4.0.5H 2 O was converted to BaC 2 O 4 (PDF No ) upon calcinations at 400 o C (Fig. 3.2(b)). This confirms the first weight loss in TG analysis is due to the loss of crystalline water of barium oxalate hydrate. The presence of ZrO(OH) 2 as well as ZrO 2 was not detected by XRD analysis. It is supposed that both of them remain in amorphous state. The 700 o C calcined precursor shows the presence of BaCO 3 and TiO 2. The material in the final product (1200 o C/2h) was identified (Fig. 3.2(d)) as BTZ by comparing with standard pattern for Ba(Ti 0.75 Zr 0.25 )O 3 (PDF No ).
44 α --B ac 2 O 4.5 H 2 O β --B ac 2 O 4 T --T io 2 χ --B ac O 3 δ --B a(t i 0.6 Z r 0.4 )O Intensity (a.u.) δ χ β χ β δ χ δ δ χ (d ) (c) (b ) T α α α (a) θ (d eg ree) 2 0 Fig.3.2. XRD pattern of (a) precursor powder 700 o C, (d) 1200 o C. and precursor calcined at (b) 400 o C, (c) Phase transformation behaviour and kinetics: To study the phase transformation behavior and reaction kinetics, the precursor powder was calcined at different temperatures for 2 hours. Fig. 3.3 shows the XRD pattern of calcined product, which suggests that BT and BZ form separately in the system and then BTZ forms by interdiffusion between BT and BZ. Slow step scanning XRD analysis reveals that BT and BZ starts forming simultaneously in the temperature range 600 o C-700 o C by the reaction: 2BaCO 3 (s) + ZrO 2(s) + TiO 2(s) = BaTiO 3(s) + BaZrO 3 (s) + 2CO 2 (g) (3.6) Formation of intermediate BaO or other phases, like Ba 2 ZrO 4, Ba 2 TiO 4 or BaTi 3 O 7 had not been observed within the detection limit of XRD. The precursor was completely transformed into single phase, cubic structure BTZ at 1200 o C for 2h calcinations.
45 Τ TiO 2 α BaCO γ BaTiO 3 β BaZrO Intensity (a.u.) θ (degree) (g) β γ (f) (e) (d) (c) α Τ α β γ α α (b) (a) Fig.3.3. XRD patterns of precursor powder calcined for 2h at (a) 600 o C, (b) 700 o C, (c) 800 o C, (d) 900 o C, (e) 1100 o C, (f) 1200 o C and (g) for16h at 1200 o C. For quantitative estimation of phases, the calcined powders were uniformly mixed with an internal standard and the resulting mixture was analyzed by XRD. The relative weight fractions were quantified from the ratio of peak areas, according to the process described by S. Kumar et.al. [89]. The variation of phase content with calcinations temperatures is presented in Fig As may be seen from the figure, the rate of decomposition of barium carbonate is higher in the temperature range 600 o C-800 o C. It also shows that the amount of BZ formation is less than that of BT at initial stage. This may be due to the higher reactivity of BaCO 3 with TiO 2, as Ti is more electronegative than Zr. At the later stage (850 o C 1000 o C), the amount of BZ formation exceeds that of BT, which is in contrast to the result reported earlier for the mixed oxide route BTZ synthesis [81]. The reason behind this is (a) high reactivity of very fine homogeneously mixed ZrO 2 particles as it was formed through solution precipitation, de-hydroxylation
46 and (b) finishing of the lower size particle fraction of TiO 2 in the mixture. However, the rate of BT formation increases rapidly above 1000 o C. The amount of BZ decreases slightly at 1050 o C, which may be due to the formation of BTZ. The BTZ starts forming from 1050 o C onwards. The amount of BT and BZ decreases sharply above 1100 o C and formation of BTZ increases rapidly due to inter diffusion reaction between BT and BZ % Product B az ro 3 B at io 3 B at i 0.6 Z r 0.4 O 3 B ac O T em perature( o C ) 0 Fig.3.4. Non-isothermal transformation kinetics of precursor in static air. This powder synthesis is a route in between conventional solid state and chemical synthesis. So the route is expected to produce powder better than solid-state route and the results are in accordance with this. A comparison with [81], reported that BTZ was formed at 1500 o C-1550 o C for 1 hour calcinations where as in this case it was formed at 1200 o C for 2 hours. About 90% of BT and BZ are formed at about 1300 o C for solid state route but here 90% BZ is formed at 1000 o C and that of BT at 1100 o C. So it indicates that the phase formation was better for the present synthesis route. Compared with chemical route, the calcinations temperature for phase formation by this route (1200 o C for 2h) is slightly higher than, for example, 1100 o C for 5 h that reported for sol-gel synthesis of BTZ [26].
47 To check the phase formation kinetics, the concentrations of phases were used to measure the activation energy for their formation using the following relationship [90]: a k = log t a x (3.7) where k is the velocity constant of first order reaction, t is the time in second, a is the initial concentration and x is the concentration after time t. The activation energy (Q) for different phase formation reactions were derived using: log k = Q 1 + log A 2.303R T (3.8) where T is the temperature in Kelvin, and A is a constant called the frequency factor. Log k versus 1/T, plot as shown in Fig. 3.5, represents Arrhenius type dependency of reaction rate on calcinations temperature for BT, BZ and BTZ formation. It shows that BT formation requires less activation energy 134 KJ mol -1 in the temperature range 950 o C to 1100 o C, than that of BZ formation (167.5 KJ mol -1 in range 800 o C to 1000 o C). BT formation activation energy in the temperature range 700 o C to 950 o C is not evaluated here due to its temporary slow down in formation kinetics. Phases were formed in this system through inter-diffusion between different particles. Inter-diffusions take place with different ions limiting the speed of diffusion. The phase formation reactions may be limited by the diffusion of Ti for BT and Zr for BZ formation, respectively. In this case, Ba and O are assumed to be immobile because their concentrations are spatially invariant. That is, two reactions are occurring in the same environment of BaCO 3. Since BT and BZ are formed by reacting respective constituents with BaCO 3, which is uniformly distributed in the precursor mixture, effect of Ba and O on the phase formation of BT and BZ is considered to be equivalent and hence neglected. Since, Zr 4+ has higher ionic radius than Ti 4+, its diffusion requires higher energy to form perovskite phase. BTZ solid solution formation requires much higher activation energy KJ mol -1. However, that is less than KJ mol -1 reported earlier by J. Bera et. al. [81], for solid-state synthesis route. For BTZ formation reaction, the rate may be limited by the diffusion of Ba and/or O movement, which were proposed to be moveable during inter-diffusion experimental study in doped BT BZ perovskite [83].
48 -6 BT AE=134KJ mol -1 BZ AE=167.5 KJ mol -1 BTZ AE=503.6 KJ mol -1-8 Ln(K) /T (Kelvin -1 ) Fig.3.5. Arrhenius dependence of reaction rate on calcinations temperature for the transformation of precursors to BaTiO 3 ( ) and BaZrO 3 ( ) and then to BaTi 0.6 Zr 0.4 O 3 solid solution ( ) and their calculated activation energy (AE). The lattice parameter of BT (a o = ±10) remains more or less constant in all temperature ranges up to 1150 o C. In case of BZ, it is almost constant (a o = 4.182±08) up to 1000 o C and decreases (a o = ) as the temperature increases to 1150 o C. It is supposed that titanium from BT inter-diffuses in to BZ after 1050 o C, which is responsible for this decrease in lattice parameter. From the XRD, it is found that [110] peak of BZ shifts to higher angle with increase in calcinations temperature from 1050 o C to 1150 o C. It indicates the decrease in unit cell volume due to the incorporation of smaller Ti 4+ ions. The lattice parameter of BT remains constant indicating there is no diffusion of Zr 4+ ion into BT lattices. The lattice parameter of BTZ (a o = (37)) decreases to (a o = (19)) with the increase in reaction time from 2 hours to for 16 hours at 1200 o C. This confirms the diffusion of titanium from BT in to BZ. It indicates that the initial solid solution was
49 higher in Zr 4+ ion content than the final equilibrium one. So it may be considered that solid solution grows on BZ lattices having a coherent interface with BZ crystal. As BT decomposes and Ti diffuses into BZ, the lattice parameter of BZ decreases and that of BT remain constant. Moreover the lattice parameter a o = of BTZ indicates a good stoichiometry of the compound compared with reported parameter for BaTi 0.65 Zr 0.35 O 3 (a o =4.0683) by Sciau et.al. [24] and for BaTi 0.6 Zr 0.4 O 3 (a o =4.08) by Pantou et.al. [91]. Densification behaviour: To understand the sintering behavior, linear shrinkage of powder compact was measured up to 1450 o C at different heating rates as described by J. Jean et al [92]. Fig. 3.6 shows shrinkage behavior of compact powder at different constant heating rates. The shrinkage seems to start from around 1150 o C onwards. The onset sintering temperature is around 1300 o C and materials can be sintered within 1400 o C, which is lower than solid state synthesized power [83]. As expected the shrinkage curve shifted to higher temperature with increase in heating rate. The activation energy for the densification has been calculated from the equation as [92]: L d L 1 n Ln T o 1 1 = Ln Ko Ln( a) dt n n Q nrt (3.9) where L Lo is the fractional shrinkage over time, T is the temperature, n is the experimental exponent, K o is the pre-exponential term, a is the heating rate, Q is the apparent activation energy of sintering and R is the gas constant. The value of n can be determined from Fig. 3.7 by re-plotting the data in Fig. 3.6 as at different temperatures. L d L Ln o dt versus Ln ( a)
50 Linear shrinkage (%) C m in C m in C m in T e m p e ra tu re ( o C ) Fig.3.6. Shrinkage curves for Ba(Ti 0.6 Zr 0.4 )O 3 ceramics at different constant heating rates o C 1250 o C Ln(T*d( L/Lo)/dT) o C o 1350 o C Ln a ( o C min -1 ) Fig.3.7. Data in figure replotted according to equation (3.9) No significant change in slope (- n 1 ) is observed when the temperature is increased from 1150 o C to 1350 o C. These slopes have a range of 1 1 to and a mean
51 value of 2 1. With the knowledge of the value n, the value of Q of the rate-limiting step during constant-rate heating is determined by re-plotting the data used in Fig. 3.6 as L d L Ln o dt versus T 1 at different heating rates (Fig. 3.8). The activation energy at Q different heating rates is determined from the slopes ( ) of these straight lines. The 2R mean activation energy was calculated to be 550 KJ mol -1. Here again, the rate may be limited by the diffusion of Ba and/or O movement, as the activation energy is similar to that found for the BTZ phase formation. Ln(T*d( L/Lo)/dT) o C min o C min o C min /T (kelvin -1 ) Fig.3.8. Determination of activation energy at different constant heating rates for the shrinkage data obtained non-isothermally as represented in Fig 3.6. The section of shrinkage curve used in the activation energy calculation is from initial and intermediate stages of sintering, where neck growth and removal of porosity are the main reason for the shrinkage. Though, a small amount of grain growth takes place, which is well known to be the main process during final stage of sintering, it is expected to have negligible contribution towards shrinkage. That is why shrinkage, in this
52 case, is due to the removal of pores by diffusion of materials. Our investigation shows that the onset sintering temperature is around 1300 o C and materials can be sintered within 1400 o C, which is lower than solid state synthesized power sintering temperature. For example the sintering temperature of BaTiO 3 in solid state reaction route is around 1400 o C and that of BZ is 1500 o C [93]. So BTZ formation temperature lies between 1400 o C o C Conclusion BaTi 0.6 Zr 0.4 O 3 perovskite has been synthesized from the mixture of barium oxalate hydrate, titanium dioxide and zirconium oxy-hydroxide. Studies on phase formation mechanism show that, the BT and BZ phases are formed separately in the system. Then, BaTi 0.6 Zr 0.4 O 3 was formed by the reaction between BT and BZ. Formation of intermediate phases likes Ba 2 ZrO 4, Ba 2 TiO 4 or BaTi 3 O 7, etc., has not been detected. BT formation activation energy, 134 KJ mol -1, was lower than BZ formation energy, KJ mol -1. That may be due to the difference in their ionic radius. BT BZ solid solution was formed mainly by the diffusion of titanium from BT into the BZ lattice, where the latter phase acts as diminishing core. Activation energy for BTZ solid solution formation was KJ mol -1, which may be due to the diffusion of Ba and/or O ions through solid solution interface. The mean activation energy for sintering of compact powder was evaluated to be 550 KJ mol -1.
53 3.3 La doped Ba(Ti 0.6 Zr 0.4 )O Introduction Doping of ABO 3 and A(B B )O 3 based perovskite ferroelectrics is of great importance in the material technology of ferroelectric devices. Because of intrinsic capabilities, different dopants can be substituted in the lattice. The mechanism of dopant incorporation into the lattice has been extensively investigated and the behaviour of some transition metal ion as well as that of larger rare-earth ions has been elucidated by different researcher. However, the effect of the specific dopant on the electrical properties depends on the substitution site as well as on the nature of the lattice/electronic charge compensation defect. In Ba(Ti,Zr)O 3, a trivalent ion behaves as an acceptor when substitution occurs at Ti/Zr site or as donor when it substitutes at the Ba sites. The ionic radius is the parameter which mainly determines the substitution site. Because of their small size, transition series ions like; Cr 4+ (0.55Å), Fe 3+ (0.64Å), Co 3+ (0.63Å), Mn 3+ (0.64Å), Mn 4+ (0.53Å), Nb 5+ (0.64Å), and Ta 5+ (0.64Å) etc, prefers substitution on the Ti site. For Y 3+ and lanthanide ions of intermediate size (from Sm 3+ (1.04Å) to Er 3+ (0.96Å)), there are some indication that, the substitution site is not exclusive, but is affected by dopant concentration, sintering temperature, sintering atmosphere and Ba/Ti molar ratio. However, La 3+ (1.15Å) and Nd 3+ (1.08Å) are exclusively incorporated at the Ba 2+ (1.35Å) site, as their size is incompatible with that of Ti 4+ (0.68Å) [94-97]. Buscaglia et.al. [94] had prepared samples according to five formulations corresponding to different potential incorporation mechanism for Erbium in BaTiO 3 with different values of the Ba/Ti molar ratio. The mechanisms are stated below: Case 1: Barium substitution electron compensation with formula A 1-x Er x e x BO 3, where free electrons are added into the lattice, for which there is no need of vacancy compensation. This is also called electron donor doping.
54 Case 2: Barium substitution titanium vacancy compensation with general formula A 1-x Er x B 1-x/4 O 3, where erbium substitution at Ba site needs vacancy compensation in Ti site. Case 3: Barium substitution barium vacancy compensation with general formula A 1-3x/2 Er x BO 3, where erbium substitution at Ba site needs vacancy compensation in Ba site. Case 4: Self compensation with general formula A 1-x/2 Er x B 1-x/2 O 3, where erbium substitutes both Ba and Ti site and the charge is being compensated within itself. Case 5: Titanium substitution oxygen vacancy compensation with general formula AEr x B 1-x O 3-x/2, where erbium substitution at Ti site needs vacancy creation in oxygen site. The compensation mechanism as stated in case 2 above has been adopted in the present investigations because that generate most insulating dielectrics due to the B site vacancy compensation mechanism [98]. B site in the present dielectrics BTZ contains Ti and Zr. So the charge compensation can be done by creating vacancy (i) at Ti only, (ii) at Zr only and (iii) at both the Ti and Zr. The material has been synthesized by modified solid state route considering above three B site compensation mechanisms. The phase formation characteristics were investigated. The shrinkage behavior of the powder was studied Experimental procedure Lanthanum doped BaTi 0.6 Zr 0.4 O 3 composition Ba 1-x La x Ti 0.6[1-(5x/12)] Zr 0.4 O 3, Ba 1- xla x (Ti 0.6 Zr 0.4(1-5x/8) )O 3 and Ba 1-x La x (Ti 0.6(1-x/4) Zr 0.4(1-x/4) )O 3 with x = 0.005, 0.01, 0.02, 0.05 and 0.1 were prepared. The compensation mechanism formulae are derived as follows:
55 The general formula with this compensation mechanism is Ba 1-x La x (Ti 0.6 Zr 0.4 ) 1- x/4o 3 with ([Ba+La]/[Ti+Zr])>1. There are three possible cases of vacancy compensation, according to vacancy creation at Ti and/or Zr. 1. Vacancy creation only at Ti. Ba 1-x La x (Ti 0.6 Zr 0.4 ) 1-x/4 O 3 = Ba 1-x La x (Ti 0.6(1-x/4) Zr 0.4(1-x/4) )O 3 = Ba 1-x La x (Ti 0.6(1-x/4) Zr ( x/4) )O 3 = Ba 1-x La x (Ti (0.6(1-x/4)-(0.6*(0.4/ 0.6)x/4)) Zr 0.4 )O 3 = Ba 1-x La x (Ti 0.6(1-x/4-x/6) Zr 0.4 )O 3 = Ba 1-x La x (Ti 0.6(1-5x/12) Zr 0.4 )O 3 (3.10) 2. Vacancy creation only at Zr site. Ba 1-x La x (Ti 0.6 Zr 0.4 ) 1-x/4 O 3 = Ba 1-x La x (Ti 0.6(1-x/4) Zr 0.4(1-x/4) )O 3 = Ba 1-x La x (Ti *x/4 Zr 0.4(1-x/4) )O 3 = Ba 1-x La x (Ti 0.6 Zr (0.4(1-x/4)- (0.4*(0.6/ 0.4)x/4 )O 3 = Ba 1-x La x (Ti 0.6 Zr 0.4(1-x/4 6x/16) )O 3 = Ba 1-x La x (Ti 0.6 Zr 0.4(1-5x/8) )O 3 (3.11) 3. Vacancy creation both at Zr and Ti site. Ba 1-x La x (Ti 0.6 Zr 0.4 ) 1-x/4 O 3 = Ba 1-x La x (Ti 0.6(1-x/4) Zr 0.4(1-x/4) )O 3 (3.12) Analytical grade barium nitrate (Ba(NO 3 ) 2 ), lanthanum dioxide (La 2 O 3 ), titanium dioxide (TiO 2 ), zirconium oxy-chloride (ZrOCl 2.8H 2 O), ammonia (NH 4 OH) and oxalic acid ((COOH) 2.2H 2 O) were used as raw materials in this process. All the chemicals were from Merck, India (GR grade with 99% purity). To prepare 20gm batch of the composition Ba 1-x La x Ti 0.6[1-(5x/12)] Zr 0.4 O 3 with x=0.05, mol of barium nitrate, mol of titanium dioxide, mol of lanthanum dioxide, mol of zirconium oxy-chloride and 0.08 mol of oxalic acid were taken.
56 In Ba 1-x La x (Ti 0.6 Zr 0.4(1-5x/8) )O 3 with x=0.05, mol of barium nitrate, mol of titanium dioxide, mol of lanthanum dioxide, mol of zirconium oxychloride and mol of oxalic acid were taken. Similarly, in Ba 1-x La x (Ti 0.6(1-x/4) Zr 0.4(1-x/4) )O 3 with x=0.05, mol of barium nitrate, mol of titanium dioxide, mol of lanthanum dioxide, mol of zirconium oxy-chloride and 0.08 mol of oxalic acid were taken. The synthesis and characterization was the same as discussed in the section Prior to the addition of ZrOCl 2.8H 2 O into the barium nitrate solution, required amount of lanthanum dioxide was added along with small amount of HNO 3. Nitric acid helps in dissolving lanthanum dioxide into the solution Results and discussion Phase formation behaviour: Fig.3.9. shows the XRD patterns of the precursor for the composition Ba 0.98 La 0.02 (Ti Zr 0.4 )O 3 heated at different temperatures. The analysis of raw powder shows the presence of BaC 2 O 4.0.5H 2 O and TiO 2 (Fig. 3.9(a)). BaC 2 O 4.0.5H 2 O was converted to BaC 2 O 4 upon calcinations at 400o C (Fig. 3.9(b)). The 700 o C calcined precursor shows the presence of BaCO 3 and TiO 2. The precursor changed to pure phase upon calcination at 1200 o C for 4hours.
57 Intensity (a.u.) ε = B a C 2 O 4.5 H 2 O α α = B a L a ( T i Z r 0.4 ) O 3 δ = T io 2 β = B a C O 3 χ = B a C 2 O 4 α α α β β β β χ ε δ ε ε θ ( d e g r e e ) 0 Fig.3.9. XRD patterns for (a) raw precursor and precursors calcined at (b) 400 o C, (c) 700 o C, (d) 1200 o C of the composition Ba 0.98 La 0.02 (Ti Zr 0.4 )O 3. Fig.3.10 shows the phase formation of the composition Ba 0.98 La 0.02 (Ti Zr 0.4 )O 3 at different temperatures. (Fig. 3.10(a)) show the existence of both BT and BZ, which indicates that BT and BZ form separately in the system. This is almost similar to the phase formation of BTZ discussed in section
58 δ = B a T io χ = B a Z r O 3 α = B a C O ( e ) 8 Intensity (a.u.) χ δ χ δ ( d ) ( c ) ( b ) α ( a ) θ ( d e g r e e ) Fig XRD patterns of Ba 0.98 La 0.02 (Ti Zr 0.4 )O 3 precursor powder calcined for 2h at (a) 750 o C, (b) 850 o C, (c) 1000 o C, (d) 1100 o C, and (e) calcined for 4h at 1200 o C. 2 0 To get phase pure product, the dry powder was calcined at 1200 o C for 2-16 hours depending upon composition in the furnace. A rather long calcination time was adopted for higher lanthanum substitutions to ensure a homogeneous dopant distribution in the final composition. Fig.3.11 and Fig.3.12 shows the XRD patterns for the composition Ba (1- x)la x Ti 0.6[1-(5x/12)] Zr 0.4 O 3 and Ba 1-x La x (Ti 0.6 Zr 0.4[1-(5x/8)] )O 3, respectively with x values 0, 0.005, 0.01, 0.02, 0.05 and 0.1. The lanthanum doped BTZ composition was found to be cubic. Reduced lattice parameter is obtained for higher substitution of lanthanum. A gradual shift of peak 2Ө angles to the higher angle with increasing lanthanum percentage reveals the contraction of perovskite lattice due to the smaller size of La 3+ compared to Ba 2+.
59 ( f ) Intensity (a.u.) θ ( d e g r e e ) ( e ) ( d ) ( c ) ( b ) ( a ) Fig XRD patterns for Ba (1-x) La x Ti 0.6[1-(5x/12)] Zr 0.4 O 3 with x values (a) 0, (b) 0.005, (c) 0.01, (d) 0.02, (e) 0.05 and (f) Intensity (a.u.) ( f ) ( e ) ( d ) ( c ) ( b ) ( a ) θ ( d e g r e e ) Fig XRD patterns for Ba 1-x La x (Ti 0.6 Zr 0.4[1-(5x/8)] )O 3 with x values (a) 0, (b) 0.005, (c) 0.01, (d) 0.02, (e) 0.05 and (f)
60 Fig.3.13 shows the shrinkage curves for the composition Ba 1-x La x (Ti 0.6 Zr 0.4 ) 1-x/4 O 3 with x values 0, 0.02 and 0.1, at constant heating rate of 10 o C/min. It shows the sinterability of BaTi 0.6 Zr 0.4 O 3 is good compared to Ba 0.9 La 0.1 (Ti Zr 0.39 )O 3. Which implies lanthanum substitution decreases sinterability of BTZ ceramics (c) 8 Linear shrinkage (%) -2-4 (b) (a) Temperature ( o C) Fig Shrinkage curves for the composition Ba 1-x La x (Ti 0.6 Zr 0.4 ) 1-x/4 O 3 with x values (a) 0, (b) 0.02 and (c) 0.1 at heating rate of 10 o C/min. Similar shrinkage curves for Ba 0.9 La 0.1 (Ti Zr 0.39 )O 3 ceramics at different constant heating rates of 5 o C/min, 10 o C/min and 15 o C/min were found.
61 3.3.4 Conclusion Lanthanum doped BTZ; Ba 1-x La x Ti 0.6 Zr 0.4 O 3 ceramics are synthesized with three compensation mechanisms viz. (a) Vacancy creation only at Ti (b) Vacancy creation only at Zr and (c) Vacancy creation both at Ti and Zr. BTZ is formed via the formation of BaTiO 3 and BaZrO 3 separately followed by inter-diffusion of two. The ionic size of La 3+ is compatible with Ba 2+. Therefore lanthanum exclusively substituted at the Ba site. Lanthanum doped BTZ composition was found to be cubic. Reduced lattice parameter is obtained for higher substitution of lanthanum. A gradual shift of peak 2Ө angles to the higher angle with increasing lanthanum percentage reveals the contraction of perovskite lattice due to the smaller size of La 3+ compared to Ba 2+. Sinterability of BTZ decreases with increasing lanthanum substitution.
62 CHAPTER 4 ELECTRICAL CHARACTERIZATION 4.1 Introduction La- substituted Ba(Zr 0.4 Ti 0.6 )O 3 based relaxor ceramics were prepared through modified solid state route. The influence of lanthanum on the dielectric properties, tan δ and dc resistivity of Ba(Zr 0.4 Ti 0.6 )O 3 ceramics were examined. The effect of porosity on relative permittivity and tan δ was studied. The relaxor behavior of lanthanum doped samples was also analysed. The focus was on two conjugate effects which could be at the origin of the relaxor phenomena (1) the probable disorder exhibited, in appropriate scale regions, between the two tetravalent cations (2) the peculiar character of the rare-earth element which is known to induce an electronic donor-doping and/or an ionic compensation. 4.2 Dielectric properties In this work, the influence of lanthanum on relative permittivity and tan δ were examined. The frequency dependence of dielectric permittivity and tan δ of the ceramics were studied Experimental procedure Lanthanum doped compositions with x = 0.005, 0.01, 0.02, 0.05 and 0.1 in Ba (1- x)la x Ti 0.6[1-(5x/12)] Zr 0.4 O 3, Ba (1-x) La x (Ti 0.6 Zr 0.4[1-(5x/8)] )O 3 and Ba (1-x) La x (Ti 0.6[1-x/4] Zr 0.4[1- x/4])o 3 powders were prepared. The synthesis procedure has been described elaborately in the chapter 3. Calcined powders were used to fabricate pellets specimen for densification and then electrical characterization of all the dielectrics. A flow chart of fabrication, sintering and characterization is shown in Fig.4.1.
63 Calcined powder Milled for 24 hrs using zirconia ball in acetone media Drying at 50 o C Mixing for 2 hrs 0.5 wt% PVA addition Drying at 50 o C Granulation Pressing (15 mm Φ) at 3.5 Ton for 2 min Sintering at o C /4-8h Characterization of sintered specimens Density and porosity Microstructure Relative permittivity Tan δ Leakage Current Fig.4.1. Flow chart for specimen fabrication, sintering and characterization
64 Fabrication: The calcined powder was ball milled for 24 hours inside polyethylene jar using zirconia balls and water as medium. The milled powder was dried at 50 o C. The dried powder was then mixed with 0.5 wt.% PVA. The powder was then granulated by sieving and the granules were uniaxially pressed to disk-shaped pellet (15 mm Φ) at 3.5 ton pressure by uniaxial hydraulic pressing. Sintering: The pressed samples were sintered in an electrical furnace with super kanthal (MoSi 2 ) heating elements and alumina insulation boards as chamber walls (size of the chamber: 250x150x150mm). The thermal regime of the furnace was controlled through a Eurotherm programmer-cum-controller within ± 2 C accuracy. Fig. 4.2 shows the typical sintering profile. The compacted samples were heated from room temperature to 500 o C at a rate 2 o C/min followed by a soaking at 500 o C, 2h for binder burnout. Thereafter, the samples were heated at a rate 2 C/min to final sintering temperature C with a soaking time of 4-8 hours depending on compositions. Then the specimen was cooled at a rate 1 o C/min to room temperature. A long sintering time was adopted to ensure a homogeneous dopant distribution in the final material. The usually adopted sintering times do not always guarantees the attainment of uniform distribution of temperature. Less sintering times indicates non-equilibrium and distorted states within the ceramic samples. Density and apparent porosity measurement: Bulk density and apparent porosity of sinter specimens were determined by Archimedes principle. Samples were immersed in water and kept under a vacuum of 4mm of mercury for 5 hrs to ensure that water filled up the open pores completely. Then, soaked and suspended weights were measured at atmospheric pressure. The apparent porosity and bulk density were calculated as follows: Dry weight of the sample = W d, Soaked weight of the sample = W s, Suspended weight of the sample = W a
65 W % Apparent porosity = W s s W d W a x100 (4.1) Bulk density = W s W d W a (4.2) Holding Temperature ( o C) Holding Heating rate (2 o C/min) Heating rate (2 o C/min) Cooling rate (1 o C/min) Time (Min) 0 Fig.4.2. Typical sintering profile of BTZ specimens at 1300 C for 4hrs. Microstructural analysis: Microstructures of the sintered specimens were analyzed by a Scanning Electron Microscope (SEM). In SEM, a hot tungsten filament electron gun under vacuum emits electrons which pass through a series of electromagnetic lenses. The sample is then bombarded with a fine beam of electrons having acceleration potentials range from 1-30 KV. A part of the beam is reflected as back scattered electrons (BSE) along with low energy secondary electron emission (SE), cathode luminescence, and x-ray excitation beam and electron transmission also take place.
66 Images formed from the (SE) beam were studied in the extrinsic mode of SEM. While the images appeared very real as if they are photographed by ordinary means, the apparent illumination was a function of particle emission rather than radiation. The emitted secondary electrons are detected and displayed on a scanning TV display. A bright image will be the result of high secondary electron emission, while the primary influence on high emission is the surface structure of the specimen. The end result is therefore brightness associated with surface characteristics and an image which looks very much like a normally illuminated subject. Sample surfaces were ground with the help of a series of diamond grinding pad from 1200µm to 15µm on an automatic polishing machine. The samples were polished with 8µm diamond paste on a rotating disk. Final polishing was done with 6, 2 and 1µm diamond pastes to create a mirror finish on a lapping machine. Prior to microscopic analysis, the samples were thermally etched at 50 o C less than the respective sintering temperature. The thermally etched samples were mounted on a metal stub with carbon paint. The samples were thin coated with palladium under vacuum of 0.01 torr to make the surface conducting for SEM. The mounted specimens were studied by SEM (JEOL- JSM840). Capacitance and tan δ measurement: Capacitance and tan δ are the basic property of any capacitor. Electrodes were painted (Fig. 4.3) on the surface of the sintered sample using a conducting silver paste followed by firing at 700 o C for 10min, to form electrodes on both sides of the ceramic specimen for measurement purpose. The Impedance Analyzer; Model 4192A, Hewlett Packard, USA, with the maximum frequency limit of the instrument 13MHz, was used to measure the capacitance and tanδ of the samples. The sample was placed in a special sample holder meant for such type of measurements. The relative permittivity (ε r ) was calculated using the following formula:

67 cd ε r = (4.3) A ε 0 where ε o is the permittivity of free space, c the capacitance, d the thickness and A the capacitor area. Fig Schematic electrode arrangement on the sintered pellet sample. temperature. Variation of capacitance and tan δ with frequency was measured at room Result and discussion The bulk densities of the ceramics were as high as 90% of the theoretical density. Fig.4.4 and Fig.4.5 show the microstructure of Ba (1-x) La x Ti 0.6[1-(5x/12)] Zr 0.4 O 3 and Ba (1- x)la x (Ti 0.6 Zr 0.4[1-(5x/8)] )O 3 specimen. The grain size of samples decreases and then again increases with the increase of La concentration from 0 at.% to 10 at.%. These results reveal that small amount of La ( 2 at. %) doped in barium zirconate titanate ceramics, acts as grain growth inhibitor reducing grain size. However, grain growth is observed for higher La substitution. This is in accordance with the reported result of Chou et.al [31], who have prepared samples of the composition Ba (1 x) La x Zr 0.2 Ti 0.8 x/4 O 3 in air, with x in the range of maximum Fig.4.6 shows the energy dispersive x-rays (EDX) spectra of undoped and 0.5 at.% lanthanum doped sample. Lanthanum doped samples show the evidence of lanthanum, barium, titanium, zirconium and oxygen where as undoped sample show the existence of barium, titanium, zirconium and oxygen.


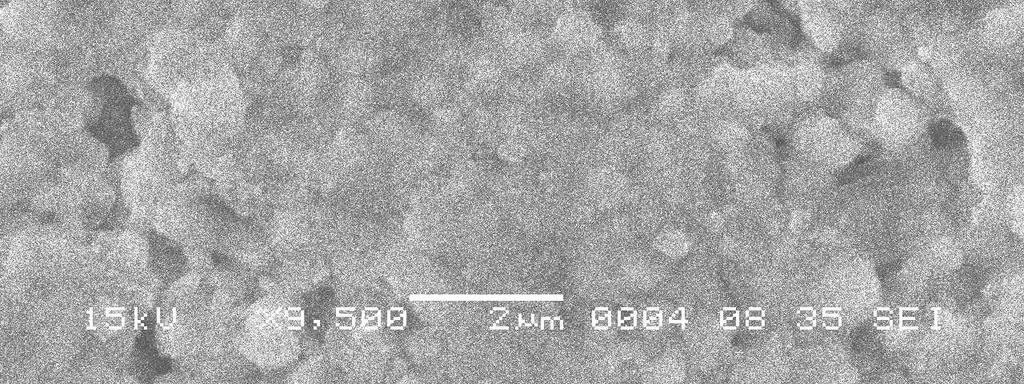
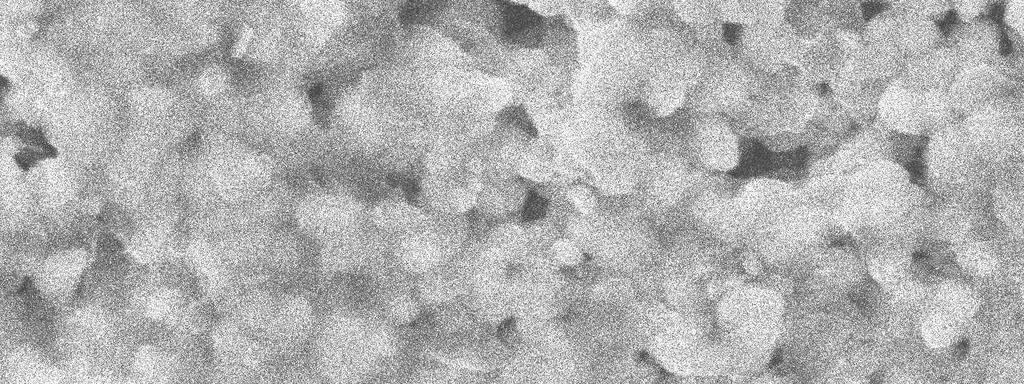


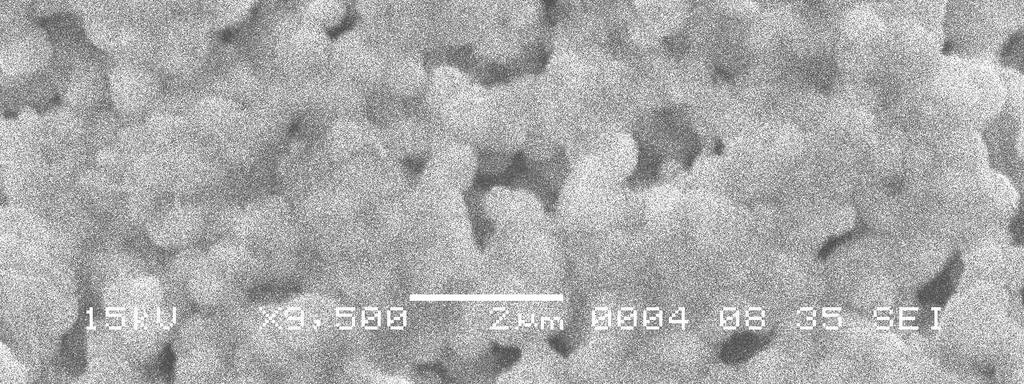


68 a b c d e f Fig.4.4. SEM micro structure of Ba(1-x)LaxTi0.6[1-(5x/12)]Zr0.4O3 with x values (a) 0, (b) 0.005, (c) 0.01, (d) 0.02, (e) 0.05 and (f) 0.1.

Lax(Ti0.")


69 a b c d e f Fig.4.5. SEM micro structure of Ba(1-x)Lax(Ti0.6Zr0.4[1-(5x/8)])O3 with x values (a) 0, (b) 0.005, (c) 0.01, (d) 0.02, (e) 0.05 and (f) 0.1.
![a b Fig.4.6. EDX spectra of Ba (1-x) La x Ti 0.6[1-(5x/12)] Zr 0.4 O 3 with x values (a) 0, (b) 0.005. The relative permittivity (ε r ) at room temperature was measured for different samples. Fig.4.7 shows the frequency dependency of relative permittivity for the composition Ba (1-x) La x Ti 0.](/docs-images/94/118561284/images/70-0.jpg "6[1-(5x/12)] Zr 0.4 O 3. The result shows a flat ε r with frequency. It indicates high dielectric stability against change in frequency. It is in accordance with the result reported by Wu et.al.")
![[27] and Aliouane et.al. [30]. Fig. 4.8 and Fig. 4.9 show the relative permittivity as a function of frequency for the composition Ba (1-x) La x (Ti 0.6[1- x/4]zr 0.](/docs-images/94/118561284/images/70-1.jpg "4[1-x/4] )O 3 and Ba (1-x) La x (Ti 0.6 Zr 0.4[1-(5x/8)]) O 3. These figures also show the same pattern as that of Fig 4.7. The permittivity value decreases with increasing lanthanum percentage.")
70 a b Fig.4.6. EDX spectra of Ba (1-x) La x Ti 0.6[1-(5x/12)] Zr 0.4 O 3 with x values (a) 0, (b) The relative permittivity (ε r ) at room temperature was measured for different samples. Fig.4.7 shows the frequency dependency of relative permittivity for the composition Ba (1-x) La x Ti 0.6[1-(5x/12)] Zr 0.4 O 3. The result shows a flat ε r with frequency. It indicates high dielectric stability against change in frequency. It is in accordance with the result reported by Wu et.al. [27] and Aliouane et.al. [30]. Fig. 4.8 and Fig. 4.9 show the relative permittivity as a function of frequency for the composition Ba (1-x) La x (Ti 0.6[1- x/4]zr 0.4[1-x/4] )O 3 and Ba (1-x) La x (Ti 0.6 Zr 0.4[1-(5x/8)]) O 3. These figures also show the same pattern as that of Fig 4.7. The permittivity value decreases with increasing lanthanum percentage. Permittivity of undoped sample was found to be around 900 where as for 10 atom % lanthanum doped, it was around 100. The ionic doping mechanism involves partial replacement of Ba +2 with the smaller La +3 ion on the A-site with creation of B-site vacancies. The B-site vacancy introduce void inside O 6 octahedra. It is known that in ABO 3 perovskite, ferroelectric phenomena are related to the shifting of B-site cation from its equivalent position. In the present case, both A-site replacement and B site vacancy reduce the permittivity. The unit cell parameters slightly decrease with La 3+, due to its smaller size.
Relaxor characteristics of ferroelectric BaZr 0.2 Ti 0.8 O 3 ceramics
 Materials Science-Poland, Vol. 27, No. 3, 2009 Relaxor characteristics of ferroelectric BaZr 0.2 Ti 0.8 O 3 ceramics C. FU 1, 2*, F. PAN 1, W. CAI 1, 2, X. DENG 2, X. LIU 2 1 School of Materials Science
Ferroelectric materials contain one or more polar axes along which a spontaneous
 Chapter 3 Ferroelectrics 3.1 Definition and properties Ferroelectric materials contain one or more polar axes along which a spontaneous polarization can be developed below the material s Curie temperature.
Effect of grain size on the electrical properties of Ba,Ca Zr,Ti O 3 relaxor ferroelectric ceramics
 JOURNAL OF APPLIED PHYSICS 97, 034109 (2005) Effect of grain size on the electrical properties of Ba,Ca Zr,Ti O 3 relaxor ferroelectric ceramics Xin-Gui Tang a) Faculty of Applied Physics, Guangdong University
CHAPTER 6 DIELECTRIC AND CONDUCTIVITY STUDIES OF ZIRCONIUM TIN TITANATE (ZST)
") 123 CHAPTER 6 DIELECTRIC AND CONDUCTIVITY STUDIES OF ZIRCONIUM TIN TITANATE (ZST) 6.1 INTRODUCTION We know that zirconium tin titanate ceramics are mostly used in microwave frequency applications. Previous
123 CHAPTER 6 DIELECTRIC AND CONDUCTIVITY STUDIES OF ZIRCONIUM TIN TITANATE (ZST) 6.1 INTRODUCTION We know that zirconium tin titanate ceramics are mostly used in microwave frequency applications. Previous
High tunable dielectric response of Pb 0.87 Ba 0.1 La 0.02 (Zr 0.6 Sn 0.33 Ti 0.07 ) O 3 thin film
 O 3 thin film") Journal of Applied Physics, 2010, Volume 108, Issue 4, paper number 044107 High tunable dielectric response of Pb 0.87 Ba 0.1 La 0.02 (Zr 0.6 Sn 0.33 Ti 0.07 ) O 3 thin film T. M. Correia and Q. Zhang*
Journal of Applied Physics, 2010, Volume 108, Issue 4, paper number 044107 High tunable dielectric response of Pb 0.87 Ba 0.1 La 0.02 (Zr 0.6 Sn 0.33 Ti 0.07 ) O 3 thin film T. M. Correia and Q. Zhang*
Dielectric, Piezoelectric and Nonlinear Optical Properties of Lead Titanate based Ferroelectric Thin films
 Dielectric, Piezoelectric and Nonlinear Optical Properties of Lead Titanate based Ferroelectric Thin films Ferroelectric oxides with perovskite structure has gained lot of interest from research as well
Introduction to solid state physics
 PHYS 342/555 Introduction to solid state physics Instructor: Dr. Pengcheng Dai Professor of Physics The University of Tennessee (Room 407A, Nielsen, 974-1509) Chapter 13: Dielectrics and ferroelectrics
Charge Polarization and Dielectric Relaxation in. Lead-Free Relaxor Ferroelectric
 International Journal of Physics and Applications. ISSN 0974-3103 Volume 3, Number 1 (2011), pp.73-82 International Research Publication House http://www.irphouse.com Effect of Space Charge Polarization
Dielectric and ferroelectric characteristics of barium zirconate titanate ceramics prepared from mixed oxide method
 Journal of Alloys and Compounds 462 (2008) 129 134 Dielectric and ferroelectric characteristics of barium zirconate titanate ceramics prepared from mixed oxide method F. Moura a,1, A.Z. Simões a,, B.D.
Ferroelectric Ceramic Technology for Sensors. Jim McIntosh Ceramic Operations Manager PCB Piezotronics
 Ferroelectric Ceramic Technology for Sensors Jim McIntosh Ceramic Operations Manager PCB Piezotronics Overview Ferroelectricity versus Piezoelectricity Historical Background Ferroelectric Ceramic Composition
CHAPTER-4 Dielectric Study
 CHAPTER-4 Dielectric Study Dielectric Study 4.1 Introduction The characterization of dielectric ceramics has received considerable scientific interest because of their enormous applications in electronic
8Y-Stabilized Cubic Zirconia Addition Effect on Barium Titanate
 Arab Journal of Nuclear Science and Applications, 46(5), (-223) 2013 8Y-Stabilized Cubic Zirconia Addition Effect on Barium Titanate Omar A. A. Abdelal Metallurgical Dept., NRC, Atomic Energy Authority
Classification of Dielectrics & Applications
 Classification of Dielectrics & Applications DIELECTRICS Non-Centro- Symmetric Piezoelectric Centro- Symmetric Pyroelectric Non- Pyroelectric Ferroelectrics Non-Ferroelectric Piezoelectric Effect When
User s Manual. STUDY OF DIELECTRIC CONSTANT Model: DEC-01
 User s Manual STUDY OF DIELECTRIC CONSTANT Model: DEC-01 Manufactured by.. Scientific Equipment & Services 358/1, New Adarsh Nagar, Roorkee - 247 667, UA, INDIA Ph.: +91-1332-272852, 277118 Fax: +91-1332-274831
5. Building Blocks I: Ferroelectric inorganic micro- and nano(shell) tubes
 tubes") 5. Building Blocks I: Ferroelectric inorganic micro- and nano(shell) tubes 5.1 New candidates for nanoelectronics: ferroelectric nanotubes In this chapter, one of the core elements for a complex building
5. Building Blocks I: Ferroelectric inorganic micro- and nano(shell) tubes 5.1 New candidates for nanoelectronics: ferroelectric nanotubes In this chapter, one of the core elements for a complex building
Piezo materials. Actuators Sensors Generators Transducers. Piezoelectric materials may be used to produce e.g.: Piezo materials Ver1404
 Noliac Group develops and manufactures piezoelectric materials based on modified lead zirconate titanate (PZT) of high quality and tailored for custom specifications. Piezoelectric materials may be used
DIELECTRIC AND TUNABLE BEHAVIOR OF LEAD STRONTIUM TITANATE CERAMICS AND COMPOSITES
 The Pennsylvania State University The Graduate School Intercollege Graduate Program in Materials DIELECTRIC AND TUNABLE BEHAVIOR OF LEAD STRONTIUM TITANATE CERAMICS AND COMPOSITES A Thesis in Materials
Microstructures and Dielectric Properties of Ba 1 x Sr x TiO 3 Ceramics Doped with B 2 O 3 -Li 2 O Glasses for LTCC Technology Applications
 J. Mater. Sci. Technol., 212, 28(3), 28 284. Microstructures and Dielectric Properties of Ba 1 x Sr x TiO 3 Ceramics Doped with B 2 O 3 -Li 2 O Glasses for LTCC Technology Applications Xiujian Chou 1),
Ferroelectric Materials
 Ferroelectric Materials The permanent electric dipole moment possessed by all pyroelectric [polar] materials may, in certain cases, be reoriented by the application of an electric field. Such crystals
Structural Analysis and Dielectric Properties of Cobalt Incorporated Barium Titanate
 AMANTULLA MANSURI, ASHUTOSH MISHRA School of Physics, Devi Ahilya University, Khandwa road campus, Indore, 452001, India Corresponding author: a.mansuri14@gmail.com Abstract The polycrystalline samples
Thin Film Bi-based Perovskites for High Energy Density Capacitor Applications
 ..SKELETON.. Thin Film Bi-based Perovskites for High Energy Density Capacitor Applications Colin Shear Advisor: Dr. Brady Gibbons 2010 Table of Contents Chapter 1 Introduction... 1 1.1 Motivation and Objective...
Ferroelectricity. Phase transition. Material properties. 4/12/2011 Physics 403 Spring
 Ferroelectricity. Phase transition. Material properties 4/12/211 Physics 43 Spring 211 1 Ferroelectricity. outline Ferroelectricity. Definition Discovery Main properties Phenomenological theory Some materials
Lecture 05 Structure of Ceramics 2 Ref: Barsoum, Fundamentals of Ceramics, Ch03, McGraw-Hill, 2000.
 MME 467 Ceramics for Advanced Applications Lecture 05 Structure of Ceramics 2 Ref: Barsoum, Fundamentals of Ceramics, Ch03, McGraw-Hill, 2000. Prof. A. K. M. Bazlur Rashid Department of MME, BUET, Dhaka
Chapter 3 Chapter 4 Chapter 5
 Preamble In recent years bismuth-based, layer-structured perovskites such as SrBi 2 Nb 2 O 9 (SBN) and SrBi 2 Ta 2 O 9 (SBT) have been investigated extensively, because of their potential use in ferroelectric
Effect of Ni doping on structural and dielectric properties of BaTiO 3
 Indian Journal of Engineering & Materials Sciences Vol. 16, December 2009, pp. 390-394 Effect of Ni doping on structural and dielectric properties of BaTiO 3 Yogeswar Kumar a, Md Ahamad Mohiddon a, Alok
Effect of Zr on dielectric, ferroelectric and impedance properties of BaTiO 3 ceramic
 Bull. Mater. Sci., Vol. 34, No. 7, December 2011, pp. 1483 1489. Indian Academy of Sciences. Effect of Zr on dielectric, ferroelectric and impedance properties of BaTiO 3 ceramic SANDEEP MAHAJAN 1,3, O
Supplementary Information
 Supplementary Information Large Electrocaloric Effect in Relaxor Ferroelectric and Antiferroelectric Lanthanum Doped Lead Zirconate Titanate Ceramics Biao Lu, Peilian Li, Zhenghua Tang, Yingbang Yao, Xingsen
DIELECTRIC STUDY OF BaZr 0.5 Ti 0.5 O 3 FERROELECTRIC RELAXOR CERAMIC
 International Journal of Electronics and Communication Engineering (IJECE) ISSN(P): 2278-9901; ISSN(E): 2278-991X Vol. 4, Issue 5, Aug - Sep 2015, 1-8 IASET DIELECTRIC STUDY OF BaZr 0.5 Ti 0.5 O 3 FERROELECTRIC
College of Mechanical Engineering, Yangzhou University, Yangzhou , China; 2
 Proceedings Light-Assisted Room-Temperature NO2 Sensors Based on Black Sheet-Like NiO Xin Geng 1,2,3, Driss Lahem 4, Chao Zhang 1, *, Marie-Georges Olivier 3 and Marc Debliquy 3 1 College of Mechanical
STRUCTURAL, DIELECTRIC AND ELECTRICAL PROPERTIES OF ZIRCONIUM DOPED BARIUM TITANATE PEROVSKITE
 CHAOTIC BEHAVIOR OF DYNAMICAL SYSTEMS OF HOMEOMORPHISM 151 STRUCTURAL, DIELECTRIC AND ELECTRICAL PROPERTIES OF ZIRCONIUM DOPED BARIUM TITANATE PEROVSKITE SHAMIMA CHOUDHURY *, SHURAYYA AKTER Department
Investigation on microstructure and dielectric behaviour of (Ba x Gd Cr x )TiO 3 ceramics
TiO 3 ceramics") Bull. Mater. Sci., Vol. 36, No. 4, August 2013, pp. 601 606. c Indian Academy of Sciences. Investigation on microstructure and dielectric behaviour of (Ba 0 999 x Gd 0 001 Cr x )TiO 3 ceramics SHIVANAND
Bull. Mater. Sci., Vol. 36, No. 4, August 2013, pp. 601 606. c Indian Academy of Sciences. Investigation on microstructure and dielectric behaviour of (Ba 0 999 x Gd 0 001 Cr x )TiO 3 ceramics SHIVANAND
Synthesis of BaTiO 3 by sol-gel and hydrothermal methods
 Synthesis of BaTiO 3 by sol-gel and hydrothermal methods Introduction: In the past decades, the extended applications of functional oxides in advanced technologies have increased the demand of the purity
Synthesis and CHARCTERIZATION of BATIO 3 High-K NANOMATERIAL. Abstrat
 Synthesis and CHARCTERIZATION of BATIO 3 High-K NANOMATERIAL Aditya N. Khare 1, Abhishek Sharma 2 1 Nanotechnology, Gyan Ganga college of Technology, Jabalpur, M.P. INDIA 2 Electronics and Communication
Panadda Sittiketkorn, Sarawut Thountom and Theerachai Bongkarn*
 NU Science Journal 2008; 5(2): 143-150 Effect of Calcination Temperatures on Phase Formation and Microstructure of Lead Titanate Powders Synthesized via Combustion Technique Panadda Sittiketkorn, Sarawut
Dielectric Properties of Two-Stage Sintered PMN-PT Ceramics Prepared by Corundum Route
 Dielectric Properties of Two-Stage Sintered PMN-PT Ceramics Prepared by Corundum Route Times New Roman # 14 R. Wongmaneerung a*, R. Yimnirun b, S. Ananta a Faculty of Science, Maejo University b School
Materials 218/UCSB: Phase transitions and polar materials
 Materials 218/UCSB: Phase transitions and polar materials Ram Seshadri (seshadri@mrl.ucsb.edu) Background: Intrinsic stability of thermodynamic systems (after H. B. Callen, Thermodynamics and an introduction
ESO 205 Nature and Properties of Materials
 Dielectric Materials Topics to discuss Principles of dielectrics Dielectrics Loss and Breakdown Polarizations Frequency dependence Ferro-, Piezo- and Pyro- electrics ESO 205 Nature and Properties of Materials
Effect of La-ions on Debye s Relaxation Time and Activation Energy of (Pb 1-1.5x La x )TiO 3 Ceramics
TiO 3 Ceramics") Egypt. J. Solids, Vol. (29), No. (2), (2006) 371 Effect of La-ions on Debye s Relaxation Time and Activation Energy of (Pb 1-1.5x La x )TiO 3 Ceramics M.K.Gergs Physics Department, Faculty of Science (Qena),
Egypt. J. Solids, Vol. (29), No. (2), (2006) 371 Effect of La-ions on Debye s Relaxation Time and Activation Energy of (Pb 1-1.5x La x )TiO 3 Ceramics M.K.Gergs Physics Department, Faculty of Science (Qena),
Micro-Brilouin scattering study of field cooling effects on ferroelectric relaxor PZN-9%PT single crystals
 Micro-Brilouin scattering study of field cooling effects on ferroelectric relaxor PZN-9%PT single crystals Jae-Hyeon Ko 1 *, Do Han Kim 2, Seiji Kojima 2, D. C. Feng 3 1 Department of Physics, Hallym University,
Lead-Free Ceramic-Polymer Composites for Embedded Capacitor and Piezoelectric Applications P. Kumar *
 Lead-Free Ceramic-Polymer Composites for Embedded Capacitor and Piezoelectric Applications P. Kumar * Department of Physics, National Institute of Technology, Rourkela, Odisha, India, 769008 Correspondence
Theerachai Bongkarn 1, Naratip Vittayakorn 2 and Gobwute Rujijanagul 3. Phitsanulok 65000, Thailand. Chiang Mai Thailand
 NU Science Journal 2005; 2(1): 21 32 Perovskite Phase Formation, Phase Transition and Ferroelectric Properties of PZN-based Ceramics Theerachai Bongkarn 1, Naratip Vittayakorn 2 and Gobwute Rujijanagul
Ferroelectricity. Phase transition. Material properties
 Ferroelectricity. Phase transition. Material properties BaTiO 3 DKDP KDP PZN-PT(9%) PMN-PT(30%) PMN-PT(40%) 4/1/2016 Physics 403 Spring 2016 1 Ferroelectricity. outline Ferroelectricity. Definition Discovery
Alfred University theses are copyright protected and may be used for education or personal research only. Reproduction or distribution in part or
 Alfred University theses are copyright protected and may be used for education or personal research only. Reproduction or distribution in part or whole is prohibited without written permission from the
High-frequency dielectric spectroscopy in disordered ferroelectrics
 IMSPEMAS 3 High-frequency dielectric spectroscopy in disordered ferroelectrics J. Petzelt Institute of Physics, Acad. Sci. Czech Rep., Prague Collaborators: Institute of Physics, Prague: V. Železný, S.
Micromechanical modeling and simulation of piezoceramic materials
 Micromechanical modeling and simulation of piezoceramic materials B. Delibas 1, A. Arockia Rajan 1 & W. Seemann 2 1 Workgroup for Machine Dynamics, Technical University of Kaiserslautern, Germany 2 Institut
File Name: Supplementary Movie 1 Description: An electronic watch is powered and a capacitor is charged quickly while a TENG works in high vacuum.
 File Name: Supplementary Information Description: Supplementary Figures and Supplementary Notes File Name: Supplementary Movie 1 Description: An electronic watch is powered and a capacitor is charged quickly
Influence of Some Preparation Conditions on Debye s Relaxation Time and Related Properties of (Pb, La)TiO 3 Ceramics
TiO 3 Ceramics") Egypt. J. Solids, Vol. (30), No. (1), (2007) 47 Influence of Some Preparation Conditions on Debye s Relaxation Time and Related Properties of (Pb, La)TiO 3 Ceramics M. K. Gergs Physics Department, Faculty
Egypt. J. Solids, Vol. (30), No. (1), (2007) 47 Influence of Some Preparation Conditions on Debye s Relaxation Time and Related Properties of (Pb, La)TiO 3 Ceramics M. K. Gergs Physics Department, Faculty
Synthesis, impedance and dielectric properties of LaBi 5 Fe 2 Ti 3 O 18
 Bull. Mater. Sci., Vol. 24, No. 5, October 2001, pp. 487 495. Indian Academy of Sciences. Synthesis, impedance and dielectric properties of LaBi 5 Fe 2 Ti 3 O 18 N V PRASAD, G PRASAD, T BHIMASANKARAM,
Monika DUKAT, Aldona ZARYCKA
 ARCHIVES OF ACOUSTICS 33, 4 (Supplement), 39 44 (2008) A MICROSTRUCTURE, PIEZOELECTRIC AND DIELECTRIC PROPERTIES OF THE PZT CERAMICS OBTAINED BY THE SOL-GEL METHOD Monika DUKAT, Aldona ZARYCKA University
Dielectric and micromechanical studies of barium titanate substituted (1-y)Pb (Zn 1/3 Nb 2/3 )O 3 -ypt ferroelectric ceramics
Pb (Zn 1/3 Nb 2/3 )O 3 -ypt ferroelectric ceramics") Indian Journal of Pure & Applied Physics Vol. 48, May 2010, pp. 349-356 Dielectric and micromechanical studies of barium titanate substituted (1-y)Pb (Zn 1/3 Nb 2/3 )O 3 -ypt ferroelectric ceramics A K
Indian Journal of Pure & Applied Physics Vol. 48, May 2010, pp. 349-356 Dielectric and micromechanical studies of barium titanate substituted (1-y)Pb (Zn 1/3 Nb 2/3 )O 3 -ypt ferroelectric ceramics A K
Synthesis and Characterizations of Lead Free KNN. Ceramics near Morphotropic Phase Boundaries. Mausumi Pattanaik. Department of Physics
 Synthesis and Characterizations of Lead Free KNN Ceramics near Morphotropic Phase Boundaries by Mausumi Pattanaik Department of Physics For the award of the degree of M.Tech (R) to be submitted to National
Department of Physics & Astronomy. National Institute of Technology, Rourkela , Odisha, India. August 2014
 Structural and Electrical Studies of Ba(FeNb) 0.5 O 3 based High Dielectric Constant Materials Synthesized by Conventional and Microwave Processing Techniques THESIS SUBMITTED IN PARTIAL FULFILLMENT OF
Ceramic Processing Research
 Journal of Ceramic Processing Research. Vol. 17, No. 4, pp. 394~400 (2016) J O U R N A L O F Ceramic Processing Research Application of lower temperature for crystallization of PbTiO3 nanopowders by the
MME 467: Ceramics for Advanced Applications
 MME 467: Ceramics for Advanced Applications Lecture 26 Dielectric Properties of Ceramic Materials 2 1. Barsoum, Fundamental Ceramics, McGraw-Hill, 2000, pp.513 543 2. Richerson, Modern Ceramic Engineering,
Chapter 6 ELECTRICAL CONDUCTIVITY ANALYSIS
 Chapter 6 ELECTRICAL CONDUCTIVITY ANALYSIS CHAPTER-6 6.1 Introduction The suitability and potentiality of a material for device applications can be determined from the frequency and temperature response
Quenching-induced circumvention of integrated aging effect of relaxor lead lanthanum zirconate titanate and (Bi1/2Na1/2)TiO3-BaTiO3
TiO3-BaTiO3") Quenching-induced circumvention of integrated aging effect of relaxor lead lanthanum zirconate titanate and (Bi1/2Na1/2)TiO3-BaTiO3 Jiadong Zang, Wook Jo, and Jürgen Rödel Citation: Applied Physics Letters
Quenching-induced circumvention of integrated aging effect of relaxor lead lanthanum zirconate titanate and (Bi1/2Na1/2)TiO3-BaTiO3 Jiadong Zang, Wook Jo, and Jürgen Rödel Citation: Applied Physics Letters
Phase Transitions in Relaxor Ferroelectrics
 Phase Transitions in Relaxor Ferroelectrics Matthew Delgado December 13, 2005 Abstract This paper covers the properties of relaxor ferroelectrics and considers the transition from the paraelectric state
Processing and characterization of ferroelectric thin films obtained by pulsed laser deposition
 ELECTROCERAMICS IX, Cherbourg, 2004. Symp. D: Pyro, Piezo, Ferroelectrics: B1-P-578 Processing and characterization of ferroelectric thin films obtained by pulsed laser deposition F. Craciun a,*, M. Dinescu
The electric field induced strain behavior of single. PZT piezoelectric ceramic fiber
 The electric field induced strain behavior of single PZT piezoelectric ceramic fiber Xiong Yang a, Jing Zhou a,*, Sen Zhang a, Jie Shen b, Jing Tian a, Wen Chen a, Qi Zhang ac a State Key Laboratory of
Ferroelectrics. Disordered Ferroelectrics Relaxors.
 Ferroelectrics. Disordered Ferroelectrics Relaxors. 1 Ferroelctricity Main properties History. Discovery. Materials Relaxors Applications 2 Ferroelectric Materials. A ferroelectric material is a material
Multilayer Ceramic Capacitors: Mitigating Rising Failure Rates
 Multilayer Ceramic Capacitors: Mitigating Rising Failure Rates Dock Brown DfR Solutions Seattle, WA Abstract The multilayer ceramic capacitor (MLCC) has become a widely used electronics component both
THERMAL DEGRADATION AND AGING OF HIGH TEMPERATURE PIEZOELECTRIC CERAMICS
 University of entucky Unowledge University of entucky Master's Theses Graduate School 28 THERMAL DEGRADATION AND AGING OF HIGH TEMPERATURE PIEZOELECTRIC CERAMICS Sunil W. Gotmare University of entucky,
ELECTRONICS DEVICES AND MATERIALS
 2-2-2 ELECTRONICS DEVICES AND MATERIALS Atsunori KAMEGAWA SYLLABUS! Introduction to materials structure and dielectric physics (04/27)! Ferroelectricity involved in structural phase transitions (05/25)
Glassy behavior study of dysprosium doped barium zirconium titanate relaxor ferroelectric
 Journal of Advanced Ceramics 214, 3(4): 339 348 ISSN 2226-418 DOI: 1.17/s4145-14-126-9 CN 1-1154/TQ Research Article Glassy behavior study of dysprosium doped barium zirconium titanate relaxor ferroelectric
DIELECTRIC AND PIEZOELECTRIC PROPERTIES OF COMBINATORY EFFECT OF A-SITE ISOVALENT AND B-SITE ACCEPTOR DOPED PLZT CERAMICS
 Original papers DIELECTRIC AND PIEZOELECTRIC PROPERTIES OF COMBINATORY EFFECT OF A-SITE ISOVALENT AND B-SITE ACCEPTOR DOPED PLZT CERAMICS KODURI RAMAM, K. CHANDRAMOULI* Departmento de Ingenieria de Materials,
Roger Johnson Structure and Dynamics: Displacive phase transition Lecture 9
 9.1. Summary In this Lecture we will consider structural phase transitions characterised by atomic displacements, which result in a low temperature structure that is distorted compared to a higher temperature,
INVESTIGATION OF TEMPERATURE DEPENDENCES OF ELECTROMECHANICAL PROPERTIES OF PLZT CERAMICS
 Molecular and Quantum Acoustics vol. 28 (2007) 47 INVESTIGATION OF TEMPERATURE DEPENDENCES OF ELECTROMECHANICAL PROPERTIES OF PLZT CERAMICS M. CZERWIEC, R. ZACHARIASZ and J. ILCZUK Department of Material
Synthesis and Characterization of PbZrTiO3 Ceramics
 Synthesis and Characterization of PbZrTiO3 Ceramics T Vidya Sagar, T Sarmash, M Maddaiah, T Subbarao To cite this version: T Vidya Sagar, T Sarmash, M Maddaiah, T Subbarao. Synthesis and Characterization
-:Vijay Singh(09CEB023)
") Heterogeneous Semiconductor Photocatalyst -:Vijay Singh(09CEB023) Guided by Azrina Abd Aziz Under Dr. Saravanan Pichiah Preparation of TiO 2 Nanoparticle TiO 2 was prepared by hydrolysis and poly-condensation
Heterogeneous Semiconductor Photocatalyst -:Vijay Singh(09CEB023) Guided by Azrina Abd Aziz Under Dr. Saravanan Pichiah Preparation of TiO 2 Nanoparticle TiO 2 was prepared by hydrolysis and poly-condensation
Modifying the Electrical Properties of Ba 0 85 Ca 0 15 Zr 0 1 Ti 0 9 O 3 Ceramics by the Nanocrystals-Induced Method
 Copyright 2016 American Scientific Publishers All rights reserved Printed in the United States of America Article Journal of Nanoscience and Nanotechnology Vol. 16, 1 6, 2016 www.aspbs.com/jnn Modifying
Scholars Research Library. The phase and dielectric properties of the Sol gel BaTiO 3 c eramics
 Available online at www.scholarsresearchlibrary.com Scholars Research Library Archives of Physics Research, 2010, 1 (3):23-33 (http://scholarsresearchlibrary.com/archive.html) ISSN 0976-0970 CODEN (USA):
Barrier Layer; PTCR; Diffuse Ferroelectric Transition.
 1 BARRIER LAYER FORMATION AND PTCR EFFECT IN (1-x) [Pb(Fe 1/ Nb 1/ )O 3 ]-xpbtio 3 ( x =.13) CERAMICS SATENDRA PAL SINGH, AKHILESH KUMAR SINGH and DHANANJAI PANDEY School of Materials Science and Technology,
Electric field dependent sound velocity change in Ba 1 x Ca x TiO 3 ferroelectric perovskites
 Indian Journal of Pure & Applied Physics Vol. 49, February 2011, pp. 132-136 Electric field dependent sound velocity change in Ba 1 x Ca x TiO 3 ferroelectric perovskites Dushyant Pradeep, U C Naithani
Electrical Properties
 Electrical Properties Electrical Conduction R Ohm s law V = IR I l Area, A V where I is current (Ampere), V is voltage (Volts) and R is the resistance (Ohms or ) of the conductor Resistivity Resistivity,
A-site substitution-controlled dielectric dispersion in lead-free sodium bismuth titanate
 PRAMANA c Indian Academy of Sciences Vol. 72, No. 6 journal of June 2009 physics pp. 999 1009 A-site substitution-controlled dielectric dispersion in lead-free sodium bismuth titanate M RAGHAVENDER, G
Physical and Dielectric Properties of Silver Lithium Niobate Mixed Ceramic System
 American Journal of Materials Science and Engineering, 213, Vol. 1, No. 3, 54-59 Available online at http://pubs.sciepub.com/ajmse/1/3/5 Science and Education Publishing DOI:1.12691/ajmse-1-3-5 Physical
G. Ravichandran Aeronautics & Mechanical Engineering Graduate Aeronautical Laboratories California Institute of Technology
 Multi-Disciplinary University Initiative Army Research Office Engineering Microstructural Complexity in Ferroelectric Devices Mechanical Characterization G. Ravichandran Aeronautics & Mechanical Engineering
Hall effect and dielectric properties of Mn-doped barium titanate
 Microelectronic Engineering 66 (200) 855 859 www.elsevier.com/ locate/ mee Hall effect and dielectric properties of Mn-doped barium titanate a a a a b, * Xiang Wang, Min Gu, Bin Yang, Shining Zhu, Wenwu
SYNTHESIS AND CHARACTERIZATIONS OF BNT-BT AND BNT-KNN CERAMICS
 A Thesis On SYNTHESIS AND CHARACTERIZATIONS OF BNT-BT AND BNT-KNN CERAMICS By SUSHREE SANGEETA BARIK Under the Supervision Of Dr. Pawan Kumar Department of Physics and Astronomy National Institute of Technology,
Addition 1. Shear Stack Piezoelectric Elements and Shear Effect Basics
 120 Addition 1 Shear Stack Piezoelectric Elements and Shear Effect Basics Introduction The STM scanner built up in this work is a Besocke type scanner (see room temperature STM instrumental chapter). The
Materials and Devices in Electrical Engineering
 Examination WS 02/03 Materials and Devices in Electrical Engineering Monday 17 th of March, 9:00 11:00, International Department, SR. 203 Notice 1. It is allowed to use any kind of aids (books, scripts,
Dielectric, piezoelectric and pyroelectric properties of PMN-PT (68:32) system
 system") Dielectric, piezoelectric and pyroelectric properties of PMN-PT (68:32) system Pawan Kumar a, Seema Sharma a, O.P. Thakur b *, Chandra Prakash b, T.C. Goel a a Department ofphysics, Indian Institute of
Dielectric, piezoelectric and pyroelectric properties of PMN-PT (68:32) system Pawan Kumar a, Seema Sharma a, O.P. Thakur b *, Chandra Prakash b, T.C. Goel a a Department ofphysics, Indian Institute of
International Journal of Advance Engineering and Research Development
 Scientific Journal of Impact Factor (SJIF): 4.72 International Journal of Advance Engineering and Research Development Volume 4, Issue 9, September -2017 e-issn (O): 2348-4470 p-issn (P): 2348-6406 Analytic
Solids / Crystal Structure
 The first crystal analysis proved that in the typical inorganic salt, NaCl, there is no molecular grouping. The inference that the structure consists of alternate ions of sodium and chlorine was an obvious
High Temperature Materials. By Docent. N. Menad. Luleå University of Technology ( Sweden )
") Course KGP003 Ch. 12 High Temperature Materials By Docent. N. Menad Dept. of Chemical Engineering and Geosciences Div. Of process metallurgy Luleå University of Technology ( Sweden ) Ceramic materials
Course KGP003 Ch. 12 High Temperature Materials By Docent. N. Menad Dept. of Chemical Engineering and Geosciences Div. Of process metallurgy Luleå University of Technology ( Sweden ) Ceramic materials
Dielectric behaviour and a.c. conductivity in Cu x Fe 3 x O 4 ferrite
 Bull. Mater. Sci., Vol. 23, No. 5, October 2000, pp. 447 452. Indian Academy of Sciences. Dielectric behaviour and a.c. conductivity in Cu x Fe 3 x O 4 ferrite A N PATIL, M G PATIL, K K PATANKAR, V L MATHE,
CHAPTER 4. SYNTHESIS, CHARACTERIZATION OF TiO 2 NANOTUBES AND THEIR APPLICATION IN DYE SENSITIZED SOLAR CELL
 93 CHAPTER 4 SYNTHESIS, CHARACTERIZATION OF TiO 2 NANOTUBES AND THEIR APPLICATION IN DYE SENSITIZED SOLAR CELL 4.1 INTRODUCTION TiO 2 -derived nanotubes are expected to be applicable for several applications,
Effects of Crystal Structure on Microwave Dielectric Properties of Ceramics
 Journal of the Korean Ceramic Society Vol. 5 No. 5 pp. 5~55 008. Review Effects of Crystal Structure on Microwave Dielectric Properties of Ceramics Eung Soo Kim Chang Jun Jeon Sung Joo Kim and Su Jung
Steady-state diffusion is diffusion in which the concentration of the diffusing atoms at
 Chapter 7 What is steady state diffusion? Steady-state diffusion is diffusion in which the concentration of the diffusing atoms at any point, x, and hence the concentration gradient at x, in the solid,
CHAPTER-1 INTRODUCTION
 CHAPTER-1 INTRODUCTION 1.1 OVERVIEW In today s microelectronics computer industry, various types of memories are used for the data storage. Generally, memories are categorized into volatile and non-volatile.
Application of lower temperature for crystallization of PbTiO3 nanopowders by the. Sol-gel method
 1 Application of lower temperature for crystallization of PbTiO3 nanopowders by the Sol-gel method Maryam Lanki 1, Abolghasem Nourmohammadi 2*, Seyed Mohammad Hassan Feiz 1, Ehsan Rahmati Adarmanabadi
Effect of Ni doping on ferroelectric, dielectric and magneto dielectric properties of strontium barium niobate ceramics
 Indian Journal of Pure & Applied Physics Vol. 53, February 2015, pp. 119-124 Effect of Ni doping on ferroelectric, dielectric and magneto dielectric properties of strontium barium niobate ceramics S H
EVALUATION OF A.C. CONDUCTIVITY FOR LEAD SILICATE GLASS FROM DIELECTRIC MEASUREMENTS
 Journal of Electron Devices, Vol. 12, 2012, pp. 750-755 JED [ISSN: 1682-3427 ] EVALUATION OF A.C. CONDUCTIVITY FOR LEAD SILICATE GLASS FROM DIELECTRIC MEASUREMENTS D.K. Mahde, B.T.Chiad, Ghuson H.Mohamed
Dielectric Materials: Properties and Applications
 Dielectric Materials: Properties and Applications Content 1. Dielectrics : Properties 2. Fundamental definitions and Properties of electric dipole 3. Various polarization mechanisms involved in dielectric
Effect of Domain Wall Motion and Phase Transformations on Nonlinear Hysteretic Constitutive Behavior in Ferroelectric Materials
 Effect of Domain Wall Motion and Phase Transformations on Nonlinear Hysteretic Constitutive Behavior in Ferroelectric Materials A Dissertation Presented to The Academic Faculty By Kyle Grant Webber In
Recent Developments in Magnetoelectrics Vaijayanti Palkar
 Recent Developments in Magnetoelectrics Vaijayanti Palkar Department of Condensed Matter Physics & Materials Science Tata Institute of Fundamental Research Mumbai 400 005, India. Tata Institute of Fundamental
Properties of Compounds
 Chapter 6. Properties of Compounds Comparing properties of elements and compounds Compounds are formed when elements combine together in fixed proportions. The compound formed will often have properties
DEVELOPMENT OF HIGH-STRAIN LOW-HYSTERESIS ACTUATORS USING ELECTROSTRICTIVE LEAD MAGNESIUM NIOBATE (PMN)
") Proc. 3 rd CanSmart Workshop on Smart Materials and Structures, 28-29 Sep. (2) p.31 DEVELOPMENT OF HIGH-STRAIN LOW-HYSTERESIS ACTUATORS USING ELECTROSTRICTIVE LEAD MAGNESIUM NIOBATE (PMN) D.F. Waechter,
Proc. 3 rd CanSmart Workshop on Smart Materials and Structures, 28-29 Sep. (2) p.31 DEVELOPMENT OF HIGH-STRAIN LOW-HYSTERESIS ACTUATORS USING ELECTROSTRICTIVE LEAD MAGNESIUM NIOBATE (PMN) D.F. Waechter,
Synthesis and Ferroelectric Properties of KNO 3 films
 Synthesis and Ferroelectric Properties of KNO 3 films Shahid Ramay and Muhammad Sabieh Anwar LUMS School of Science and Engineering Friday, August, 20, 2010 Potassium nitrate (KNO 3 ) shows ferroelectric
Module 16. Diffusion in solids II. Lecture 16. Diffusion in solids II
 Module 16 Diffusion in solids II Lecture 16 Diffusion in solids II 1 NPTEL Phase II : IIT Kharagpur : Prof. R. N. Ghosh, Dept of Metallurgical and Materials Engineering Keywords: Micro mechanisms of diffusion,