Relatórios Coppead é uma publicação do Instituto COPPEAD de Administração da Universidade Federal do Rio de Janeiro (UFRJ)
|
|
|
- Cody Edwards
- 5 years ago
- Views:
Transcription
1 Relatórios Coppead é uma publicação do Instituto COPPEAD de Administração da Universidade Federal do Rio de Janeiro (UFRJ) Comissão de Pesquisa Angela da Rocha Rebecca Arkader Ricardo Leal Gerência de Publicações Regina Helena Meira de Castro Editoração Eletrônica Regina Helena Meira de Castro Referenciação e Ficha Catalográfica Ana Rita Mendonça de Moura Mendes, Beatriz Vaz de Melo. Robust fits for copula models / Beatriz Vaz de Melo Mendes, Eduardo F. L. de Melo e Roger Nelsen. Rio de Janeiro: UFRJ/COPPEAD, p.; 27cm. (Relatórios Coppead; 374) ISBN X ISSN Finanças Modelos matemáticos. I. Melo, Eduardo F. L. II. Nelsen, Roger. III. Título. IV. Série. CDD 332 Pedidos para Biblioteca Caixa Postal Ilha do Fundão Rio de Janeiro RJ Telefone: Telefax: biblioteca@coppead.ufrj.br Home-page: 1
2 ROBUST FITS FOR COPULA MODELS Beatriz V. M. Mendes1, Eduardo F. L. de Melo2 and Roger Nelsen3 Abstract In this paper we propose and compare two different methodologies for fitting copulas robustly. The first proposal consists of a robustification of the maximum likelihood method, where points previously identified as outliers by a high breakdown point covariance matrix estimator are downweighted in a maximum likelihood optimization procedure. The second proposal obtains robust estimates by minimizing selected empirical copula based goodness of fit statistics. We show through simulations that the proposed robust estimators are able to capture the correct strength of dependence of the data, providing more accurate estimates of copula based dependence measures such as the tail dependence coefficient. The experiments considered several εcontaminated copula models, for varying proportions ε of contaminating points. Another result in this paper is the finite sample distribution of some selected empirical copula based statistics and corresponding tables for testing and selecting the best copula fit. 1 COPPEAD Graduate School of Business COPPEAD Graduate School of Business 3 Lewis & Clark College, USA 2 2
3 1) INTRODUCTION The dependence structure of any multivariate distribution F may be best represented by its pertaining copula C. Given a d-dimensional data set, many suitable parametric copula models (Joe (1999), Nelsen (1999)) are available for this task. Model estimation may be carried on by the maximum likelihood method in two steps: first one performs the marginal estimation and then the copula fit, the so called IFM method (inference function for margins, introduced by Joe and Xu (1996)). The univariate fits typically pose no difficulties. It remains to fit copulas to the d-cube with Uniform(0,1) margins. Joe (1999) argues that we can expect the IFM method to be quite efficient since fully based on maximum likelihood estimation. Efficiency may be assessed either by comparing the estimators asymptotic covariance matrices, or by comparing their mean squared error from Monte Carlo simulations. When all data points are generated by the same data generating process F, the maximum likelihood method typically yield good estimates (MLE), possessing the usual good statistical properties. However, contaminations may occur in many ways. For example, gross errors generated by some contaminating distribution F* may change the strength and type of the association, resulting in inaccurate estimation of joint probabilities and dependence measures. Even more dangerous would be an error on the data columns alignment, for example when matching slow and fast trading high frequency equity data, which would cause no damage to the marginal fits, but could result in a completely distorted dependence structure. We also note that the copula [0,1]d sample space makes more difficult the graphical inspection of atypical points, especially when d > 2. We need thus an automatic robust procedure that would work well when there are, and when there are not contaminations in the data. Alternatives to the maximum likelihood estimation method for copulas exist in the literature. They are mainly nonparametric and include Genest, Ghoudi, and Rivest (1993), Genest and Rivest (1993), Capéraà, Fougères, and Genest, (1997), Fermanian and Scaillet (2003), Tsukahara (2005), Morettin et al. (2005), among others. However, to the best of our knowledge, no one has proposed yet robust estimates for copulas. Accordingly, in this paper we propose and compare two different methodologies for fitting copulas robustly. The first proposal consists in a robustification of the maximum likelihood method, where points previously identified as outliers by a high breakdown point covariance matrix estimator, are downweighted in a maximum 3
4 likelihood optimization procedure. Many high breakdown point covariance matrix estimators may be used in this preliminary phase. One may select the Minimum Volume Ellipsoid (MVE) or the Minimum Covariance Determinant (MCD) estimators of Rousseeuw (1983,1985), any redescending M-estimator (Tyler (1983), Tyler (1991)), the S-estimator (Lopuhaä, 1989), or the CM-estimator (Kent and Tyler, 1996). Illustrations on the role of robust covariance matrix estimators may be found in Rousseeuw and van Zomeren (1990). Any high breakdown robust estimator, able to find the pattern suggested by the majority of the data, typically downweights some small proportion of the data (see Tyler (1983), Rousseeuw and van Zomeren (1990), among others). In the first exploratory step, we chose to use the covariance affine equivariant estimator MCD, which is implemented in S-Plus. Based on the MCD estimates, a hard rejection weight function assigns zero-one weights to selected data points. In the second step, the copula model is fitted in a weighted maximum likelihood optimization procedure, yielding the Weighted Maximum Likelihood estimates, the WMLE. These estimates possess the usual good asymptotic properties under the true model (Rousseeuw, 1985). Under contaminated models we show in this paper, through simulations, that they possess small bias and variance, and outperform the MLE. The second proposal obtains robust estimates by minimizing selected empirical copula based goodness of fit statistics. These are the so called Minimum Distance estimators (MDE), first proposed by Wolfowitz (1953, 1957). Since the empirical copula is only defined on a lattice, we define our distance with discrete norms. We start with well known statistics (see Ané and Kharoubi, 2003) such as the Kolmogorov distance statistic K, the Cramer-von Mises statistic W2, the Anderson-Darling statistic AD, the Integrated Anderson-Darling statistic IAD, and apply different redescending weight functions, yielding 28 Minimum Distance estimators. The newly proposed statistics downweight the influence of points belonging to selected corners of the unit dcube, introducing robustness. All estimators are compared in a comprehensive simulation study. The experiments consider ε-contaminated parametric copula families, containing varying proportions ε of contaminating points. The selected families include elliptical copulas (Normal), copulas modeling extreme values, either maxima or exceedances (Gumbel, Galambos, Clayton, Husler Reiss), some widely used in practice copula families (Frank, Cook-Johnson, Joe, Joe-Clayton, Asymmetric Logistic model copula, and some other 4
5 copula families defined in Joe (1999)). For each parametric copula we find the best (smaller mean square error) robust estimator, and indicate the best MDE choice for that particular family. In this way we aim to provide guidance to the researcher or practitioner when applying our methods. Another result in the present paper are the finite sample and asymptotic distributions of the minimum distance statistics identified as best robust estimators by the simulation experiments. Some selected quantiles are given in tables for testing when searching for the best copula fit. This is an important issue since practitioners usually fit several parametric copula families and would like to have a tool for help choosing the right copula (Durrleman, Nikeghbali, and Roncalli, 2000). We provide a means for answering this long standing question. The remainder of this paper is organized as follows. In Section 2, we define copulas and review the classical estimation method. In Section 3, we define the new robust estimators. In Section 4, we carry out simulation experiments and compare the performances of classical and robust estimates. Several copula models are selected and contaminated with varying proportions of contaminations. For each family we provide three robust alternatives to the classical estimates possessing smaller mean squared error. Section 5, we show an application of our methods to a real data set. We conclude the paper in section 6. 2) COPULAS AND CLASSICAL ESTIMATION To simplify the notation, from now on we set d = 2 even though all inference methods in the paper are intended and work for dimensions d > 2. Let (X1, X2) be a continuous random variable (rv) in R2 with joint distribution function (cdf) F and margins Fi, I = 1, 2. Consider the probability integral transformation of X1 and X2 into uniformly distributed rvs on [0,1] (denoted Uuniform(0,1)), that is, (U1, U2) = (F1(X1), F2(X2)). The copula C pertaining to F is the joint cdf of (U1, U2). As multivariate distributions with Uniform(0,1) margins, copulas provide very convenient models for studying dependence structure with tools that are scale-free. As an alternative definition, for every (x1,x2) belonging to [-, ]2 consider the point in [0,1]3 with coordinates (F1(x1), F2(x2), F(x1,x2) ). This mapping from [0,1]2 to [0,1] is a 2-dimensional copula. From Sklar's theorem (Sklar, 1959) we know that for 5
![continuous rvs there exists a unique 2-dimensional copula C such that for all (x1,x2) belonging to [-, ]2, To measure monotonic dependence, one may use the copula based](/docs-images/88/116013547/images/6-0.jpg "Kendall's τ correlation coefficient.")

 =, for i = 1, 2. The lower tail dependence coefficient λl is defined in a similar way.")
 quantify the amount of extremal dependence within the class of asymptotically dependent distributions.")

6 continuous rvs there exists a unique 2-dimensional copula C such that for all (x1,x2) belonging to [-, ]2, To measure monotonic dependence, one may use the copula based Kendall's τ correlation coefficient. Kendall's τ does not depend upon the marginal distributions and is given by: This invariance property is not shared by the linear correlation coefficient ρ, which is actually the Spearman correlation coefficient between X1 and X2. To measure (upper) tail dependence one may use the upper tail dependence coefficient defined as if this limit exists, and where Fi-1 is the generalized inverse of Fi, i.e., Fi-1(ui) =, for i = 1, 2. The lower tail dependence coefficient λl is defined in a similar way. Both the upper and the lower tail dependence coefficients may be expressed using the pertaining copula: if these limits exist. The measures λu belonging to (0,1] (or λl belonging to (0,1]) quantify the amount of extremal dependence within the class of asymptotically dependent distributions. If λu = 0 (λl = 0) the two variables X1 and X2 are said to be asymptotically independent in the upper (lower) tail. In the case the true copula belongs to a parametric family, estimates of the parameters may be obtained through the IFM method mentioned in the Introduction, in the context of independent and identically distributed observations. There are mainly two versions: the fully parametric and the semiparametric approaches, detailed in Genest et al. (1993), Shih and Louis (1995), Joe (1999), and Chebrian et al. (2002). The fully parametric approach relies on the assumption of parametric marginal distributions. The Uniform(0,1) data, obtained from the estimated marginals, are used to 6

7 maximize the copula density function with respect to θ. The final results are very sensitive to the right specification of all marginals. In the semiparametric method, in the first step the standardized data are obtained as the empirical cdfs. In this case, the estimation procedure suffers from loss of efficiency, see Genest and Rivest (1993), even though many authors use it to avoid misidentification of the marginal cdfs (Frahm, Junker, Schmid, 2004). The behavior of the maximum likelihood estimators of copula parameters were investigated through simulations by Capéerà (1997) in the case of the Gumbel or logistic model, by Genest (1987) in the case of the Frank family, and by Mendes (2005) in the case of the Joe-Clayton copula. Genest (1987) investigated the performance of four estimators considering samples of size 10 to 50, and found that the method of moments estimator appears to have smaller mean squared error than the maximum likelihood estimator. Goodness of fit tests for copulas and alternative tools for checking the quality of fits are discussed in Fermanian (2003), Chen and Fan (2005), among others. In what follows we assume the margins have been already properly estimated and concentrate on fitting copulas robustly. 3) ROBUST ESTIMATES 3.1) The robust weighted maximum likelihood estimates (WMLE) Let { (u11,u12), (u21,u22),..., (ut1,ut2) } represent T independent and identically distributed (iid) observations of a bivariate copula. We first estimate the covariance matrix associated to the data using the high breakdown point affine equivariant MCD estimator. For a given integer h, the MCD location estimator is defined as the mean of the h points of the T.2 data set for which the determinant of the sample covariance is minimal. The MCD covariance estimator is the sample covariance of those h points. By taking, the MCD attains the best possible breakdown point at any data set in general position. To obtain consistency at the normal model the raw covariance estimate based on the h points is usually multiplied by a factor. We note that no particular distributions (marginals or joint) were assumed for the data. For the cases 7
 dependence structure defined by the majority of the points. Points identified as atypical will be given zero weight.")

8 d > 2, Davies (1987) showed that at an elliptical distribution, the MCD estimators are consistent for the true mean and covariance matrix. At this first step we are not concerned with efficiency. We just want to identify data points which seem not to follow the (linear) dependence structure defined by the majority of the points. Points identified as atypical will be given zero weight. Identification of points is based on the robust distances being the cutoff point the 0.90quantile of a chisquare distribution with 1 degree of freedom. To illustrate, Figure 1 shows the scatter plot of data simulated from a 5% contaminated Normal copula4 with ρ = 0.8, and the ellipsoids of constant probability equal to 0.90 associated with the covariances matrices estimated by the 0.50 breakdown point MCD and by the classical MLE. \ Figure 1: Data simulated from a 5% contaminated Normal copula with ρ = 0.8 and the ellipsoids of constant probability equal to 0.90 from the robust MCD and the classical MLE. In the second step we obtain the maximum likelihood estimates parameters θ, using just those data points assigned weights equal to one. 4 of copula The contamination scheme is explained in Section 4. 8
, x2,(t)} be the component wise order statistics of")
9 3.2) Minimum distance estimators The empirical copula function was introduced by Deheuvels (1979), and their limit properties studied in Deheuvels (1981a, 1981b). Let (x1,t, x2,t), t = 1,..., T, denote a sample of T iid bivariate observations from the distribution F with marginals F1 and F2, copula C with density c, and let {x1,(t), x2,(t)} be the component wise order statistics of the sample. Consider the lattice The empirical copula is defined on by where I[.] is the indicator function. According to Deheuvels (1979, 1981a, 1981b) the following identity holds, where FT is the empirical distribution function of a sample of F, and FT,1(x1) = FT(x1,+ ), FT,2(x2) = FT(+,x2) are the marginal empirical distributions. It is shown that Deheuvels's copula converges to C as T increases. The empirical copula density given by may be obtained from (Nelsen, 1999) and is Copula measures of goodness of fit may be obtained by minimizing some distance between the empirical copula and a fitted parametric copula C =. To obtain the MDE estimates we propose minimizing the following 9
10 selected empirical copula based goodness of fit statistics. The first discrete norm defined on used is the Kolmogorov statistic K defined by Deheuvels (1979, 1981a, 1981b) also studied the asymptotic properties of the Cramér-Von Mises statistic W2, which is the second empirical copula-based statistic used The third empirical copula-based statistic used, ADAK, is based on the AndersonDarling statistic (Stephens, 1974) and given in Ané and Kharoubi (2003). Ané and Kharoubi (2003) also considered a more global measure of discrepancy given by the Integrated Anderson-Darling statistic, IADAK, given by: The statistics (9) and (10) emphasize deviations in the tails (the corners of the unit square) by applying a weight function to (7) and (8). The weight function is The perspective and contours of (11) in the case of a Gumbel copula with θ=2 are shown in column 1 of Figure 2. However, this goal may be better achieved by multiplying (7) and (8) by the weight function w1: 10


, which assign more weight to points located at the LL, the UR, and both corners, respectively. The weight function w2,ll(.,.) represents the cdf of the square close to (1,1) and it is larger when the point is close to (0,0).")
11 which emphasizes just the points in the lower left (LL) and the upper right (UR) corners. The factors correspond to the cdf on the "L" shaped areas located at the LL and the UR quadrants of the unit square. This weight function is illustrated in column 2 of Figure 2, again for the Gumbel copula. 5 Note that when using the functions introduced above, points in the LR quadrant, in the UL quadrant, as well as those points in the middle will have the same influence on the resulting statistic, and this may be further improved. Accordingly, we propose the redescending weight functions w2,.(t1/t, t2/t), which assign more weight to points located at the LL, the UR, and both corners, respectively. The weight function w2,ll(.,.) represents the cdf of the square close to (1,1) and it is larger when the point is close to (0,0). The weight function w2,ur(.,.) represents the cdf of the square close to corner (0,0) and it is larger when the point is close to (1,1). The weight function w2,ll-ur(.,. ), illustrated in column 3 of Figure 2, represents the sum of the previous cdfs, and possesses the nice property of downweighting just points located at the LR and UL corners6. These weights are more natural since they all are in (0,1), whereas those w1 are all greater than 1. Figure 2 shows the three weight functions associated to the LL-UR case. We observe that the weight function given by (11), in column 1, is too flat in the middle and gives much more weight to LL when compared to UR. Our first proposed weight function w1, illustrated in column 2, is an improvement, since it enhances almost equally the two LL and UR corners, and does not emphasize the LR and the UL corners. The second weight function proposed w2, in column 3, is even more promising 5 We are estimating positive dependence, as explained in Section 4. Note this may be considered a smoothed version of the (hard) weight function used by the WMLE. See also Figure

, column 2, (w1), and column 3 illustrates (w2).")
12 because it gives equal weights to the LL and UR corners and to the middle points, just downweighting the points in LR and UL corners. Figure 2: Perspective and contours of the weight functions designed to introduce robustness in the case of the Gumbel copula with θ = 2. Column 1 shows (wak), column 2, (w1), and column 3 illustrates (w2). We now define robust variations of the Kolmogorov and of the Cramér-Von Mises statistics based on the proposed weight functions, w1 and w2. They are 12
, (AD2), (IAD1), and (IAD2).")
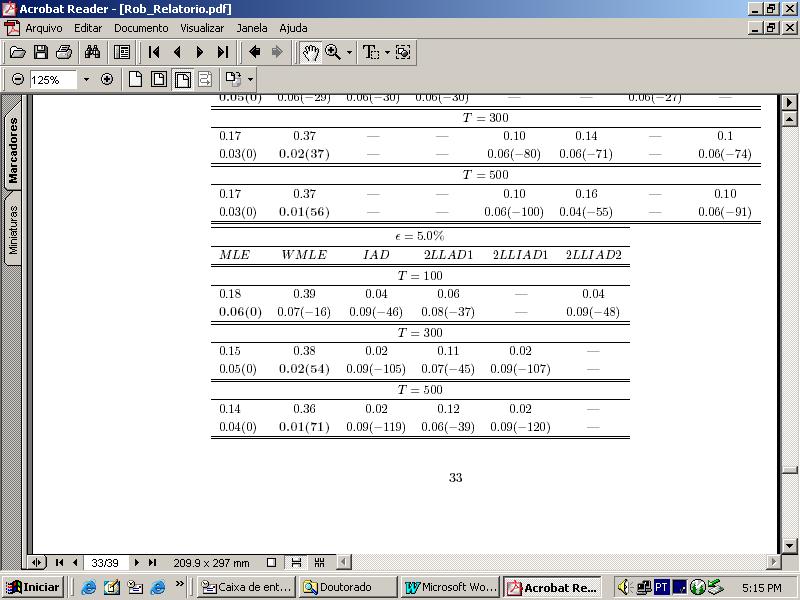
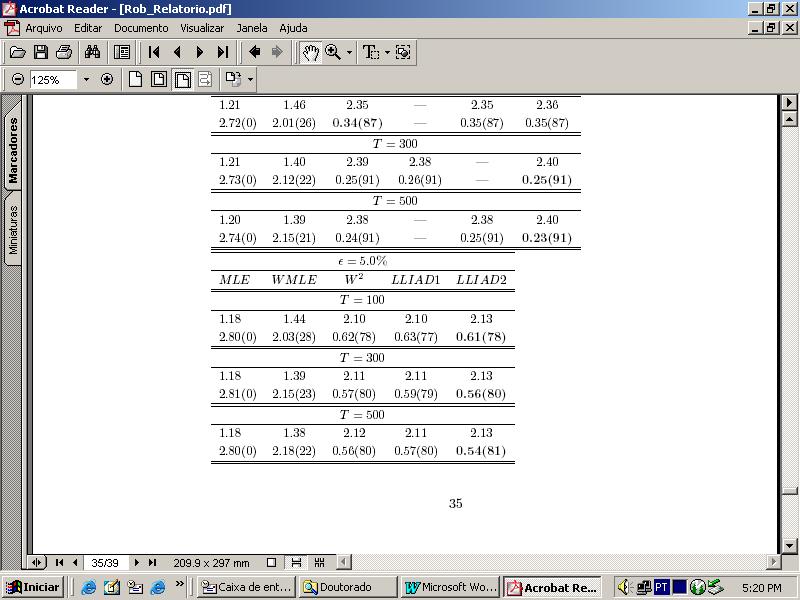
13 According to the copula type (possessing or not tail dependence) one may consider emphasizing just the LL or the UR quadrant. Thus we consider MDE statistics designed to emphasize just the points in one of the corners, based on variations of (AD1), (AD2), (IAD1), and (IAD2). They are the Lower Left tail Anderson-Darling (LLAD1 and LLAD2), the Upper Right tail Anderson-Darling (URAD1 and URAD2), the Lower Left tail Integrated Anderson-Darling (LLIAD1 and LLIAD2), and the Upper Right tail Integrated Anderson-Darling (URIAD1 and URIAD2). They are all based on weights (w1 and w2). For example, The other statistics are defined in Appendix 1. Still more weight may be given to the tails if we consider second degree statistics7. The second degree statistics, denoted as 2LLAD1, 2LLAD2, 2URAD1, 2URAD2, 2LLIAD1, 2LLIAD2, 2URIAD1 and 2URIAD2, use squared weights and are given in Appendix 1. 4) SIMULATIONS In this section we report the results from simulation experiments carried on to assess the performance of the proposed estimators. The copula families selected are those usually chosen in applications. For example, elliptical copulas are used to represent the dependence structure of many real life situations, such as modeling a set of financial log-returns (Embrechts et al., 2003). Our selection was also driven by theoretical considerations, for example, asymptotic results. The Gumbel copula is the limit copula pertaining to the asymptotic distribution of bivariate componentwise maxima (Charpentier (2004), Juri and Wüthrich (2002)). Bivariate excesses beyond high thresholds should be modeled by a Clayton (or Kilmedorf-Sampson) copula (Charpentier (2004), Juri and Wüthrich (2002)). Almost all copula families implemented in S-Plus (software used for computations) were considered. The copula families selected are given in Appendix 2. Simulations scheme: Data were generated from 12 bivariate parametric copula families. The sample sizes T were 100, 300 and 500. We considered ε-contaminated models, where a fraction ε.t of observations is replaced by atypical ones from a 7 For the sake of completeness, we also experimented the concept of entropy used by Ané and Kharoubi (2003). However, it did not lead to good solutions, and thus are not reported. 13

14 contaminating distribution F*. We set ε equal to 0%, 3%, and 5%, and F* as a normal distribution with very small variance and centered close to some corner of the unit square8. We had a total of 108 experiments, and the number of repetitions for each model was Our experiments considered just the cases where the rvs U1 and U2 possess positive association. For the sake of comparisons, for all copula models we set the true parameter value θ0 such that corresponding Kendall's correlation coefficient would be equal to The data simulated from F* is expected to act similarly to a point mass contamination, not following the dependence structure implied by the true copula parameters. They are supposed to weaken the strength of dependence shared by the remaining data. Thus our contaminating points are located at the LR or at the UL corners. For data showing negative association the same copulas could be fitted to the transformed (U1, 1-U2) data. Let represent, respectively, the classical and a robust estimate of the copula parameter θ0. The notation may represent either the WMLE or any of the 28 MDE estimates. To assess the performance of the proposed robust estimators use the squared loss function L(θ0, ), and compare the Mean Squared Error (MSE). We also compute the percentage reduction in average loss (PRIAL) for with we compared, i.e, we compute an estimate of MLE Simulations results: The simulations results are given in the tables that follow. The tables show the MSE and the (PRIAL %) for the 3 best robust estimates and for each one out of the 108 experiments. The overall winner is in bold face. We analyse in detail the results for the Clayton, Gumbel, Normal, and Frank copulas, given in Tables 1, 2, 3, and 4. The remaining tables are given in Appendix 3. Clayton copula. Under 0% of contamination all procedures resulted in very accurate point estimates. Accuracy and precision increase with T. The IAD shows 8 A less subjective procedure for defining the outlying values could have been used by applying the concept of robust distances of Rousseeuw and van Zomeren (1990). 14

15 excellent results very close of the winner, the MLE. Under contaminated models the MLE never won. The WMLE was clearly superior with point estimates very close to the true value. 15

16 Gumbel copula. Under no contamination, the MLE and the MDE statistics provided accurate point estimates. The WMLE is not a good choice for the Gumbel copula, since it overestimates the parameter and this is true for contaminated and non contaminated data. The LLIAD2 is the winner for contaminated models, presenting superior performance with respect to bias and variance. 16


17 Normal copula. As expected, since it is an elliptical copula, the MLE and the WMLE were the best estimates for models with and without contaminations. We note though the very good performance of the LLIAD2. 17


18 Frank copula. Under no contamination, MLE is the best estimator. For contaminated samples, even though the MLE appears as the winner for 5% and T = 300, 500, W2 appears as the winner 3 times and may be considered almost as good. 18


19 19

20 Table 5 presents a summary of results for all copula models. The table gives the winner and runner up under no contaminations, and the best (robust) option at contaminated models. Results are usually not dependent on the sample size. As expected, under no-contamination the best estimator is the MLE. Under contaminations, the best estimator for the majority of copula families was the LLIAD2. For the BB7 copula, even though the 2URIAD2 and the WMLE were, respectively, the winners at 3% and 5% contamination, the URIAD2 is almost as good for all contaminated models and was chosen as the overall winner. For all copulas possessing just upper tail dependence the LLIAD2 was the winner. 5) APPLICATION TO REAL DATA The application of the methods shown in this article was done in a data set provided by Insurance Services Office, Inc. This data set consists of 1,500 general insurance claims. One of the variables is the loss of each claim, or the amount of each of the claims (LOSS) and the other one represents the allocated administrative expense to pay the claim (ALAE). In the following table, it can be observed the statistical summary of each variable: 20

21 Based in these association measures it is possible to infer a high positive dependence. From the next plot, we can observe the dependence relationship between the two variables LOSS and ALAE. In order to fit the marginals, it was used the following procedure: (i) definition of a threshold representing the 95% empirical quantile of each variable LOSS and 21
22 ALAE, (ii) fit of a GPD distribution using l-moments estimation for the exceedances above the threshold (iii) empirical distribution for the rest of the data. This procedure was used because the empirical distribution usually don't show a good fit for the distribution tails. When there are several data points, the empirical distribution can provide a good fit for the tails. It is possible to observe the histograms of the exceedances above the threshold for the variable LOSS and the exceedances above the threshold for the variable ALAE. In the next table, we show the estimates marginals parameters with their respective standard errors, evaluated with the bootstrap algorithm. 22

23 After the marginals fitting, we modeled the copulas. In the next plot, we can observe the upper tail dependence between the variables LOSS and ALAE. Once the data presented a clearly upper tail dependence, it was fitted copulas with this characteristic. Then we fitted the following copulas: (i) AKS (Associated Kimeldorf Sampson), (ii) Gumbel, (iii) Galambos, (iv) Joe, (v) Husler Reiss, (vi) BB5 e (vii) BB6. The chosen estimates for each copula were the winners obtained in the last section of this paper. The results were: 23
24 It can be noted that the best copula fitted to the variables LOSS and ALAE, using the chi-square goodness of fit criteria, was the Galambos copula, with the parameter estimated by maximum likelihood. The estimators IAD1 and LLIAD2 provided very similar results in comparison to the MLE. For the Gumbel fit, the estimators IAD1 and LLIAD2 also provided similar results in comparison to the MLE method. On the other hand, for the AKS copula, the robust estimators LLIAD1 and WMLE provided better results than the MLE method. 6) CONCLUSIONS In this paper we proposed alternative robust estimators for copulas, motivated by the fact that even high quality data usually possess a small proportion of contaminating points. The first new estimator is based on the robust Minimum Covariance Determinant estimator (MCD). This is a two-step procedure where the weights returned by the MCD are used to identify outlying data points. The maximum likelihood estimates based on selected data are computed in the second step. We note that extreme atypical points are of great importance, but they require specific models, for example, models based on extreme value theory. The second proposal is based on the minimization of selected goodness of fit statistics. 24
25 Simulation experiments indicated that the proposed estimators perform well under ε-contaminated copula models. For any other copula family not considered here, the simulations may be easily implemented and run relatively fast. Estimators sample distributions may be assessed by simulations. For those already experimented we found a well behaved distribution for small sample sizes. Tables may be constructed for testing hypothesis. We are not addressing the important problem Which one is the right copula?, but we are indeed providing guidance for estimating several copula models. Of course conclusion may change with the MCD specification of breakdown point and cutoff point for outliers identification. A sensitive analysis may be carried on to assess the robustness of results with respect to these choices. 7) APPENDIX 7.1) Appendix 1: MDE statistics The definitions of the other MDE statistics designed to emphasize just the points in one of the corners, based on variations of AD1, AD2, IAD1, and IAD2 are given here. They are the Lower Left tail Anderson-Darling LLAD1 and LLAD2, the Upper Right tail Anderson-Darling URAD1 and URAD2, the Lower Left tail Integrated Anderson-Darling LLIAD1 and LLIAD2, and the Upper Right tail Integrated AndersonDarling URIAD1 and URIAD2. 25


26 The second degree statistics, 2LLAD1, 2LLAD2, 2URAD1, 2URAD2, 2LLIAD1, 2LLIAD2, 2URIAD1 and 2URIAD2, and are defined as: 26

27 7.2) Appendix 2: Copula families Elliptical Copulas: The class of elliptical distributions provides useful examples of multivariate distributions because they share many of the tractable properties of the multivariate normal distribution. Elliptical copulas are simply the copulas pertaining to elliptical distributions. in this paper, we used the Normal copula. Normal Copula: The Gaussian or Normal copula is the copula pertaining to the multivariate normal distribution. It is given by where ρ is simply the linear correlation coefficient between the two random variables. Clayton copula: The symmetric Clayton or Kimeldorf-Sampson copula was obtained by Juri and Wüthrich (2002) as the copula characterizing the limiting dependence structure in the upper-tails of two random variables assuming their dependence structure is Archimedean. It was also obtained by Frees and Valdez (1998) as the copula pertaining to the bivariate Pareto distribution. It is given by 27
, an Extreme Value copula as well as an Archimedean copula class, has the following form: The")
 is an Extreme Value copula: Joe copula: The Joe copula (Joe, 1993) is an Archimedean copula and has the form Husler Reiss copula: The Husler and")
28 Associated to Kimeldorf and Sampson copula: Copula used for the real data application. It was also obtained by Frees and Valdez (1998) as the copula pertaining to the bivariate Pareto distribution. This is a symmetric copula with the form: Gumbel copula: Well known Gumbel copula (Gumbel, 1960), an Extreme Value copula as well as an Archimedean copula class, has the following form: The coefficient of tail dependence is given by λ U = 2-21/δ, and corresponds to the symmetric logistic model (see Ghoudi, Khoudraji and Rivest, 1998). Galambos copula: Galambos copula (Galambos, 1975) is an Extreme Value copula: Joe copula: The Joe copula (Joe, 1993) is an Archimedean copula and has the form Husler Reiss copula: The Husler and Reiss copula (Husler and Reiss, 1989) is an extreme value copula given by 28
 is an asymmetric extreme value copula, which is")
 combined EV and Archimedean copula classes into a single class called Archimax copulas.")

 proved that it is a valid copula for any combination of valid function φ(t) and A(t).")

29 Frank copula: The Frank copula (Frank, 1979) is an Archimedean copula with the following distribution function: Tawn copula: The Tawn copula (Tawn, 1988, 1997) is an asymmetric extreme value copula, which is an extension of the Gumbel copula. It has the following dependence function BB4 copula: Capéraà et al. (2000) combined EV and Archimedean copula classes into a single class called Archimax copulas. The Archimax copulas are copulas which can be represented in the following form: where A(t) is a valid dependence function and φ a valid Archimedean generator. Archimax copulas reduce to Archimedean copulas for A(t) = 1 and to EV copulas for φ(t) = -log(t). Capéraà et al (2000) proved that it is a valid copula for any combination of valid function φ(t) and A(t). BB4 copula is a example of this class of copula with:. The distribution function is given by: where θ > 0, δ > 0. The upper tail dependence coefficient is given by λu = 2-1/δ. BB5 copula: BB5 copula (Joe, 1997), an EV copula, is a two-parameter extension of the Gumbel copula and has the form of: 29
, an Archimedean")
 and v(1) < v(2) <.")
 by the formula: emp is")
30 BB6 copula: BB6 copula (Joe, 1997), an Archimedean copula, has the form of: BB7 copula: BB7 copula (Joe, 1997), an Archimedean copula, has the form of: Empirical copula: If u(1) < u(2) <... < u(n) and v(1) < v(2) <... < v(n) are the order statistics of the univariate samples, the empirical copula point (i/n, j/n) by the formula: emp is defined at the 7.3) Appendix 3: Tables 30


31 31


32 32


33 33


34 34

35 35


36 36

37 37


38 8) REFERENCES ANÉ, T.; KHAROUBI, C. Dependence structure and risk measure. Journal of Business, v. 76, n. 3, p ,
39 CAPÉRAÀ, P.; FOUGÉRES, A.L.; GENEST, C. A nonparametric estimation procedure for bivariate extreme value copulas. Biometrika, v. 84, n. 3, p , CHARPENTIER, A. extremes and dependence: a copula approach. Submitted Disponível em: /charpent.htm. DAVIES, P.L. Asymptotic behavior of s-estimates of multivariate location parameters and dispersion matrices. Annals of Statistics, v. 15, p , DEHEUVELS, P. La funcion de dépendance empirique et ses proprietes. Un test non parametrique d independance. Acad. R. Belg., Bull. Cl. Sci. v. 5, Serie 65, p , A Kolmogorov-Smirnov type test for independence and multivariate samples. Rev. Roum. Math. Pures et Appl., Tome XXVI, v. 2, p , 1981a.. A nonparametric test for independence. Publicacions de l'isup, n. 26, p , 1981b. DURRLEMAN, V.; NIKEGHBALI, K.; RONCALLI, T. Which copula is the right one?. Paris: Credit Lyonnais, Groupe de Reserche Operationnelle, Working paper. EMBRECHTS, P.; LINDSKOG, F.; MCNEIL, A.Modelling dependence with copulas and applications to risk management. In: Rachev, S.T. (Ed.) Handbook of heavy tailed distributions in finance. Amsterdam: Elsevier/North Holland, FERMANIAN J-D.; SCAILLET, O. Nonparametric estimation of copulas for time series. Journal of Risk, v. 5, p , FRAHM, G.; JUNKER, M.; SCHMIDT, R. Estimating the tail-dependence coefficient: Properties and Pitfalls. Mathematical Methods of Operations Research, v. 55, n. 2, p , FRANK, M. J. On the simultaneous associativity of F(x,y) and x + y - F(x,y). Aequationes Math, v. 19, p , FREES, E.W.; VALDEZ, E. Understanding relationships using copulas. North American Actuarial Journal, v. 2, p. 1-25, GALAMBOS, J. Order statistics of samples from multivariate distributions. Journal of American Statistical Association, v. 70, p ,
40 GENEST, C. Frank's family of bivariate distributions. Biometrika, v. 74, p , ; RIVEST, L.-P. Statistical inference procedures for bivariate Archimedean copulas. Journal of the American Statistical Association, v. 88, p , ; GHOUDI, K.; RIVEST, L.P. A semiparametric estimation procedure of dependence parameters in multivariate families of distributions. Biometrika, v. 82, p , GHOUDI, K.; KHOUDRAJI, A.; RIVEST, L.P. Proprietes statistiques des copules de valeurs extremes bidimensionnelles. Canadian Journal of Statistics, v. 26, p , HUBER, P. J. Robust regression: asymptotics, conjectures and Monte Carlo. Annals of Statistics, v. 1, p , HÜSLER, J.; REISS, R.-D. Maxima of normal random vectors: between independence and complete dependence. Statist. Probab. Lett., v. 7, p , JOE, H. Parametric families of multivariate distributions with given margins. Journal of Multivariate Analysis, v. 46, p , ; XU, J. The estimation method of inference function for margins for multivariate models. Vancouver: Univ. of British Columbia, Dept. of Statistics, Technical Report, n Multivariate models and dependence concepts. London: Chapman & Hall, JURI, A.; WÜTHRICH, M.V. Tail dependence from a distributional point of view Preprint. Disponível em: publications.html. KIMELDORF, G.; SAMPSON, A. R. Uniform representation of bivariate distributions. Commun Statist, v. 4, p , LOPUHAA, H.P. On the relation between S-estimators and M-estimators of multivariate location and covariance. Annals of Statistics, v. 17, p , KENT, J.; TYLER, D. E. Constrained M-estimation for multivariate location and scatter. Ann. Statistics, v. 24, p ,
41 MORETTIN, P.A. et al. Nonlinear wavelet estimation of copulas for time series. Proceedings 2nd. Brazilian Conference in Insurance and Finance, Maresias, SP, NELSEN, R.B. An introduction to copulas. New York: Springer, ROUSSEEUW, P.J. Multivariate estimation with high breakdown point. In: Pannonian Symposium of Mathematical Statistics and Probability, 4., Tatzmannsdorf, Austria, September 4-9, Multivariate estimation with high breakdown point. In: Grossmann, W et al (eds.) Mathematical statistics and applications, Vol. B, p Reidel: Dordrecht, ; Van ZOMEREN, B. C. Unmasking multivariate outliers and leverage points. Journal of the American Statistical Association, v. 85, p , SKLAR, A. Fonctions de repartition n dimensions et leurs marges. Publ. Inst. Statist. Univ. Paris, v. 8, p , STEPHENS, M. A. EDF statistics for goodness of fit and some comparisons. Journal of the American Statistical Association, v. 69, p , TSUKAHARA, H. Semiparametric estimation in copula models. The Canadian Journal of Statistics, v. 33, n. 3, p , TAWN, J. A. Bivariate extreme value theory: models and estimation. Biometrika, v. 75, p , TYLER, D.E. Breakdown properties of the m-estimators of multivariate scatter. New Jersey: Rutgers University, Technical Report.. Some issues in the robust estimation of multivariate location and scatter. In: STAHEL, W. A.; WEISBERG, S. (eds.) Directions in Robust Statistics, Part II, New York: Spring-Verlag, WOLFOWITZ, J. Estimation by the minimum distance method. Annals of the Institute of Statistical Mathematics, v. 5, p. 9-23, The minimum distance method. Annals of Mathematical Statistics, v. 28, p ,
EVANESCE Implementation in S-PLUS FinMetrics Module. July 2, Insightful Corp
 EVANESCE Implementation in S-PLUS FinMetrics Module July 2, 2002 Insightful Corp The Extreme Value Analysis Employing Statistical Copula Estimation (EVANESCE) library for S-PLUS FinMetrics module provides
Robustness of a semiparametric estimator of a copula
 Robustness of a semiparametric estimator of a copula Gunky Kim a, Mervyn J. Silvapulle b and Paramsothy Silvapulle c a Department of Econometrics and Business Statistics, Monash University, c Caulfield
A measure of radial asymmetry for bivariate copulas based on Sobolev norm
 A measure of radial asymmetry for bivariate copulas based on Sobolev norm Ahmad Alikhani-Vafa Ali Dolati Abstract The modified Sobolev norm is used to construct an index for measuring the degree of radial
Bivariate Rainfall and Runoff Analysis Using Entropy and Copula Theories
 Entropy 2012, 14, 1784-1812; doi:10.3390/e14091784 Article OPEN ACCESS entropy ISSN 1099-4300 www.mdpi.com/journal/entropy Bivariate Rainfall and Runoff Analysis Using Entropy and Copula Theories Lan Zhang
Financial Econometrics and Volatility Models Copulas
 Financial Econometrics and Volatility Models Copulas Eric Zivot Updated: May 10, 2010 Reading MFTS, chapter 19 FMUND, chapters 6 and 7 Introduction Capturing co-movement between financial asset returns
A simple graphical method to explore tail-dependence in stock-return pairs
 A simple graphical method to explore tail-dependence in stock-return pairs Klaus Abberger, University of Konstanz, Germany Abstract: For a bivariate data set the dependence structure can not only be measured
Simulation of Tail Dependence in Cot-copula
 Int Statistical Inst: Proc 58th World Statistical Congress, 0, Dublin (Session CPS08) p477 Simulation of Tail Dependence in Cot-copula Pirmoradian, Azam Institute of Mathematical Sciences, Faculty of Science,
Probability Distributions and Estimation of Ali-Mikhail-Haq Copula
 Applied Mathematical Sciences, Vol. 4, 2010, no. 14, 657-666 Probability Distributions and Estimation of Ali-Mikhail-Haq Copula Pranesh Kumar Mathematics Department University of Northern British Columbia
THE MODELLING OF HYDROLOGICAL JOINT EVENTS ON THE MORAVA RIVER USING AGGREGATION OPERATORS
 2009/3 PAGES 9 15 RECEIVED 10. 12. 2007 ACCEPTED 1. 6. 2009 R. MATÚŠ THE MODELLING OF HYDROLOGICAL JOINT EVENTS ON THE MORAVA RIVER USING AGGREGATION OPERATORS ABSTRACT Rastislav Matúš Department of Water
A Goodness-of-fit Test for Copulas
 A Goodness-of-fit Test for Copulas Artem Prokhorov August 2008 Abstract A new goodness-of-fit test for copulas is proposed. It is based on restrictions on certain elements of the information matrix and
Imputation Algorithm Using Copulas
 Metodološki zvezki, Vol. 3, No. 1, 2006, 109-120 Imputation Algorithm Using Copulas Ene Käärik 1 Abstract In this paper the author demonstrates how the copulas approach can be used to find algorithms for
Tail Dependence of Multivariate Pareto Distributions
 !#"%$ & ' ") * +!-,#. /10 243537698:6 ;=@?A BCDBFEHGIBJEHKLB MONQP RS?UTV=XW>YZ=eda gihjlknmcoqprj stmfovuxw yy z {} ~ ƒ }ˆŠ ~Œ~Ž f ˆ ` š œžÿ~ ~Ÿ œ } ƒ œ ˆŠ~ œ
A copula goodness-of-t approach. conditional probability integral transform. Daniel Berg 1 Henrik Bakken 2
 based on the conditional probability integral transform Daniel Berg 1 Henrik Bakken 2 1 Norwegian Computing Center (NR) & University of Oslo (UiO) 2 Norwegian University of Science and Technology (NTNU)
Overview of Extreme Value Theory. Dr. Sawsan Hilal space
 Overview of Extreme Value Theory Dr. Sawsan Hilal space Maths Department - University of Bahrain space November 2010 Outline Part-1: Univariate Extremes Motivation Threshold Exceedances Part-2: Bivariate
Accounting for extreme-value dependence in multivariate data
 Accounting for extreme-value dependence in multivariate data 38th ASTIN Colloquium Manchester, July 15, 2008 Outline 1. Dependence modeling through copulas 2. Rank-based inference 3. Extreme-value dependence
1 Introduction. Amir T. Payandeh Najafabadi 1, Mohammad R. Farid-Rohani 1, Marjan Qazvini 2
 JIRSS (213) Vol. 12, No. 2, pp 321-334 A GLM-Based Method to Estimate a Copula s Parameter(s) Amir T. Payandeh Najafabadi 1, Mohammad R. Farid-Rohani 1, Marjan Qazvini 2 1 Mathematical Sciences Department,
Fitting Archimedean copulas to bivariate geodetic data
 Fitting Archimedean copulas to bivariate geodetic data Tomáš Bacigál 1 and Magda Komorníková 2 1 Faculty of Civil Engineering, STU Bratislava bacigal@math.sk 2 Faculty of Civil Engineering, STU Bratislava
Trivariate copulas for characterisation of droughts
 ANZIAM J. 49 (EMAC2007) pp.c306 C323, 2008 C306 Trivariate copulas for characterisation of droughts G. Wong 1 M. F. Lambert 2 A. V. Metcalfe 3 (Received 3 August 2007; revised 4 January 2008) Abstract
Reducing Model Risk With Goodness-of-fit Victory Idowu London School of Economics
 Reducing Model Risk With Goodness-of-fit Victory Idowu London School of Economics Agenda I. An overview of Copula Theory II. Copulas and Model Risk III. Goodness-of-fit methods for copulas IV. Presentation
Estimating the tail-dependence coefficient: Properties and pitfalls
 Estimating the tail-dependence coefficient: Properties and pitfalls Gabriel Frahm Markus Junker Rafael Schmidt May 26, 2006 Abstract The concept of tail dependence describes the amount of dependence in
ESTIMATING BIVARIATE TAIL
 Elena DI BERNARDINO b joint work with Clémentine PRIEUR a and Véronique MAUME-DESCHAMPS b a LJK, Université Joseph Fourier, Grenoble 1 b Laboratoire SAF, ISFA, Université Lyon 1 Framework Goal: estimating
IMPROVING THE SMALL-SAMPLE EFFICIENCY OF A ROBUST CORRELATION MATRIX: A NOTE
 IMPROVING THE SMALL-SAMPLE EFFICIENCY OF A ROBUST CORRELATION MATRIX: A NOTE Eric Blankmeyer Department of Finance and Economics McCoy College of Business Administration Texas State University San Marcos
Construction of asymmetric multivariate copulas
 Construction of asymmetric multivariate copulas Eckhard Liebscher University of Applied Sciences Merseburg Department of Computer Sciences and Communication Systems Geusaer Straße 0627 Merseburg Germany
Behaviour of multivariate tail dependence coefficients
 ACTA ET COMMENTATIONES UNIVERSITATIS TARTUENSIS DE MATHEMATICA Volume 22, Number 2, December 2018 Available online at http://acutm.math.ut.ee Behaviour of multivariate tail dependence coefficients Gaida
MULTIDIMENSIONAL POVERTY MEASUREMENT: DEPENDENCE BETWEEN WELL-BEING DIMENSIONS USING COPULA FUNCTION
 Rivista Italiana di Economia Demografia e Statistica Volume LXXII n. 3 Luglio-Settembre 2018 MULTIDIMENSIONAL POVERTY MEASUREMENT: DEPENDENCE BETWEEN WELL-BEING DIMENSIONS USING COPULA FUNCTION Kateryna
Copulas and dependence measurement
 Copulas and dependence measurement Thorsten Schmidt. Chemnitz University of Technology, Mathematical Institute, Reichenhainer Str. 41, Chemnitz. thorsten.schmidt@mathematik.tu-chemnitz.de Keywords: copulas,
Dependence Patterns across Financial Markets: a Mixed Copula Approach
 Dependence Patterns across Financial Markets: a Mixed Copula Approach Ling Hu This Draft: October 23 Abstract Using the concept of a copula, this paper shows how to estimate association across financial
How to select a good vine
 Universitetet i Oslo ingrihaf@math.uio.no International FocuStat Workshop on Focused Information Criteria and Related Themes, May 9-11, 2016 Copulae Regular vines Model selection and reduction Limitations
Three-Stage Semi-parametric Estimation of T-Copulas: Asymptotics, Finite-Samples Properties and Computational Aspects
 Three-Stage Semi-parametric Estimation of T-Copulas: Asymptotics, Finite-Samples Properties and Computational Aspects Dean Fantazzini Moscow School of Economics, Moscow State University, Moscow - Russia
GOODNESS-OF-FIT TESTS FOR ARCHIMEDEAN COPULA MODELS
 Statistica Sinica 20 (2010), 441-453 GOODNESS-OF-FIT TESTS FOR ARCHIMEDEAN COPULA MODELS Antai Wang Georgetown University Medical Center Abstract: In this paper, we propose two tests for parametric models
Dependence Calibration in Conditional Copulas: A Nonparametric Approach
 Biometrics DOI: 10.1111/j.1541-0420.2010.01472. Dependence Calibration in Conditional Copulas: A Nonparametric Approach Elif F. Acar, Radu V. Craiu, and Fang Yao Department of Statistics, University of
Correlation: Copulas and Conditioning
 Correlation: Copulas and Conditioning This note reviews two methods of simulating correlated variates: copula methods and conditional distributions, and the relationships between them. Particular emphasis
Marginal Specifications and a Gaussian Copula Estimation
 Marginal Specifications and a Gaussian Copula Estimation Kazim Azam Abstract Multivariate analysis involving random variables of different type like count, continuous or mixture of both is frequently required
Copulas. Mathematisches Seminar (Prof. Dr. D. Filipovic) Di Uhr in E
 Di Uhr in E") Copulas Mathematisches Seminar (Prof. Dr. D. Filipovic) Di. 14-16 Uhr in E41 A Short Introduction 1 0.8 0.6 0.4 0.2 0 0 0.2 0.4 0.6 0.8 1 The above picture shows a scatterplot (500 points) from a pair
Copulas Mathematisches Seminar (Prof. Dr. D. Filipovic) Di. 14-16 Uhr in E41 A Short Introduction 1 0.8 0.6 0.4 0.2 0 0 0.2 0.4 0.6 0.8 1 The above picture shows a scatterplot (500 points) from a pair
Dependence modelling of the joint extremes in a portfolio using Archimedean copulas : application to MSCI indices
 Dependence modelling of the joint extremes in a portfolio using Archimedean copulas : application to MSI indices Dominique Guegan, Sophie A. Ladoucette To cite this version: Dominique Guegan, Sophie A.
Estimation of multivariate critical layers: Applications to rainfall data
 Elena Di Bernardino, ICRA 6 / RISK 2015 () Estimation of Multivariate critical layers Barcelona, May 26-29, 2015 Estimation of multivariate critical layers: Applications to rainfall data Elena Di Bernardino,
Asymmetric Dependence, Tail Dependence, and the. Time Interval over which the Variables Are Measured
 Asymmetric Dependence, Tail Dependence, and the Time Interval over which the Variables Are Measured Byoung Uk Kang and Gunky Kim Preliminary version: August 30, 2013 Comments Welcome! Kang, byoung.kang@polyu.edu.hk,
Modelling Dependence with Copulas and Applications to Risk Management. Filip Lindskog, RiskLab, ETH Zürich
 Modelling Dependence with Copulas and Applications to Risk Management Filip Lindskog, RiskLab, ETH Zürich 02-07-2000 Home page: http://www.math.ethz.ch/ lindskog E-mail: lindskog@math.ethz.ch RiskLab:
Multivariate extremes. Anne-Laure Fougeres. Laboratoire de Statistique et Probabilites. INSA de Toulouse - Universite Paul Sabatier 1
 Multivariate extremes Anne-Laure Fougeres Laboratoire de Statistique et Probabilites INSA de Toulouse - Universite Paul Sabatier 1 1. Introduction. A wide variety of situations concerned with extreme events
Non parametric estimation of Archimedean copulas and tail dependence. Paris, february 19, 2015.
 Non parametric estimation of Archimedean copulas and tail dependence Elena Di Bernardino a and Didier Rullière b Paris, february 19, 2015. a CNAM, Paris, Département IMATH, b ISFA, Université Lyon 1, Laboratoire
Lecture Quantitative Finance Spring Term 2015
 on bivariate Lecture Quantitative Finance Spring Term 2015 Prof. Dr. Erich Walter Farkas Lecture 07: April 2, 2015 1 / 54 Outline on bivariate 1 2 bivariate 3 Distribution 4 5 6 7 8 Comments and conclusions
On tail dependence coecients of transformed multivariate Archimedean copulas
 Tails and for Archim Copula () February 2015, University of Lille 3 On tail dependence coecients of transformed multivariate Archimedean copulas Elena Di Bernardino, CNAM, Paris, Département IMATH Séminaire
A Brief Introduction to Copulas
 A Brief Introduction to Copulas Speaker: Hua, Lei February 24, 2009 Department of Statistics University of British Columbia Outline Introduction Definition Properties Archimedean Copulas Constructing Copulas
Bivariate extension of the Pickands Balkema de Haan theorem
 Ann. I. H. Poincaré PR 40 (004) 33 4 www.elsevier.com/locate/anihpb Bivariate extension of the Pickands Balkema de Haan theorem Mario V. Wüthrich Winterthur Insurance, Römerstrasse 7, P.O. Box 357, CH-840
MAXIMUM ENTROPIES COPULAS
 MAXIMUM ENTROPIES COPULAS Doriano-Boris Pougaza & Ali Mohammad-Djafari Groupe Problèmes Inverses Laboratoire des Signaux et Systèmes (UMR 8506 CNRS - SUPELEC - UNIV PARIS SUD) Supélec, Plateau de Moulon,
Songklanakarin Journal of Science and Technology SJST R1 Sukparungsee
 Songklanakarin Journal of Science and Technology SJST-0-0.R Sukparungsee Bivariate copulas on the exponentially weighted moving average control chart Journal: Songklanakarin Journal of Science and Technology
Chapter 1. Bayesian Inference for D-vines: Estimation and Model Selection
 Chapter 1 Bayesian Inference for D-vines: Estimation and Model Selection Claudia Czado and Aleksey Min Technische Universität München, Zentrum Mathematik, Boltzmannstr. 3, 85747 Garching, Germany cczado@ma.tum.de
Using copulas to model time dependence in stochastic frontier models
 Using copulas to model time dependence in stochastic frontier models Christine Amsler Michigan State University Artem Prokhorov Concordia University November 2008 Peter Schmidt Michigan State University
Frailty Models and Copulas: Similarities and Differences
 Frailty Models and Copulas: Similarities and Differences KLARA GOETHALS, PAUL JANSSEN & LUC DUCHATEAU Department of Physiology and Biometrics, Ghent University, Belgium; Center for Statistics, Hasselt
Semi-parametric predictive inference for bivariate data using copulas
 Semi-parametric predictive inference for bivariate data using copulas Tahani Coolen-Maturi a, Frank P.A. Coolen b,, Noryanti Muhammad b a Durham University Business School, Durham University, Durham, DH1
On the Systemic Nature of Weather Risk
 Martin Odening 1 Ostap Okhrin 2 Wei Xu 1 Department of Agricultural Economics 1 Ladislaus von Bortkiewicz Chair of Statistics C.A.S.E. Center for Applied Statistics and Economics 2 Humboldt Universität
X
 Correlation: Pitfalls and Alternatives Paul Embrechts, Alexander McNeil & Daniel Straumann Departement Mathematik, ETH Zentrum, CH-8092 Zürich Tel: +41 1 632 61 62, Fax: +41 1 632 15 23 embrechts/mcneil/strauman@math.ethz.ch
A nonparametric Bayesian approach to copula estimation
 A nonparametric Bayesian approach to copula estimation Abstract We propose a novel Dirichlet-based Pólya tree (D-P tree) prior on the copula and a nonparametric Bayesian inference procedure based on the
Construction and estimation of high dimensional copulas
 Construction and estimation of high dimensional copulas Gildas Mazo PhD work supervised by S. Girard and F. Forbes Mistis, Inria and laboratoire Jean Kuntzmann, Grenoble, France Séminaire Statistiques,
When is a copula constant? A test for changing relationships
 When is a copula constant? A test for changing relationships Fabio Busetti and Andrew Harvey Bank of Italy and University of Cambridge November 2007 usetti and Harvey (Bank of Italy and University of Cambridge)
Multivariate Non-Normally Distributed Random Variables
 Multivariate Non-Normally Distributed Random Variables An Introduction to the Copula Approach Workgroup seminar on climate dynamics Meteorological Institute at the University of Bonn 18 January 2008, Bonn
A Conditional Approach to Modeling Multivariate Extremes
 A Approach to ing Multivariate Extremes By Heffernan & Tawn Department of Statistics Purdue University s April 30, 2014 Outline s s Multivariate Extremes s A central aim of multivariate extremes is trying
Efficient estimation of a semiparametric dynamic copula model
 Efficient estimation of a semiparametric dynamic copula model Christian Hafner Olga Reznikova Institute of Statistics Université catholique de Louvain Louvain-la-Neuve, Blgium 30 January 2009 Young Researchers
Copulas. MOU Lili. December, 2014
 Copulas MOU Lili December, 2014 Outline Preliminary Introduction Formal Definition Copula Functions Estimating the Parameters Example Conclusion and Discussion Preliminary MOU Lili SEKE Team 3/30 Probability
Detection of outliers in multivariate data:
 1 Detection of outliers in multivariate data: a method based on clustering and robust estimators Carla M. Santos-Pereira 1 and Ana M. Pires 2 1 Universidade Portucalense Infante D. Henrique, Oporto, Portugal
Convolution Based Unit Root Processes: a Simulation Approach
 International Journal of Statistics and Probability; Vol., No. 6; November 26 ISSN 927-732 E-ISSN 927-74 Published by Canadian Center of Science and Education Convolution Based Unit Root Processes: a Simulation
Smooth Tests of Copula Specifications
 Smooth Tests of Copula Specifications Juan Lin Ximing Wu December 24, 2012 Abstract We present a family of smooth tests for the goodness of fit of semiparametric multivariate copula models. The proposed
ISSN X Bivariate copulas parameters estimation using the trimmed L-moments method
 Afrika Statistika Vol. 1(1), 017, pages 1185 1197. DOI: http://dx.doi.org/10.1699/as/017.1185.99 Afrika Statistika ISSN 316-090X Bivariate copulas parameters estimation using the trimmed L-moments method
A note about the conjecture about Spearman s rho and Kendall s tau
 A note about the conjecture about Spearman s rho and Kendall s tau V. Durrleman Operations Research and Financial Engineering, Princeton University, USA A. Nikeghbali University Paris VI, France T. Roncalli
ROBUST ESTIMATION OF A CORRELATION COEFFICIENT: AN ATTEMPT OF SURVEY
 ROBUST ESTIMATION OF A CORRELATION COEFFICIENT: AN ATTEMPT OF SURVEY G.L. Shevlyakov, P.O. Smirnov St. Petersburg State Polytechnic University St.Petersburg, RUSSIA E-mail: Georgy.Shevlyakov@gmail.com
Multivariate survival modelling: a unified approach with copulas
 Multivariate survival modelling: a unified approach with copulas P. Georges, A-G. Lamy, E. Nicolas, G. Quibel & T. Roncalli Groupe de Recherche Opérationnelle Crédit Lyonnais France May 28, 2001 Abstract
Quasi-copulas and signed measures
 Quasi-copulas and signed measures Roger B. Nelsen Department of Mathematical Sciences, Lewis & Clark College, Portland (USA) José Juan Quesada-Molina Department of Applied Mathematics, University of Granada
First steps of multivariate data analysis
 First steps of multivariate data analysis November 28, 2016 Let s Have Some Coffee We reproduce the coffee example from Carmona, page 60 ff. This vignette is the first excursion away from univariate data.
Dependence. MFM Practitioner Module: Risk & Asset Allocation. John Dodson. September 11, Dependence. John Dodson. Outline.
 MFM Practitioner Module: Risk & Asset Allocation September 11, 2013 Before we define dependence, it is useful to define Random variables X and Y are independent iff For all x, y. In particular, F (X,Y
A simple tranformation of copulas
 A simple tranformation of copulas V. Durrleman, A. Nikeghbali & T. Roncalli Groupe e Recherche Opérationnelle Créit Lyonnais France July 31, 2000 Abstract We stuy how copulas properties are moifie after
I N S T I T U T D E S T A T I S T I Q U E B I O S T A T I S T I Q U E E T S C I E N C E S A C T U A R I E L L E S (I S B A)
") I N S T I T U T D E S T A T I S T I Q U E B I O S T A T I S T I Q U E E T S C I E N C E S A C T U A R I E L L E S (I S B A) UNIVERSITÉ CATHOLIQUE DE LOUVAIN D I S C U S S I O N P A P E R 2011/12 LARGE-SAMPLE
I N S T I T U T D E S T A T I S T I Q U E B I O S T A T I S T I Q U E E T S C I E N C E S A C T U A R I E L L E S (I S B A) UNIVERSITÉ CATHOLIQUE DE LOUVAIN D I S C U S S I O N P A P E R 2011/12 LARGE-SAMPLE
A PRACTICAL WAY FOR ESTIMATING TAIL DEPENDENCE FUNCTIONS
 Statistica Sinica 20 2010, 365-378 A PRACTICAL WAY FOR ESTIMATING TAIL DEPENDENCE FUNCTIONS Liang Peng Georgia Institute of Technology Abstract: Estimating tail dependence functions is important for applications
Explicit Bounds for the Distribution Function of the Sum of Dependent Normally Distributed Random Variables
 Explicit Bounds for the Distribution Function of the Sum of Dependent Normally Distributed Random Variables Walter Schneider July 26, 20 Abstract In this paper an analytic expression is given for the bounds
Identification of Multivariate Outliers: A Performance Study
 AUSTRIAN JOURNAL OF STATISTICS Volume 34 (2005), Number 2, 127 138 Identification of Multivariate Outliers: A Performance Study Peter Filzmoser Vienna University of Technology, Austria Abstract: Three
A Measure of Monotonicity of Two Random Variables
 Journal of Mathematics and Statistics 8 (): -8, 0 ISSN 549-3644 0 Science Publications A Measure of Monotonicity of Two Random Variables Farida Kachapova and Ilias Kachapov School of Computing and Mathematical
Technische Universität München Fakultät für Mathematik. Properties of extreme-value copulas
 Technische Universität München Fakultät für Mathematik Properties of extreme-value copulas Diplomarbeit von Patrick Eschenburg Themenstellerin: Betreuer: Prof. Claudia Czado, Ph.D. Eike Christian Brechmann
Copula Methods for Forecasting Multivariate Time Series
 Copula Methods for Forecasting Multivariate Time Series Andrew J. Patton Duke University 29 May 2012 Forthcoming in the Handbook of Economic Forecasting, Volume 2. Abstract Copula-based models provide
Nonparametric Estimation of the Dependence Function for a Multivariate Extreme Value Distribution
 Nonparametric Estimation of the Dependence Function for a Multivariate Extreme Value Distribution p. /2 Nonparametric Estimation of the Dependence Function for a Multivariate Extreme Value Distribution
A New Family of Bivariate Copulas Generated by Univariate Distributions 1
 Journal of Data Science 1(212), 1-17 A New Family of Bivariate Copulas Generated by Univariate Distributions 1 Xiaohu Li and Rui Fang Xiamen University Abstract: A new family of copulas generated by a
Extreme Value Analysis and Spatial Extremes
 Extreme Value Analysis and Department of Statistics Purdue University 11/07/2013 Outline Motivation 1 Motivation 2 Extreme Value Theorem and 3 Bayesian Hierarchical Models Copula Models Max-stable Models
Markov Switching Regular Vine Copulas
 Int. Statistical Inst.: Proc. 58th World Statistical Congress, 2011, Dublin (Session CPS057) p.5304 Markov Switching Regular Vine Copulas Stöber, Jakob and Czado, Claudia Lehrstuhl für Mathematische Statistik,
Multivariate Skew Distributions Based on the GT-Copula *
 Multivariate Skew Distributions Based on the GT-Copula * Beatriz Vaz de Melo Mendes ** Olcay Arslan *** Abstract In this paper we obtain the expression for the copula pertaining to the multivariate generalized
Multivariate VaRs for Operational Risk Capital Computation: a Vine Structure Approach
 Multivariate VaRs for Operational Risk Capital Computation: a Vine Structure Approach Dominique Guegan, Bertrand Hassani To cite this version: Dominique Guegan, Bertrand Hassani. Multivariate VaRs for
Tail negative dependence and its applications for aggregate loss modeling
 Tail negative dependence and its applications for aggregate loss modeling Lei Hua Division of Statistics Oct 20, 2014, ISU L. Hua (NIU) 1/35 1 Motivation 2 Tail order Elliptical copula Extreme value copula
A ROBUST METHOD OF ESTIMATING COVARIANCE MATRIX IN MULTIVARIATE DATA ANALYSIS G.M. OYEYEMI *, R.A. IPINYOMI **
 ANALELE ŞTIINłIFICE ALE UNIVERSITĂłII ALEXANDRU IOAN CUZA DIN IAŞI Tomul LVI ŞtiinŃe Economice 9 A ROBUST METHOD OF ESTIMATING COVARIANCE MATRIX IN MULTIVARIATE DATA ANALYSIS G.M. OYEYEMI, R.A. IPINYOMI
ON THE CALCULATION OF A ROBUST S-ESTIMATOR OF A COVARIANCE MATRIX
 STATISTICS IN MEDICINE Statist. Med. 17, 2685 2695 (1998) ON THE CALCULATION OF A ROBUST S-ESTIMATOR OF A COVARIANCE MATRIX N. A. CAMPBELL *, H. P. LOPUHAA AND P. J. ROUSSEEUW CSIRO Mathematical and Information
Re-weighted Robust Control Charts for Individual Observations
 Universiti Tunku Abdul Rahman, Kuala Lumpur, Malaysia 426 Re-weighted Robust Control Charts for Individual Observations Mandana Mohammadi 1, Habshah Midi 1,2 and Jayanthi Arasan 1,2 1 Laboratory of Applied
CHAPTER 5. Outlier Detection in Multivariate Data
 CHAPTER 5 Outlier Detection in Multivariate Data 5.1 Introduction Multivariate outlier detection is the important task of statistical analysis of multivariate data. Many methods have been proposed for
Tail Approximation of Value-at-Risk under Multivariate Regular Variation
 Tail Approximation of Value-at-Risk under Multivariate Regular Variation Yannan Sun Haijun Li July 00 Abstract This paper presents a general tail approximation method for evaluating the Valueat-Risk of
The Goodness-of-fit Test for Gumbel Distribution: A Comparative Study
 MATEMATIKA, 2012, Volume 28, Number 1, 35 48 c Department of Mathematics, UTM. The Goodness-of-fit Test for Gumbel Distribution: A Comparative Study 1 Nahdiya Zainal Abidin, 2 Mohd Bakri Adam and 3 Habshah
Calibration Estimation of Semiparametric Copula Models with Data Missing at Random
 Calibration Estimation of Semiparametric Copula Models with Data Missing at Random Shigeyuki Hamori 1 Kaiji Motegi 1 Zheng Zhang 2 1 Kobe University 2 Renmin University of China Econometrics Workshop UNC
Lifetime Dependence Modelling using a Generalized Multivariate Pareto Distribution
 Lifetime Dependence Modelling using a Generalized Multivariate Pareto Distribution Daniel Alai Zinoviy Landsman Centre of Excellence in Population Ageing Research (CEPAR) School of Mathematics, Statistics
8 Copulas. 8.1 Introduction
 8 Copulas 8.1 Introduction Copulas are a popular method for modeling multivariate distributions. A copula models the dependence and only the dependence between the variates in a multivariate distribution
Minimum distance estimation for the logistic regression model
 Biometrika (2005), 92, 3, pp. 724 731 2005 Biometrika Trust Printed in Great Britain Minimum distance estimation for the logistic regression model BY HOWARD D. BONDELL Department of Statistics, Rutgers
Estimation of Operational Risk Capital Charge under Parameter Uncertainty
 Estimation of Operational Risk Capital Charge under Parameter Uncertainty Pavel V. Shevchenko Principal Research Scientist, CSIRO Mathematical and Information Sciences, Sydney, Locked Bag 17, North Ryde,
Computational Connections Between Robust Multivariate Analysis and Clustering
 1 Computational Connections Between Robust Multivariate Analysis and Clustering David M. Rocke 1 and David L. Woodruff 2 1 Department of Applied Science, University of California at Davis, Davis, CA 95616,
Estimating Bivariate Tail: a copula based approach
 Estimating Bivariate Tail: a copula based approach Elena Di Bernardino, Université Lyon 1 - ISFA, Institut de Science Financiere et d'assurances - AST&Risk (ANR Project) Joint work with Véronique Maume-Deschamps
Modified Kolmogorov-Smirnov Test of Goodness of Fit. Catalonia-BarcelonaTECH, Spain
 152/304 CoDaWork 2017 Abbadia San Salvatore (IT) Modified Kolmogorov-Smirnov Test of Goodness of Fit G.S. Monti 1, G. Mateu-Figueras 2, M. I. Ortego 3, V. Pawlowsky-Glahn 2 and J. J. Egozcue 3 1 Department
Highly Robust Variogram Estimation 1. Marc G. Genton 2
 Mathematical Geology, Vol. 30, No. 2, 1998 Highly Robust Variogram Estimation 1 Marc G. Genton 2 The classical variogram estimator proposed by Matheron is not robust against outliers in the data, nor is
Dependence and Order in Families of Archimedean Copulas
 journal of multivariate analysis 60, 111122 (1997) article no. MV961646 Dependence and Order in Families of Archimedean Copulas Roger B. Nelsen* Lewis 6 Clark College The copula for a bivariate distribution