PoS(NIC XI)301. Andreas Korn. IFA, Uppsala University. Heidelberg,
|
|
|
- Kristina Malone
- 5 years ago
- Views:
Transcription


1 Andreas Korn IFA, Uppsala University Heidelberg,
 Diploma in Physics (1998, U of Heidelberg) PhD in Astrophysics (2002, U of München) Postdoc at MPE in Garching since")
2 Who is this guy? Born in 1972, raised in Marburg, Germany MSc in Astrophysics (1996, U of London) Diploma in Physics (1998, U of Heidelberg) PhD in Astrophysics (2002, U of München) Postdoc at MPE in Garching since 2003 research fellow in Uppsala (German and Swedish funding) since 2008 researcher/lecturer at Uppsala University Research interests: stars from B to K, esp. at low(est) metallicity, chemical evolution of the Galaxy, quantitative spectroscopy, atomic diffusion, Gaia (coordinator for the computation of synthetic observables)
3 What will be covered I. Theoretical background II. (most of the basics covered by Frank Grupp) how lines depend on T eff, log g, log (X) etc. Methods of stellar-parameter and chemicalabundance determination fundamental stellar parameters photometry (in a nutshell) spectroscopy (a practical selection) abundances (some examples) III. Exercise (afternoon)
4 What are stellar parameters? There are different ways of looking at what defines a stars: stellar-structure view M, L, X, Y, Z, R, v rot, t,... stellar-atmosphere view F,T eff, log g, [X i /H], v rot sin i,... log (G M / R 2 ) While the prior is (often) more fundamental, the latter is more directly related to observations (photospheres!) and generally speaking more applicable. In this lecture, I will follow the latter view.
5 Linking input to output Stellar ages Cosmic evolution Output Nucleosynthesis Input Stellar evolution Observations Chemical evolution model

6 Precision vs. accuracy P A NB: Some projects may require high precision and accuracy, while for others it will suffice to reach some level of precision. It is a good idea to be aware of the needs of your project.
 an O star M ¼ 50 M R ¼ 20 R L ¼ 10 6 L (/ M 3 ) photosphere: R ¼ 0.")
7 Stellar parameters: typical figures The Sun M = g = M R = cm = R L = erg/s = L photosphere: R ¼ 200 km < 10 3 R n ¼ cm 3 T ¼ 6000 K colourmagnitude diagram (CMD) an O star M ¼ 50 M R ¼ 20 R L ¼ 10 6 L (/ M 3 ) photosphere: R ¼ 0.1 R n ¼ cm 3 T ¼ K wikipedia: stellar classification
8 Abundance nomenclature Mass fractions: let X, Y, Z denote the mass-weighted abundances of H, He and all other elements ( metals ), respectively, normalized to unity (X + Y + Z =1). example: X = , Y = , Z = for the Sun according to Asplund et al. (2009) The 12 scale: log (X) = log (n X / n H ) + 12 (log (H) 12) example: log (O) ¼ 8.7 dex, i.e., oxygen, the most abundant metal, is 2000 times less abundant than H in the Sun (the exact value is currently hotly debated!) Square-bracket scale: [X/H] = log (n X / n H ) log (n X / n H ) example: [Fe/H] HE = 5.3 dex, i.e., this star has an iron abundance a factor of below the Sun (Christlieb et al. 2002)
9 Opacities Continuous opacity Caused by bf or ff transitions In the optical and near-ir of cool stars, H (I = 0.75 ev) dominates: (H bf) = const. T 5/2 P e exp(0.75/kt) NB: There is only 1 H per 10 8 H atoms in the Solar photosphere! log l Böhm-Vitense, Fig. 7.8 a cool star H Line opacity (all the lines you see!) Caused by bb transitions Need to know log gf, damping and assume an abundance l [Å]
10 Model atmosphere output A 1D model atmosphere is a tabulation of various quantities as a function of (optical) depth: T (temperature) P g (gas pressure) P e (electron pressure) F (esp. surface flux) etc. as computed under certain input assumptions: T eff (effective temperature) log g (surface gravity) log (X i ) (chemical composition) hydrostatic equilibrium LTE (local thermodynamic equilibrium) MLT (mixing-length theory) and a statistical representation of opacities (either via opacity distribution functions, ODF, or opacity sampling, OS). T(T eff ) T(log g) T(log ) T(log ) log P e (T eff ) log P e (log g) log P e (log ) log P e (log ) 6 log
 W l / d ln S / d B Gray, Fig. 6.2 T S ( 0 ) Fig. 13.")
11 How spectral lines originate The formation of absorption lines can be qualitatively understood by studying how S changes with depth. I (0) W l / d ln S / d B Gray, Fig. 6.2 T S ( 0 ) Fig. 13.1
12 Spectral lines as a function of abundance Starting from low log (low log gf), the line strength is directly proportional to log gf : W l / gf n X When the line centre becomes optically thick, the line begins to saturate. The dependence on abundance lessens. Only when damping wings develop, the line can grow again in a more rapid fashion: W l / sqrt( gf n X ) Gray Fig Weak lines are thus best suited to derive the elemental composition of a star, given that they are well-observed (blending!) log gf
13 Spectral lines as a function of T eff The strength of a weak line is proportional to the ratio of line to continuous absorption coefficients, l /. Evaluation of this ratio can tell us about the T eff sensitivity of spectral lines: R = l / = const. T 5/2 / P e exp ( )/kT for a neutral line of an element that is mostly ionized. Fractional change with T: 1/R dr/dt = ( I)/kT 2 ) depending on neutral lines decrease with T eff by between 10 and 30% per 100 K (typically 0.07 dex per 100 K). Lines of different can be used to constrain T eff (excitation equilibrium condition). For ionized lines of mainly ionized elements, one finds low sensitivities to T eff, except those with a large. These become stronger with T eff by up to 20% per 100 K.
14 Spectral lines as a function of log g The T eff sensitivity of spectral lines may be surpassed by sensitivities with respect to other stellar parameters. Sensitivity to log g in cool stars? Case 1: (weak) neutral line of an element that is mainly ionized W l is proportional to the ratio of line to continuous absorption coefficients, l /. n r+1 / n r = F(T) / P e, n r ¼ const. P e ) l / f(p e ) neutral lines do not depend on log g Case 2: ionized line of an element that is mainly ionized (universal) log g sensitivity via the continuous opacity of H NB: for strong lines, a damping-related log g sensitivity comes into play.
15 Fundamental stellar parameters T eff : via F Bol and q (see IRFM below). To get q, one uses interferometry and model-atmosphere theory (limb darkening!). log g: Newton s law, needs M and R. So usually one needs p (parallax) and q. Gaia is the key p mission (to be launched in 2012). M needs to be inferred from stellar evolution. Exception: eclipsing binaries. [m/h]: via meteorites (only for the Sun), which lack important (volatile) elements like CNO and noble gases. In principle, asteroseismology can provide compositions (both at the surface and in the interior).
16 (c) F. Bresolin Photometry: pros vs. cons Photometry is an efficient way of determining stellar parameters, can probe very deep, freely available (surveys!), comparatively cheap to obtain. However, photometry is limited in which parameters can be derived, subject to extra parameters (reddening!) subject to parameters that cannot be determined well (, [ /Fe]).


17 Bessell (2005) Photometric standard systems Warning: there is often more than one filter set for one system!

18 Photometry: T eff dependence T eff variations dominate the flux variations of cool stars. In the BB approximation to stellar fluxes, it suffices to measure the flux at two points to uniquely determine T. In reality, [m/fe] and reddening complicate the derivation of photometric stellar parameters. 8 log F l (c) Ulrike Heiter T eff
19 Photometry: metallicities After T eff, the global metallicity has the largest influence on stellar fluxes (with the potentially disastrous exception of reddening!). But the precision with which metallicities can be determined is limited (of order 0.3 dex). In addition, it is difficult to determine metallicities for stars with [Fe/H] < 2, as classical indicators like (U B) lose sensitivity. 2 dex variation in N abundance! On the other hand, there are narrow-band indices which allow one to measure abundance variations (e.g. via molecular bands).
.")
, the difficulties with ground-based observations in the near-uv and a proper treatment of the overlapping Balmer lines.")
20 Photometry: gravity dependence The only feature that has a sufficiently large gravity sensitivity to be exploited by photometry is the Balmer jump at 3647 Å (in hot stars it can be used as a sensitive T eff indicator). Colours like (U B) or (u y) measure the Balmer discontinuity, but the usefulness as a precise gravity indicator is hampered by the high line density in this spectral region (missing opacity problem), the difficulties with ground-based observations in the near-uv and a proper treatment of the overlapping Balmer lines. log F l Balmer jump/ discontinuity l [Å] The c 1 index ( (u b) (b y)) works well for metal-poor giants (Önehag et al. 2008). Gray, Fig. 10.8
 IRFM: a semi-fundamental T eff scale Basic idea of the infrared-flux method: (surface) = F lir (model) is said to be")

21 Alonso et al. (1999) IRFM: a semi-fundamental T eff scale Basic idea of the infrared-flux method: (surface) = F lir (model) is said to be only weakly model dependent (but cf. Grupp 2004). Once calibrated on stars with known diameters, any colour index can be calibrated on the IRFM. Direct sample: T eff = % Comparing different IRFM calibrations (Blackwell et al., Ramírez & Meléndez, Casagrande et al.), the zero point proves to be uncertain by 100 K, in particular for metal-poor stars.
22 Spectroscopic T eff indicators: H lines Above 5000 K, the wings of Balmer lines are a sensitive T eff indicator, broadened by H + H collisions (mainly H ) and the linear Stark effect (H + e ). In cool stars, the log g sensitivity is low (line and continuous opacity both depend on P e ), as is the metallicity dependence. There is some dependence on the mixing-length parameter (H and higher). Main challenge (apart from the surprisingly complex broadening): recovering the intrinsic line profiles from (echelle) observations. In hot stars, Balmer lines can constrain the surface gravity.

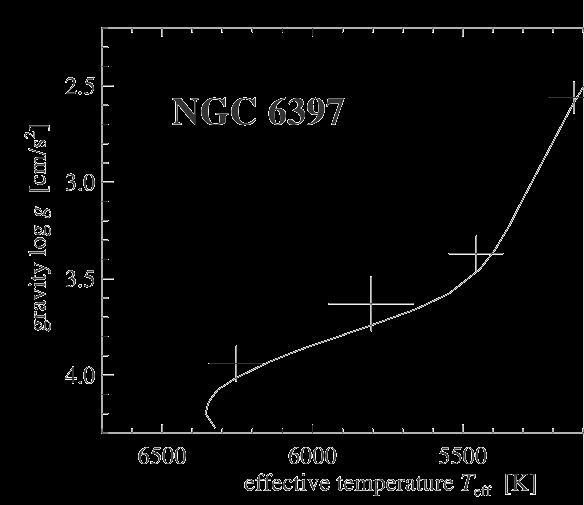
23 H as a function of T eff Steps: 1. Carefully normalize H 100 Å. 2. Fit the wings down to 0.8 in F/F c K 6540 K


24 Line-depth ratios (LDRs) Using the ratio of two lines central depths (rather than W l ) can be a remarkably sensitive temperature indicator (precision as high as 5 K!), if the lines are chosen to have different sensitivities to T. Ideally, the LDR is close to 1 and the lines should not be too far apart. Gray Fig.14.7 The main challenge lies in a proper T eff calibration across a usefully large part of the HRD.


25 Gravity sensitivity of ionized lines Recall that ionized lines of an element that is mainly ionized have a P e 1 sensitivity via the continuous opacity of H. Integrating the hydrostatic equation, we find P g / g 2/3 and together with P e / sqrt(p g ) we expect l / / g 1/3. F / F c Hydrostatic equilibrium dp/d = g / This is borne out by actual calculations. Gray, Fig l [Å]

26 Practicalities of ionization equilibria A change of 0.1 dex in log translates to a change of 0.3 dex in log g. Consequences: A line-to-line scatter of 0.1 dex means that log g is known to within 0.3 dex. Relatively small changes in log, e.g. because of a change in T eff or NLTE effects, can lead to factor-of-two changes in the surface gravity. Astrometry can help to establish the correct surface-gravity scale. Korn (2004), Carnegie Observatories Centenary (2003) Mashonkina et al. (2010), A&A submitted
27 The strong line method Damped (neutral) lines show a strong gravity sensitivity, because l / 6 / P g / g 2/3. Like with ionization equilibria, log needs to be known. This is to be obtained from weak lines of the same ionization stage, preferably originating from the same lower state (to minimize differential NLTE effects). F / F c Gray, Fig Examples: Ca I 6162 (see above), Fe I 4383, Mg I 5183, Ca I Below [Fe/H] ¼ 2, there are no optical lines strong enough to serve as a surface-gravity indicator.
28 spectroscopic distance [pc] difference [%] Spectroscopy of the Solar neighbourhood Aim: Derive precise stellar parameters and chemical abundances of FGK stars within d = 25 pc. Example: The strong-line method as a surface-gravity indicator for not too metal-poor, not-tooevolved stars coupled with T eff values from Balmer lines. Fuhrmann (1998, 2000, 2004, 2008) [X] = log (X / X ) Benchmark: Hipparcos Number of objects: 218 Number of outliers: 11 (this work Hipparcos): % (rms) Hipparcos distance [pc]
29 Stellar populations around the Sun spectroscopic discovery of the Thick Disk
. Caveats some elements are not visible, e.g.")
30 Abundances from H to U Once you have good stellar parameters, it is relatively easy to determine chemical abundances for your favourite element(s). Caveats some elements are not visible, e.g. noble gases in cool stars lines may lack or have inaccurate atomic data lines can be blended leading to overestimated abundances lines can be subject to effect you are unaware of, e.g. 3D and NLTE effects, hfs, isotopic and Zeeman splitting...
31 Quantitative spectroscopy: the Sun


32 Spectroscopy: pros vs. cons Spectroscopy is a way of determining a great number of stellar parameters, the key technique for obtaining detailed chemical abundances, (usually) reddening-free. However, hi-res spectroscopy is comparatively costly at the telescope, currently limited to 18 m in V, more difficult to master than photometry....especially when they accept photometry as a source of valuable information.
 analysed two metal-poor stars with significant enhancement of r-process elements ([r/fe] > 1.0).")
 UVES spectra using interactive and automated techniques.")
33 An r-process example Hayek et al. (2009) analysed two metal-poor stars with significant enhancement of r-process elements ([r/fe] > 1.0). Stellar parameters were determined from high-resolution (R = 70,000), high signal-to-noise-ratio (S/N ¼ 100) UVES spectra using interactive and automated techniques. Abundances for up to 18 elements beyond the iron peak were derived for HE , including that of thorium.
34 HE The abundance pattern matches a scaled-solar r-process pattern well. But thorium is slightly more abundant than expected. This leads to a severe interpretation conflict, as the star seems to be rather young or even possess a negative age! What is wrong?
![Summary The determination of stellar parameters (T eff, log g, [Fe/H], [ /Fe], plus auxiliary parameters like and X) is a crucial first step of stellar data analysis.](/docs-images/93/111241078/images/35-0.jpg "For some applications it suffices to use stellar parameters with limited precision (survey-type work), while for others high accuracy is mandatory (abundance fine analysis).")
35 Summary The determination of stellar parameters (T eff, log g, [Fe/H], [ /Fe], plus auxiliary parameters like and X) is a crucial first step of stellar data analysis. For some applications it suffices to use stellar parameters with limited precision (survey-type work), while for others high accuracy is mandatory (abundance fine analysis). When chemical abundances are at focus, spectroscopy is an indispensible technique to be mastered.
36 References Alonso A., Arribas S., Martínez-Roger C. 1999, A&A Suppl. Ser. 139, 335 Anstee S.D. & O Mara B.J. 1991, MNRAS, 253, 549; 1995, MNRAS, 276, 859 Asplund M., Grevesse N., Sauval A.J., Scott P. 2009, ARAA 47, 481 Bessell M. 2005, ARAA 43, 293 Blackwell, D.E. & Shallis, M.J. 1977, MNRAS, 180, 177 Böhm-Vitense E., Introduction to Stellar Astrophysics (vol. 2), Cambridge University Press (1989) Casagrande L. et al. 2010, A&A 512, 54 Christlieb N. et al. 2002, Nature 419, 904 Edvardsson B. et al. 1993, A&A 275, 101 Fuhrmann K. 1998, A&A 338, 161; 2004, AN 325, 3; 2008, MNRAS 384, 173 Gray D.F., The Observation and Analysis of Stellar Photospheres, 3 rd edition, Cambridge University Press (2005) (corrections at Grupp F. 2004, A&A 426, 309 Hayek W. et al. 2009, A&A 504, 511 Holweger H. 1996, Physica Scripta T65, 151 Önehag A., Gustafsson B., Eriksson K., Edvardsson B. 2008, A&A 498, 527 Ramírez I. & Meléndez J. 2005, ApJ 626, 446
THE OBSERVATION AND ANALYSIS OF STELLAR PHOTOSPHERES
 THE OBSERVATION AND ANALYSIS OF STELLAR PHOTOSPHERES DAVID F. GRAY University of Western Ontario, London, Ontario, Canada CAMBRIDGE UNIVERSITY PRESS Contents Preface to the first edition Preface to the
The Science of Gaia: Stellar Atmospheres
 The Science of Gaia: Stellar Atmospheres ELSA RTN school, Leiden, 19.-28.11.2007 Andreas Korn Institute for Physics and Astronomy (IFA) Uppsala University Sweden Who is this guy? Born in 1972, raised in
Fundamental stellar parameters & the fine structure of the Low Main Sequence
 Fundamental stellar parameters & the fine structure of the Low Main Sequence Luca Casagrande MPA: I. Ramírez, M. Asplund CAUP: J. Meléndez ANU: M. Bessell Casagrande et al. (2010, A&A - in press; arxiv:1001.3142)
Fundamental stellar parameters
 Fundamental stellar parameters flux received at Earth f º = direct determination of Teff R = radius of the spherical star, D = distance to the star. Luminosity : L = 4π R 2 F º dº T eff 4 = 4π R 2 F =
Classical observations of stellar properties
 Classical observations of stellar properties Luca Casagrande M. Bessell - J. Meléndez - I. Ramírez / M. Asplund R. Schönrich / V. Silva Aguirre Spectroscopy F(l) : lots of info, but also model dependent
A list of data for the broadening of metallic lines by neutral hydrogen collisions
 ASTRONOMY & ASTROPHYSICS MARCH II 2000, PAGE 467 SUPPLEMENT SERIES Astron. Astrophys. Suppl. Ser. 142, 467 473 (2000) A list of data for the broadening of metallic lines by neutral hydrogen collisions
CNO abundances in the Sun and Solar Twins
 CNO abundances in the Sun and Solar Twins Jorge Meléndez Departamento de Astronomia, IAG, Universidade de São Paulo Sunset in Paracas, Peru (c) www.flickr.com/photos/rodrigocampos/ Why are C, N, O (and
12. Physical Parameters from Stellar Spectra. Fundamental effective temperature calibrations Surface gravity indicators Chemical abundances
 12. Physical Parameters from Stellar Spectra Fundamental effective temperature calibrations Surface gravity indicators Chemical abundances 1 Fundamental Properties of Stars Temperature (T) Radius (R) Chemical
Chapter 7: From theory to observations
 Chapter 7: From theory to observations Given the stellar mass and chemical composition of a ZAMS, the stellar modeling can, in principle, predict the evolution of the stellar bolometric luminosity, effective
Classical Methods for Determining Stellar Masses, Temperatures, and Radii
 Classical Methods for Determining Stellar Masses, Temperatures, and Radii Willie Torres Harvard-Smithsonian Center for Astrophysics 2010 Sagan Exoplanet Summer Workshop 1 Outline Basic properties of stars
Oxygen in the Early Galaxy: OH Lines as Tracers of Oxygen Abundance in Extremely Metal-Poor Giant Stars
 Oxygen in the Early Galaxy: OH Lines as Tracers of Oxygen Abundance in Extremely Metal-Poor Giant Stars A. Kučinskas 1, V. Dobrovolskas 1, P. Bonifacio 2, E. Caffau 2, H.-G. Ludwig 3, M. Steffen 4, M.
(c) Sketch the ratio of electron to gas pressure for main sequence stars versus effective temperature. [1.5]
![(c) Sketch the ratio of electron to gas pressure for main sequence stars versus effective temperature. [1.5]](/thumbs/77/76458229.jpg "(c) Sketch the ratio of electron to gas pressure for main sequence stars versus effective temperature. [1.5]") 1. (a) The Saha equation may be written in the form N + n e N = C u+ u T 3/2 exp ( ) χ kt where C = 4.83 1 21 m 3. Discuss its importance in the study of stellar atmospheres. Carefully explain the meaning
1. (a) The Saha equation may be written in the form N + n e N = C u+ u T 3/2 exp ( ) χ kt where C = 4.83 1 21 m 3. Discuss its importance in the study of stellar atmospheres. Carefully explain the meaning
2. Stellar atmospheres: Structure
 2. Stellar atmospheres: Structure 2.1. Assumptions Plane-parallel geometry Hydrostatic equilibrium, i.e. o no large-scale accelerations comparable to surface gravity o no dynamically significant mass loss
6. Stellar spectra. excitation and ionization, Saha s equation stellar spectral classification Balmer jump, H -
 6. Stellar spectra excitation and ionization, Saha s equation stellar spectral classification Balmer jump, H - 1 Occupation numbers: LTE case Absorption coefficient: κ ν = n i σ ν$ à calculation of occupation
FIA0221: Taller de Astronomía II. Lecture 14 Spectral Classification of Stars
 FIA0221: Taller de Astronomía II Lecture 14 Spectral Classification of Stars Spectral types along the stellar CMD. Oh, Be A Fine Girl Kiss Me! Classification of Stellar spectra: The MK system: strong He+
From theory to observations
 Stellar Objects: From theory to observations 1 From theory to observations Update date: December 13, 2010 Given the stellar mass and chemical composition of a ZAMS, the stellar modeling can, in principle,
A new spectroscopic calibration to determine T eff and [Fe/H] of FGK dwarfs and giants
![A new spectroscopic calibration to determine T eff and [Fe/H] of FGK dwarfs and giants](/thumbs/75/71694039.jpg "A new spectroscopic calibration to determine T eff and [Fe/H] of FGK dwarfs and giants") A new spectroscopic calibration to determine T eff and [Fe/H] of FGK dwarfs and giants G.D.C.Teixeira 1,2,, S. G. Sousa 1, M. Tsantaki 1,3, M.J.P.F.G.Monteiro 1,2, N. C. Santos 1,2, and G. Israelian 4,5
A new spectroscopic calibration to determine T eff and [Fe/H] of FGK dwarfs and giants G.D.C.Teixeira 1,2,, S. G. Sousa 1, M. Tsantaki 1,3, M.J.P.F.G.Monteiro 1,2, N. C. Santos 1,2, and G. Israelian 4,5
Spectroscopy of giants and supergiants! Maria Bergemann MPIA Heidelberg"
 Spectroscopy of giants and supergiants! Maria Bergemann MPIA Heidelberg" Spectroscopy of (cool) giants and supergiants! Maria Bergemann MPIA Heidelberg" Outline! Motivation why do spectroscopy of giant
arxiv:astro-ph/ v1 18 Apr 2000
 A&A manuscript no. (will be inserted by hand later) Your thesaurus codes are: 07(08.01.1, 08.01.3, 08.06.3, 08.09.2 G271-162, 09.03.2) ASTRONOMY AND ASTROPHYSICS The lithium isotope ratio in the metal-poor
6. Stellar spectra. excitation and ionization, Saha s equation stellar spectral classification Balmer jump, H -
 6. Stellar spectra excitation and ionization, Saha s equation stellar spectral classification Balmer jump, H - 1 Occupation numbers: LTE case Absorption coefficient: = n i calculation of occupation numbers
WINDS OF HOT MASSIVE STARS III Lecture: Quantitative spectroscopy of winds of hot massive stars
 WINDS OF HOT MASSIVE STARS III Lecture: Quantitative spectroscopy of winds of hot massive stars 1 Brankica Šurlan 1 Astronomical Institute Ondřejov Selected Topics in Astrophysics Faculty of Mathematics
6. Stellar spectra. excitation and ionization, Saha s equation stellar spectral classification Balmer jump, H -
 6. Stellar spectra excitation and ionization, Saha s equation stellar spectral classification Balmer jump, H - 1 Occupation numbers: LTE case Absorption coefficient: = n i calculation of occupation numbers
SISD Training Lectures in Spectroscopy
 SISD Training Lectures in Spectroscopy Anatomy of a Spectrum Visual Spectrum of the Sun Blue Spectrum of the Sun Morphological Features in Spectra λ 2 Line Flux = Fλ dλ λ1 (Units: erg s -1 cm -2 ) Continuum
Stellar atmospheres: an overview
 Stellar atmospheres: an overview Core M = 2x10 33 g R = 7x10 10 cm 50 M o 20 R o L = 4x10 33 erg/s 10 6 L o 10 4 (PN) 10 6 (HII) 10 12 (QSO) L o Photosphere Envelope Chromosphere/Corona R = 200 km ~ 3x10
Oxygen in red giants from near-infrared OH lines: 3D effects and first results from. Puerto de la Cruz, May 14, 2012! Carlos Allende Prieto!
 Oxygen in red giants from near-infrared OH lines: 3D effects and first results from Puerto de la Cruz, May 14, 2012! Carlos Allende Prieto! Overview! 1. APOGEE: status and prospects! 2. A first look at
High resolution spectroscopy of two metal-poor red giants: HD and HD
 High resolution spectroscopy of two metal-poor red giants: HD 3078 and HD 1873 Faculty of Physics and Mathematics, University of Latvia, Raiņa bulv. 19, Riga, LV-1586, Latvia E-mail: arturs_ lv@inbox.lv
Family of stars. Fred Sarazin Physics Department, Colorado School of Mines. PHGN324: Family of stars
 Family of stars Reminder: the stellar magnitude scale In the 1900 s, the magnitude scale was defined as follows: a difference of 5 in magnitude corresponds to a change of a factor 100 in brightness. Dm
Characterization of Exoplanet-Host Stars Vardan Adibekyan Instituto de Astrofísica e Ciências do Espaço
 Characterization of Exoplanet-Host Stars Vardan Adibekyan Instituto de Astrofísica e Ciências do Espaço vardan.adibekyan@astro.up.pt Why not Sergio? It was a real war with casualties... Before going to
Supergiant Studies out to Virgo & Fornax
 Supergiant Studies out to Virgo & Fornax Norbert Przybilla R.P. Kudritzki, M.A. Urbaneja (IfA Hawaii), A. Seifahrt (Univ. Chicago), K. Butler (LMU Munich), M.F. Nieva (Bamberg), H.-U. Käufl, A. Kaufer
ASTRONOMY AND ASTROPHYSICS. Synthetic photometry from ATLAS9 models in the UBV Johnson system. Fiorella Castelli
 Astron. Astrophys. 346, 564 585 (1999) ASTRONOMY AND ASTROPHYSICS Synthetic photometry from ATLAS9 models in the UBV Johnson system Fiorella Castelli CNR-Gruppo Nazionale Astronomia and Osservatorio Astronomico,
From theory to observations
 Stellar Objects: From theory to observations 1 From theory to observations Given the stellar mass and chemical composition of a ZAMS, the stellar modeling can, in principle, give the prediction of the
arxiv:astro-ph/ v1 28 Feb 2003
 Stellar Rotation Proceedings IAU Symposium No. 215, c 2003 IAU André Maeder & Philippe Eenens, eds. Absolute Wavelength Shifts A new diagnostic for rapidly rotating stars arxiv:astro-ph/0302592v1 28 Feb
The effective temperature scale of giant stars (F0 K5)
") ASTRONOMY & ASTROPHYSICS OCTOBER II 1999, PAGE 335 SUPPLEMENT SERIES Astron. Astrophys. Suppl. Ser. 139, 335 358 (1999) The effective temperature scale of giant stars (F0 K5) I. The effective temperature
ASTRONOMY & ASTROPHYSICS OCTOBER II 1999, PAGE 335 SUPPLEMENT SERIES Astron. Astrophys. Suppl. Ser. 139, 335 358 (1999) The effective temperature scale of giant stars (F0 K5) I. The effective temperature
ASTR-1020: Astronomy II Course Lecture Notes Section III
 ASTR-1020: Astronomy II Course Lecture Notes Section III Dr. Donald G. Luttermoser East Tennessee State University Edition 4.0 Abstract These class notes are designed for use of the instructor and students
OS-Atmospheres & Open Cluster MS
 OS-Atmospheres & Open Cluster MS Guangzhou November 24 th 2007 Opacity Sampling Model Atmospheres & the Main Sequence of Open Clusters frank@grupp-astro.de Frank GRUPP Slide 1 Outline Opacity sampling
Chemistry & Dynamics of the Milky Way From Before Hipparcos Until Gaia
 Chemistry & Dynamics of the Milky Way From Before Hipparcos Until Gaia J. Andersen 1,2, B. Nordström 1,2 1 Dark Cosmology Centre, The Niels Bohr Institute, University of Copenhagen, Denmark 2 Stellar Astrophysics
ASTROPHYSICS. K D Abhyankar. Universities Press S T A R S A ND G A L A X I E S
 ASTROPHYSICS S T A R S A ND G A L A X I E S K D Abhyankar Universities Press Contents Foreword vii Preface ix 1 Introduction 1 1.1 ' Astronomy and astrophysics 1 1.2 Importance of astronomy 2 1.3 Methods
Massive Stars as Tracers for. Stellar & Galactochemical Evolution
 as Tracers for Stellar & Galactochemical Evolution Norbert Przybilla Dr. Remeis-Observatory Bamberg M. Firnstein, F. Schiller M.F. Nieva, K. Butler, R.P. Kudritzki, G. Meynet, A. Maeder Outline Intro Diagnostics
Chapter 10: Unresolved Stellar Populations
 Chapter 10: Unresolved Stellar Populations We now consider the case when individual stars are not resolved. So we need to use photometric and spectroscopic observations of integrated magnitudes, colors
Lecture 6: Continuum Opacity and Stellar Atmospheres
 Lecture 6: Continuum Opacity and Stellar Atmospheres To make progress in modeling and understanding stellar atmospheres beyond the gray atmosphere, it is necessary to consider the real interactions between
Outline. ESA Gaia mission & science objectives. Astrometric & spectroscopic census of all stars in Galaxy to G=20 mag.
 Atomic Data Requirements for Large Spectroscopic Surveys: ESA Gaia and ESO GES Alex Lobel Royal Observatory of Belgium Outline ESA Gaia mission & science objectives. Astrometric & spectroscopic census
Substellar Atmospheres. PHY 688, Lecture 18 Mar 9, 2009
 Substellar Atmospheres PHY 688, Lecture 18 Mar 9, 2009 Outline Review of previous lecture the Kepler mission launched successfully results P < 1 month planets by September 09 giant planet interiors comparison
Lecture 2: Formation of a Stellar Spectrum
 Abundances and Kinematics from High- Resolution Spectroscopic Surveys Lecture 2: Formation of a Stellar Spectrum Eline Tolstoy Kapteyn Astronomical Institute, University of Groningen I have a spectrum:
Thorium (Th) Enrichment in the Milky Way Galaxy
 Enrichment in the Milky Way Galaxy") Thorium (Th) Enrichment in the Milky Way Galaxy National Astronomical Observatory of Japan, 2-21-1 Osawa, Mitaka, Tokyo 181-8588, Japan E-mail: aoki.wako@nao.ac.jp Satoshi Honda Kwasan Observatory, Kyoto
Thorium (Th) Enrichment in the Milky Way Galaxy National Astronomical Observatory of Japan, 2-21-1 Osawa, Mitaka, Tokyo 181-8588, Japan E-mail: aoki.wako@nao.ac.jp Satoshi Honda Kwasan Observatory, Kyoto
Substellar Atmospheres II. Dust, Clouds, Meteorology. PHY 688, Lecture 19 Mar 11, 2009
 Substellar Atmospheres II. Dust, Clouds, Meteorology PHY 688, Lecture 19 Mar 11, 2009 Outline Review of previous lecture substellar atmospheres: opacity, LTE, chemical species, metallicity Dust, Clouds,
arxiv: v1 [astro-ph.ga] 20 Jun 2013
![arxiv: v1 [astro-ph.ga] 20 Jun 2013](/thumbs/85/91551292.jpg "arxiv: v1 [astro-ph.ga] 20 Jun 2013") IAUS298 Setting the scene for Gaia and LAMOST Proceedings IAU Symposium No. 298, 2014 S. Feltzing, G. Zhao, N.A. Walton & P.A. Whitelock, eds. c 2014 International Astronomical Union DOI: 00.0000/X000000000000000X
IAUS298 Setting the scene for Gaia and LAMOST Proceedings IAU Symposium No. 298, 2014 S. Feltzing, G. Zhao, N.A. Walton & P.A. Whitelock, eds. c 2014 International Astronomical Union DOI: 00.0000/X000000000000000X
Characterization of the exoplanet host stars. Exoplanets Properties of the host stars. Characterization of the exoplanet host stars
 Characterization of the exoplanet host stars Exoplanets Properties of the host stars Properties of the host stars of exoplanets are derived from a combination of astrometric, photometric, and spectroscopic
DWARFS IN THE LOCAL REGION
 The Astronomical Journal, 131:3069 3092, 2006 June # 2006. The American Astronomical Society. All rights reserved. Printed in U.S.A. A DWARFS IN THE LOCAL REGION R. Earle Luck 1 and Ulrike Heiter 2 Received
Stars - spectral types
 Stars - spectral types 1901: Led by Annie Jump Cannon, Harvard astronomers looked at the spectra of >200,000 stars. Classified them as A, B, C etc. Cannon rearranged them into OBAFGKM based on how lines
Lecture 2 Interstellar Absorption Lines: Line Radiative Transfer
 Lecture 2 Interstellar Absorption Lines: Line Radiative Transfer 1. Atomic absorption lines 2. Application of radiative transfer to absorption & emission 3. Line broadening & curve of growth 4. Optical/UV
Ay Fall 2004 Lecture 6 (given by Tony Travouillon)
") Ay 122 - Fall 2004 Lecture 6 (given by Tony Travouillon) Stellar atmospheres, classification of stellar spectra (Many slides c/o Phil Armitage) Formation of spectral lines: 1.excitation Two key questions:
Ay 122 - Fall 2004 Lecture 6 (given by Tony Travouillon) Stellar atmospheres, classification of stellar spectra (Many slides c/o Phil Armitage) Formation of spectral lines: 1.excitation Two key questions:
Lecture 4: Absorption and emission lines
 Lecture 4: Absorption and emission lines Senior Astrophysics 2018-03-13 Senior Astrophysics () Lecture 4: Absorption and emission lines 2018-03-13 1 / 35 Outline 1 Absorption and emission line spectra
Very low mass stars: non-linearity of the limb-darkening laws
 Astron. Astrophys. 335, 647 653 (998) ASTRONOMY AND ASTROPHYSICS Very low mass stars: non-linearity of the limb-darkening laws A. Claret Instituto de Astrofísica de Andalucía, CSIC, Apartado 34, E-88 Granada,
Na, Mg and Al abundances as a population discriminant for nearby metal-poor stars ABSTRACT
 A&A 451, 1065 1079 (2006) DOI: 10.1051/0004-6361:20054434 c ESO 2006 Astronomy & Astrophysics Na, Mg and Al abundances as a population discriminant for nearby metal-poor stars T. Gehren 1,J.R.Shi 1,2,H.W.Zhang
THE PHYSICAL CHARACTERIZATION OF THE STARS. 1 Introduction
 THE PHYSICAL CHARACTERIZATION OF THE STARS CARME JORDI, EDUARD MASANA Departamento de Astronomía y Meteorología, Universidad de Barcelona, Martí i Franqués 1, E-08028 Barcelona, SPAIN Institut de Ciències
High resolution spectroscopic characterization of the FGK stars in the solar neighbourhood
 High resolution spectroscopic characterization of the FGK stars in the solar neighbourhood R. Martínez-Arnáiz 1, J. Maldonado 2, D. Montes 1, C. Eiroa 2, B. Montesinos 3, I. Ribas 4, E. Solano 3 Abstract
The impact of solar surface dynamo magnetic fields on the chemical abundance determination
 The impact of solar surface dynamo magnetic fields on the chemical abundance determination N. Shchukina 1, A. Sukhorukov 1, J. Trujillo Bueno 2 1 Main Astronomical Observatory, National Academy of Sciences,
Spectroscopy in Astronomy
 Spectroscopy in Astronomy History 1814 German optician Joseph von Fraunhofer sun with 600+ spectral lines; now we know more than 3000 lines 1860 German chemists Gustav Kirchhoff and Robert W. Bunsen Chemical
The Stellar Opacity. F ν = D U = 1 3 vl n = 1 3. and that, when integrated over all energies,
 The Stellar Opacity The mean absorption coefficient, κ, is not a constant; it is dependent on frequency, and is therefore frequently written as κ ν. Inside a star, several different sources of opacity
Astronomy II (ASTR-1020) Homework 2
 Homework 2") Astronomy II (ASTR-1020) Homework 2 Due: 10 February 2009 The answers of this multiple choice homework are to be indicated on a Scantron sheet (either Form # 822 N-E or Ref # ABF-882) which you are to
Astronomy II (ASTR-1020) Homework 2 Due: 10 February 2009 The answers of this multiple choice homework are to be indicated on a Scantron sheet (either Form # 822 N-E or Ref # ABF-882) which you are to
The Classification of Stellar Spectra Chapter 8
 The Classification of Stellar Spectra Chapter 8 Star Clusters in the Large Magellanic Cloud http://www.seds.org/hst/ NGC850.html The Classification of Stellar Spectra Classification scheme developed before
V. Stars.
 V. Stars http://sgoodwin.staff.shef.ac.uk/phy111.html 0. The local HR diagram We saw that locally we can make an HR diagram of absolute luminosity against temperature. We find a main sequence, giants and
arxiv: v1 [astro-ph] 22 Oct 2007
![arxiv: v1 [astro-ph] 22 Oct 2007](/thumbs/94/120774244.jpg "arxiv: v1 [astro-ph] 22 Oct 2007") arxiv:0710.4134v1 [astro-ph] 22 Oct 2007 Radial velocities of giant stars: an investigation of line profile variations. S Hekker 1, I A G Snellen 1, C Aerts 2,3, A Quirrenbach 4, S Reffert 4 and D S Mitchell
arxiv:0710.4134v1 [astro-ph] 22 Oct 2007 Radial velocities of giant stars: an investigation of line profile variations. S Hekker 1, I A G Snellen 1, C Aerts 2,3, A Quirrenbach 4, S Reffert 4 and D S Mitchell
Galactic Projects at ESO Disk and halo. Birgitta Nordström Niels Bohr Institute Copenhagen University Denmark
 Galactic Projects at ESO Disk and halo Birgitta Nordström Niels Bohr Institute Copenhagen University Denmark B. Nordstrom Prague 15 April 2014 1980: Milky Way Structure was Known - the formation and evolution
Lecture Three: Stellar Populations. Stellar Properties: Stellar Populations = Stars in Galaxies. What defines luminous properties of galaxies
 Lecture Three: ~2% of galaxy mass in stellar light Stellar Populations What defines luminous properties of galaxies face-on edge-on https://www.astro.rug.nl/~etolstoy/pog16/ 18 th April 2016 Sparke & Gallagher,
ASTRONOMY AND ASTROPHYSICS ORFEUS II echelle spectra: on the influence of iron-group line blanketing in the Far-UV spectral range of hot subdwarfs
 Astron. Astrophys. 360, 281 289 (2000) ASTRONOMY AND ASTROPHYSICS ORFEUS II echelle spectra: on the influence of iron-group line blanketing in the Far-UV spectral range of hot subdwarfs J.L. Deetjen Institut
Galactic, stellar (and planetary) archaeology with Gaia: The galactic white dwarf population
 archaeology with Gaia: The galactic white dwarf population") Galactic, stellar (and planetary) archaeology with Gaia: The galactic white dwarf population Boris Gänsicke & Roberto Raddi Richard Ashley Jay Farihi Nicola Gentile Fusillo Mark Hollands Paula Izquierdo
Galactic, stellar (and planetary) archaeology with Gaia: The galactic white dwarf population Boris Gänsicke & Roberto Raddi Richard Ashley Jay Farihi Nicola Gentile Fusillo Mark Hollands Paula Izquierdo
Tests of stellar physics with high-precision data from eclipsing binary stars
 Tests of stellar physics with high-precision data from eclipsing binary stars Ignasi Ribas Institut de Ciències de l Espai (CSIC-IEEC, Barcelona) Barcelona, April 2013 Eclipsing binary systems Eclipsing
Astronomy 421. Lecture 14: Stellar Atmospheres III
 Astronomy 421 Lecture 14: Stellar Atmospheres III 1 Lecture 14 - Key concepts: Spectral line widths and shapes Curve of growth 2 There exists a stronger jump, the Lyman limit, occurring at the wavelength
Measurement of the stellar irradiance
 Measurement of the stellar irradiance Definitions Specific Intensity : (monochromatic) per unit area normal to the direction of radiation per unit solid angle per unit wavelength unit (or frequency) per
Characterisation of the open cluster M67
 Characterisation of the open cluster M67 Author: Facultat de Física, Universitat de Barcelona, Diagonal 645, 828 Barcelona, Spain. Advisor: Carme Jordi Nebot, Eduard Masana Fresno, Lola Balaguer Núñez
Electromagnetic Spectra. AST443, Lecture 13 Stanimir Metchev
 Electromagnetic Spectra AST443, Lecture 13 Stanimir Metchev Administrative Homework 2: problem 5.4 extension: until Mon, Nov 2 Reading: Bradt, chapter 11 Howell, chapter 6 Tenagra data: see bottom of Assignments
Galaxies 626. Lecture 9 Metals (2) and the history of star formation from optical/uv observations
 and the history of star formation from optical/uv observations") Galaxies 626 Lecture 9 Metals (2) and the history of star formation from optical/uv observations Measuring metals at high redshift Metals at 6 How can we measure the ultra high z star formation? One robust
Galaxies 626 Lecture 9 Metals (2) and the history of star formation from optical/uv observations Measuring metals at high redshift Metals at 6 How can we measure the ultra high z star formation? One robust
Observational Constraints on the r-process from Halo r-ii Stars
 The Joint Institute for Nuclear Astrophysics Center for the Evolution of the Elements Observational Constraints on the r-process from Halo r-ii Stars Timothy C. Beers University of Notre Dame ND Group:
arxiv:astro-ph/ v1 5 May 2004
 Modelling of Stellar Atmospheres IAU Symposium, Vol. xxx, xxxx N. E. Piskunov, W. W. Weiss, D. F. Gray, eds. New Grids of ATLAS9 Model Atmospheres arxiv:astro-ph/0405087v1 5 May 2004 Fiorella Castelli
Radiative Transfer and Stellar Atmospheres
 Radiative Transfer and Stellar Atmospheres 4 lectures within the first IMPRS advanced course Joachim Puls Institute for Astronomy & Astrophysics, Munich Contents quantitative spectroscopy: the astrophysical
SkyMapper and EMP stars
 SkyMapper and EMP stars Mike Bessell on behalf of the EMP team Research School of Astronomy & Astrophysics Slide 2 The discovery of the ancient star with no Fe lines. SkyMapper 2.3m WiFeS Magellan MIKE
Limb Darkening. Limb Darkening. Limb Darkening. Limb Darkening. Empirical Limb Darkening. Betelgeuse. At centre see hotter gas than at edges
 Limb Darkening Sun Betelgeuse Limb Darkening Stars are both redder and dimmer at the edges Sun Limb Darkening Betelgeuse Limb Darkening Can also be understood in terms of temperature within the solar photosphere.
Measuring the Properties of Stars (ch. 17) [Material in smaller font on this page will not be present on the exam]
![Measuring the Properties of Stars (ch. 17) [Material in smaller font on this page will not be present on the exam]](/thumbs/85/91935248.jpg "Measuring the Properties of Stars (ch. 17) [Material in smaller font on this page will not be present on the exam]") Measuring the Properties of Stars (ch. 17) [Material in smaller font on this page will not be present on the exam] Although we can be certain that other stars are as complex as the Sun, we will try to
Measuring the Properties of Stars (ch. 17) [Material in smaller font on this page will not be present on the exam] Although we can be certain that other stars are as complex as the Sun, we will try to
arxiv: v1 [astro-ph.sr] 1 Jul 2012
![arxiv: v1 [astro-ph.sr] 1 Jul 2012](/thumbs/81/83375876.jpg "arxiv: v1 [astro-ph.sr] 1 Jul 2012") BD+36 3317: An Algol Type Eclipsing Binary in Delta Lyrae Cluster arxiv:1207.0194v1 [astro-ph.sr] 1 Jul 2012 O. Özdarcan, E. Sipahi, H. A. Dal Ege University, Science Faculty, Department of Astronomy and
BD+36 3317: An Algol Type Eclipsing Binary in Delta Lyrae Cluster arxiv:1207.0194v1 [astro-ph.sr] 1 Jul 2012 O. Özdarcan, E. Sipahi, H. A. Dal Ege University, Science Faculty, Department of Astronomy and
arxiv: v1 [astro-ph.sr] 10 May 2016
![arxiv: v1 [astro-ph.sr] 10 May 2016](/thumbs/93/113611904.jpg "arxiv: v1 [astro-ph.sr] 10 May 2016") Influence of Inelastic Collisions with Hydrogen Atoms on the Formation of Al I and Si I Lines in Stellar Spectra Lyudmila Mashonkina 1, Andrey K. Belyaev 2, Jianrong Shi arxiv:1605.02957v1 [astro-ph.sr]
Influence of Inelastic Collisions with Hydrogen Atoms on the Formation of Al I and Si I Lines in Stellar Spectra Lyudmila Mashonkina 1, Andrey K. Belyaev 2, Jianrong Shi arxiv:1605.02957v1 [astro-ph.sr]
arxiv:astro-ph/ Nov 2001
 Astronomy & Astrophysics manuscript no. (will be inserted by hand later) Europium abundances in F and G disk dwarfs??? Andreas Koch and Bengt Edvardsson Uppsala Astronomical Observatory, Box 55, SE-75
Gaia: Mapping the Milky Way
 Gaia: Mapping the Milky Way (A very brief overview, and something about the Swedish participation) Lennart Lindegren Lund Observatory Department of Astronomy and Theoretical Physics Lund University 1 Gaia
Chapter 4. Spectroscopy. Dr. Tariq Al-Abdullah
 Chapter 4 Spectroscopy Dr. Tariq Al-Abdullah Learning Goals: 4.1 Spectral Lines 4.2 Atoms and Radiation 4.3 Formation of the Spectral Lines 4.4 Molecules 4.5 Spectral Line Analysis 2 DR. T. AL-ABDULLAH
Some HI is in reasonably well defined clouds. Motions inside the cloud, and motion of the cloud will broaden and shift the observed lines!
 Some HI is in reasonably well defined clouds. Motions inside the cloud, and motion of the cloud will broaden and shift the observed lines Idealized 21cm spectra Example observed 21cm spectra HI densities
arxiv:astro-ph/ v1 14 Dec 1998
 Spectroscopy of red giants of the Sagittarius dwarf galaxy arxiv:astro-ph/9812267v1 14 Dec 1998 G. Marconi Osservatorio Astronomico di Roma P. Bonifacio Osservatorio Astronomico di Trieste L. Pasquini
Stellar Spectra ASTR 2120 Sarazin. Solar Spectrum
 Stellar Spectra ASTR 2120 Sarazin Solar Spectrum Solar Prominence Sep. 14, 1999 Solar Activity Due to rotation, convection, and magnetic field (Section 7.2 review) Charged Particles in Magnetic Fields
Stellar Spectra ASTR 2110 Sarazin. Solar Spectrum
 Stellar Spectra ASTR 2110 Sarazin Solar Spectrum Test #1 Monday, October 9, 11-11:50 am Ruffner G006 (classroom) You may not consult the text, your notes, or any other materials or any person Bring pencils,
A Stellar Spectra 3. Stars shine at night (during the day too!). A star is a self-luminous sphere of gas. Stars are held together by gravity.
. A star is a self-luminous sphere of gas. Stars are held together by gravity.") Stellar Spectra Relativity and Astrophysics Lecture 12 Terry Herter Outline What is a star? Stellar Spectra Kirchhoff s Laws Spectral Classification Spectral Types: O B A F G K M L T Stellar Photometry
Stellar Spectra Relativity and Astrophysics Lecture 12 Terry Herter Outline What is a star? Stellar Spectra Kirchhoff s Laws Spectral Classification Spectral Types: O B A F G K M L T Stellar Photometry
arxiv: v1 [astro-ph.sr] 8 Sep 2014
![arxiv: v1 [astro-ph.sr] 8 Sep 2014](/thumbs/92/110806019.jpg "arxiv: v1 [astro-ph.sr] 8 Sep 2014") Exploiting the open clusters in the Kepler and CoRoT fields Karsten Brogaard, Eric Sandquist, Jens Jessen-Hansen, Frank Grundahl, and Søren Frandsen arxiv:1409.2271v1 [astro-ph.sr] 8 Sep 2014 Abstract
Exploiting the open clusters in the Kepler and CoRoT fields Karsten Brogaard, Eric Sandquist, Jens Jessen-Hansen, Frank Grundahl, and Søren Frandsen arxiv:1409.2271v1 [astro-ph.sr] 8 Sep 2014 Abstract
6. Interstellar Medium. Emission nebulae are diffuse patches of emission surrounding hot O and
 6-1 6. Interstellar Medium 6.1 Nebulae Emission nebulae are diffuse patches of emission surrounding hot O and early B-type stars. Gas is ionized and heated by radiation from the parent stars. In size,
Spectroscopy. AST443, Lecture 14 Stanimir Metchev
 Spectroscopy AST443, Lecture 14 Stanimir Metchev Administrative Homework 2: problem 5.4 extension: until Mon, Nov 2 Homework 3: problems 8.32, 8.41, 10.31, 11.32 of Bradt due in class Mon, Nov 9 Reading:
Types of Stars and the HR diagram
 Types of Stars and the HR diagram Full window version (looks a little nicer). Click button to get back to small framed version with content indexes. This material (and images) is copyrighted! See
Stellar Formation and Evolution
 Stellar Formation and Evolution Wen Ping Chen http://www.astro.ncu.edu.tw/~wchen/courses/stars/default.htm What is a star? How hot is the surface of the Sun? How is this known? The Sun is gaseous, so how
arxiv: v1 [astro-ph.sr] 28 Jan 2010
![arxiv: v1 [astro-ph.sr] 28 Jan 2010](/thumbs/82/85728073.jpg "arxiv: v1 [astro-ph.sr] 28 Jan 2010") Light elements in the Universe Proceedings IAU Symposium No. 268, 2010 C. Charbonnel, M. Tosi, F. Primas & C. Chiappini, eds. c 2010 International Astronomical Union DOI: 00.0000/X000000000000000X Observational
Light elements in the Universe Proceedings IAU Symposium No. 268, 2010 C. Charbonnel, M. Tosi, F. Primas & C. Chiappini, eds. c 2010 International Astronomical Union DOI: 00.0000/X000000000000000X Observational
Stellar Structure and Evolution
 Stellar Structure and Evolution Birth Life Death Part I: Stellar Atmospheres Part I: Stellar Atmospheres Jan. 23: Intro and Overview of Observational Data (Chapters 3 and 5) Jan. 28: Basics of Stellar
Astronomy 404 October 9, 2013
 Nuclear reaction rate: Astronomy 404 October 9, 2013 from the tunneling increases with increasing E from the velocity distrib. decreases with increasing E The Gamow peak occurs at energy Energy generation
SpectroWeb: An Interactive Graphical Database of Digital Stellar Spectral Atlases
 : An Interactive Graphical Database of Digital Stellar Spectral Atlases arxiv:0707.3722v1 [astro-ph] 25 Jul 2007. A. LOBEL 1 1 Royal Observatory of Belgium, Ringlaan 3, Brussels, B-1180, Belgium ABSTRACT
AG Draconis. A high density plasma laboratory. Dr Peter Young Collaborators A.K. Dupree S.J. Kenyon B. Espey T.B.
 AG Draconis A high density plasma laboratory Collaborators A.K. Dupree S.J. Kenyon B. Espey T.B. Ake p.r.young@rl.ac.uk Overview CHIANTI database Symbiotic Stars AG Draconis FUSE FUSE observations of AG