Evolution of E B Shear and Coherent Fluctuations Prior to H-L Transitions in DIII-D and Control Strategies for H-L Transitions
|
|
|
- Harry Wilkinson
- 5 years ago
- Views:
Transcription
1 AIP/123-QED Evolution of E B Shear and Coherent Fluctuations Prior to H-L Transitions in DIII-D and Control Strategies for H-L Transitions D. Eldon, 1, 2, a) R.L. Boivin, 3 C. Chrystal, 4 R. J. Groebner, 3 G. R. McKee, 5 L. Schmitz, 6 G.R. Tynan, 2 Z. Yan, 5 J. A. Boedo, 2 K.H. Burrell, 3 J.D. King, 3 E. Kolemen, 1 N. C. Luhmann, Jr., 7 C. M. Muscatello, 3 T.H. Osborne, 3 and P.B. Snyder 3 1) Princeton University 2) University of California, San Diego 3) General Atomics 4) Oak Ridge Associated Universities 5) University of Wisconsin, Madison 6) University of California, Los Angeles 7) University of California, Davis (Dated: 7 October 2015) 1
2 While operating a magnetic fusion device in H-mode has many advantages, care must be taken to understand and control the release of energy during the H-L back transition, as the extra energy stored within the H-mode transport barrier will have the potential to cause damage to material components of a large future tokamak such as ITER. Examining a scenario where the H-L back transition sequence begins before the E B shearing layer decays on its own, we identify a long-lived precursor mode which is tied to the events of the H-L sequence and we develop a robust control strategy for ensuring gradual release of energy during the transition sequence. Back transitions in this scenario commonly begin with a rapid relaxation of the pedestal which was previously shown to be inconsistent with ideal peeling-ballooning instability as the trigger, 1 despite being otherwise similar to a large type-i ELM. This so-called transient occurs when the E B shearing rate ω E B is significantly larger than the turbulence decorrelation rate ω T, indicating that this is not the result of runaway turbulence recovery. The transient is always synchronous with amplitude and propagation velocity modulations of the precursor mode, dubbed the Modulating Pedestal Mode (MPM). The MPM is a coherent density fluctuation which, in our scenario at least, reliably appears in the steep gradient region with f 70 khz, k θ 0.3 cm 1 and it exists for 100 ms before the onset of back transitions. The transient may be reliably eliminated by reducing toroidal rotation in the co-current direction by application of torque from counter-injecting neutral beams. The transient in these soft H-L transitions is then replaced by a small type-iii ELM which is also always synchronous with the MPM, and MPM shows the same behavior in both hard and soft cases. PACS numbers: Fa, Xz, Ex, Ra Keywords: H-L transition, H-mode, Tokamak, Heat load, DIII-D a) Electronic mail: deldon@princeton.edu 2
3 39 I. INTRODUCTION High confinement mode (H-mode) is an attractive regime for tokamak reactor operation as it allows higher temperature, density, and confinement time than L-mode or Ohmic operation. 2,3 In H-mode, additional stored energy builds up inside a transport barrier which is present at the outer edge of the plasma, in the last 5% of closed flux surfaces. During the termination phase of H-mode discharges, the transition back to L-mode is often led by a transient spike in D α emission and rapid relaxation of the edge pressure profile which is superficially similar to a large type-i ELM. This occurs even in shots which are specifically constructed to produce a long dithering phase between ELM-free H-mode and L-mode; 4,5 that is, even slow transition sequences are observed to include sudden drops in stored energy in addition to an otherwise gradual decay of energy. This is a problem because rapid pedestal relaxations are expected to cause severe heat loads on plasma facing components in ITER. 6 9 Although the D α spike and pedestal reduction at the start of many H-L sequences are similar to the results of a large type-i ELM, and this event has been referred to as a type-i ELM in other work related to H-L back transitions, 5 it has been shown previously that the triggering mechanism is different: type-i ELMs result from ideal peeling-ballooning instability, 10,11 whereas these H-L back transition transients do not. 1 This means that attempts to predict heat loads for these transients cannot take advantage of work that has been done to develop scaling relations for ELM power deposition, 12 nor are ELM suppression techniques 13 likely to be effective. Previous experiments have developed a scenario which produces an intermediate confinement regime or I-phase between L and H-mode, and have used this to study L-H and H-L transition physics. 4,5 Results from these experiments indicate that I-phase is consistent with a predator prey interaction between zonal flows and turbulence 14,15, and this predator prey theory offers an explanation of essential L-H transition physics. However, the large initial transient appears at the start of H-L back transition sequences and breaks the symmetry between L-I-H and H-I-L transition sequences, complicates efforts to understand H-L transitions, and interferes with the soft landing which might otherwise be allowed by the H-I-L back transition sequence 16. Working in the scenario of Schmitz et al. 5 (which produces I-phase as described above), with experimental setup described in section II, we seek understanding of the physical nature 3
4 of the transient and a means to limit the amount of energy it releases, and pursue this in three investigations. First, we test whether the initiation of the H-L sequence is consistent with spontaneous decay and collapse of the transport barrier (due to insufficient power), by tracking evolution of the E B shearing rate ω E B in comparison to the decorrelation rate of turbulence ω T. The hypothesis that the transport barrier collapses on its own is described in more detail in section III A, and the results are presented in section III B. The results show that activity associated with the H-L transition sequence, including the transient, begins when the shear suppression mechanism is still strong, indicating that the transitions in this scenario are not due to spontaneous collapse of the transport barrier, but instead are triggered by some instability. This is true in hard (with the transient) and soft (no large transient) transitions. Second, while searching for clues about instabilities before the transition, we find the so-called Modulating Pedestal Mode (MPM) and characterize its properties in section IV. The MPM appears 100 ms prior to the transition sequences in these experiments and grows in amplitude until the transition begins. It is significant as the large transients in D α at the start of hard H-L sequences and the small type-iii ELMs at the start of soft H-L sequences are synchronous with modulations of the MPM in all cases observed. Third, in section V, we examine potential control strategies for mitigating or eliminating the transient and find that shots with low toroidal rotation in the co-current direction are associated with soft H-L transitions, which do not begin with sudden relaxations of the pedestal. Hard H-L transitions, which are initiated by the transient, occur when toroidal rotation is faster in the co-current direction. Rotation is controlled by adjusting the balance of power input by co- and counter-injecting neutral beams. 92 II. EXPERIMENT SETUP These DIII-D 17,18 shots were performed using the parameters listed in table I. The evolution of a typical H-mode is shown in Fig. 1: A forward L-H transition completes at 3540 ms, and the plasma is in ELM-free H-mode until the type-i ELMs begin at 3770 ms. The primary heating phase lasts until 4200 ms, after which neutral beam injection (NBI) is only used for diagnostic purposes. The last type-i ELM occurs at 4230 ms. During the following ELM-free period, pedestal density accumulates while the pedestal electron temperature decays, resulting in a pedestal pressure that remains fairly steady. At 4402 ms, 4
5 a rapid ( 1 ms) event similar to the type-i ELMs reduces the pedestal density by 50%, relaxes the pedestal pressure gradient, and releases 10% of the total plasma stored energy, which is typically kj before the reduction in these cases. The rest of the dithering transition sequence follows. In some shots, a de-rated neutral beam (reduced accelerating voltage and perveance to produce lower power) was run continuously during the H-mode termination phase (which would be about ms in the example of Fig. 1: the blue shaded area with some margin) to allow measurements with Beam Emission Spectroscopy (BES), 19 while modulated beams for Charge Exchange Recombination spectroscopy (CER) 20 were used alone in others (as in the example of Fig. 1). TABLE I. Typical shot parameters SymbolValue Name B t T Toroidal field I p 1.0 MA Plasma current β N Normalized beta q Safety factor at 95% flux surf. κ 1.75 Elongation δ 0.3 Triangularity a 0.58 m Minor radius R m m R: Major radius R xpt 1.53 m R, dominant X-point Z xpt m Z, dominant X-point P inj 3300 kw (heat) Average neutral beam 160 kw (diag.) power injected n e / m 3 Line average density before L-H transition 5
6 FIG. 1. History of H-mode from the conclusion of the L-H transition sequence until the beginning of the H-L sequence. (a) D α emission from the outer strike point (b) neutral beam injected power. The modulations are for diagnostic reasons and the average is shown by the thick line (c) plasma stored energy (d) electron density pedestal height (e) electron temperature pedestal height (f) pedestal electron pressure gradient. Electron quantities determined from tanh fits 21 to Thomson scattering data. 22 Shot III. EVOLUTION OF E B SHEAR PRIOR TO H-L SEQUENCE 110 A. E B Shear Layer Collapse Hypothesis Turbulence suppression by radially sheared E B flows has been identified as the mechanism for sustaining the H-mode transport barrier. 3,23 28 The sheared E B flow is hypothesized to reduce the radial extent of turbulent eddies, which reduces radial transport and allows a steepened pressure gradient to form. 27 In another interpretation, 29,30 energy is transferred from turbulence into benign fluctuations which do not cause radial transport. Both pictures agree that radial flow shear leads to turbulence suppression. Logically, a reduction in flow shear could weaken the transport barrier. Should the shearing rate (ω E B v E B / r) decay to the point that turbulent transport began to recover, then the gradients in the pedestal would be reduced. Reduction in the diamagnetic contribution to the radial electric field from the pedestal pressure gradient would further weaken the shear suppression mechanism, allowing turbulent transport to increase. If this process fed back on itself quickly enough, the edge pressure could be very quickly reduced to L-mode levels, and the resulting outflow of material would cause a flash of D α light at the strike point, consistent with the observed transient at the beginning of the H-L transition sequence, which is shown, along with the experimental setup, in section II. The critical test is whether the shearing rate (ω E B ) decays before the transition sequence begins and becomes comparable to the turbulence decorrelation rate (ω T ) when the transient occurs. It will be shown in section III that decay of ω E B is quite small and that the transient occurs when ω E B > ω T, so the transient is not triggered by a rapid increase in turbulence resulting from the collapse of the shear suppression mechanism. This motivates the search for a different explanation, leading to the investigation of the MPM in section IV. 6
7 FIG. 2. ω E B and ω T comparison for the termination phase of an H-mode with a hard H-L transition. (a) value of ω E B at the peak at the inside of the E r well (black X w/ gray error bar) and smoothed curve to peak ω E B values (red) with propagated uncertainties (dashes); ω T (blue) calculated during the ELM-free period prior to the beginning of the transition sequence. (b) ω E B /ω T. (c) line average density (black), pedestal e density (blue), and pedestal e pressure (red). (d) D α emission at the outer strike point. NBI was reduced to diagnostic levels at 4505 ms. Most quantities from shot , with beams setup for best CER data quality. Decorrelation rate calculated from matched shot , which used beams for BES. The time sequences are aligned at the transient. FIG. 3. ω E B and ω T comparison for the termination phase of an H-mode with a soft H-L transition. Compare with Fig. 2. NBI was reduced to diagnostic levels at 3300 ms. Most quantities from shot Decorrelation rate calculated from matched shot B. Measurement of E B Shear Prior to H-L Sequence Measurements of ω E B were made using CER. The radial electric field was calculated from force balance using Eq. 1, which is valid if pressure p, density n, and flow velocity v are measured for the same species (fully stripped carbon in this case: charge state Z = +6). 27 E r = p/ r Zen v θb ϕ + v ϕ B θ (1) The shearing rate for flute like turbulence ( η 1, in contrast to ballooning-like turbu- lence: η π where J B η is the parallel correlation length 25, and J = ( ψ ϕ 1 θ) is the Jacobian) as a result of shear in the v E B drift 27 is given by Eq. 2: ω E B = (RB θ) 2 B ψ ω E (2) The E B rotation frequency ω E = E r /RB θ is calculated from CER measurements and then fit to equation A1, 31 which may be found in the appendix. For comparison, the plasma frame turbulence decorrelation rate ω T BES chords as described in appendix A 2. is computed using data from vertically separated The results are shown in Figs. 2 and 3 for typical back transitions with and without the initial transient, respectively (means of avoiding the transient are documented in section V). Reduction in turbulent transport by E B flow shear should be expected when ω E B ω T 7
8 FIG. 4. Spatial position of BES chords relative to representative separatrix (thick magenta line between columns 7 and 8), flux surfaces (dashed: closed, solid: open), and limiting surface (black line) (H-mode), with ω E B ω T resulting in a weaker suppression effect (not H-mode). 25 These results show that ω E B remains well above ω T until after the back transition sequence begins in both cases. Furthermore, the ratio ω E B /ω T is fairly steady at values well above 1. In order for a back transition to be initiated by spontaneous failure of the shear layer, ω E B /ω T would have to decay leading up to the transition. Thus the back transition sequence is not triggered by decay of ω E B during the period before the start of the sequence and some other mechanism must be responsible. 155 IV. CHARACTERIZATION OF MODULATING PEDESTAL MODE Since the hard H-L back transition transient is not an ideal P-B type-i ELM 1 and is not due to spontaneous collapse of E B shear suppression, we now seek to understand the start of the H-L sequence by examining the properties of fluctuations in the pedestal prior to the start of the sequence. During the ELM-free period starting shortly after NBI power is reduced to minimal diagnostic levels and before the start of back transition activity, a powerful coherent fluctuation is seen with consistent properties in all fast density measurements: BES, Doppler BackScattering (DBS), 32 Millimeter-wave Imaging Reflectometer (MIR) 33 and the CO 2 interferometer 34. Unfortunately, fast electron temperature measurements from the Electron Cyclotron Emission (ECE) 35 diagnostic are unavailable because typical densities in these experiments result in cut-off of the critical ECE chords. DIII-D s magnetic probe system 36 is also challenged as the poloidal wavelength of the MPM is roughly equal to the length of the pickup coils which are used for measuring changes in the magnetic field. The MPM is observed before the start of both hard and soft H-L transition sequences and also commonly reappears between the first few dithers or type-iii ELMs of the sequence. The layout of BES chords is shown in Fig. 4. Data from BES column 6 will be used unless otherwise specified. The following sub-sections will detail the signature of the MPM on spectrograms of 8
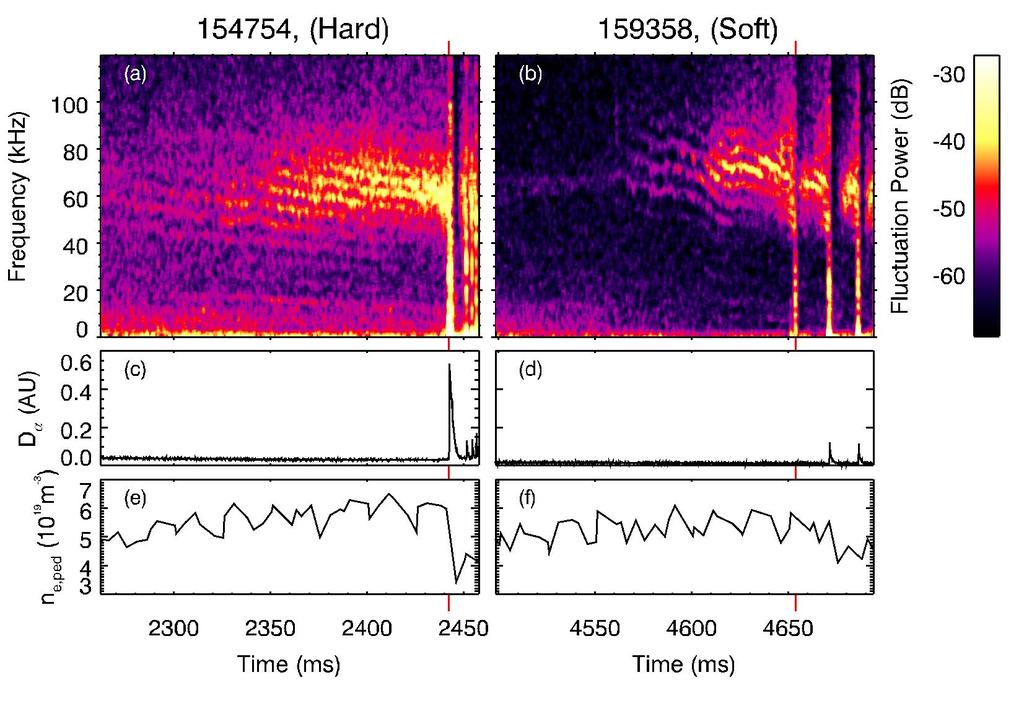
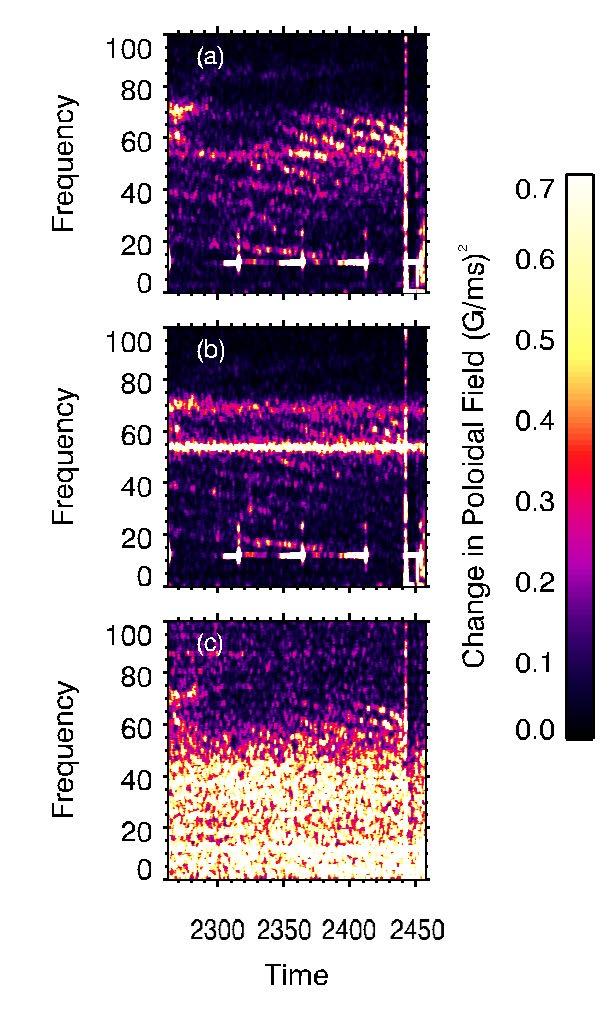
9 rapid density fluctuations (Sec. IV A), examine modulations in amplitude and propagation velocity of the MPM (Sec. IV B), analyze the dispersion properties of the MPM (Sec. IV C), and determine the radial and poloidal localization of the peak fluctuation power associated with the MPM (Sec. IV D). 178 A. Fluctuation Spectra Evolution Prior to the H-L Back Transition Spectrograms of density fluctuations measured with BES during the termination phases of example H-modes with hard and soft back transitions are shown in Fig. 5. In the hard (soft) case, heating power was cut at 2150 ms (4400 ms), type-i ELMs stopped at 2210 ms (4424 ms), and the beam used for BES measurements was turned on at 2260 ms (4400 ms). It can be seen that, for both cases, the fluctuation power peaks between 40 and 80 khz and grows in amplitude until the event at 2442 ms (4653 ms), which is associated with a bright burst of D α emission from the divertor strike point in the case of the hard H- L transition sequence. For this type of event, which is discussed in more detail later, the associated D α spike can be large, small (like the type-iii ELMs), or absent [as in the example shown in Fig. 5(d)] and the size or absence of the D α spike is qualitatively consistent across all filterscope chords in the upper and lower divertors and those tangent to the edge of the plasma at the outboard midplane. It can be seen that the mode has some spectral sidebands. The bands are roughly 5 khz apart at 2400 ms (4630 ms), but they can be seen to contract together over time. Despite dramatic differences in the outcome of the first event of the sequence (which is a rapid slowdown of the MPM s propagation velocity, as shown in the following section), there is no obvious difference in the MPM between cases with hard and soft H-L transitions. Thus, the following characterization of the MPM applies to both hard and soft cases. Several magnetic probes do pick up pieces of MPM s spectral signature, consistent with the measurements shown in Fig. 5. These appear more strongly on a subset of probes that have smaller physical dimensions than is typical ( 1/3 of typical length), although all but one of these also include significant noise. Figure 6(a) shows the spectrum of magnetic fluctuation power on a linear color scale for the single short probe without high noise. The noise problem is demonstrated in Fig. 6(b), which is the spectrum of another short probe but with obvious pollution at about 55 and 70 khz, preventing analysis of the critical part 9
10 FIG. 5. Spectrograms of a BES chord aimed at the steep gradient region, measuring fast density fluctuations before the start of a hard H-L transition sequence (a) and a soft transition (b). The fluctuation properties are very similar, despite obvious differences in the corresponding time histories of D α emissions from the outer strike point (c,d) and pedestal density (e,f). The FFT windows are 4096 samples (4.096 ms) each with 95% overlap. The D α traces are normalized to the large type-i ELMs which occurred earlier in the shot, before the start of the display time window. In the case of the hard transition, the large transient at ms, easily identified by the D α spike in (c) is associated with a vertical stripe in the spectrogram (a). Similar fluctuation behavior before the soft transition [at ms, see (b)] does not always result in any spike in D α emission, such as in this example. FIG. 6. Magnetic fluctuation spectra for three Ḃθ probes at the machine midplane. (a) a short (L θ = 5.5 cm) probe with low noise which detects the MPM s signature. (b) another short probe which experiences high noise in the relevant frequency range. (c) a long (L θ = 14 cm) probe with weak pickup of the MPM (λ θ 20 cm) of the spectrum. Figure 6(c) shows the result from one of the longer probes with vertical length comparable to the vertical wavelength of MPM. It can be seen that the signal is very weak compared to the background, but there is a hint of MPM activity at around 70 khz and 2425 ms. From these measurements, we can conclude only that the MPM is not electrostatic as its signature has been picked up by the one probe which has appropriate dimensions and low noise. The poor ability of all of the other probes to diagnose the MPM prevents many standard magnetic analysis techniques, including confident determination of toroidal mode number B. Amplitude and Propagation Velocity Modulations of the MPM Prior to the H-L Transition The mode amplitude is modulated at 2 khz before the transition sequence begins, as seen in Fig. 7. The modulation frequency is initially higher, but decreases over time. This can be seen in the spacing of the sidebands in Fig. 5. Poloidal propagation of this mode can be seen in the delay between signals on vertically 10
11 FIG MS/s, AC coupled BES signal measuring short timescale density fluctuations from the same chord as was used in Fig. 5(a). The thick red line behind the raw signal is a smoothed Hilbert envelope: A = y + ih(y), where i = 1 and H() is the Hilbert transform. It can be seen that there is a clear fundamental frequency. Thus, the MPM is coherent and the sidebands in the spectrogram are simply the result of amplitude modulation. FIG. 8. Contours of BES Ĩ/I ñ/n,19 for shot with a back transition starting near the end of the time window. The two plots show BES data from columns of chords at R = and cm, respectively (cols. 5 and 6, see Fig. 4). The chosen columns had the strongest indication of the MPM. The time is given relative to the large spike in D α emission, which begins at ms. The lower plot includes the chord used for Fig. 5(a) separated chords with the same radial position; the MPM propagates in the electron dia- magnetic direction, which is also the direction of v E B in the E r well. The BES diagnostic produces two types of measurements: there is a fast signal which is AC coupled and dig- itized at 1 MS/s for detecting high frequency fluctuations, and a slow signal which is DC 222 coupled and digitized at 10 ks/s. The ratio of fast/slow BES intensity Ĩ/I is proportional 223 to ñ/n. 19 Figure 8 shows contours of Ĩ/I ñ/n. The tilt of these contours is due to the 224 poloidal propagation velocity v p, with faster moving features producing more vertically ori ented stripes and slowly propagating features producing more horizontally oriented stripes. It can be seen that as the mode amplitude grows (stripes become brighter ), the propa- gation velocity slows down (the stripes tilt over to the right more). By ms (0 on the plot axis), the perturbation slows and eventually stops at the time when the hard back transition occurs. The propagation velocity prior to the slowdown is consistent with the local E B drift velocity within the uncertainty in the relative positions 37,38 of CER and BES chords. The slowdown happens in 100 µs, whereas CER is configured with a 2.5 ms averaging window and the beams are pulsed on for 5 10 ms out of every 25 ms. Therefore, it cannot be determined from these data whether v E B experiences a temporary reduction during the D α spike or if v p departs from v E B. The dominant frequency and wavenumber of the MPM are found using the method described in appendix B. From these, the lab frame propagation velocity v p and amplitude of the dominant frequency component are found as well. The results are plotted in figure 9, 11
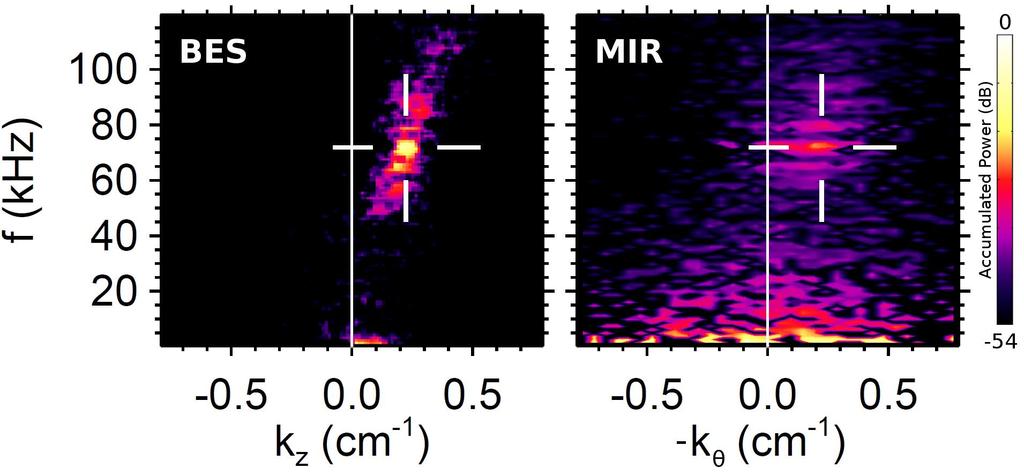
12 238 along with D α for reference. It can be seen in Fig. 9 that all of the quantities of interest FIG. 9. Time histories of (a) amplitude (ñ/n), (b) frequency, (c) wavenumber, (d) propagation velocity, and (e) semi-log plot of D α from a photodiode aimed at the outer strike point. f and k are calculated by the fit to Eq. B1. A back transition begins at ms, marked by a vertical black dashed line. The smoothed results are plotted in red with the un-smoothed results in light gray to give a sense of the scatter produced by this method. Positive velocity indicates propagation vertically upward at the outboard midplane. are experiencing modulation. The modulations in dominant frequency and wavenumber are phased to produce minimal change in v p for most of the time window, but changes in propagation velocity become more significant before the event at ms. During the penultimate peak in amplitude, just before 2442 ms, the propagation velocity drops noticeably (marked by a blue arrow in Fig. 9(d)). There is another drop in v p just before the D α spike begins; this time v p drops to 0 in a behavior which, for convenience, will be referred to as locking. From the measured k z k θ 30 m 1, the diameter of the plasma cross section at the midplane R mid,out R mid,in = 1.15 m, the local safety factor q = 4.7, and the assumption that the mode is field aligned, we estimate the poloidal mode number m = 17 and the toroidal mode number n = 3 or 4. Testing for field alignment on DIII-D would require good results from the magnetic probe system, which is unfortunately not well suited to diagnosing the MPM. However, it would be surprising if the MPM s structure were not extended along the field lines C. Evolution of the MPM Dispersion Relation Leading Up to the H-L Transition While section IV B showed f and k for the dominant component, it is also useful to view the dispersion relation of the entire spectrum. This is accomplished by the local wavenumber analysis described in appendix C and shown in figure 10 for time windows during the ELMfree periods prior to the beginning of back transition sequence seen in Fig. 5(b). BES and MIR data are shown in figure 10 for comparison. MIR measures k θ along flux surfaces, while BES measures k z from a vertical stack of chords, and k z k θ near the midplane. The 12
13 FIG. 10. Dispersion plot: power vs. k, f for 3 ms of BES data (left) and 10 ms of MIR data (right). k is calculated from the crossphase between chord pairs (see Eq. C1). Data are aggregated from several chord pairs in a vertical column (BES) or along a flux surface (MIR). This dataset corresponds to Fig. 5(b) at 4630 ms lower spatial resolution of MIR relative to BES results in more smearing in k, but the results are consistent. It can be seen that all of the frequency components of the MPM lie along a straight line intersecting k=0, f =0: the fundamental and the sidebands propagate at the same propagation velocity v p. This means that the amplitude modulation is propagating with the mode. In contrast, a purely time dependent modulation would produce sidebands at constant k, but different v p. 269 D. Spatial Localization of the MPM The MPM radial position is strongly localized. The banded structure seen in the spectrograms of Fig. 5(a,b) emerges very clearly from the background on chords from only three columns in the BES array (5, 6, and 7; see Fig. 4). The signature is fainter or undetectable on chords located farther out or deeper into the plasma. This is also reflected in the profile of ñ/n: figure 11(a) shows the spatially and temporally resolved amplitude of fluctuations during the ELM-free period prior to the start of the back transition sequence, frequency averaged between 40 and 80 khz. From this plot, it is clear that this mode is localized to a width of a few % in ψ N. Figure 11(b) shows the electron pressure gradient for comparison, demonstrating that the MPM is localized to the steep gradient region. The mode is further localized to the low field side by using a CO 2 interferometer 34 that measures line integrated density along three vertical chords at the V1, V2, and V3 ports at R = 1.48, 1.94, and 2.10 m (compare to R m = 1.75 m and R m + a =2.28 m) and one horizontal chord at the R0 port (midplane). Although the chords sample primarily through the core, the mode being studied is strong enough that it still stands out against the background of other fluctuations picked up along the length of the interferometer chord. That is, density fluctuations with the same temporal and frequency evolution as shown in the BES data [Fig. 5(a,b)], including the spectral sidebands, are present in spectrograms from the interferometer. The characteristic banded structure is seen clearly in the spectrogram (not 13
14 FIG. 11. Comparison of spatial localization of density fluctuations with 40 f 80 khz measured by BES to p e measured by Thomson scattering. Primary heating power is cut at 2150 ms and a hard back transition sequence begins at 2442 ms. (a) BES intensity fluctuation power normalized to average intensity (ratio of fast to slow signals, proportional to ñ/n). All 64 BES chords in a square array (see fig. 4) at the outboard midplane are mapped to ψ N. FFT windows are 10 ms long and power is averaged over the selected frequency band. (b) p e / ψ N. An EFIT 39 equilibrium reconstruction with shifts to correct the alignment of the profiles (see Appendix D) is used for mapping to ψ N. Triangles at the edges of the plots indicate the spatial resolution of (a) BES and (b) TS. The limited resolution of the BES compared to TS explains why movement of the peak p in (b) is not reflected by BES measurements in (a) shown) of the vertical chord V3 at large R on the low-field side, and is almost undetectable by chord V1 on the high-field side. Figure 12 shows the distribution of power in the relevant frequency band on different interferometer chords. The average measured fluctuation power normalized to the length of the interferometer chords in the region 0.92 < ψ N < 0.97 reveals that these fluctuations have at least 10 more power on the low-field side V3 chord than on the V1 chord which samples the high-field side. A significant increase in power is seen from V2 to V3, which are 16 cm apart and both on the low-field side. If one assumes that the power picked up by the R0 chord is strongly dominated by the low field side contribution, then all of this power can be assigned to a radial position 15 cm outboard of V3 and the intersection length can be halved, giving a normalized power greater than double that of V3 and indicating even stronger localization. Of course, not all power in the chosen frequency band has to come from the mode, so this technique underestimates the degree of localization. Thus it is concluded that the MPM is radially localized slightly inside the LCFS and to the low-field side. This is consistent with an instability of ballooning character. While ideal, linear ballooning instability was eliminated as a trigger for the H-L transient by previous work, 1 a resistive, kinetic, or nonlinear variant could still be unstable before the H-L transition and might explain the MPM or the transient. As seen in figure 1, temperature decreases after the beams are turned off, so resistivity (η T 1.5 e ) increases. Decreases in temperature are balanced by increases in density to maintain a nearly steady pressure 14
15 FIG. 12. Localization to the low field side by the interferometer. (a) Physical positions of the interferometer chords (blue and red lines) compared to the pedestal region of the plasma (black). A black asterisk marks the magnetic axis. (b) Average fluctuation power for 45 < f < 95 khz. (c) Fluctuation power from (b) divided by the lengths of the intersections of the chords with the pedestal region. The start of back transition activity starts shortly (< 1 ms) after the end of the time window from which data were taken. The horizontal spacing between the points for the vertical chords in (b) and (c) is proportional to the physical locations of the chords; R0 has been placed arbitrarily for ease of viewing. FIG. 13. Relationship of MPM amplitude with resistivity. Time histories of (a) MPM amplitude, (b) electron temperature at the top of the pedestal, (c) Spitzer transverse resistivity at the top of the pedestal 49, and (d) amplitude vs. resistivity. The gray area represents uncertainty determined by (a) local standard deviation (essentially a measure of high frequency changes which are treated as noise), (b) experimental uncertainties propagated through the smoothing kernel, and (c) standard deviation of 200 Monte-Carlo trials using experimental uncertainty in n e, T e, and assuming 10% error in the effective ion charge state Z eff gradient. Resistive ballooning mode drive is roughly proportional to η p and should be increasing. 40 The lifetime of the MPM (> 100 ms) is far longer than linear growth timescales for common ideal or resistive instabilities. For comparison, typical linear growth timescales for ideal instabilities are on the order of the Alfvén time τ A 1 µs, 10,41 43 whereas the linear growth of resistive wall modes (which are among the slowest growing linear instabilities) is determined largely by the timescale for flux to diffuse through the wall of the vacuum vessel τ w 1 10 ms in DIII-D However, nonlinear instabilities such as tearing modes 46,47 can evolve on longer timescales of 100 ms. 48 This suggests that the nonlinear dynamics of the mode are important. If, for example, the mode were nonlinearly saturated, then amplitude would increase with drive. If the drive were proportional to resistivity, then the mode amplitude should slowly evolve during the ELM free period before the back transition, consistent with the observations shown in figure
16 FIG. 14. Comparison of H-L sequences following short NBI and ECH powered H-modes. A vertical dashed gray line indicates the start of the H-L sequence. (a) shows a step down in stored energy associated with a single prominent D α flash (c) which stands out from its neighbors when the plasma is heated with NBI (e). (b) shows more gradual release of energy with no discontinuity and no stand-out D α flash (d) when heating power comes from ECH (f). There is a pulse of NBI in (f) to enable some beam dependent diagnostics, but the momentum imparted by such a short pulse is small. 320 V. CONDITIONS FOR SOFT H-L TRANSITIONS Soft H-L transitions (without the large transients at the start of the sequences) were observed in four cases: after very short H-modes, after H-modes powered by ECH, in connection with a sudden shape change executed in anticipation of the transient, and after H-modes which received primary heating from NBI counter to the plasma current. The short H-modes terminate before triggering any type-i ELMs and have durations of 100 ms or less, which is comparable to or shorter than the length of the termination phases of the H-modes studied in earlier sections (see Fig. 5). These cases probably do not have enough time to evolve to a state which can drive the hard back transition. Regardless of the reason for the soft transitions out of short H-modes, they are of little interest. Strategies for producing soft H-L transitions should be distinguished from the short H-mode case by comparison between H-modes of similar length with soft and hard H-L transitions or by the presence of type-i ELMs at some point in the H-mode. Empirically, co-nbi heated plasmas with our setup always experience hard back transitions after ELMing. So, presumably an ELMing plasma has had enough time to evolve to the point where hard back transitions can be triggered. The ECH H-modes were compared to NBI H-modes of similar length. The H-L sequences following ECH were soft whereas the post-nbi cases were hard, as seen in Fig. 14. So, use of ECH instead of NBI heating tends to help produce a soft H-L transition sequence. Although several examples similar to Fig. 14 exist, none of the ECH phases from this experiment lasted long enough to produce ELMs. It is not clear whether substituting ECH for NBI would allow a soft transition out of a type-i ELMing plasma in this scenario and more testing would be needed to determine this. 16
17 FIG. 15. H-L transition sequences with and without a sudden change in the plasma boundary shape prior to the transition. A dashed vertical gray line marks the start of the H-L sequence. (a) stored energy, showing a sudden drop associated with the large D α flash in (c) in a case with no intervention, as seen by the steady value of the triangularity shaping parameter in (e). (b) stored energy with no sudden drops and no large D α flash (d) in a case where the triangularity shaping parameter (f) was rapidly increased in anticipation of the H-L sequence The sudden shape change involved an increase in upper triangularity designed to modify the coupling strength between peeling and ballooning modes and move the P-B boundary in p J space. This scheme was conceived of before the transient was shown to be stable to ideal P-B modes. 1 The critical pressure gradient for a strongly coupled P-B mode is a strong function of upper triangularity 6,10 and thus a rapid enough shape change should be able to temporarily outrun increases in pressure gradient, providing an opportunity for some other process to take over and initiate the H-L sequence. Since the common initiator is not a strongly coupled ideal P-B mode 1 and p is not increasing before the transition starts, this technique should not work as expected. Despite these arguments, the technique appears to be successful in removing the transient. Figure 15 shows the results of a sudden triangularity increase in anticipation of the H-L transition, where the H-L sequence on the right side of the figure is initiated by a much smaller D α spike than the sequence on the left side of the figure, and stored energy decreases smoothly, rather than falling suddenly in one step. When the triangularity excursion was not timed correctly or was absent, the transient occurred. It is clear that the quick change is important: in the example shown in Fig. 15, triangularity increases from 0.2 to 0.4. Simply running the discharge at triangularity of 0.4 does not prevent the transient from occurring; instead, triangularity must be set to a lower value and then be increased quickly at the correct time. The transient resulted if the shape change occurred too soon such that the sequence began late in the flat top of the triangularity excursion. It would be useful to conduct further testing to determine whether this technique would work in the termination phase of an H-mode that had been heated for long enough to produce type-i ELMs. The most robust method for producing soft H-L transition sequences is through application of counter-torque during the primary heating phase. Figure 16 shows an example of this behavior. In particular, Fig. 16(a) compared to (b,c) shows a large difference in the 17
18 FIG. 16. Control of the transient associated with H-L transition sequences by varying NBI torque. Power during the primary heating phase was delivered by co, balanced, or counter injecting beams, which were then turned off to allow a back transition. (a) large D α flash at the start of a hard H-L sequence and (b,c) smaller flashes at the start of soft H-L sequences. (d-f) edge toroidal rotation, with the value at the start of the H-L sequence marked by a dashed horizontal line. (g-i) pedestal density, showing a sudden step down associated with co-torque only. (j-l) stored energy, also showing a step down for the co-torque case in contrast to gradual decreases in the balanced and counter torque cases brightness of the initial D α flash, and the plots of pedestal density (g) and stored energy (j) show sharp drops associated with the transient at the start of the hard back transition in contrast to the soft transitions, where density (h,i) and energy (k,l) decrease more smoothly. It can be seen from the figure that although the rotation imparted by the beams decays after primary heating power is removed, a significant difference remains at the start of the H-L transition sequence [Fig. 16(d-f)]. The start of the sequence is being defined by the locking behavior of the MPM (see section IV) and marked by dotted vertical lines. The beams used for diagnostics introduce a small amount of co-torque during the termination phase: blips for CER add an average of +0.2 to +0.3 Nm co-torque and continuous beam usage for BES adds about +1.0 Nm. For comparison, torque injected during the heating phase is -3.3 to -2.6 Nm or +2.7 Nm to +3.9 Nm for counter and co setups. Many counter-torque H-modes were produced and they reliably underwent soft back transitions. The counter-torque shots were interleaved with co-torque shots, which continued to produce hard back transitions. A pair of co-torque shots with hard transitions was surrounded by counter and balanced torque shots which experienced soft transitions, and the counter torque shots were surrounded by co-torque shots with hard transitions. So, the difference does not appear to result from wall loading or other evolving conditions inside the vacuum vessel. Because of the interleaving of co and counter torque shots, it was easy to find hard counterparts for soft transitions. It was found that for most co/ctr pairs of transitions, the only significant difference in the basic measurements was in the toroidal rotation. Electron temperature and density profiles were essentially identical in most cases, as was the depth of the E r well. 18
19 FIG. 17. Prompt energy (a) and pedestal density (b) losses and D α flash brightness (c) vs. edge toroidal rotation frequency for the first v p locking event. The direction of torque injected by the neutral beams during the primary heating phase is indicated by black squares for co-torque, blue diamonds for balanced torque, and red triangles for counter torque. Data are taken from a selection of shots taken the same day with carefully controlled parameters to minimize differences other than torque injection. The prompt energy and density losses for the counter torque cases are lost in the noise. Prompt losses for balanced torque cases are small compared to co-torque cases, but they are now measurable above the noise Prompt energy and density losses and D α flash brightness across the first event of the H-L sequence are plotted vs. edge toroidal rotation frequency in figure 17. It can be seen in the figure that the balanced torque cases have properties which are intermediate between the co and counter torque cases. This suggests that the large transients and small type-iii ELMs at the start of hard and soft H-L transition sequences have related triggering mechanisms: the large transients may be the high rotation limit of the type-iii ELMs. 396 VI. DISCUSSION We find that dithering H-L transition sequences in DIII-D commonly begin when E B shear should be strongly suppressing turbulence, indicating that the low-power ELM-free H-mode preceding the transition sequence in our scenario is promoting the growth of some instability which reduces the pedestal height and thus weakens the diamagnetic contribution to E r, ultimately collapsing the shear layer and terminating H-mode. This is true in hard back transitions where a large transient quickly relaxes most of the pedestal pressure gradient in 1 ms and in soft back transitions where the pedestal is gradually relaxed over 100 ms by a series of type-iii ELMs. In both cases, we find a coherent density fluctuation which appears in the pedestal and grows in amplitude until the start of the back transition. This modulating pedestal mode (MPM) is implicated as a conspirator in the death of the transport barrier by the synchronization of its propagation velocity locking events with the transients and type-iii ELMs of both types of H-L sequence. The MPM is ballooninglike in its spatial localization, its long ( 100 ms) lifetime is consistent with nonlinear saturation, and the evolution of its average amplitude tracks increasing resistivity in the 19
20 steep pressure gradient region. These observations are consistent with a linearly unstable, nonlinearly saturated, resistive ballooning mode. Future work could test this hypothesis using a two-fluid model in a code such as BOUT++ 50 while also exploring other explanations. It was found that the expression of hard vs. soft transitions was sensitive to toroidal rotation. However, there appears to be a continuum of sizes available for the first event of the H-L sequence, as was demonstrated in figure 17. This continuum of transient/type-iii ELM sizes, together with the observation of identical MPM v p locking behavior synchronized with transients and type-iii ELMs, suggests that these events are triggered the same way: the transient is a giant type-iii ELM. While type-iii ELMs are somewhat ill-defined, 51 it is generally agreed that they occur below the ideal ballooning limit and are probably triggered by a resistive instability. Also of note is that although quickly co-rotating plasmas experience large transients at the start of their H-L sequences, the second v p locking event typically results in a small type-iii ELM. The reduction in toroidal rotation during the transient is not large enough to explain this. So, there must be (unsurprisingly) other parameters of importance; probably pressure gradient, but density may also be important. Variation in pre-hl electron profiles between cases was small, which helps to isolate the importance of v tor. The MPM often lasts for > 100 ms and should be fairly easy to detect in real time by a growing difference in fluctuation power in interferometer measurements by two vertical chords in the relevant frequency range. This is enough time for a control system to act to suppress the transient and ensure a soft H-L transition, or to increase power to avoid the transition, assuming more power is available. Applying the counter-injecting beams can reduce v tor sufficiently in 100 ms and the triangularity change takes 100 ms, which should be fast enough to soften a back transition. The confinement time is a few hundred ms and so increased power should start to reach the edge in time to prevent an undesired back transition. This could be useful, for example, in an experiment studying H-mode close to the power threshold. 438 VII. CONCLUSION The large initial transient observed in most H-L back transition sequences in our ex- periments is probably driven by the same mechanism as the small type-iii ELMs, as 20
21 both are synchronous with identical v p locking behavior of the MPM and a continuum of transient/type-iii ELM sizes appears to exist. The amplitude is very sensitive to edge toroidal rotation, which in turn may be controlled by adjusting torque inputs to the plasma. Activity associated with the dithering H-L transition sequence begins when ω E B > ω T in the experiments examined, showing that the early oscillatory behavior takes place when the shear suppression mechanism is still strong. Therefore, the large transients and first type-iii ELMs of soft transition sequences probably are not directly related to L-H/H-L transition physics, but rather, are responsible for relaxing the pedestal, which reduces the diamagnetic contribution to v E B and weakens the shear suppression mechanism, leading to the H-L transition proper. The modulating pedestal mode is a potential indicator of an impending H-L transition in a low powered H-mode, at least for this class of plasma discharge, and its lifetime is often long enough ( 100 ms) that a control system might have a realistic chance of acting to avoid an unintentional back transition. 454 VIII. ACKNOWLEDGMENT This material is based upon work supported by the U.S. Department of Energy, Office of Science, Office of Fusion Energy Sciences, using the DIII-D National Fusion Facility, a DOE Office of Science user facility, under Award DE-FG02-07ER54917, DE-FC02-04ER54698, DE-AC05-06OR23100, DE-FG02-89ER53296, DE-AC02-09CH DIII-D data shown in this paper can be obtained in digital format by following the links at DMP. 21
22 461 Appendix A: Shearing and Decorrelation Rate Calculations Shearing rate calculations The E B rotation frequency is fit to the form developed by Burrell et al. 31 and given by Eq. A1: 465 ω E = B + A in (1 + α in x in )e x in e x in e x in e x in x in = (ψ in ψ N )/w in, A out e x out (1 + α out x out )e x out e x out e x out x out = (ψ out ψ N )/w out (A1) where B, A in, A out, α in, α out, ψ in, ψ out, w in, w out are fit parameters. The result is then used to calculate ω E B as described in the text in equation 2. One of the vertical CER chords in the outer half of the E r well was unavailable during this experiment, so one point is missing in the poloidal flow v θ profile. However, toroidal flow v ϕ, temperature T, and density are still available, and v θ is very small and is not experiencing strong radial variation. Thus the v θ B ϕ term in Eq. 1 is about 10% of the v ϕ B θ term across most of the profile and roughly 10% as large as the peak in the diamagnetic term (p /Zen). Furthermore, radial variation in v θ is comparable to the uncertainty in the measurements. Rather than discard important and valid information about the other profiles, the missing point in v θ is interpolated from its nearest neighbors and assigned double uncertainty (compared to interpolating from its neighbors uncertainty). However, the term in question is so small that the extra uncertainty is difficult to discern when propagated into the final product Turbulence decorrelation rate calculations The time delayed cross correlation C(t delay ) is calculated for a pair of chords, producing the red curve labeled Correlation shown in Fig. 18(a). The Hilbert envelope y2 + H(y) 2, where H(y) is the Hilbert transform, of C(t delay ) is calculated (black curve above the red one) and the coordinates of the peak are recorded. The coordinates from the peak correlations of several chord pairs with different vertical separations are fit to C(t delay ) = C max Exp( t delay ω T ), as seen in Fig. 18(b). This procedure measures the plasma 22
23 FIG. 18. Method of calculating decorrelation rate ω T from BES data. (a) cross correlation function (red) between two vertically separated chord pairs with Hilbert envelope overlaid in black. The envelope peak is marked with a blue diamond and the peak envelope value and delay at this peak are measured by blue with arrows. (b) the peak from the left plot is plotted here along with similar measurements from other chord pairs; blue symbols with red labels. The point calculated from the left plot is marked with a diamond and coordinate label. The data are fit to C(t delay ) = C max Exp( t delay ω T ) (black curve) and ω T is recorded. Shot ms. Example uses BES column 6. For chord positions, see Fig frame decorrelation rate. Using the autocorrelation time (as could be calculated from the width of the envelope in Fig. 18(a)) gives the rate in the lab frame which is unsuitable because it includes spatial decorrelation as eddies are advected past the BES chords by E B drifts. 52 If this calculation is performed on the entire frequency range available from BES, a very low decorrelation rate is found due to the presence of the coherent MPM and its sidebands, which contribute significant power to the spectrum for 20 < f < 150 khz. As seen in section IV, the MPM is localized like a ballooning mode, implying its parallel correlation length is a fraction of the poloidal circumference of the plasma. But the calculation of ω E B is for flute like turbulence with very long parallel correlation length. So, the Hahm-Burrell model of shear suppression is not applicable to the MPM both because it is coherent rather than turbulent and also because its spatial correlation properties are ballooning-like rather than flute-like. Thus, the BES data are bandpass filtered to 150 f 450 khz before calculating ω T (f > 450 khz is noise) Appendix B: Calculating Peak Frequency and Wavenumber from Correlation Functions 501 In order to measure the frequency f, wavenumber k, and lab-frame propagation velocity 502 v p of the mode in question, Ĩ/I ñ/n was computed for each chord in a column. Time delay cross correlation functions were calculated for each unique chord pair, excluding correlations of chords with themselves. The result, C(t delay, Z), where t delay is the variable lag time 23
24 FIG. 19. Time delayed cross correlation functions from column 6 BES data (left) from an example time window centered around 2436ms in shot are shown with a fit to C max cos (2πft lag k Z) exp [ t lag /τ c ] exp [ Z/λ c ] (right). 505 and Z is the spatial separation of the chords, was fit to 506 C(t delay, Z) =C max cos (2πft delay k Z) Exp [ t delay /τ c ] Exp [ Z/λ c ] (B1) where C max is the peak cross correlation, τ c is the correlation time and λ c is the correlation length. The IDL MPFIT 53 implementation of the Levenberg-Marquardt algorithm for least squares minimization 54 was used. An example of this analysis is shown in figure 19. C max may differ from 1 as random noise will prevent two separate chords from agreeing perfectly, even at arbitrarily close spacing. The value of τ c obtained from the fit includes effects of decorrelation of the entire spectrum, not just the mode under investigation, as no frequency filtering was performed in this analysis. The correlation length λ c is much longer than the physical array of BES chords and is probably not measured accurately beyond the statement that λ c max( Z) = 9.6cm. Similarly, τ c is often much longer than the time window chosen. This analysis was repeated for many sequential overlapping time windows to build a time history of v p = 2πf/k and other quantities. The data were not frequency filtered before this analysis because the mode strongly dominates the fit in Eq. B1 and the frequency changes during the slowdown and the mode could escape the filtering window. A windowed Fourier transform was calculated and from this the mode amplitude at f was found at each time-slice. The result is qualitatively the same as averaging amplitude over a frequency range containing the mode and its sidebands, such as taking the average amplitude in 40 < f < 80 khz for each slice. The resulting histories are shown in Figs. 9 for a short time window just before the start of transition activity. Some of the BES chords experience clipping or saturation during the hard back transition transients, but as the purpose of this analysis is to track the motion of blobs, this should not be a serious problem as the photodiodes used by BES 55 do not appear to suffer long lasting systematic changes to their behavior after a saturation/clipping event (some light sensors do become nonlinear near saturation and also can draw enough current to heat themselves and change their gain with effects persisting after saturation has ended, but that 24
25 turns out not to be a concern in this case). Indeed, it is clear from Fig. 8 and videos of BES fast intensity vs. R-Z that the v p lock is not an artifact of clipping. Locking also occurs before the first type-iii ELM in soft H-L sequences and in these cases, clipping is uncommon (because the change in density is not as great), and still the behavior is the same. 535 Appendix C: Calculation of Local Wavenumber 536 Local wavenumber k ij may be calculated using the two point technique 56 : 537 G ij (f) = Fi F j ( ) Im(Gij ) ϕ ij (f) = atan Re(G ij ) k ij (f) = ϕ ij(f) Z i Z j (C1) 538 where F i is the complex conjugate of the Fourier transform of the normalized (ñ/n) signal from chord i, ϕ ij is the phase delay between chords i and j limited to π < ϕ < π, and G ij is the cross-power spectrum between the chords. This operation is repeated on all of the unique chord pairs in a column, excluding i = j. A dispersion diagram (Fig. 10) can be made from the histogram of k and f values, where the total power in each bin, rather than just the number of samples, is counted. While the method of fitting sinusoids to time delayed cross correlation functions was useful for identifying the characteristics of the dominant frequency component, this method reveals the behavior of k and v p at different frequencies. In general, BES is not equally sensitive to all wavenumbers and a spatial transfer function can be used to correct the k spectrum. However, the transfer function is essentially flat 38 for k z < 1cm 1, so no correction is needed when studying the MPM. 549 Appendix D: Coordinate Mapping Uncertainties in DIII-D Data from BES and TS are mapped to ψ N using a simple equilibrium reconstruction (JT EFIT). 39 However, this is not perfect due to uncertainties in the positions of diagnostic chords, errors in the reconstruction due to 3D error fields, and finite lifetime of the excitation state of injected neutral atoms. The data in Fig. 11 have been corrected for alignment issues as follows: The foot of the T e pedestal, as determined by a tanh fit, 21 is assumed to be at the separatrix and the Thomson profiles [Fig. 11(b-c)] are shifted outward by 2%ψ N to 25
26 enforce this. The BES data [Fig. 11(a)] are shifted outward as well on the basis that excited beam ions have a finite lifetime and the delay between excitation and emission translates to an inward shift in position. The magnitude of this shift is expected to be about 0.66 cm ( 3 ns lifetime 2.2 mm/ns for 50 kev beam energy), 38 which translates to about 2% in ψ N. Absolute error in the measurements of the BES array s position 37 could be 5mm (because of the way the chords are secured in a common mounting bracket 57, uncertainty in the relative positions between chords should be negligible). 563 REFERENCES D. Eldon, R. L. Boivin, R. J. Groebner, T. H. Osborne, P. B. Snyder, A. D. Turnbull, J. A. Boedo, K. H. Burrell, E. Kolemen, L. Schmitz, G. R. Tynan, and H. R. Wilson, Investigation of peeling-ballooning stability prior to transient outbursts accompanying transitions out of H-mode in DIII-D, Phys. Plasmas 22, (2015), DOI: / F. Wagner, G. Becker, K. Behringer, D. Campbell, A. Eberhagen, W. Engelhardt, G. Fussmann, O. Gehre, J. Gernhardt, G. v. Gierke, G. Haas, M. Huang, F. Karger, M. Keilhacker, O. Klüber, M. Kornherr, K. Lackner, G. Lisitano, G. G. Lister, H. M. Mayer, D. Meisel, E. R. Müller, H. Murmann, H. Niedermeyer, W. Poschenrieder, H. Rapp, H. Röhr, F. Schneider, G. Siller, E. Speth, A. Stäbler, K. H. Steuer, G. Venus, O. Vollmer, and Z. Yü, Regime of improved confinement and high beta in neutral-beamheated-divertor discharges of the ASDEX tokamak, Phys. Rev. Lett. 49, 1408 (1982), DOI: /PhysRevLett K. H. Burrell, Summary of experimental progress and suggestions for future work (H mode confinement), Plasma Phys. Control. Fusion 36, A291 (1994), DOI: / /36/7A/ L. Schmitz, L. Zeng, T. L. Rhodes, J. C. Hillesheim, E. J. Doyle, R. J. Groebner, W. A. Peebles, K. H. Burrell, and G. Wang, Role of zonal flow predator-prey oscillations in triggering the transition to H-Mode confinement, Phys. Rev. Lett. 108, (2012), DOI: /PhysRevLett L. Schmitz, L. Zeng, T. L. Rhodes, J. C. Hillesheim, W. A. Peebles, R. J. Groebner, K. H. Burrell, G. R. McKee, Z. Yan, G. R. Tynan, P. H. Diamond, J. A. Boedo, E. J. Doyle, B. A. Grierson, C. Chrystal, M. E. Austin, W. M. Solomon, and G. Wang, The role of zonal 26
27 flows and predator-prey oscillations in triggering the formation of edge and core transport barriers, Nucl. Fusion 54, (2014), DOI: / /54/7/ T. H. Osborne, J. R. Ferron, R. J. Groebner, L. L. Lao, A. W. Leonard, M. A. Mahdavi, R. Maingi, R. L. Miller, A. D. Turnbull, M. Wade, and J. Watkins, The effect of plasma shape on H-mode pedestal characteristics on DIII-D, Plasma Phys. Control. Fusion 42, A175 (2000), DOI: / /42/5A/ G. Federici, P. Andrew, P. Barabaschi, J. Brooks, R. Doerner, A. Geier, A. Herrmann, G. Janeschitz, K. Krieger, A. Kukushkin, A. Loarte, R. Neu, G. Saibene, M. Shimada, G. Strohmayer, and M. Sugihara, Key ITER plasma edge and plasma-material interaction issues, J. Nucl. Materials 313, 11 (2003), DOI: /S (02) A. Loarte, M. Sugihara, M. Shimada, A. Kukushkin, D. Campbell, M. Pick, C. Lowry, M. Merola, R. A. Pitts, V. Riccardo, G. Arnoux, W. Fundamenski, G. F. Matthews, S. Pinches, A. Kirk, E. Nardon, T. Eich, A. Herrmann, G. Pautasso, A. Kallenbach, G. Saibene, G. Federici, R. Sartori, G. Counsell, A. Portone, M. Cavinato, M. Lehnen, A. Huber, V. Philipps, D. Reiter, V. Kotov, R. Koslowski, G. Maddaluno, B. Lipschultz, D. Whyte, B. LaBombard, R. Granetz, A. W. Leonard, M. Fenstermacher, E. Hollman, P. C. Stangeby, M. Kobayashi, R. Albanese, G. Ambrosino, M. Ariola, G. de Tommasi, J. Gunn, M. Becoulet, L. Colas, M. Goniche, E. Faudot, and D. Milanesio, Power and particle fluxes at the plasma edge of ITER: Specifications and physics basis, Proceedings of the 22nd IAEA Fusion Energy Conference in Genevea (2008). 9 A. Loarte, G. Huijsmans, S. Futatani, L. R. Baylor, T. E. Evans, D. M. Orlov, O. Schmitz, M. Becoulet, P. Cahyna, Y. Gribov, A. Kavin, A. S. Naik, D. J. Campbell, T. Casper, E. Daly, H. Frerichs, A. Kischner, R. Laengner, S. Lisgo, R. A. Pitts, G. Saibene, and A. Wingen, Progress on the application of ELM control schemes to ITER scenarios from the non-active phase to DT operation, Nucl. Fusion 54, (2014), DOI: / /54/3/ P. B. Snyder, H. R. Wilson, J. R. Ferron, L. L. Lao, A. W. Leonard, T. H. Osborne, A. D. Turnbull, D. Mossessian, M. Murakami, and X. Q. Xu, Edge localized modes and the pedestal: A model based on coupled peeling-ballooning modes, Phys. Plasmas 9, 2037 (2002), DOI: / H. R. Wilson, P. B. Snyder, G. T. A. Huysmans, and R. L. Miller, Numerical studies of edge localized instabilities in tokamaks, Phys. Plasmas 9, 1277 (2002), 27
28 DOI: / A. Loarte, G. Saibene, R. Sartori, D. Campbell, M. Becoulet, L. Horton, T. Eich, A. Herrmann, G. Matthews, N. Asakura, A. Chankin, A. Leonard, G. Porter, G. Federici, G. Janeschitz, M. Shimada, and M. Sugihara, Characteristics of type I ELM energy and particle losses in existing devices and their extrapolation to ITER, Plasma Phys. Control. Fusion 45, 1549 (2003), DOI: / /45/9/ T. E. Evans, R. A. Moyer, J. G. Watkins, T. H. Osborne, P. R. Thomas, M. Becoulet, J. A. Boedo, E. J. Doyle, M. E. Fenstermacher, K. H. Finken, R. J. Groebner, M. Groth, J. H. Harris, G. L. Jackson, R. J. L. Haye, C. J. Lasnier, S. Masuzaki, N. Ohyabu, D. G. Pretty, H. Reimerdes, T. L. Rhodes, D. L. Rudakov, M. J. Schaffer, M. R. Wade, G. Wang, W. P. West, and L. Zeng, Suppression of large edge localized modes with edge resonant magnetic fields in high confinement DIII-D plasmas, Nucl. Fusion 45, 595 (2005), DOI: / /45/7/ E.-J. Kim and P. H. Diamond, Zonal flows and transient dynamics of the L-H transition, 632 Phys. Rev. Lett. 90, (2003), DOI: /PhysRevLett K. Miki, P. H. Diamond, Ö. D. Gürcan, G. R. Tynan, T. Estrada, L. Schmitz, and G. S. Xu, Spatio-temporal evolution of the L-I-H transition, Phys. Plasmas 20, (2012), DOI: / K. Miki, P. H. Diamond, L. Schmitz, D. C. McDonald, T. Estrada, Ö. D. Gürcan, and G. R. Tynan, Spatio-temporal evolution of the H-L back transition, Phys. Plasmas 20, (2013), DOI: / J. L. Luxon, A design retrospective of the DIII-D tokamak, Nucl. Fusion 42, 614 (2002), DOI: / /42/5/ D. N. Hill and the DIII-D Team, DIII-D research towards resolving key issues for ITER and steady-state tokamaks, Nucl. Fusion 53, (2013), DOI: / /53/10/ G. McKee, R. Ashley, R. Durst, R. Fonk, M. Jakubowski, K. Tritz, K. Burrell, C. Greenfield, and J. Robinson, The beam emission spectroscopy diagnostic on the DIII-D tokamak, Rev. Sci. Instrum. 70, 913 (1999), DOI: / K. H. Burrell, P. Gohil, R. J. Groebner, D. H. Kaplan, J. I. Robinson, and W. M. Solomon, Improved charge-coupled device detectors for high-speed, charge exchange spectrscopy studies on the DIII-D tokamak, Rev. Sci. Instrum. 75, 3455 (2004), 28
29 DOI: / R. J. Groebner, D. R. Baker, K. H. Burrell, T. N. Carlstrom, J. R. Ferron, P. Gohil, L. L. Lao, T. H. Osborne, D. M. Thomas, W. P. West, J. A. Boedo, R. A. Moyer, G. R. McKee, R. D. Deranian, E. J. Doyle, C. L. Rettig, T. L. Rhodes, and J. C. Rost, Progress in quantifying the edge physics of the H mode regime in DIII-D, Nucl. Fusion 41, 1789 (2001), DOI: / /41/12/ D. Eldon, B. D. Bray, T. M. Deterly, C. Liu, M. Watkins, R. J. Groebner, A. W. Leonard, T. H. Osborne, P. B. Snyder, R. L. Boivin, and G. R. Tynan, Initial results of the high resolution edge Thomson scattering upgrade at DIII-D, Rev. Sci. Instrum. 83, 10E343 (2012), DOI: / H. Biglari, P. H. Diamond, and P. W. Terry, Influence of sheared poloidal rotation on edge turbulence, Phys. Fluids. B 2, 1 (1990), DOI: / T. S. Hahm, Rotation shear induced fluctuation decorrelation in a toroidal plasma, Phys. Plasmas 1, 2940 (1994), DOI: / T. S. Hahm and K. H. Burrell, Flow shear induced fluctuation sppression in finite aspect ratio shaped tokamak plasma, Phys. Plasmas 2, 1648 (1995), DOI: / T. S. Hahm and K. H. Burrell, ExB flow shear effects on radial correlation length of turbulence and gyroradius scaling of confinement, Phys. Plasmas 3, 427 (1996), DOI: / K. H. Burrell, Effects of E B velocity shear and magnetic shear on turbulence and transport in magnetic confinement devices, Phys. Plasmas 4, 1499 (1997), DOI: / O. D. Gürcan, Effect of sheared flow on the growth rate and turbulence decorrelation, Phys. Rev. Lett. 109, (2012), DOI: /PhysRevLett G. R. Tynan, M. Xu, P. H. Diamond, J. A. Boedo, I. Cziegler, N. Fedorczak, P. Manz, K. Miki, S. Thakur, L. Schmitz, L. Zeng, E. Doyle, G. M. McKee, Z. Yan, G. S. Xu, B. N. Wan, H. Q. Wang, H. Y. Guo, J. Dong, K. Zhao, J. Cheng, W. Y. Hong, and L. W. Yan, Turbulent-driven low-frequency sheared E B flows as the trigger for the H-mode transition, Nucl. Fusion 53, (2013), DOI: / /53/7/ I. Cziegler, G. R. Tynan, P. H. Diamond, A. E. Hubbard, J. W. Hughes, J. Irby, and J. L. Terry, Zonal flow production in the L-H transition in Alcator C-Mod, Plasma Phys. Control. Fusion 56, (2014), DOI: / /56/7/
30 K. H. Burrell, Fitting function for characterization of the edge E r well in H-mode plasmas, manuscript in preparation (2015). 32 J. C. Hillesheim, W. A. Peebles, T. L. Rhodes, L. Schmitz, A. E. White, and T. A. Carter, New plasma measurements with a multichannel millimeter-wave fluctuation diagnostic system in the DIII-D tokamak, Rev. Sci. Instrum. 81, 10D907 (2010), DOI: / C. M. Muscatello, C. W. Domier, X. Hu, G. J. Kramer, N. C. Luhmann Jr., X. Ren, P. Riemenschneider, A. Spear, B. J. Tobias, E. Valeo, and L. Yu, Technical overview of the millimeter-wave imaging reflectometer on the DIII-D tokamak, Rev. Sci. Instrum. 85, 11D702 (2014), DOI: / M. A. Van Zeeland, R. L. Boivin, T. N. Carlstrom, T. Deterly, and D. K. Finkenthal, Fiber optic two-color vibration compensated interferometer for plasma density measurements, Rev. Sci. Instrum. 77, 10F325 (2006), DOI: / M. E. Austin and J. Lohr, Electron cyclotron emission radiometer upgrade on the DIII-D tokamak, Rev. Sci. Instrum. 74, 1457 (2003), DOI: / J. D. King, E. J. Strait, R. L. Boivin, D. Taussig, M. G. Watkins, J. M. Hanson, N. C. Logan, C. Paz-Soldan, D. C. Pace, D. Shiraki, M. J. Lanctot, R. J. La Haye, L. L. Lao, D. J. Battaglia, A. C. Sontag, S. R. Haskey, and J. G. Bak, An upgrade of the magnetic diagnostic system of the DIII-D tokamak for non-axisymmetric measurements, Rev. Sci. Instrum. 85, (2014), DOI: / W. M. Solomon, K. H. Burrell, P. Gohil, R. Groebner, and D. Kaplan, Cross-calibrating spatial positions of light-viewing diagnostics using plasma edge sweeps in DIII-D, Rev. Sci. Instrum. 74, 5084 (2003), DOI: / M. W. Shafer, R. J. Fonk, G. R. Mckee, and D. J. Schlossberg, Spatial transfer function for the beam emission spectroscopy diagnostic on DIII-D, Rev. Sci. Instrum. 77, 10F110 (2006), DOI: / L. L. Lao, H. S. John, R. D. Stambauh, A. G. Kellman, and W. Pfeiffer, Reconstruction of current profile parameters and plasma shapes in tokamaks, Nucl. Fusion 25, 1611 (1985), DOI: / /25/11/ G. Bateman and D. B. Nelson, Resistive-ballooning-mode equation, Phys. Rev. Lett. 41, 1804 (1978), DOI: /PhysRevLett
31 N. M. Ferraro, S. C. Jardin, and P. B. Snyder, Ideal and resistive edge stability calculations with M3D-C 1, Phys. Plasmas 17, (2010), DOI: / B. I. Cohen, M. V. Umansky, W. M. Nevins, M. A. Makowski, J. A. Boedo, D. L. Rudakov, G. R. McKee, Z. Yan, and R. J. Groebner, Simulations of drift resistive ballooning L- mode turbulence in the edge plasma of the DIII-D tokamak, Phys. Plasmas 20, (2013), DOI: / M. S. Chu and M. Okabayashi, Stabilization of the external kink and the resistive wall mode, Plasma Phys. Control. Fusion 52, (2010), DOI: / /52/12/ E. J. Strait, T. S. Taylor, A. D. Turnbull, J. R. Ferron, L. L. Lao, B. Rice, O. Sauter, S. J. Thomson, and D. Wróblewski, Wall stabilization of high beta tokamak discharges in DIII-D, Phys. Rev. Lett. 74, 2483 (1995), DOI: /PhysRevLett M. Okabayashi, J. Bialek, A. Bondeson, M. S. Chance, M. S. Chu, A. M. Garofalo, R. Hatcher, Y. In, G. L. Jackson, R. J. Jayakumar, T. H. Jensen, O. Katsuro-Hopkins, R. J. La Haye, Y. Q. Liu, G. A. Navratil, H. Reimerdes, J. T. Scoville, E. J. Strait, M. Takechi, A. D. Turnbull, P. Gohil, J. S. Kim, M. A. Makowski, J. Manickam, and J. Menard, Control of the resistive wall mode with internal coils in the DIII-D tokamak, Nucl. Fusion 45, 1715 (2005), DOI: / /45/12/ P. H. Rutherford, Nonlinear growth of the tearing mode, Phys. Fluids 16, 1903 (1973), DOI: / J. A. Wesson, Hydromagnetic stability of tokamaks, Nucl. Fusion 18, 87 (1978), DOI: / /18/1/ D. A. Humphreys, J. R. Ferron, R. J. La Haye, T. C. Luce, C. C. Petty, R. Prater, and A. S. Welander, Active control for stabilization of neoclassical tearing modes, Phys. Plasmas 13, (2006), DOI: / J. D. Huba, NRL Plasma Formulary (Naval Research Laboratory, Washington, D.C., 2009) pp. 19, B. D. Dudson, M. V. Umansky, X. Q. Xu, P. B. Snyder, and H. R. Wilson, BOUT++: a framework for parallel plasma fluid simulations, Comp. Phys. Comm. 9, 1467 (2009), DOI: /j.cpc A. D. Turnbull, L. L. Lao, T. H. Osborne, O. Sauter, E. J. Strait, T. S. Taylor, M. S. Chu, J. R. Ferron, C. M. Greenfield, A. W. Leonard, R. L. Miller, P. B. Snyder, H. R. 31
32 Wilson, and H. Zohm, Edge localized modes in DIII-D high performance discharges, Plasma Phys. Control. Fusion 45, 1845 (2003), DOI: / /45/10/ G. R. McKee, R. J. Fonk, D. K. Gupta, D. J. Schlossberg, M. W. Shafer, R. L. Boivin, and W. Solomon, Plasma turbulence imaging via beam emission spectroscopy in the core of the DIII-D tokamak, Plasma and Fusion Research 2, S1025 (2007), DOI: /pfr.2.S C. B. Markwardt, Non-linear least squares fitting in IDL with MPFIT, Astronomical Data Analysis Software and Systems XVIII ASP Conf. Ser. 411, 251 (2009). 54 D. W. Marquardt, An algorithm for least-squares estimation of nonlinear parameters, J. Soc. Ind. Appl. Math. 11, 431 (1963). 55 G. R. McKee, R. J. Fonck, D. K. Gupta, D. J. Schlossberg, M. W. Shafer, and R. L. Boivin, High sensitivity beam emission spectroscopy for core plasma turbulence imaging, Rev. Sci. Instrum. 77, 10F104 (2006), DOI: / J. M. Beall, Y. C. Kim, and E. J. Powers, Estimation of wavenumber and frequency spectra using fixed probe pairs, J. Appl. Phys. 53, 3933 (1982), DOI: / G. McKee, R. Ashley, R. Durst, R. Fonck, M. Jakubowski, K. Tritz, K. H. Burrell, C. M. Greenfield, and J. Robinson, Beam emission spectroscopy diagnostic on the DIII-D tokamak, presented at the 12th High Temperature Plasma Diagnostics Conference in Princeton, NJ (1998). 32
33 L H ELM-free Type-I ELMs Power Off ELM-free H L D α (norm) NBI (MW) W (MJ) n e,ped (10 19 /m 3 ) T e,ped (kev) P e (kpa/cm) Time (ms) (a) (b) (c) (d) (e) (f)
34 krad/s D α (AU) ω E B /ω T 4 2 ω E B (inner peak) ω E B smoothed ω peak ω E B (c) 3 2 n - e (10 19 /m 3 ) n 1 e,ped (10 19 /m 3 ) 0 p e,ped (kpa) 1.0 (d) Time (ms) (a) (b)
35 krad/s D α (AU) ω E B /ω T ω E B (inner peak) ω E B smoothed ω peak ω E B n - e (10 19 /m 3 ) n e,ped (10 19 /m 3 ) p e,ped (kpa) Time (ms) (a) (b) (c) (d)
36 BES Array, Shot at ms Z (m) H G F E D C B A R (m)
37

38
39 n ~ shot Time (ms)
40 Z (cm) Z (cm) Time ms besfu21 besfu29 besfu05 besfu13 besfu37 besfu45 besfu53 besfu61 besfu22 besfu30 besfu06 besfu14 besfu38 besfu46 besfu54 besfu62 n ~ /n (AU)
41 n ~ /n (AU) f (khz) k (m -1 ) (a) (b) (c) (d) v (km/s) D α (AU) (e) Time (ms)
42
Relating the L-H Power Threshold Scaling to Edge Turbulence Dynamics
 Relating the L-H Power Threshold Scaling to Edge Turbulence Dynamics Z. Yan 1, G.R. McKee 1, J.A. Boedo 2, D.L. Rudakov 2, P.H. Diamond 2, G. Tynan 2, R.J. Fonck 1, R.J. Groebner 3, T.H. Osborne 3, and
Transport Improvement Near Low Order Rational q Surfaces in DIII D
 Transport Improvement Near Low Order Rational q Surfaces in DIII D M.E. Austin 1 With K.H. Burrell 2, R.E. Waltz 2, K.W. Gentle 1, E.J. Doyle 8, P. Gohil 2, C.M. Greenfield 2, R.J. Groebner 2, W.W. Heidbrink
GA A27418 THE ROLE OF ZONAL FLOWS AND PREDATOR- PREY OSCILLATIONS IN THE FORMATION OF CORE AND EDGE TRANSPORT BARRIERS
 GA A27418 THE ROLE OF ZONAL FLOWS AND PREDATOR- PREY OSCILLATIONS IN THE FORMATION OF CORE AND EDGE TRANSPORT BARRIERS by L. SCHMITZ, L. ZENG, T.L. RHODES, J.C. HILLESHEIM, W.A. PEEBLES, R.J. GROEBNER,
Edge Rotational Shear Requirements for the Edge Harmonic Oscillation in DIII D Quiescent H mode Plasmas
 Edge Rotational Shear Requirements for the Edge Harmonic Oscillation in DIII D Quiescent H mode Plasmas by T.M. Wilks 1 with A. Garofalo 2, K.H. Burrell 2, Xi. Chen 2, P.H. Diamond 3, Z.B. Guo 3, X. Xu
Studies of H Mode Plasmas Produced Directly by Pellet Injection in DIII D
 Studies of H Mode Plasmas Produced Directly by Pellet Injection in by P. Gohil in collaboration with L.R. Baylor,* K.H. Burrell, T.C. Jernigan,* G.R. McKee, *Oak Ridge National Laboratory University of
GA A26565 LIMITS TO H-MODE PEDESTAL PRESSURE GRADIENT IN DIII-D
 GA A26565 LIMITS TO H-MODE PEDESTAL PRESSURE GRADIENT IN DIII-D by R.J. GROEBNER, P.B. SNYDER, T.H. OSBORNE, A.W. LEONARD, T.L. RHODES, L. ZENG, E.A. UNTERBERG, Z. YAN, G.R. McKEE, C.J. LASNIER, J.A. BOEDO,
ELMs and Constraints on the H-Mode Pedestal:
 ELMs and Constraints on the H-Mode Pedestal: A Model Based on Peeling-Ballooning Modes P.B. Snyder, 1 H.R. Wilson, 2 J.R. Ferron, 1 L.L. Lao, 1 A.W. Leonard, 1 D. Mossessian, 3 M. Murakami, 4 T.H. Osborne,
Particle transport results from collisionality scans and perturbative experiments on DIII-D
 1 EX/P3-26 Particle transport results from collisionality scans and perturbative experiments on DIII-D E.J. Doyle 1), L. Zeng 1), G.M. Staebler 2), T.E. Evans 2), T.C. Luce 2), G.R. McKee 3), S. Mordijck
Phase ramping and modulation of reflectometer signals
 4th Intl. Reflectometry Workshop - IRW4, Cadarache, March 22nd - 24th 1999 1 Phase ramping and modulation of reflectometer signals G.D.Conway, D.V.Bartlett, P.E.Stott JET Joint Undertaking, Abingdon, Oxon,
ELM Suppression in DIII-D Hybrid Plasmas Using n=3 Resonant Magnetic Perturbations
 1 EXC/P5-02 ELM Suppression in DIII-D Hybrid Plasmas Using n=3 Resonant Magnetic Perturbations B. Hudson 1, T.E. Evans 2, T.H. Osborne 2, C.C. Petty 2, and P.B. Snyder 2 1 Oak Ridge Institute for Science
Highlights from (3D) Modeling of Tokamak Disruptions
 Modeling of Tokamak Disruptions") Highlights from (3D) Modeling of Tokamak Disruptions Presented by V.A. Izzo With major contributions from S.E. Kruger, H.R. Strauss, R. Paccagnella, MHD Control Workshop 2010 Madison, WI ..onset of rapidly
Highlights from (3D) Modeling of Tokamak Disruptions Presented by V.A. Izzo With major contributions from S.E. Kruger, H.R. Strauss, R. Paccagnella, MHD Control Workshop 2010 Madison, WI ..onset of rapidly
Partially Coherent Fluctuations in Novel High Confinement Regimes of a Tokamak
 Partially Coherent Fluctuations in Novel High Confinement Regimes of a Tokamak István Cziegler UCSD, Center for Energy Research Center for Momentum Transport and Flow Organization Columbia Seminar Feb
Pedestal Stability and Transport on the Alcator C-Mod Tokamak: Experiments in Support of Developing Predictive Capability
 1 EX/P4-15 Pedestal Stability and Transport on the Alcator C-Mod Tokamak: Experiments in Support of Developing Predictive Capability J.W. Hughes 1, P.B. Snyder 2, X. Xu 3, J.R. Walk 1, E.M. Davis 1, R.M.
Observation of Reduced Core Electron Temperature Fluctuations and Intermediate Wavenumber Density Fluctuations in H- and QH-mode Plasmas
 Observation of Reduced Core Electron Temperature Fluctuations and Intermediate Wavenumber Density Fluctuations in H- and QH-mode Plasmas EX/P5-35 L. Schmitz 1), A.E. White 1), G. Wang 1), J.C. DeBoo 2),
DIAGNOSTICS FOR ADVANCED TOKAMAK RESEARCH
 DIAGNOSTICS FOR ADVANCED TOKAMAK RESEARCH by K.H. Burrell Presented at High Temperature Plasma Diagnostics 2 Conference Tucson, Arizona June 19 22, 2 134 /KHB/wj ROLE OF DIAGNOSTICS IN ADVANCED TOKAMAK
Multi-scale turbulence, electron transport, and Zonal Flows in DIII-D
 Multi-scale turbulence, electron transport, and Zonal Flows in DIII-D L. Schmitz1 with C. Holland2, T.L. Rhodes1, G. Wang1, J.C. Hillesheim1, A.E. White3, W. A. Peebles1, J. DeBoo4, G.R. McKee5, J. DeGrassie4,
MHD Analysis of the Tokamak Edge Pedestal in the Low Collisionality Regime Thoughts on the Physics of ELM-free QH and RMP Discharges
 MHD Analysis of the Tokamak Edge Pedestal in the Low Collisionality Regime Thoughts on the Physics of ELM-free QH and RMP Discharges P.B. Snyder 1 Contributions from: H.R. Wilson 2, D.P. Brennan 1, K.H.
Overview of Tokamak Rotation and Momentum Transport Phenomenology and Motivations
 Overview of Tokamak Rotation and Momentum Transport Phenomenology and Motivations Lecture by: P.H. Diamond Notes by: C.J. Lee March 19, 2014 Abstract Toroidal rotation is a key part of the design of ITER
Characteristics of the H-mode H and Extrapolation to ITER
 Characteristics of the H-mode H Pedestal and Extrapolation to ITER The H-mode Pedestal Study Group of the International Tokamak Physics Activity presented by T.Osborne 19th IAEA Fusion Energy Conference
Characterization of Edge Stability and Ohmic H-mode in the PEGASUS Toroidal Experiment
 Characterization of Edge Stability and Ohmic H-mode in the PEGASUS Toroidal Experiment M.W. Bongard, J.L. Barr, M.G. Burke, R.J. Fonck, E.T. Hinson, J.M. Perry, A.J. Redd, D.J. Schlossberg, K.E. Thome
Stationary, High Bootstrap Fraction Plasmas in DIII-D Without Inductive Current Control
 Stationary, High Bootstrap Fraction Plasmas in DIII-D Without Inductive Current Control P. A. Politzer, 1 A. W. Hyatt, 1 T. C. Luce, 1 F. W. Perkins, 4 R. Prater, 1 A. D. Turnbull, 1 D. P. Brennan, 5 J.
Direct drive by cyclotron heating can explain spontaneous rotation in tokamaks
 Direct drive by cyclotron heating can explain spontaneous rotation in tokamaks J. W. Van Dam and L.-J. Zheng Institute for Fusion Studies University of Texas at Austin 12th US-EU Transport Task Force Annual
OVERVIEW OF THE ALCATOR C-MOD PROGRAM. IAEA-FEC November, 2004 Alcator Team Presented by Martin Greenwald MIT Plasma Science & Fusion Center
 OVERVIEW OF THE ALCATOR C-MOD PROGRAM IAEA-FEC November, 2004 Alcator Team Presented by Martin Greenwald MIT Plasma Science & Fusion Center OUTLINE C-Mod is compact, high field, high density, high power
Observation of Neo-Classical Ion Pinch in the Electric Tokamak*
 1 EX/P6-29 Observation of Neo-Classical Ion Pinch in the Electric Tokamak* R. J. Taylor, T. A. Carter, J.-L. Gauvreau, P.-A. Gourdain, A. Grossman, D. J. LaFonteese, D. C. Pace, L. W. Schmitz, A. E. White,
Initial Investigations of H-mode Edge Dynamics in the PEGASUS Toroidal Experiment
 Initial Investigations of H-mode Edge Dynamics in the PEGASUS Toroidal Experiment M.W. Bongard, R.J. Fonck, K.E. Thome, D.S. Thompson 55 th Annual Meeting of the APS Division of Plasma Physics University
GA A22443 STUDY OF H MODE THRESHOLD CONDITIONS IN DIII D
 GA A443 STUDY OF H MODE THRESHOLD CONDITIONS IN DIII D by R.J. GROEBNER, T.N. CARLSTROM, K.H. BURRELL, S. CODA, E.J. DOYLE, P. GOHIL, K.W. KIM, Q. PENG, R. MAINGI, R.A. MOYER, C.L. RETTIG, T.L. RHODES,
Plasma Fusion Center Massachusetts Institute of Technology Cambridge, MA Burrell, K.H. General Atomics PO Box San Diego, CA
 PFC/JA-95-28 Edge Turbulence Measurements during the L- to H-Mode Transition by Phase Contrast Imaging on DIII-Dt Coda, S.; Porkolab, M.; Plasma Fusion Center Massachusetts Institute of Technology Cambridge,
RESISTIVE WALL MODE STABILIZATION RESEARCH ON DIII D STATUS AND RECENT RESULTS
 RESISTIVE WALL MODE STABILIZATION RESEARCH ON STATUS AND RECENT RESULTS by A.M. Garofalo1 in collaboration with J. Bialek,1 M.S. Chance,2 M.S. Chu,3 T.H. Jensen,3 L.C. Johnson,2 R.J. La Haye,3 G.A. Navratil,1
UCLA. Broadband Magnetic and Density Fluctuation Evolution Prior to First ELM in DIII-D Edge Pedestal. Presented by G. Wang a, In collaboration with
 Broadband Magnetic and Density Fluctuation Evolution Prior to First ELM in DIII-D Edge Pedestal Presented by G. Wang a, In collaboration with W.A. Peebles a, P.B. Snyder b, T.L. Rhodes a, E.J. Doyle a,
Reduced Electron Thermal Transport in Low Collisionality H-mode Plasmas in DIII-D and the Importance of Small-scale Turbulence
 1 Reduced Electron Thermal Transport in Low Collisionality H-mode Plasmas in DIII-D and the Importance of Small-scale Turbulence L. Schmitz, 1 C. Holland, 2 T.L. Rhodes, 1 G. Wang, 1 L. Zeng, 1 A.E. White,
GA A THERMAL ION ORBIT LOSS AND RADIAL ELECTRIC FIELD IN DIII-D by J.S. degrassie, J.A. BOEDO, B.A. GRIERSON, and R.J.
 GA A27822 THERMAL ION ORBIT LOSS AND RADIAL ELECTRIC FIELD IN DIII-D by J.S. degrassie, J.A. BOEDO, B.A. GRIERSON, and R.J. GROEBNER JUNE 2014 DISCLAIMER This report was prepared as an account of work
GA A27806 TURBULENCE BEHAVIOR AND TRANSPORT RESPONSE APPROACHING BURNING PLASMA RELEVANT PARAMETERS
 GA A27806 TURBULENCE BEHAVIOR AND TRANSPORT RESPONSE APPROACHING by G.R. McKEE, C. HOLLAND, Z. YAN, E.J. DOYLE, T.C. LUCE, A. MARINONI, C.C. PETTY, T.L. RHODES, L. SCHMITZ, W.M. SOLOMON, B.J. TOBIAS, G.
(Motivation) Reactor tokamaks have to run without disruptions
 Reactor tokamaks have to run without disruptions") Abstract A database has been developed to study the evolution, the nonlinear effects on equilibria, and the disruptivity of locked and quasi-stationary modes with poloidal and toroidal mode numbers m=2
Abstract A database has been developed to study the evolution, the nonlinear effects on equilibria, and the disruptivity of locked and quasi-stationary modes with poloidal and toroidal mode numbers m=2
Scaling of divertor heat flux profile widths in DIII-D
 1 Scaling of divertor heat flux profile widths in DIII-D C.J. Lasnier 1, M.A. Makowski 1, J.A. Boedo 2, N.H. Brooks 3, D.N. Hill 1, A.W. Leonard 3, and J.G. Watkins 4 e-mail:lasnier@llnl.gov 1 Lawrence
The EPED Pedestal Model: Extensions, Application to ELM-Suppressed Regimes, and ITER Predictions
 The EPED Pedestal Model: Extensions, Application to ELM-Suppressed Regimes, and ITER Predictions P.B. Snyder 1, T.H. Osborne 1, M.N.A. Beurskens 2, K.H. Burrell 1, R.J. Groebner 1, J.W. Hughes 3, R. Maingi
Study of B +1, B +4 and B +5 impurity poloidal rotation in Alcator C-Mod plasmas for 0.75 ρ 1.0.
 Study of B +1, B +4 and B +5 impurity poloidal rotation in Alcator C-Mod plasmas for 0.75 ρ 1.0. Igor Bespamyatnov, William Rowan, Ronald Bravenec, and Kenneth Gentle The University of Texas at Austin,
Possible Pedestal Transport Theory Models And Modeling Tests
 Possible Pedestal Transport Theory Models And Modeling Tests J.D. Callen, University of Wisconsin, Madison, WI 53706-1609 DIII-D Pedestal Transport Workshop, General Atomics, San Diego, CA, February 17,
STABILIZATION OF m=2/n=1 TEARING MODES BY ELECTRON CYCLOTRON CURRENT DRIVE IN THE DIII D TOKAMAK
 GA A24738 STABILIZATION OF m=2/n=1 TEARING MODES BY ELECTRON CYCLOTRON CURRENT DRIVE IN THE DIII D TOKAMAK by T.C. LUCE, C.C. PETTY, D.A. HUMPHREYS, R.J. LA HAYE, and R. PRATER JULY 24 DISCLAIMER This
Performance limits. Ben Dudson. 24 th February Department of Physics, University of York, Heslington, York YO10 5DD, UK
 Performance limits Ben Dudson Department of Physics, University of York, Heslington, York YO10 5DD, UK 24 th February 2014 Ben Dudson Magnetic Confinement Fusion (1 of 24) Previously... In the last few
Possible Experimental Tests of Pedestal Width/ Structure, Motivated by Theory/Modeling
 Possible Experimental Tests of Pedestal Width/ Structure, Motivated by Theory/Modeling R.J. Groebner PERSISTENT SURVEILLANCE FOR PIPELINE PROTECTION AND THREAT INTERDICTION Presented at DIII-D Pedestal
Resistive Wall Mode Control in DIII-D
 Resistive Wall Mode Control in DIII-D by Andrea M. Garofalo 1 for G.L. Jackson 2, R.J. La Haye 2, M. Okabayashi 3, H. Reimerdes 1, E.J. Strait 2, R.J. Groebner 2, Y. In 4, M.J. Lanctot 1, G.A. Navratil
Understanding Edge Harmonic Oscillation Physics Using NIMROD
 Understanding Edge Harmonic Oscillation Physics Using NIMROD J. King With contributions from S. Kruger & A. Pankin (Tech-X); K. Burrell, A. Garofalo, R. Groebner & P. Snyder (General Atomics) Work supported
GA A27805 EXPANDING THE PHYSICS BASIS OF THE BASELINE Q=10 SCENRAIO TOWARD ITER CONDITIONS
 GA A27805 EXPANDING THE PHYSICS BASIS OF THE BASELINE Q=10 SCENRAIO TOWARD ITER CONDITIONS by T.C. LUCE, G.L. JACKSON, T.W. PETRIE, R.I. PINSKER, W.M. SOLOMON, F. TURCO, N. COMMAUX, J.R. FERRON, A.M. GAROFALO,
The role of zonal flows and predator-prey oscillations in triggering
 The role of zonal flows and predator-prey oscillations in triggering the formation of edge and core transport barriers L. Schmitz, 1 L. Zeng, 1 T.L. Rhodes, 1 J.C. Hillesheim 2 W.A. Peebles, 1 R.J. Groebner,
TRANSPORT PROGRAM C-MOD 5 YEAR REVIEW MAY, 2003 PRESENTED BY MARTIN GREENWALD MIT PLASMA SCIENCE & FUSION CENTER
 TRANSPORT PROGRAM C-Mod C-MOD 5 YEAR REVIEW MAY, 2003 PRESENTED BY MARTIN GREENWALD MIT PLASMA SCIENCE & FUSION CENTER C-MOD - OPPORTUNITIES AND CHALLENGES Prediction and control are the ultimate goals
Pedestals and Fluctuations in C-Mod Enhanced D α H-modes
 Pedestals and Fluctuations in Enhanced D α H-modes Presented by A.E.Hubbard With Contributions from R.L. Boivin, B.A. Carreras 1, S. Gangadhara, R. Granetz, M. Greenwald, J. Hughes, I. Hutchinson, J. Irby,
Characterization and Forecasting of Unstable Resistive Wall Modes in NSTX and NSTX-U *
 1 EX/P4-34 Characterization and Forecasting of Unstable Resistive Wall Modes in NSTX and NSTX-U * J.W. Berkery 1, S.A. Sabbagh 1, Y.S. Park 1, R.E. Bell 2, S.P. Gerhardt 2, C.E. Myers 2 1 Department of
C-Mod Transport Program
 C-Mod Transport Program PAC 2006 Presented by Martin Greenwald MIT Plasma Science & Fusion Center 1/26/2006 Introduction Programmatic Focus Transport is a broad topic so where do we focus? Where C-Mod
Issues of Perpendicular Conductivity and Electric Fields in Fusion Devices
 Issues of Perpendicular Conductivity and Electric Fields in Fusion Devices Michael Tendler, Alfven Laboratory, Royal Institute of Technology, Stockholm, Sweden Plasma Turbulence Turbulence can be regarded
EFFECT OF EDGE NEUTRAL SOUCE PROFILE ON H-MODE PEDESTAL HEIGHT AND ELM SIZE
 EFFECT OF EDGE NEUTRAL SOUCE PROFILE ON H-MODE PEDESTAL HEIGHT AND ELM SIZE T.H. Osborne 1, P.B. Snyder 1, R.J. Groebner 1, A.W. Leonard 1, M.E. Fenstermacher 2, and the DIII-D Group 47 th Annual Meeting
Modeling of ELM Dynamics for ITER
 Modeling of ELM Dynamics for ITER A.Y. PANKIN 1, G. BATEMAN 1, D.P. BRENNAN 2, A.H. KRITZ 1, S. KRUGER 3, P.B. SNYDER 4 and the NIMROD team 1 Lehigh University, 16 Memorial Drive East, Bethlehem, PA 18015
On the physics of shear flows in 3D geometry
 On the physics of shear flows in 3D geometry C. Hidalgo and M.A. Pedrosa Laboratorio Nacional de Fusión, EURATOM-CIEMAT, Madrid, Spain Recent experiments have shown the importance of multi-scale (long-range)
Blob sizes and velocities in the Alcator C-Mod scrapeoff
 P1-59 Blob sizes and velocities in the Alcator C-Mod scrapeoff layer R. Kube a,b,*, O. E. Garcia a,b, B. LaBombard b, J. L. Terry b, S. J. Zweben c a Department of Physics and Technology, University of
GA A23114 DEPENDENCE OF HEAT AND PARTICLE TRANSPORT ON THE RATIO OF THE ION AND ELECTRON TEMPERATURES
 GA A311 DEPENDENCE OF HEAT AND PARTICLE TRANSPORT ON THE RATIO OF THE ION AND ELECTRON TEMPERATURES by C.C. PETTY, M.R. WADE, J.E. KINSEY, R.J. GROEBNER, T.C. LUCE, and G.M. STAEBLER AUGUST 1999 This report
GA A27948 FIRST DIRECT EVIDENCE OF TURBULENCE-DRIVEN ION FLOW TRIGGERING THE L- TO H-MODE TRANSITION
 GA A27948 FIRST DIRECT EVIDENCE OF TURBULENCE-DRIVEN ION FLOW TRIGGERING THE L- TO H-MODE TRANSITION By L. SCHMITZ, B.A. GRIERSON, L. ZENG, J.A. BOEDO, T.L. RHODES, Z. YAN, G.R. McKEE, P. GOHIL, D. ELDON,
Edge Impurity Dynamics During an ELM Cycle in DIII D
 Edge Impurity Dynamics During an ELM Cycle in by M.R. Wade 1 in collaboration with K.H. Burrell, A.W. Leonard, T.H. Osborne, P.B. Snyder, J.T. Hogan, 1 and D. Coster 3 1 Oak Ridge National Laboratory General
Triggering Mechanisms for Transport Barriers
 Triggering Mechanisms for Transport Barriers O. Dumbrajs, J. Heikkinen 1, S. Karttunen 1, T. Kiviniemi, T. Kurki-Suonio, M. Mantsinen, K. Rantamäki 1, S. Saarelma, R. Salomaa, S. Sipilä, T. Tala 1 Euratom-TEKES
GA A27857 IMPACT OF PLASMA RESPONSE ON RMP ELM SUPPRESSION IN DIII-D
 GA A27857 IMPACT OF PLASMA RESPONSE ON RMP ELM SUPPRESSION IN DIII-D by A. WINGEN, N.M. FERRARO, M.W. SHAFER, E.A. UNTERBERG, T.E. EVANS, D.L. HILLIS, and P.B. SNYDER JULY 2014 DISCLAIMER This report was
Analysis and modelling of MHD instabilities in DIII-D plasmas for the ITER mission
 Analysis and modelling of MHD instabilities in DIII-D plasmas for the ITER mission by F. Turco 1 with J.M. Hanson 1, A.D. Turnbull 2, G.A. Navratil 1, C. Paz-Soldan 2, F. Carpanese 3, C.C. Petty 2, T.C.
GA A22993 EFFECTS OF PLASMA SHAPE AND PROFILES ON EDGE STABILITY IN DIII D
 GA A22993 EFFECTS OF PLASMA SHAPE AND PROFILES ON EDGE by L.L. LAO, V.S. CHAN, L. CHEN, E.J. DOYLE, J.R. FERRON, R.J. GROEBNER, G.L. JACKSON, R.J. LA HAYE, E.A. LAZARUS, G.R. McKEE, R.L. MILLER, M. MURAKAMI,
Formation and Long Term Evolution of an Externally Driven Magnetic Island in Rotating Plasmas )
") Formation and Long Term Evolution of an Externally Driven Magnetic Island in Rotating Plasmas ) Yasutomo ISHII and Andrei SMOLYAKOV 1) Japan Atomic Energy Agency, Ibaraki 311-0102, Japan 1) University
Formation and Long Term Evolution of an Externally Driven Magnetic Island in Rotating Plasmas ) Yasutomo ISHII and Andrei SMOLYAKOV 1) Japan Atomic Energy Agency, Ibaraki 311-0102, Japan 1) University
Spatial, temporal and spectral structure of the turbulence-flow interaction at the L-H transition
 Spatial, temporal and spectral structure of the turbulence-flow interaction at the L-H transition T Estrada 1, E. Ascasíbar 1, E. Blanco 1, A. Cappa 1, P. H. Diamond 2, T. Happel 3, C. Hidalgo 1, M. Liniers
STATIONARY, HIGH BOOTSTRAP FRACTION PLASMAS IN DIII-D WITHOUT INDUCTIVE CURRENT CONTROL
 th IAEA Fusion Energy Conference Vilamoura, Portugal, to 6 November IAEA-CN-6/EX/P-7 STATIONARY, HIGH BOOTSTRAP FRACTION PLASMAS IN DIII-D WITHOUT INDUCTIVE CURRENT CONTROL P.A. POLITZER, A.W. HYATT, T.C.
RWM FEEDBACK STABILIZATION IN DIII D: EXPERIMENT-THEORY COMPARISONS AND IMPLICATIONS FOR ITER
 GA A24759 RWM FEEDBACK STABILIZATION IN DIII D: EXPERIMENT-THEORY COMPARISONS AND IMPLICATIONS FOR ITER by A.M. GAROFALO, J. BIALEK, M.S. CHANCE, M.S. CHU, D.H. EDGELL, G.L. JACKSON, T.H. JENSEN, R.J.
The Effects of Noise and Time Delay on RWM Feedback System Performance
 The Effects of Noise and Time Delay on RWM Feedback System Performance O. Katsuro-Hopkins, J. Bialek, G. Navratil (Department of Applied Physics and Applied Mathematics, Columbia University, New York,
Non-inductive plasma startup and current profile modification in Pegasus spherical torus discharges
 Non-inductive plasma startup and current profile modification in Pegasus spherical torus discharges Aaron J. Redd for the Pegasus Team 2008 Innovative Confinement Concepts Workshop Reno, Nevada June 24-27,
Connections between Particle Transport and Turbulence Structures in the Edge and SOL of Alcator C-Mod
 Connections between Particle Transport and Turbulence Structures in the Edge and SOL of Alcator C-Mod I. Cziegler J.L. Terry, B. LaBombard, J.W. Hughes MIT - Plasma Science and Fusion Center th 19 Plasma
First Observation of ELM Suppression by Magnetic Perturbations in ASDEX Upgrade and Comparison to DIII-D Matched-Shape Plasmas
 1 PD/1-1 First Observation of ELM Suppression by Magnetic Perturbations in ASDEX Upgrade and Comparison to DIII-D Matched-Shape Plasmas R. Nazikian 1, W. Suttrop 2, A. Kirk 3, M. Cavedon 2, T.E. Evans
- Effect of Stochastic Field and Resonant Magnetic Perturbation on Global MHD Fluctuation -
 15TH WORKSHOP ON MHD STABILITY CONTROL: "US-Japan Workshop on 3D Magnetic Field Effects in MHD Control" U. Wisconsin, Madison, Nov 15-17, 17, 2010 LHD experiments relevant to Tokamak MHD control - Effect
Characterization of neo-classical tearing modes in high-performance I- mode plasmas with ICRF mode conversion flow drive on Alcator C-Mod
 1 EX/P4-22 Characterization of neo-classical tearing modes in high-performance I- mode plasmas with ICRF mode conversion flow drive on Alcator C-Mod Y. Lin, R.S. Granetz, A.E. Hubbard, M.L. Reinke, J.E.
Influence of Beta, Shape and Rotation on the H-mode Pedestal Height
 Influence of Beta, Shape and Rotation on the H-mode Pedestal Height by A.W. Leonard with R.J. Groebner, T.H. Osborne, and P.B. Snyder Presented at Forty-Ninth APS Meeting of the Division of Plasma Physics
Predicting the Rotation Profile in ITER
 Predicting the Rotation Profile in ITER by C. Chrystal1 in collaboration with B. A. Grierson2, S. R. Haskey2, A. C. Sontag3, M. W. Shafer3, F. M. Poli2, and J. S. degrassie1 1General Atomics 2Princeton
PREDICTIVE MODELING OF PLASMA HALO EVOLUTION IN POST-THERMAL QUENCH DISRUPTING PLASMAS
 GA A25488 PREDICTIVE MODELING OF PLASMA HALO EVOLUTION IN POST-THERMAL QUENCH DISRUPTING PLASMAS by D.A. HUMPHREYS, D.G. WHYTE, M. BAKHTIARI, R.D. DERANIAN, E.M. HOLLMANN, A.W. HYATT, T.C. JERNIGAN, A.G.
Reduction of Neoclassical Transport and Observation of a Fast Electron Driven Instability with Quasisymmetry in HSX
 1 Reduction of Neoclassical Transport and Observation of a Fast Electron Driven Instability with Quasisymmetry in HSX J.M. Canik 1), D.L. Brower 2), C. Deng 2), D.T. Anderson 1), F.S.B. Anderson 1), A.F.
GA A27437 SCALING OF THE DIVERTOR HEAT FLUX WIDTH IN THE DIII-D TOKAMAK
 GA A27437 SCALING OF THE DIVERTOR HEAT FLUX WIDTH IN THE DIII-D TOKAMAK by M.A. MAKOWSKI, A.W. LEONARD, J.D. ELDER, C.J. LASNIER, J. NICHOLS, T.H. OSBORNE, P.C. STANGEBY and J.G. WATKINS OCTOBER 2012 DISCLAIMER
GA A27433 THE EPED PEDESTAL MODEL: EXTENSIONS, APPLICATION TO ELM-SUPPRESSED REGIMES, AND ITER PREDICTIONS
 GA A27433 THE EPED PEDESTAL MODEL: EXTENSIONS, APPLICATION TO ELM-SUPPRESSED REGIMES, AND ITER PREDICTIONS by P.B. SNYDER, T.H. OSBORNE, M.N.A. BEURSKENS, K.H. BURRELL, R.J. GROEBNER, J.W. HUGHES, R. MAINGI,
GA A27933 TURBULENCE BEHAVIOR AND TRANSPORT RESPONSE APPROACHING BURNING PLASMA RELEVANT PARAMETERS
 GA A27933 TURBULENCE BEHAVIOR AND TRANSPORT RESPONSE APPROACHING by G.R. McKEE, C. HOLLAND, Z. YAN, E.J. DOYLE, T.C. LUCE, A. MARINONI, C.C. PETTY, T.L. RHODES, J.C. ROST, L. SCHMITZ, W.M. SOLOMON, B.J.
HIGH PERFORMANCE EXPERIMENTS IN JT-60U REVERSED SHEAR DISCHARGES
 HIGH PERFORMANCE EXPERIMENTS IN JT-U REVERSED SHEAR DISCHARGES IAEA-CN-9/EX/ T. FUJITA, Y. KAMADA, S. ISHIDA, Y. NEYATANI, T. OIKAWA, S. IDE, S. TAKEJI, Y. KOIDE, A. ISAYAMA, T. FUKUDA, T. HATAE, Y. ISHII,
GA A26887 ADVANCES TOWARD QH-MODE VIABILITY FOR ELM-FREE OPERATION IN ITER
 GA A26887 ADVANCES TOWARD QH-MODE VIABILITY FOR ELM-FREE OPERATION IN ITER by A.M. GAROFALO, K.H. BURRELL, M.J. LANCTOT, H. REIMERDES, W.M. SOLOMON and L. SCHMITZ OCTOBER 2010 DISCLAIMER This report was
EFFECT OF PLASMA FLOWS ON TURBULENT TRANSPORT AND MHD STABILITY*
 EFFECT OF PLASMA FLOWS ON TURBULENT TRANSPORT AND MHD STABILITY* by K.H. BURRELL Presented at the Transport Task Force Meeting Annapolis, Maryland April 3 6, 22 *Work supported by U.S. Department of Energy
Plasma Science and Fusion Center
 Plasma Science and Fusion Center Turbulence and transport studies in ALCATOR C Mod using Phase Contrast Imaging (PCI) Diagnos@cs and Comparison with TRANSP and Nonlinear Global GYRO Miklos Porkolab (in
Excitation of Alfvén eigenmodes with sub-alfvénic neutral beam ions in JET and DIII-D plasmas
 Excitation of Alfvén eigenmodes with sub-alfvénic neutral beam ions in JET and DIII-D plasmas D. Borba 1,9, R. Nazikian 2, B. Alper 3, H.L. Berk 4, A. Boboc 3, R.V. Budny 2, K.H. Burrell 5, M. De Baar
Derivation of dynamo current drive in a closed current volume and stable current sustainment in the HIT SI experiment
 Derivation of dynamo current drive and stable current sustainment in the HIT SI experiment 1 Derivation of dynamo current drive in a closed current volume and stable current sustainment in the HIT SI experiment
Dependence of Achievable β N on Discharge Shape and Edge Safety Factor in DIII D Steady-State Scenario Discharges
 Dependence of Achievable β N on Discharge Shape and Edge Safety Factor in DIII D Steady-State Scenario Discharges by J.R. Ferron with T.C. Luce, P.A. Politzer, R. Jayakumar, * and M.R. Wade *Lawrence Livermore
Size Scaling and Nondiffusive Features of Electron Heat Transport in Multi-Scale Turbulence
 Size Scaling and Nondiffusive Features of Electron Heat Transport in Multi-Scale Turbulence Z. Lin 1, Y. Xiao 1, W. J. Deng 1, I. Holod 1, C. Kamath, S. Klasky 3, Z. X. Wang 1, and H. S. Zhang 4,1 1 University
Overview of edge modeling efforts for advanced divertor configurations in NSTX-U with magnetic perturbation fields
 Overview of edge modeling efforts for advanced divertor configurations in NSTX-U with magnetic perturbation fields H. Frerichs, O. Schmitz, I. Waters, G. P. Canal, T. E. Evans, Y. Feng and V. Soukhanovskii
GA A25229 FINAL REPORT ON THE OFES ELM MILESTONE FOR FY05
 GA A25229 ELM MILESTONE FOR FY05 by D.P. BRENNAN, E.D. HELD, S.E. KRUGER, A.Y. PANKIN, D.D. SCHNACK, AND C.R. SOVINEC APRIL 2006 DISCLAIMER This report was prepared as an account of work sponsored by an
Effect of Resonant and Non-resonant Magnetic Braking on Error Field Tolerance in High Beta Plasmas
 1 EX/5-3Ra Effect of Resonant and Non-resonant Magnetic Braking on Error Field Tolerance in High Beta Plasmas H. Reimerdes 1), A.M. Garofalo 2), E.J. Strait 2), R.J. Buttery 3), M.S. Chu 2), Y. In 4),
GA A25592 STABILITY AND DYNAMICS OF THE EDGE PEDESTAL IN THE LOW COLLISIONALITY REGIME: PHYSICS MECHANISMS FOR STEADY-STATE ELM-FREE OPERATION
 GA A25592 STABILITY AND DYNAMICS OF THE EDGE PEDESTAL IN THE LOW COLLISIONALITY REGIME: PHYSICS MECHANISMS FOR STEADY-STATE ELM-FREE OPERATION by P.B. SNYDER, K.H. BURRELL, H.R. WILSON, M.S. CHU, M.E.
C-Mod Core Transport Program. Presented by Martin Greenwald C-Mod PAC Feb. 6-8, 2008 MIT Plasma Science & Fusion Center
 C-Mod Core Transport Program Presented by Martin Greenwald C-Mod PAC Feb. 6-8, 2008 MIT Plasma Science & Fusion Center Practical Motivations for Transport Research Overall plasma behavior must be robustly
Turbulence and flow in the Large Plasma Device
 Turbulence and flow in the Large Plasma Device D.A. Schaffner, T.A. Carter, P. Popovich, B. Friedman Dept of Physics, UCLA Gyrokinetics in Laboratory and Astrophysical Plasmas Isaac Newton Institute of
Experimental test of the neoclassical theory of poloidal rotation
 Experimental test of the neoclassical theory of poloidal rotation Presented by Wayne Solomon with contributions from K.H. Burrell, R. Andre, L.R. Baylor, R. Budny, P. Gohil, R.J. Groebner, C.T. Holcomb,
Current Drive Experiments in the HIT-II Spherical Tokamak
 Current Drive Experiments in the HIT-II Spherical Tokamak T. R. Jarboe, P. Gu, V. A. Izzo, P. E. Jewell, K. J. McCollam, B. A. Nelson, R. Raman, A. J. Redd, P. E. Sieck, and R. J. Smith, Aerospace & Energetics
Role of Low-Order Rational Surfaces in Transport Barrier Formation on the Large Helical Device
 Role of Low-Order Rational Surfaces in Transport Barrier Formation on the Large Helical Device K. Toi, F. Watanabe a, K. Tanaka, T. Tokuzawa, K. Ogawa b, M. Isobe, M. Osakabe, Y. Suzuki, T. Akiyama, K.
Results From Initial Snowflake Divertor Physics Studies on DIII-D
 Results From Initial Snowflake Divertor Physics Studies on DIII-D S. L. Allen, V. A. Soukhanovskii, T.H. Osborne, E. Kolemen, J. Boedo, N. Brooks, M. Fenstermacher, R. Groebner, D. N. Hill, A. Hyatt, C.
TARGET PLATE CONDITIONS DURING STOCHASTIC BOUNDARY OPERATION ON DIII D
 GA A25445 TARGET PLATE CONDITIONS DURING STOCHASTIC BOUNDARY OPERATION ON DIII D by J.G. WATKINS, T.E. EVANS, C.J. LASNIER, R.A. MOYER, and D.L. RUDAKOV JUNE 2006 QTYUIOP DISCLAIMER This report was prepared
A Simulation Model for Drift Resistive Ballooning Turbulence Examining the Influence of Self-consistent Zonal Flows *
 A Simulation Model for Drift Resistive Ballooning Turbulence Examining the Influence of Self-consistent Zonal Flows * Bruce I. Cohen, Maxim V. Umansky, Ilon Joseph Lawrence Livermore National Laboratory
Progress of Confinement Physics Study in Compact Helical System
 1st IAEA Fusion Energy Conference Chengdu, China, 16-1 October, 6 IAEA-CN-149/ EX/5-5Rb Progress of Confinement Physics Study in Compact Helical System S. Okamura et al. NIFS-839 Oct. 6 1 EX/5-5Rb Progress
QTYUIOP LOCAL ANALYSIS OF CONFINEMENT AND TRANSPORT IN NEUTRAL BEAM HEATED DIII D DISCHARGES WITH NEGATIVE MAGNETIC SHEAR D.P. SCHISSEL.
 LOCAL ANALYSIS OF CONFINEMENT AND TRANSPORT IN NEUTRAL BEAM HEATED DIII D DISCHARGES WITH NEGATIVE MAGNETIC SHEAR Presented by D.P. SCHISSEL for the DIII D Team* Presented to 16th IAEA Fusion Conference
W.M. Solomon 1. Presented at the 54th Annual Meeting of the APS Division of Plasma Physics Providence, RI October 29-November 2, 2012
 Impact of Torque and Rotation in High Fusion Performance Plasmas by W.M. Solomon 1 K.H. Burrell 2, R.J. Buttery 2, J.S.deGrassie 2, E.J. Doyle 3, A.M. Garofalo 2, G.L. Jackson 2, T.C. Luce 2, C.C. Petty