STUDY OF THE UTILIZATION AND BENEFITS OF PHASOR MEASUREMENT UNITS FOR LARGE SCALE POWER SYSTEM STATE ESTIMATION. A Thesis YEO JUN YOON
|
|
|
- Candace Hensley
- 5 years ago
- Views:
Transcription
1 STUDY OF THE UTILIZATION AND BENEFITS OF PHASOR MEASUREMENT UNITS FOR LARGE SCALE POWER SYSTEM STATE ESTIMATION A Thesis by YEO JUN YOON Submitted to the Office of Graduate Studies of Texas A&M University in partial fulfillment of the requirements for the degree of MASTER OF SCIENCE December 2005 Major Subject: Electrical Engineering
2 STUDY OF THE UTILIZATION AND BENEFITS OF PHASOR MEASUREMENT UNITS FOR LARGE SCALE POWER SYSTEM STATE ESTIMATION A Thesis by YEO JUN YOON Submitted to the Office of Graduate Studies of Texas A&M University in partial fulfillment of the requirements for the degree of MASTER OF SCIENCE Approved by: Chair of Committee, Committee Members, Head of Department, Ali Abur Chanan Singh Laszlo Kish Steven D. Taliaferro Chanan Singh December 2005 Major Subject: Electrical Engineering
3 iii ABSTRACT Study of the Utilization and Benefits of Phasor Measurement Units for Large Scale Power System State Estimation. (December 2005) Yeo Jun Yoon, B.S., Korea University, South Korea Chair of Advisory Committee: Dr. Ali Abur This thesis will investigate the impact of the use of the Phasor Measurement Units (PMU) on the state estimation problem. First, incorporation of the PMU measurements in a conventional state estimation program will be discussed. Then, the effect of adding PMU measurements on the state estimation solution accuracy will be studied. Bad data processing in the presence of PMU measurements will also be presented. Finally, a multiarea state estimation method will be developed. This method involves a two level estimation scheme, where the first level estimation is carried out by each area independently. The second level estimation is required in order to coordinate the solutions obtained by each area and also to detect and identify errors in the boundary measurements. The first objective of this thesis is to formulate the full weighted least square state estimation method using PMUs. The second objective is to derive the linear formulation of the state estimation problem when using only PMUs. The final objective is to formulate a two level multi-area state estimation scheme and illlustrate its performance via simulation examples.
4 iv ACKNOWLEDGMENTS First and foremost, I would like to express my deepest gratitude to Dr. Ali Abur for his guidance and encouragement. He has been a source of inspiration, throughout my graduate studies at Texas A&M University. I would like to thank my committee members, Dr. Chanan Singh, Dr. Laszlo Kish and Dr. Steven D. Taliaferro, for their help. I would also like to acknowlege my professors at Texas A&M University from whom I have learned so much. The work described in this thesis was sponsored by the Power Systems Engineering Research Center (PSERC). I also express my appreciation for the support provided by PSERC. Finally, I would like to express my love and gratitude to my girl friend, Ara Cho, and my parents for their endless support and encouragement.
5 v TABLE OF CONTENTS Page ABSTRACT. iii ACKNOWLEDGMENTS... iv TABLE OF CONTENTS.. v LIST OF FIGURES... vii LIST OF TABLES... ix CHAPTER I II III INTRODUCTION Modern Power System Operations Multi-Area State Estimation Using PMUs Thesis Contributions Organization of This Thesis... 3 FULL WEIGHTED LEAST SQUARE STATE ESTIMATION Introduction WLS State Estimation Algorithm Measurement and Component Modeling State Estimation Algorithm with PMUs Observability and Bad Data Detection LINEAR FORMULATION OF STATE ESTIMATION USING ONLY PMUS Introduction Linear State Estimation Algorithm Simulation Results Bad Data Processing IV BENEFITS OF USING PMUS V 4.1 Improved Accuracy of Variables with PMUs Simulation Results MULTI-AREA STATE ESTIMATION Current Method of Multi-Area State Estimation Proposed Method for Multi-Area State Estimation Simulation Example of IEEE14 Bus System Simulation Example of IEEE118 Bus System
6 vi CHAPTER Page VI CONCLUSIONS AND FUTURE WORK Conclusions Future Work REFERENCES VITA
7 vii LIST OF FIGURES FIGURE Page 1 Flow-Chart for the WLS State Estimation Algorithm Equivalent π Model of Two Bus System Single PMU Measurement Model Transmission Line Model Tranmission Line Model with Rectangular Form Two Bus System with Measurements IEEE14 Bus System with PMU Locations IEEE30 Bus System with PMU Locations IEEE57 Bus System with PMU Locations IEEE118 Bus System with PMU Locations Imposed Bad Data at C(37,40) from to 0 in IEEE118 Bus System Three Bus System with Measurement Data IEEE14 Bus System Diagram with Conventional Measurements IEEE30 Bus System Diagram with Conventional Measurements IEEE57 Bus System Diagram with Conventional Measurements IEEE118 Bus System Diagram with Conventional Measurements Accuracy of V of IEEE14 Bus System with PMUs Accuracy of V of IEEE30 Bus System with PMUs Accuracy of V of IEEE57 Bus System with PMUs Accuracy of V of IEEE118 Bus System with PMUs
8 viii FIGURE Page 21 Voltage Angle Accuracy of IEEE14 Bus System with PMUs Voltage Angle Accuracy of IEEE30 Bus System with PMUs Voltage Angle Accuracy of IEEE57 Bus System with PMUs Voltage Angle Accuracy of IEEE118 Bus System with PMUs Average V Standard Deviation of IEEE14 Bus System Average V Standard Deviation of IEEE30 Bus System Average V Standard Deviation of IEEE57 Bus System Average V Standard Deviation of IEEE118 Bus System Average Voltage Angle Standard Deviation of IEEE14 Bus System Average Voltage Angle Standard Deviation of IEEE30 Bus System Average Voltage Angle Standard Deviation of IEEE57 Bus System Average Voltage Angle Standard Deviation of IEEE118 Bus System Diagram and Measurement Placement of Integrated System Diagram and Measurement Placement of Area Diagram and Measurement Placement of Area Second Level Estimation with Boundary Buses Diagram of IEEE14 Bus System with Bad Data Diagram and PMU Placement of IEEE118 Bus System Diagram of Area 3 and Area 6 with Bad Data.. 57
9 ix LIST OF TABLES TABLE Page 1 PMU Locations for Each IEEE System Linear Formulation Simulation Results of Several IEEE Bus Systems Objective Function Value with Bad Data at C(37,40) Sorted Normalized Residual Test Results with Bad Data Objective Function Value with No Bad Data Sorted Normalized Residual Test Results with No Bad Data Measurement Type, Value and Error Standard Deviation Variances and Standard Deviations of the Variables of Three Bus System Six Different Cases by Adding PMUs Variable Numbers and Measurement Type and Numbers Standard Deviations of the Measurements for the Test Average Error Standard Deviations of the Estimated Variables Various Measurement Types with PMU Type, Number, and Error S.D. for Different Estimation Levels Estimation Results of IEEE14 Bus System State Estimation Results of Area 2 with Bad Data Sorted Normalized Residuals of Area 2 Estimation State Estimation Results of the Second Level with Bad Data Sorted Normalized Residuals of the Second Level Estimation Number of Bus Types and PMUs for Different Estimation Levels
10 x TABLE Page 21 Type, Number, and Error Standard Deviation for Different Levels State Estimation Results of IEEE118 Bus System State Estimation Results of Area 3 with Bad Data Sorted Normalized Residuals of Area 3 Estimation State Estimation Results of the Second Level with Bad Data Sorted Normalized Residuals of the Second Level Estimation
11 1 CHAPTER I INTRODUCTION 1.1 Modern Power System Operations Over the twenty years, electric power industry in many countries has been undergoing fundamental changes due to the process of deregulation [1]-[4]. The belief is that competitive markets will lead to more efficient power generation, more technological innovations, and eventually to lower retail prices. In an interconnected system, there are multiple companies who must cooperate to run the system. Some companies may be reluctant to exchange their data for security concerns. In addition, the power system network is growing larger and more complex shared by more providers after the deregulation. In this situation, the function of state estimation is becoming more important, because it is the primary tool for monitoring and control based on the real-time data received from the measurement units. As an example, one of the causes of Northeast blackout of 2003 was the poor control-room procedures and failure of power-grid organization to keep it from spreading [5]. The security analysis, economic dispatch, etc. strongly depend on the accuracy of data provided by the state estimation. Recently, synchronized phasor measurement techniques based on a time signal of the GPS (Global Positioning System) are introduced in the field of power systems. In order to obtain simultaneous measurements of different buses it is necessary to synchronize sampling clocks at different locations. A PMU (Phasor Measurement Unit) which can increase the confidence in the state estimation result is practically introduced via the use of synchronized measurements [6]-[16]. Wide-area information from properly distributed PMUs enables the effective assessment of the dynamic performance of the power system and multi-area state estimation with independently operating system areas. 1.2 Multi-Area State Estimation Using PMUs Since the start of the deregulation, power system operators are confronted with the This thesis follows the style and format of IEEE Transactions on Power Systems.
12 2 need to monitor and coordinate power transactions taking place over large distances in remote parts of the power grid. Each operating center may have its own state estimator which processes the measurements given by its local substations. A system-wide state estimation solution is needed when the power transactions are involved in several control areas. A central state estimator will collect wide area measurements and will solve very large scale state estimation problem. However, solving the large scale state estimation is not easy. Other than the problem of huge size of the interconnnected system, each indepenent system operators may be reluctant to modify their existing system method in order to meet the new specifications imposed by the central state estimator for the large area solution. Then, a hierarchical multi-area state estimation is a solution for the individual system operators to keep their existing method and a central coordinator to determine the state of the overall system. Synchronized phasor measurement units are indispensable to get a second level state estimation. PMUs can measure voltage and currents as phasors. The error is small compared with the conventional measurements such as power injection and power flow measurements. Until very recently, the measurements used by the multi-area state estimators typically included only synchronized voltage phasors from the PMUs. However, this thesis will include all the measured data from PMUs, such as voltage magnitudes and phasors and real and reactive part of currents. 1.3 Thesis Contributions One of the contributions of this thesis is that it shows the effect of PMUs on the accuracy of variables. After showing how to implement the PMU measurement in state estimation, the effect is discussed by gradually increasing the PMU numbers. Four different kinds of IEEE Bus Systems are tested. Interesting thing is that the improved accuracy of variables are somewhat saturated when PMUs are implemented at nearly 10% of the total system buses. Second contribution of this thesis is the introduction of the linear formulated state estimation. There s no need to update the Jacobian matrix in state estimation algorithm when using only PMU measured data. Simulation example of the linearly
13 3 formulated state estimation and its bad data detection and identification process is illustrated. Lastly, this thesis presents a multi-area state estimation method including PMU measurements. 1.4 Organization of This Thesis This thesis is composed of 6 chapters. Chapter I is the introduction. It shows the current problems and reviews the problem of state estimation. Chapter II presents the specific modeling and simulation method of the full weighted least square state estimation. Chapter III is the introduction of the linear formulation of the state estimation problem when using PMUs. Simulation works and bad data processing with the linear formulation are illustrated. Chapter IV shows the benefits of using PMUs. Improved accuracy of the estimated variables with PMUs is illustrated. Chapter V shows a multi-area state estimation method with PMUs. Firstly, current method of multi-area state estimation is reviewed, and proposed method is described. Then, the simulation results of the proposed multi-area state estimation method described. Finally, Chapter VI contains conclusions about this thesis and future work to make the state estimation method more applicable for real systems.
14 4 CHAPTER II FULL WEIGHTED LEAST SQUARE STATE ESTIMATION 2.1 Introduction Power system state estimation derives a real-time model through the received data from a redundant measurement set. Different kinds of methods about state estimation are reviewed in [17]-[19]. Among them, detailed weighted least squares(wls) state estimation methods are shown in [20]-[23]. WLS state estimation minimizes the weighted sum of squares of the residuals. Consider the set of measurements given by the vector z : 1 2 z1 h1 ( x1, x2,, xn) e1 z h ( x, x,, x ) e z m h m( x1, x2,, xn ) e m n 2 z = = + = h( x) + e T h = [ h ( x), h ( x),, h ( x)] m hi ( x ) is the nonlinear function relating measurement i to the state vector x = [,, ] is the system state vector T x x1 x2 x n = [,, ] is the vector of measurement errors. T e e1 e2 e m Let E( e) denote the expected value of e, with the following assumptions: (2.1) E( e i ) = 0, i = 1,, m (2.2) E( e e ) = 0 (2.3) i j Measurement errors are assumed to be independent and their covariance matrix is given by a diagonal matrix R : T Cov( e) = E[ e e ] = R = diag{ σ1, σ 2,, σ m } (2.4) The WLS estimator will minimize the following objective function: m 2 ( ) = ( i i ( )) / ii i= 1 J x z h x R T 1 = [ z h( x)] R [ z h( x)] (2.5) At the minimum value of the objective function, the first-order optimality conditions
15 5 have to be satisfied. These can be expressed in compact form as follows: vector J ( x) T 1 g( x) = = H ( x) R [ z h( x)] = 0 where, x h( x) H ( x) = x (2.6) The non-linear function g( x ) can be expanded into its Taylor series around the state k x neglecting the higher order terms. An iterative solution scheme known as the Gauss-Newton method is used to solve (2.6): k 1 k k 1 k + x = x G( x ) g( x ) (2.7) where, k is the iteration index and G( x ) is called the gain matrix, and expressed by: k x is the solution vector at iteration k. g( x ) G x H x R H x x k k T k 1 k ( ) = = ( ) ( ) k T k 1 k ( ) = ( ) ( ( )) g x H x R z h x (2.8) (2.9) Generally, the gain matrix is quite sparse and decomposed into its triangular factors. At each iteration k, the following sparse linear set of equations are solved using forward/backward substitutions, where k + 1 k+ 1 k x = x x : G( x ) x = H ( x ) R z h( x ) = H ( x ) R z k k + 1 T k 1 k T k 1 k (2.10) This iterations are going on until the maximum variable difference satisfies the k condition, ' Max x < ε '. A detailed flow-chart of this algorithm is shown in next section. 2.2 WLS State Estimation Algorithm WLS state estimation uses the iterative solution of Equation (2.10). Iterations start at an initial guess 0 x which is typically chosen as the flat start, i.e. all bus voltages are assumed to be 1.0 per unit and in phase with each other. The flow-chart of the iterative algorithm for WLS state estimation problem can be outlined in Figure 1.
16 6 Start Set iteration index k = 0 Set ε and k limit value k Initialize x, typically as a flat start No Convergence! No k < k limit? Yes k Calculate the measurement function h( x ) k Build the measurement Jacobian H ( x ) k T k 1 k Build G( x ) = H ( x ) R H ( x ) k k Calculate the mismatch vector z = z h( x ) k 1 Calculate x by G( x ) x = H ( x ) R z k k T k k Update k = k + 1, 1 Update x + = x + x k k k x ε k? No End Figure 1. Flow-Chart for the WLS State Estimation Algorithm 1) Initially set the iteration counter k = 0, define the convergence tolerance ε and the iteration limit k limit values. 2) If k > klimit, then terminate the iterations. k k 3) Calculate the measurement function h( x ), the measurement Jacobian H ( x ), and
17 7 the gain matrix k T k 1 k G( x ) = H ( x ) R H ( x ). 4) Solve k x using Equation (2.10). 5) If x ε k >, then go to step 2). Else, stop. Algorithm converged. 2.3 Measurement and Component Modeling There are three most commonly used measurement types in power system state estimation. They are the bus power injections, the line power flows and bus voltage magnitudes. These measurement equations can be expressed using the state variables. Consider a system having N buses, the state vector will have ( 2N 1) components which are composed of N bus voltage magnitudes and ( N 1) phase angles. The state vector is T equal to x = [ V1 V2 VN θ2θ 3 θn ]. An arbitrary value, such as 0 is set to be the phase angle of one reference bus. If we define gij + jbij as the admittance of the series branch line connecting buses i and j, and gsi + jbsi as the admittance of the shunt branch connected at bus i, the equivalent π model can be shown in Figure 2 below. Figure 2. Equivalent π Model of Two Bus System Let the (i,j)th entry of the admittance matrix Y bey ij = G ij + jb ij. The expression for each of the above types of measurements are then given below: Real and reactive power injection at bus i can be expressed by,
18 8 N Pi = Vi Vj ( Gij cosθij + Bij sin θij ) (2.11) j N i N Q = V V ( G sinθ B cos θ ) i i j ij ij ij ij j N Real and reactive power flow from bus i to bus j are, 2 i P = V ( g + g ) V V ( g cosθ + b sin θ ) (2.12) ij i si ij i j ij ij ij ij 2 Q = V ( b + b ) V V ( g sinθ b cos θ ) ij i si ij i j ij ij ij ij Jacobian matrix H components for real power injection measurement are, P 2 = Vi Vj ( Gij sinθij + Bij cos θij ) Vi Bii (2.13) N i θ i j= 1 Pi = Vi Vj ( Gij sinθij Bij cos θij ) θ j N Pi 2 = V ( G cosθ + B sin θ ) V G V i j= 1 j ij ij ij ij i ii P i V j = V ( G cosθ + B sin θ ) i ij ij ij ij Jacobian matrix H components for reactive power injection measurement are, Q 2 = Vi V j ( Gij cosθij + Bij sin θij ) Vi Gii (2.14) N i θ i j= 1 Qi = V i V j ( G ij sin θ ij B ij sin θ ij ) θ j N Qi 2 = V ( G sinθ B cos θ ) V B V i j= 1 j ij ij ij ij i ii Q i V j = V ( G sinθ B cos θ ) i ij ij ij ij Jacobian matrix H components for real power flow measurement are,
19 9 Pij = Vi Vj ( gij sinθij bij cos θij ) θ i (2.15) P ij θ P ij i j V P ij V j = V V ( g sinθ b cos θ ) i j ij ij ij ij = V ( g cosθ + b sin θ ) + 2( g + g ) V j ij ij ij ij ij si i = V ( g cosθ + b sin θ ) i ij ij ij ij Jacobian matrix H components for reactive power flow measurement are, Qij = Vi Vj ( gij cosθij + bij sin θij ) θ i (2.16) Q θ Q ij V i Q ij j ij V j = V V ( g cosθ + b sin θ ) i j ij ij ij ij = V ( g sinθ b cos θ ) 2( b + b ) V j ij ij ij ij ij si i = V ( g sinθ b cos θ ) i ij ij ij ij The H matrix has rows at each measurements and columns at each variables. If the system is large, the H matrix has more zero components. Therefore, usually the sparse matrix technique is used to build this matrix. 2.4 State Estimation Algorithm with PMUs One PMU can measure not only the voltage phasor, but also the current phasors. Figure 3 shows a 4-bus system example which has single PMU at bus 1. It has one voltage phasor measurement and three current phasor measurements, namely V 1 θ 1, I1 δ1, I δ, I3 δ3. 2 2
20 10 Figure 3. Single PMU Measurement Model If we define y as the series admittance and y shunt as the shunt admittance, current phasor measurements can be written in rectrangular coordinates as shown in Figure 4. Figure 4. Transmission Line Model The expressions for Cij and D ij are: C = VY cos( δ + θ ) + V Y cos( δ + θ ) VY cos( δ + θ ) (2.17) ij i si i si j ij j ij i ij i ij
21 11 D = VY sin( δ + θ ) + V Y sin( δ + θ ) VY sin( δ + θ ) ij i si i si j ij j ij i ij i ij where, the state vector is given as : x = [ VV 1 2V 2 3 ] T nδ δ δ n. The entries of the measurement Jacobian H corresponding to the real and reactive parts of the current phasors are: C ij V i = Y cos( δ + θ ) Y cos( δ + θ ) si i si ij i ij (2.18) C ij V j C ij δ i C δ ij j D ij V i D ij V j D ij δ i D δ ij j = Y cos( δ + θ ) ij j ij = VY sin( δ + θ ) + VY sin( δ + θ ) i si i si i ij i ij = V Y sin( δ + θ ) j i j j ij = Y sin( δ + θ ) Y sin( δ + θ ) si i si ij i ij = Y sin( δ + θ ) ij j ij = VY cos( δ + θ ) VY cos( δ + θ ) i si i si i ij i ij = V Y cos( δ + θ ) j ij j ij (2.19) The measurement vector z contains δ, C, D, as well as the power injections, power flows and voltage magnitude measurements. ij ij T T T T T T T T T z = [ P, Q, P, Q, V, δ, C, D ] (2.20) inj inj flow flow ij ij Generally, those measurements received from PMUs are more accurate with small variances compared to the variances of conventional measurements. Therefore, including PMU measurements is expected to produce more accurate estimates. Multi-area state estimation also benefits from this technology.
22 Observability and Bad Data Detection If the entire state vector of bus voltage magnitudes and angles can be estimated from the set of available measurements, the power system with the specified measurement set is said to be observable. However, some measurement failures may occur in the power system at anytime. In this situation, the power system state estimator can not estimate bus voltage magnitudes and angles at all buses. It can only estimate a portion of the entire network. If a limited number of measurement units are exist, then the units should be placed properly to make the entire system observable. Observability and measurement placement problems are well described in [24]-[27]. Other than these problems, the method of bad data detection is also studied in this thesis. Every actual measurement may contain small random errors due to various reasons, such as the limited precision of the measuring meters and the unexpected noise in the communication channals. However, such errors may be filtered out by the state estimator. One of the essential functions of a state esimator is to detect gross measurement errors, and to identify and eliminate them if possible. Different kinds of bad data processing methods are explained in [28]-[32]. When using the WLS estimation method, detection and identification of bad data are done only after the estimation algorithm converges, by processing the measurement residuals. In this thesis, chi-squares detection test and largest normalized residual test will be discussed. The chi-squares test only determines if the measurement set has any bad data. Once bad data are detected, they need to be identified and eliminated or corrected. The largest normalized residual has the ability to identify bad data. Consider the objective function J ( x ), written in terms of the measurement errors, e i is the i th measurement error, e J ( x) = R e = ( ) = ( e ) m m m 1 2 i 2 N 2 ii i i i= 1 i= 1 Rii i= 1 (2.21) R ii is the diagonal entry of the measurement error covariance matrix and m is the total number of measurements. Assuming that e i s are all normally distributed random variables with zero mean and R ii variances, N e i s will have a
23 13 standard normal distribution, i.e.: Then, J ( x ) will have a e ~ N (0,1) (2.22) N i 2 χ distribution with at most ( m n ) degree of freedom. 2 χ ( m n), means chi-squares distribution with ( m n ) degrees of freedom with probability α of false alarmα. J ( x) value which is larger than the distribution curve χ 2 ( ), indicates that there are bad data in the measurement set. After detecting bad data, identification and elimination of bad data is required. Considering the residual sensitivity and covariance matrices, measurement residuals may still be correlated even if errors are assumed independent with E( e ) = 0, cov( e) = R. Then, the WLS estimator of the linearized state vector will be given by, m n α ˆ = ( ) T 1 1 T 1 x H R H H R z 1 T 1 = G H R z (2.23) If we define K matrix which is sometimes called the hat matrix as then the estimated value of z can be denoted by: K 1 T 1 HG = H R, ẑ = H xˆ = K z (2.24) Now, the measurement residuals can be expressed as follows: r = z zˆ = ( I K) z (2.25) = ( I K)( H x + e) = ( I K) e = Se The matrix S, called the residual sensitivity matrix, represents the sensitivity of the measurement residuals to the measurement errors. Normalized value of the residual for measurement i can be obtained by simply dividing its absolute value by the corresponding diagonal entry in the residual covariance matrix, The normalized residual vector r r N i i = = r ~ N (0,1). Thus, the largest element in N i Ω r ii ii ii i R S (2.26) N r will then have a standard normal distribution, i.e. N r can be compared against a statistical threshold to decide on the existence of bad data. This threshold can be chosen based on the
24 14 desired level of detection sensitivity. Bad data may show up in several different ways depending on the type, location and number of measurements that are in error. When there are multiple bad data in the measurement set, estimates of measuerments may be significantly affected by the errors of each other, if they have strongly correlated residuals. They are referred to as interacting bad data which will make bad data processing very difficult. Futhurmore, conforming errors are those that appear consistent with each other, making their identification more difficult. When a single bad measurement exists in the measurement set, the largest normalized residual test will identify and eliminate the bad data, but only if the measurement is not critical. A critical measurement is the one whose elimination from the measurement set will result in an unobservable system. The measurement residual of a critical measurement will always be zero. There are also critical pairs and critical k-tuples. When simultaneous removal of two redundant measurements makes the system unobservable, it is called a critical pair. A critical k-tuple contains k redundant measurements, where removal of all of them will cause the system to become unobservable. Therefore, the bad data processing is not so easy when there are multiple interacting or conforming bad data or any critical measurements which are bad.
25 15 CHAPTER III LINEAR FORMULATION OF STATE ESTIMATION USING ONLY PMUS 3.1 Introduction One phasor measurement unit can measure a synchronized voltage phasor and several synchronized current phasors. If the measurement set is composed of only voltages and currents measured by PMUs, the state estimation can be formulated as a linear problem. The state vector and measurement data can be expressed in rectrangular coordinate system. The voltage measurement (V = V θ ) can be expressed as (V = E + jf ), and the current measurement can be expressed as ( I = C + jd ). Figure 5. Transmission Line Model with Rectangular Form In the Figure 5, ( gij + jbij ) is the series admittance of the line, and ( gsi + jbsi ) is the shunt admittance of the transmission line. Line current flow I ij can be expressed as a linear fucntion of voltages. I = [( V V ) ( g + jb )] + [ V ( g + jb )] i j i j i j ij i si si = [( g + jb ) + ( g + jb )] V ( g + jb ) V (3.1) i j ij si si i i j ij j
26 16 The measurement vector z is expressed as z = h( x) + e, (where x is a state vector, h( x ) is a matrix of the linear equations, and e is an error vector). In rectangular coordinates: z = ( Hr + jhm)( E + jf) + e (3.2) below: A and B are expressed by: In matrix form, where, H = Hr + jhm, x = E + jf and z = A + jb. A = Hr E Hm F (3.3) B = Hm E + Hr F A Hr HmE e B = + Hm Hr F (3.4) Then, the estimated value ˆx = Eˆ + jfˆ can be obtained by solving the linear equation ˆ = ( ) (3.5) T 1 1 T 1 x H R H H R z Hr Hm If we define the linear matrix H new as H new = Hm Hr, then the above equation can be rewritten by: Eˆ xˆ = = ( H R H ) H R F ˆ T 1 1 T 1 new new new A B (3.6) Therefore, the equation for rectangular formed variable ˆx can be given by the rectangular forms of H matrix and z vector. They are all real numbers. 3.2 Linear State Estimation Algorithm Consider the two bus system shown in Figure 6. Note that PMU located at bus 1 measures voltage V 1 and line current I 12. According to (3.1), the line current flow I 12 can be expressed as: I12 = k1 V1 + k2 V2 ( k 1, k 2 are constant complex value) (3.7)
27 17 Figure 6. Two Bus System with Measurements Measurement vector z has two entries, V 1 and I 12. z V 1 0E 1 = I = + 12 k1 k 2 F Expressing (3.8) in rectrangular coordinates: j Hr jhm k k = = + = + kr + jkm kr + jkm kr kr km km where, V1 = E1 + jf1, I12 = C12 + jd12 e (3.8) k1 = kr1 + jkm1, k2 = kr2 + jkm2 The measurement vector z becomes, Finally, ˆx is calculated using (3.6): z E E1 C kr kr km km E F F 1 D 12 km 1 km2 kr1 kr2 F = = + e (3.9)
28 18 xˆ Eˆ E1 E, 2 = = Fˆ F1 F2 z A E1 C 12 = B = F1 D 12 This is very simple and fast, because it dosen t need any iterations. (3.10) 3.3 Simulation Results Four different IEEE test systems (IEEE14, IEEE30, IEEE57, IEEE118 bus system) are used for the simulations [33]-[35]. A gaussian random errors are imposed on each measurement. The error variance of measurements is set to be Table 1 shows the locations of PMUs at each system. These PMUs are placed as a minimum required number. Each PMU has one voltage measurement and several current flow measurements connected to the neighboring buses. Table 1. PMU Locations for Each IEEE System PMU locations at Bus IEEE14 Bus 2,6,7,9 IEEE30 Bus 3,5,6,9,10,12,19,23,25,29 IEEE57 Bus 1,4,7,9,15,20,24,25,27,32,36,38,39,41,46,50,53 IEEE118 Bus 2,5,9,11,12,17,21,24,25,28,34,37,40,45,49,52,56, 62,63,68,73,75,77,80,85,86,90,94,101,105,110,114 Network diagrams showing the PMU locations for the test systems are given in Figures 7~10.
29 19 Figure 7. IEEE14 Bus System with PMU Locations Figure 8. IEEE30 Bus System with PMU Locations

30 Figure 9. IEEE57 Bus System with PMU Locations 20
31 21
32 22 Table 2 shows the total results of the state estimation using only PMUs. The objective functions J ( x ) is also much less than the chi-squares threshold with 99% confidence. Table 2. Linear Formulation Simulation Results of Several IEEE Bus Systems IEEE 14Bus IEEE 30Bus IEEE 57Bus IEEE 118Bus Number of PMUs Number of voltage measure Number of current measure H matrix dimension 38 by by by by 235 Computation time (s) Degree of freedeom Chi-square limit J(x) (objective function) Largest normalized residual Bad Data Processing The method of bad data detection and identification with linear formulation of state estimation is investigated in this section. Bad data processing includes chi-squares test and largest normalized residual test. As an example, Figure 11 shows a portion of the IEEE118 bus system with PMU locations at bus 37 and bus 40.
 is 0.4258 in normal operating condition. C(37,40) is forced to change from 0.4258 to 0. There are PMUs in bus 37 and 40.")
33 23 Figure 11. Imposed Bad Data at C(37,40) from to 0 in IEEE118 Bus System One bad data is imposed to the current measurement from bus 37 to bus 40. Real part of current measurement (37,40) is in normal operating condition. C(37,40) is forced to change from to 0. There are PMUs in bus 37 and 40. Therefore, C(37,40) is a redundant measurement. The state estimation result with objective function is shown in Table 3. The objective function J(x) is much larger than chi-sqaures limit, which means that the test detected bad data. Then, the largest normalized residual test identified the bad data at C(37,40) which has the largest normalzied residual of in Table 4. Table 3. Objective Function Value with Bad Data at C(37,40) Degree of Freedom Chi-Sqaures limit Objective function J(x)
34 24 Table 4. Sorted Normalized Residual Test Results with Bad Data Measurement Type Sorted Normalized Residual Real part of current measurement (37,40) Real part of current measurement (40,39) Real part of current measurement (37,39) Real part of current measurement (40,37) : : The current measurement (37,40) has been removed, because the real part of current measurement has been identified as a bad data. After removing it, the chi-squares test did not detect any bad data, and the largest normalized residual is which is far below the test criteria 3.0, as shown in Tables 5-6. Table 5. Objective Function Value with No Bad Data Degree of Freedom Chi-sqaures limit Objective function J(x) Table 6. Sorted Normalized Residual Test Results with No Bad Data Measurement Type Sorted Normalized Residual Real part of current measurement (85,86) Real part of current measurement (86,85) Real part of current measurement (77,75) Real part of voltage measurement (11) : : In this example, the bad data C(37,40) has been successfully detected and sorted out with two tests, a chi-squares test and a largest normalized residual test.
35 25 CHAPTER IV BENEFITS OF USING PMUS 4.1 Improved Accuracy of Variables with PMUs This section investigates the effects of increasing the number of PMUs on the accuracy of the estimated variables. If some PMU measurements are added to the state estimation, the state estimation accuracy will be affected, because the PMU measurements have smaller error variances compared to other measurements. One PMU has one voltage phasor measurement and several current phasor measurements at any branch connected to the PMU installed bus. A PMU will measure two quantities, the real and reactive part of the phasor for each voltage or current. Firstly, consider how to measure the accuracy of the estimated variables. One of the way of representing the level of state estimation accuracy is to refer the covariance of the estimated variables. From (3.5), the covariance of the estimated variable vector ˆx can be expressed as: T 1 1 T 1 1 T 1 Cov( xˆ ) = Cov(( H R H ) H R z) = Cov( G H R z) (4.1) The covariance of the measurement vector z is R from (2.4): Then, (4.1) can be rewritten as: Cov( z) = Cov( h( x) + e) = Cov( e) = R (4.2) 1 T 1 1 T 1 T Cov( xˆ ) = ( G H R ) Cov( z)( G H R ) (4.3) = = 1 T 1 T 1 1 T 1 T ( G H R ) R(( H R H ) H R ) 1 T 1 T 1 T T 1 1 T ( G H R ) R( H R ) (( H R H ) ) = ( G H R ) RR HH R( H ) 1 T T 1 = G H R R( H ) = G 1 1 T 1 T 1 Therefore, the inverse of the gain matrix is equal to the covariance of the ˆx. Consider a three bus system example of Figure 12. All the line impedances are assumed to be j10. There are 5 measurements shown in Table 7. S.D. means an error
36 26 standard deviation. Figure 12. Three Bus System with Measurement Data Table 7. Measurement Type, Value and Error Standard Deviation Measure #1: Pflow(1,2) #2: Qflow(1,2) #3: Pinj(3) #4: Qinj(3) #5: Voltage(1) Value S.D Variable vector x in the system can be express as x = [, δ ]. T T With 3-bus example, Vi = [ V1, V2, V3 ], δ = [ δ2, δ3] (bus 1 is chosen as slack). The Jacobian matrix, H and the inverse of weight, R can be calculated as: i V i T T i
37 H = , R= Inverse of gain matrix can be calculated by (2.8), ( T 1 ) 1 G G = H R H : = If we have the value of the inverse of the gain matrix variances of variables by taking diagonal elements. 1 G, we can find error 1 G = cov( xˆ), G 1 ii = σ (4.4) xˆ 2 Error Variance ( σ ) is G ( diagonal) = ii 8 8 Table 8. Variances and Standard Deviations of the Variables of Three Bus System Measure δ V 1 V 2 V δ Variance ( σ ˆx ) S.D. ( σ ) ˆx
38 28 In Table 8, the error standard deviation of variable V 1 is obtained as from the square root of the first element of the inverse gain matrix, V 2 as , and so on. Regarding the accuracy, PMU can deliver more precise measurement data. Several cases are tested with different number of added PMUs to the conventional measurement set. Simulations and analysis of six different cases which are shown in Table 9 are done with several IEEE bus systems in the next section. Case 1 Case 2 Case 3 Case 4 Case 5 Case 6 Table 9. Six Different Cases by Adding PMUs Conventional Measurements with No PMUs Conventional Measurements with PMUs of (10% of bus number) Conventional Measurements with PMUs of (20% of bus number) Conventional Measurements with PMUs of (30% of bus number) Conventional Measurements with PMUs of (40% of bus number) Only Minimum PMUs 4.2 Simulations Results In this section, 4 different IEEE bus systems (IEEE14 bus system, IEEE30 bus system, IEEE57bus system, IEEE118bus system) are tested with 6 cases to find out the effect of the PMUs to the accuracy of the estimated variables. Define m as the number of measurements, n as the number of variables, and η as the ratio of the number of measurements per the number of variables. During the tests, η is maintained to be 1.6. Table 10 has more detailed information about the measurement numbers for the tests.
39 29 Table 10. Variable Numbers and Measurement Type and Numbers Measurements Variables Power Injection Power Flow Voltage Magnitude Total Ratio η ( m n ) IEEE14 Bus IEEE30 Bus IEEE57 Bus IEEE118 Bus For 14 bus system example, variable number is n = = 27 (excluding slack bus angle), and m should be 43 to maintain η = To place measurement evenly at each system, 40% of injection easurements and 60% of flow measurements are distributed to each systems. Therefore, the injection measurement number is 18 and flow measurement number is 24 in 14 bus system. Lastly one voltage magnitude measurement is placed at each system. The settings for error standard deviations for those measurements are shown in Table 11. A PMU has much smaller error deviations than other conventinal measurements as Table 11. Standard Deviations of the Measurements for the Test Power Injection Power Flow Voltage Magnitude PMU Figures 13~16 show the network diagrams for each systems. Arrow with circle at the bus means a pair of real and reactive power injection measurements, and arrow with v
40 30 means a voltage magnitude measurement. If there s any point on the transmission line, it means a pair of real and reactive power flow measurements. The point is placed at the starting position regarding the direction of the flow measurement. Figure 13. IEEE14 Bus System Diagram with Conventional Measurements
41 Figure 14. IEEE30 Bus System Diagram with Conventional Measurements 31
42 Figure 15. IEEE57 Bus System Diagram with Conventional Measurements 32
43 33
44 34 The accuracy of two variables (voltage magnitude, voltage angle) are investigated separately. The variances of variables are obtained from the inverse diagonal elements of G matrix. The standard deviation is a square root of the variance. Figures 17~20 show the accuracy of the estimated voltage magnitudes of each system, and Figures 21~24 show the accuracy of the estimated voltage angles of each system. Figure 17. Accuracy of V of IEEE14 Bus System with PMUs
45 35 Figure 18. Accuracy of V of IEEE30 Bus System with PMUs Figure 19. Accuracy of V of IEEE57 Bus System with PMUs

46 36 Figure 20. Accuracy of V of IEEE118 Bus System with PMUs Figure 21. Voltage Angle Accuracy of IEEE14 Bus System with PMUs
47 37 Figure 22. Voltage Angle Accuracy of IEEE30 Bus System with PMUs Figure 23. Voltage Angle Accuracy of IEEE57 Bus System with PMUs
 of each variables are shown in Figures 25~28 for voltage magnitudes, and in Figures 29~32 for voltage angles.")
48 38 Figure 24. Voltage Angle Accuracy of IEEE118 Bus System with PMUs Average valued S.D.(Standard Deviation) of each variables are shown in Figures 25~28 for voltage magnitudes, and in Figures 29~32 for voltage angles. Figure 25. Average V Standard Deviation of IEEE14 Bus System
49 39 Figure 26. Average V Standard Deviation of IEEE30 Bus System Figure 27. Average V Standard Deviation of IEEE57 Bus System
50 40 Figure 28. Average V Standard Deviation of IEEE118 Bus System Figure 29. Average Voltage Angle Standard Deviation of IEEE14 Bus System
51 41 Figure 30. Average Voltage Angle Standard Deviation of IEEE30 Bus System Figure 31. Average Voltage Angle Standard Deviation of IEEE57 Bus System
52 42 Figure 32. Average Voltage Angle Standard Deviation of IEEE118 Bus System Table 12. Average Error Standard Deviations of the Estimated Variables Type of Case 1 Case 2 Case 3 Case 4 Case 5 Case 6 Type of IEEE Bus Variables No PMUs 10% 20% 30% 40% Only Systems PMUs PMUs PMUs PMUs PMUs 14 Bus (100%) (19.31%) (3.95%) (3.42%) (1.85%) (0.13%) Voltage Magnitude ( V ) 30 Bus 57 Bus (100%) (100%) (22.43%) (34.05%) (10.70%) (22.00%) (6.96%) (12.98%) (6.94%) (12.12%) (0.09%) (0.13%) 118 Bus (100%) (14.23%) (7.25%) (5.76%) (4.20%) (0.17%) 14 Bus (100%) (35.56%) (6.66%) (5.62%) (2.65%) (0.11%) Voltage Angle (δ ) 30 Bus 57 Bus (100%) (100%) (33.98%) (59.23%) (16.3%) (38.53%) (10.56%) (22.92%) (10.52%) (21.82%) (0.11%) (0.19%) 118 Bus (100%) (19.31%) (3.95%) (3.42%) (1.85%) (0.13%)
53 43 The percentage values in the Table 12 mean that how the S.D. values at each cases are decreased compared to the S.D. of Case 1 which are forced to be set as 100% for each systems. In the IEEE118 bus system for example, the S.D. of the estimated voltage magnitude is approximately (Set to be 100%) when there is no PMUs, but after adding 10% of PMUs to the system, it becomes nearly (14.23%). It means that 85.77% of the S.D. of Case 1 is decreased by adding only 10% of PMUs. In case of Only PMUs, it becomes nearly zero, such as which is far less than the No PMUs case. The interesting thing is that the rates of percent decreasing are maximum at Case 2 which has 10% of PMUs. Therefore, this result shows that the most cost effective way of installing PMUs is to add them to the system around 10% of the total bus numbers, while decreasing the errors of the estimated variables.
54 44 CHAPTER V MULTI-AREA STATE ESTIMATION 5.1 Current Method of Multi-Area State Estimation After the deregulation of the power systems, state estimation solution for a large scaled interconnected system is needed. Several kinds of research for the multi-area methods of the state estimation are done earlier in [36]-[44]. Different kinds of analysis for the system network by nodes [36], tie-lines [37],[38],[39] or the structure of the gain matrix [40] are suggested. However, their ideas are mainly centered on the computing time, memory issues, and exchange of data between areas. Recently, multi-area state estimation including boundary measurements and requiring no iterations between the local and central estimators is proposed in [45]. The existing multi-area state estimation method is briefly introduced in this section mostly based on [45], and new proposed strategy is discussed next. Consider a large power system including several local areas. In each areas, the buses are classified into three different types of buses. Supposing that the area i is taken as an example, their definitions are following: 1) Internal bus : All of whose neighbors are belong to the area i 2) Boundary bus : Whose neighbors are area i internal buses and at least one boundary bus from another area. 3) External bus : Which is a boundary bus of another area with a connection to at least one boundary bus in area i After excluding the voltage angle at the reference bus, the state vector for the area i is given by, b T int, T ext, T T i i i i x = x x x.where T b i x is the state vector for the boundary buses, int x T i is for the internal buses, and ext i T x is for the external buses. This defined state vector of the voltage magnitudes and angles is for the first level state estimation. The second level state estimation includes another variables, the synchronized phase angles of the slack buses in each areas. The second level estimator coordinates the results of the individual
55 45 local area estimation, and make sure that all bad data related to the boundary measurements are identified and removed. The state vetor to be estimated in this stage is defined as: where, T b T T x = [ x, u ] (5.1) s T T T T b b b b T x = [ x1, x2,, x n ], T T u u2 u3 u n = [,,, ] When the reference area is arbitrarily chosen to be area 1 with u 1 = 0, u i represents a voltage angle of the slack bus of the i th area with respect to the slack bus of area 1. While processing the first and second level state estimations, a WLS state estimation method is used. The central coordinator receives GPS based phasor measurement data and raw measurement data from area boundary buses. These data are used in second level state estimation to get an unbiased solutions for the whole system state. The measurement vector z is given by: where, T T T T b ext T z = [ z, z, xˆ, xˆ ] (5.2) s u ps 1) z u : Boundary measurement vector. 2) z ps : GPS synchronized phasor measurement vector. 3) x ˆb : Boundary state variables estimated by individual area state estimation. 4) x ˆext : external state variables. The central coordinator takes those values as pseudo-measurements. The measurement model is then be given by: z = h ( x ) + e (5.3) s s s s The covariance of these measurements can be obtained from the covariance matrix of the state for individual areas. From the (4.3), this matrix is equal to the inverse of the gain matrix related to that area s WLS state estimator. For the effectiveness of the coordinator estimation, synchronized phasor measurements provide the measurement redundacy effectively, while improving the quality of the estimation. The largest normalized residual
56 46 test is carried out, in both the individual area SE and the coordinator SEto detect and identify the bad data. The main idea of this formulation is to allow each local estimator to remain completely independent in the first level and let the first stage results be coordinated by an independent central entity in the second level. 5.2 Proposed Method for Multi-Area State Estimation The multi-area state estimation method presented in the previous section utilizes PMU measured voltage angles while accomplishing the second level state estimation. Which means that the synchronized voltage angles at slack bus in each areas are added to the measurement vector. However, those are not the only measurement data from a PMU. Single PMU can measure a voltage and currents with magnitudes and phasors. In this section, an upgraded method for multi-area state estimation with all the measurement data from PMU is introduced. The method of incorporating PMU measurements to the conventional state estimation is explained in detail in chapter II. Considering the the second stage SE, the measurement vector z s can have all the measurement data from PMU. The measurement vector from PMU can be expressed as z pmu : T T T T T z = [ z, z, z, z ] (5.4) pmu v angle c d Total measurement vector z s can be expressed as: The variable vector T T T T b ext T z = [ z, z, xˆ, xˆ ] (5.5) s u pmu T T = [ z, z, z, z, z, xˆ, xˆ ] T T T T T b ext T u v angle c d x s in the second stage is composed of the variables in the boundary buses, PMU located buses, and neighboring buses to the PMU located buses. Therefore, the x s can be expresssed as: T b T T x = [ x, x ] (5.6) s pmu
57 47 Table 13. Various Measurement Types with PMU Measurement Type Measurement Power Injection Power flow Voltage from PMU Current from PMU Estimated Result x ˆb Estimated Result x ˆext Pinj (Real Power Injection) Qinj (Reactive Power Injection) Pflow (Real Power Flow) Qflow (Reactive Power Flow) V (Voltage Magnitude) V angle (Voltage Angle) C ij (Real Part of Current) D ij (Reactive part of current) V (Result of Boundary Bus from First Level Estimation ) V angle (Result of Boundary Bus from First Level Estimation) V (Result of External Bus from First Level Estimation) V angle (Result of External Bus from First Level Estimation) There are totally 12 measurement types in the second level state estimation as shown in Table 13. Simulation works of this method is carried out in the next section. The only difference with the existing method is that the central coordinator SE has more measurements data from PMU. As expected, the accuracy of the estimated results of this method is improved by including current measurements which has small error standard deviations. 5.3 Simulation Example of IEEE14 Bus System This system is arbitrariliy divided by two areas. Area 1 has 5 buses (1,2,3,4,5) and area 2 has 9 buses (6,7,8,9,10,11,12,13,14). Figure 33 shows the diagram and measurement placement of the integrated system. Figures 34~35 depict the segmented area 1 and area 2. Lastly, Figure 36 illustrates the buses which has to be estimated at the second level, and measuremet placement for that.


58 48 Figure 33. Diagram and Measurement Placement of Integrated System Figure 34. Diagram and Measurement Placement of Area 1 Figure 35. Diagram and Measurement Placement of Area 2

59 49 Figure 36. Second Level Estimation with Boundary Buses Table 14 indicates the types and number of measurements and the error standard deviations for them. Gaussian errors are imposed to every measurement for the test from the exact values. Measurement data for the second level state estimation has boundary and external bus measurement variables which are estimated from the first level estimator. The gaussian standard deviations for the voltages and currents are small compared to the power injection and power flow measurement cases. Table 14. Type, Number, and Error S.D. for Different Estimation Levels Power Power Voltage Real Reactive Boundary V inj. flow Angle Current Current ( V, δ ) Integrated External ( V, δ ) First level (Area1) First level (Area2) Second level Gaussian error S.D Diag- (G i -1(i,i)) Diag- (G i -1(i,i))
60 50 The results of the estimation for the different levels are summarized in Table 15. The objective functions of each cases are quite below the chi-squares limits, and the largest normalized residuals are also far below the criteria 3.0. The result of this example indicates that the estimation is carried out successfully by two level estimation method with PMUs while including current measurements data. Table 15. Estimation Results of IEEE14 Bus System Degree of Chi-squares Objective Freedom Limit Function J(x) Largest r N Integrated Area Area Second-level Again, this method is tested for the bad data case, when there s a bad data in real power injection measurement at bus 6. The value of the Pinj(6), which was originally , is replaced by 2 as a bad data. Then, the estimation with WLS method is fulfilled out by two levels. Figure 37 depicts the diagram with bad data location.

61 51 Figure 37. Diagram of IEEE14 Bus System with Bad Data Tables are the chi-squares and the largest normalized residual test results of state estimation in area 2 at the first level estimation. Table 16. State Estimation Results of Area 2 with Bad Data Degree of Freedom Chi-squares Limit Objective Function J(x)
62 52 Table 17. Sorted Normalized Residuals of Area 2 Estimation Measurement Type Largest Normalized Residual (r N ) Real part of current (9,10) Imaginary part of current (9,7) Real part of current (9,14) : : Table 18. State Estimation Results of the Second Level with Bad Data Degree of Freedom Chi-squares Limit Objective Function J(x) Table 19. Sorted Normalized Residuals of the Second Level Estimation Measurement Type Largest Normalized Residual (r N ) Real power injection (6) Real part of current (5,6) Reactive power injection (6) : :
63 53 Tho objective function value 4.03 is far below the chi-squares limit 16.81, and the largest normalized residual is at real current measurement (9,10). Therefore, the estimator failed to detect and identify the bad data measurement, Pinj(6) at the first level local estimation. It is because that the bad data is belong to a critical measurement at this stage. However, the coordinator SE successfully detect and identify the bad data in Tables The objective function value is over the chi-squares limit, and the largest normalized residual value is at Pinj(6). Example of IEEE14 bus system is tested in this section, The two-level estimation is accomplished successfully, and the benefits of the coordinator SE is investigated by adopting a bad data at Pinj(6). Only the second level estimator could detect the bad data at this time with the help of the measurement redundancy. 5.4 Simulation Example of IEEE118 Bus System More larger power system is tested this time with same method with the IEEE14 bus case. This system is arbitrariliy divided by nine areas with 9 PMUs at each areas. Figure 38 shows the area segments and the PMU placements.
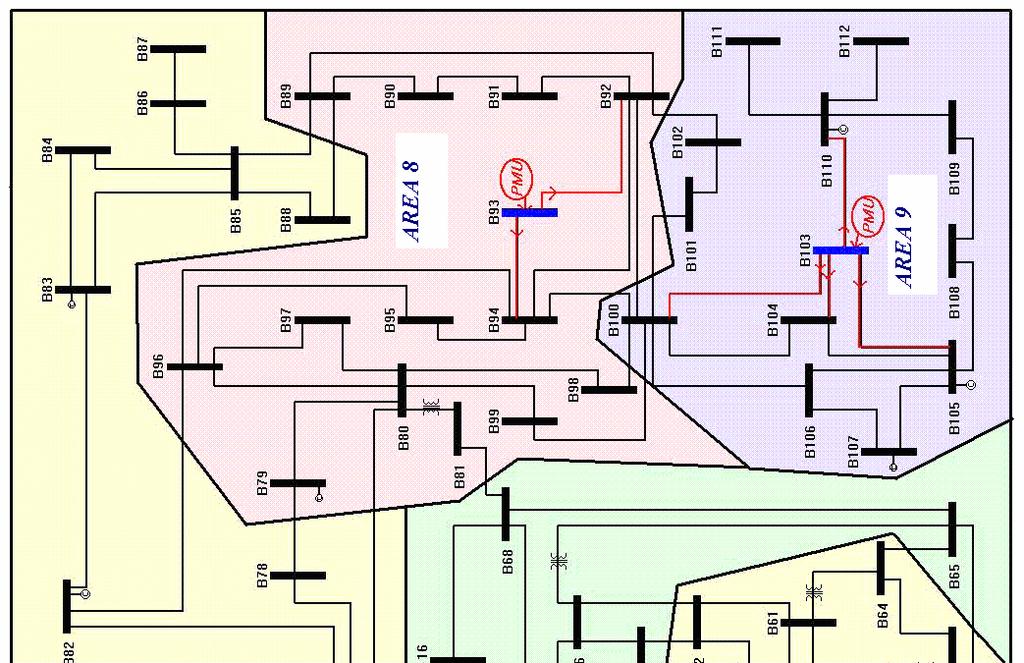
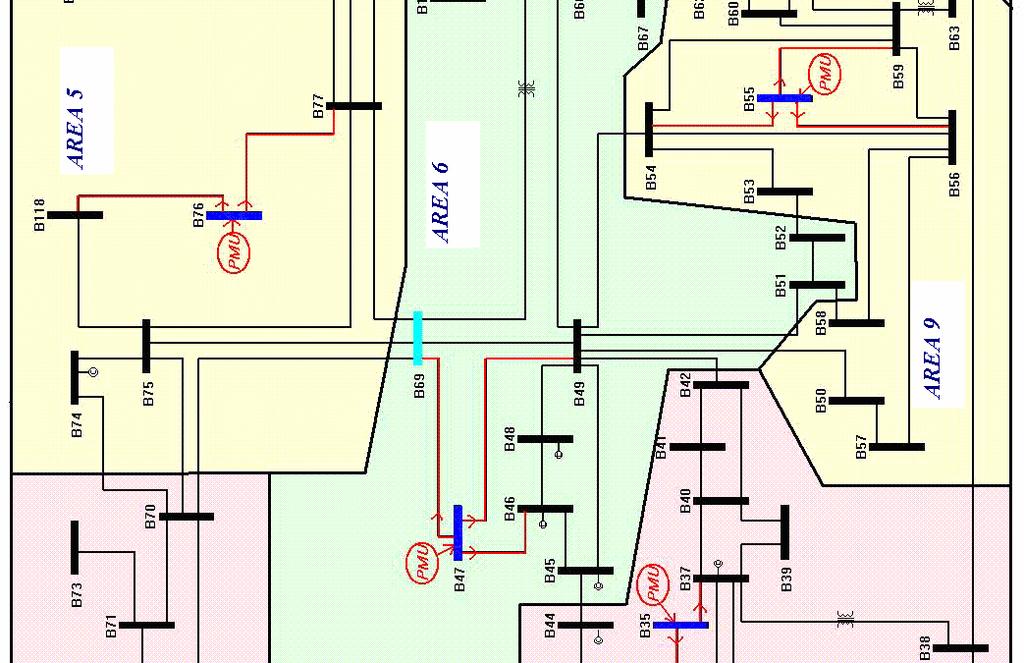
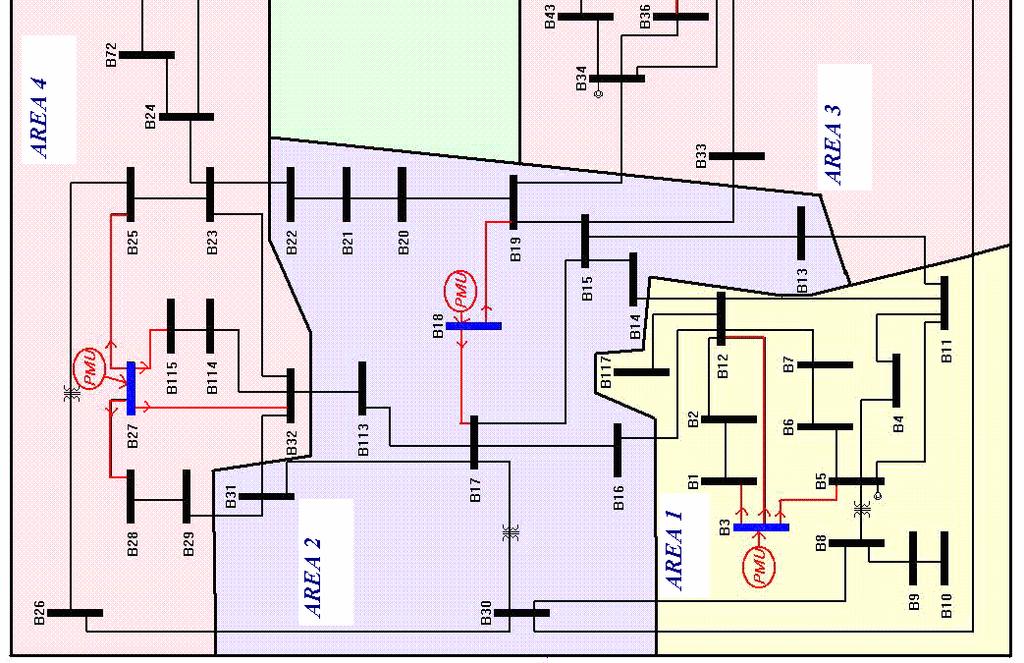
64 54
Weighted Least Squares Topology Error Detection And Identification
 Weighted Least Squares Topology Error Detection And Identification A THESIS SUBMITTED TO THE FACULTY OF THE GRADUATE SCHOOL OF THE UNIVERSITY OF MINNESOTA BY Jason Glen Lindquist IN PARTIAL FULFILLMENT
Role of Synchronized Measurements In Operation of Smart Grids
 Role of Synchronized Measurements In Operation of Smart Grids Ali Abur Electrical and Computer Engineering Department Northeastern University Boston, Massachusetts Boston University CISE Seminar November
Fine Tuning Of State Estimator Using Phasor Values From Pmu s
 National conference on Engineering Innovations and Solutions (NCEIS 2018) International Journal of Scientific Research in Computer Science, Engineering and Information Technology 2018 IJSRCSEIT Volume
False Data Injection Attacks Against Nonlinear State Estimation in Smart Power Grids
 1 False Data Injection Attacks Against Nonlinear State Estimation in Smart Power rids Md. Ashfaqur Rahman and Hamed Mohsenian-Rad Department of Electrical and Computer Engineering, Texas Tech University,
PowerApps Optimal Power Flow Formulation
 PowerApps Optimal Power Flow Formulation Page1 Table of Contents 1 OPF Problem Statement... 3 1.1 Vector u... 3 1.1.1 Costs Associated with Vector [u] for Economic Dispatch... 4 1.1.2 Costs Associated
CHAPTER 2 LOAD FLOW ANALYSIS FOR RADIAL DISTRIBUTION SYSTEM
 16 CHAPTER 2 LOAD FLOW ANALYSIS FOR RADIAL DISTRIBUTION SYSTEM 2.1 INTRODUCTION Load flow analysis of power system network is used to determine the steady state solution for a given set of bus loading
MEASUREMENTS that are telemetered to the control
 2006 IEEE TRANSACTIONS ON POWER SYSTEMS, VOL. 19, NO. 4, NOVEMBER 2004 Auto Tuning of Measurement Weights in WLS State Estimation Shan Zhong, Student Member, IEEE, and Ali Abur, Fellow, IEEE Abstract This
MEASUREMENT CALIBRATION/TUNING & TOPOLOGY PROCESSING IN POWER SYSTEM STATE ESTIMATION. A Dissertation SHAN ZHONG
 MEASUREMENT CALIBRATION/TUNING & TOPOLOGY PROCESSING IN POWER SYSTEM STATE ESTIMATION A Dissertation by SHAN ZHONG Submitted to the Office of Graduate Studies of Texas A&M University in partial fulfillment
SECTION 5: POWER FLOW. ESE 470 Energy Distribution Systems
 SECTION 5: POWER FLOW ESE 470 Energy Distribution Systems 2 Introduction Nodal Analysis 3 Consider the following circuit Three voltage sources VV sss, VV sss, VV sss Generic branch impedances Could be
Critical Measurement Set with PMU for Hybrid State Estimation
 6th NATIONAL POWER SYSTEMS CONFERENCE, 5th-th DECEMBER, 200 25 Critical Measurement Set with for Hybrid State Estimation K.Jamuna and K.S.Swarup Department of Electrical Engineering Indian Institute of
= V I = Bus Admittance Matrix. Chapter 6: Power Flow. Constructing Ybus. Example. Network Solution. Triangular factorization. Let
 Chapter 6: Power Flow Network Matrices Network Solutions Newton-Raphson Method Fast Decoupled Method Bus Admittance Matri Let I = vector of currents injected into nodes V = vector of node voltages Y bus
OPTIMAL PLACEMENT AND UTILIZATION OF PHASOR MEASUREMENTS FOR STATE ESTIMATION
 OPTIMAL PLACEMENT AND UTILIZATION OF PHASOR MEASUREMENTS FOR STATE ESTIMATION Xu Bei, Yeo Jun Yoon and Ali Abur Teas A&M University College Station, Teas, U.S.A. abur@ee.tamu.edu Abstract This paper presents
Cyber Attacks, Detection and Protection in Smart Grid State Estimation
 1 Cyber Attacks, Detection and Protection in Smart Grid State Estimation Yi Zhou, Student Member, IEEE Zhixin Miao, Senior Member, IEEE Abstract This paper reviews the types of cyber attacks in state estimation
Comparison of Power Flow Algorithms for inclusion in On-line Power Systems Operation Tools
 University of New Orleans ScholarWorks@UNO University of New Orleans Theses and Dissertations Dissertations and Theses 12-17-2010 Comparison of Power Flow Algorithms for inclusion in On-line Power Systems
On the Use of PMUs in Power System State Estimation
 On the Use of PMUs in Power System State Estimation Antonio Gómez-Expósito Ali Abur Patricia Rousseaux University of Seville Northeastern University University of Liège Seville, Spain Boston, USA Liège,
1 Unified Power Flow Controller (UPFC)
") Power flow control with UPFC Rusejla Sadikovic Internal report 1 Unified Power Flow Controller (UPFC) The UPFC can provide simultaneous control of all basic power system parameters ( transmission voltage,
Power flow control with UPFC Rusejla Sadikovic Internal report 1 Unified Power Flow Controller (UPFC) The UPFC can provide simultaneous control of all basic power system parameters ( transmission voltage,
State Estimation and Power Flow Analysis of Power Systems
 JOURNAL OF COMPUTERS, VOL. 7, NO. 3, MARCH 01 685 State Estimation and Power Flow Analysis of Power Systems Jiaxiong Chen University of Kentucky, Lexington, Kentucky 40508 U.S.A. Email: jch@g.uky.edu Yuan
POWER SYSTEM DYNAMIC STATE ESTIMATION and LOAD MODELING. Cem Bila
 POWER SYSTEM DYNAMIC STATE ESTIMATION and LOAD MODELING A Thesis Presented by Cem Bila to The Department of Electrical and Computer Engineering in partial fulfillment of the requirements for the degree
CÁTEDRA ENDESA DE LA UNIVERSIDAD DE SEVILLA
 Detection of System Disturbances Using Sparsely Placed Phasor Measurements Ali Abur Department of Electrical and Computer Engineering Northeastern University, Boston abur@ece.neu.edu CÁTEDRA ENDESA DE
Mixed Integer Linear Programming and Nonlinear Programming for Optimal PMU Placement
 Mied Integer Linear Programg and Nonlinear Programg for Optimal PMU Placement Anas Almunif Department of Electrical Engineering University of South Florida, Tampa, FL 33620, USA Majmaah University, Al
A NEW STATE TRANSITION MODEL FOR FORECASTING-AIDED STATE ESTIMATION FOR THE GRID OF THE FUTURE
 A NEW STATE TRANSITION MODEL FOR FORECASTING-AIDED STATE ESTIMATION FOR THE GRID OF THE FUTURE MOHAMMAD HASSANZADEH Dissertation submitted to the faculty of the Virginia Polytechnic Institute and State
A Term Project report on. State Estimation of Power Systems Using Weighted Least Squares Optimization Technique
 MA5630 Numerical Optimization Course Instructor: Prof. Allan A. Struthers A Term Project report on State Estimation of Power Systems Using Weighted Least Squares Optimization Technique Submitted by Alorf,
UNCONVENTIONAL FINITE ELEMENT MODELS FOR NONLINEAR ANALYSIS OF BEAMS AND PLATES
 UNCONVENTIONAL FINITE ELEMENT MODELS FOR NONLINEAR ANALYSIS OF BEAMS AND PLATES A Thesis by WOORAM KIM Submitted to the Office of Graduate Studies of Texas A&M University in partial fulfillment of the
EE5250 TERM PROJECT. Report by: Akarsh Sheilendranath
 EE5250 TERM PROJECT Analytical Approaches for Optimal Placement of Distributed Generation Sources in Power System Caisheng Wang, student member, IEEE, and M. Hashem Nehrir, senior member, IEEE Report by:
HIERARCHICAL STATE ESTIMATION FOR WIDE AREA POWER SYSTEMS
 Clemson University TigerPrints All Theses Theses 12-2006 HIERARCHICAL STATE ESTIMATION FOR WIDE AREA POWER SYSTEMS Srivatsan Lakshminarasimhan Clemson University, slakshm@osii.com Follow this and additional
State estimation in distribution grids
 State estimation in distribution grids Ratmir Gelagaev, Pieter Vermeyen, Johan Driesen ELECTA ESAT, Katholieke Universiteit Leuven, Belgium, email: ratmir.gelagaev@esat.kuleuven.be Abstract Problems and
Identifying Critical Measurements in the Power System Network
 Identifying Critical Measurements in the Power System Network 1 Kenedy Aliila Greyson and 2 Anant Oonsivilai School of Electrical Engineering, Institute of Engineering, Suranaree University of Technology
ECEN 615 Methods of Electric Power Systems Analysis Lecture 18: Least Squares, State Estimation
 ECEN 615 Methods of Electric Power Systems Analysis Lecture 18: Least Squares, State Estimation Prof. om Overbye Dept. of Electrical and Computer Engineering exas A&M University overbye@tamu.edu Announcements
The N k Problem using AC Power Flows
 The N k Problem using AC Power Flows Sean Harnett 5-19-2011 Outline Introduction AC power flow model The optimization problem Some results Goal: find a small set of lines whose removal will cause the power
Power System State Estimation and Optimal Measurement Placement for Distributed Multi-Utility Operation
 PSERC Power System State Estimation and Optimal Measurement Placement for Distributed Multi-Utility Operation Final Project Report Power Systems Engineering Research Center A National Science Foundation
Smart Grid State Estimation by Weighted Least Square Estimation
 International Journal of Engineering and Advanced Technology (IJEAT) ISSN: 2249 8958, Volume-5, Issue-6, August 2016 Smart Grid State Estimation by Weighted Least Square Estimation Nithin V G, Libish T
OPTIMAL DISPATCH OF REAL POWER GENERATION USING PARTICLE SWARM OPTIMIZATION: A CASE STUDY OF EGBIN THERMAL STATION
 OPTIMAL DISPATCH OF REAL POWER GENERATION USING PARTICLE SWARM OPTIMIZATION: A CASE STUDY OF EGBIN THERMAL STATION Onah C. O. 1, Agber J. U. 2 and Ikule F. T. 3 1, 2, 3 Department of Electrical and Electronics
Congestion Alleviation using Reactive Power Compensation in Radial Distribution Systems
 IOSR Journal of Electrical and Electronics Engineering (IOSR-JEEE) e-issn: 2278-1676,p-ISSN: 2320-3331, Volume 11, Issue 6 Ver. III (Nov. Dec. 2016), PP 39-45 www.iosrjournals.org Congestion Alleviation
Power System Analysis Prof. A. K. Sinha Department of Electrical Engineering Indian Institute of Technology, Kharagpur. Lecture - 21 Power Flow VI
 Power System Analysis Prof. A. K. Sinha Department of Electrical Engineering Indian Institute of Technology, Kharagpur Lecture - 21 Power Flow VI (Refer Slide Time: 00:57) Welcome to lesson 21. In this
STATE ESTIMATION IN DISTRIBUTION SYSTEMS
 SAE ESIMAION IN DISRIBUION SYSEMS 2015 CIGRE Grid of the Future Symposium Chicago (IL), October 13, 2015 L. Garcia-Garcia, D. Apostolopoulou Laura.GarciaGarcia@ComEd.com Dimitra.Apostolopoulou@ComEd.com
Optimal PMU Placement
 Optimal PMU Placement S. A. Soman Department of Electrical Engineering Indian Institute of Technology Bombay Dec 2, 2011 PMU Numerical relays as PMU System Observability Control Center Architecture WAMS
LINE FLOW ANALYSIS OF IEEE BUS SYSTEM WITH THE LOAD SENSITIVITY FACTOR
 LINE FLOW ANALYSIS OF IEEE BUS SYSTEM WITH THE LOAD SENSITIVITY FACTOR Puneet Sharma 1, Jyotsna Mehra 2, Virendra Kumar 3 1,2,3 M.Tech Research scholar, Galgotias University, Greater Noida, India Abstract
Introduction to State Estimation of Power Systems ECG 740
 Introduction to State Estimation of Power Systems ECG 740 Introduction To help avoid major system failures, electric utilities have installed extensive supervisory control and data acquisition (SCADA)
PMU-Based Power System Real-Time Stability Monitoring. Chen-Ching Liu Boeing Distinguished Professor Director, ESI Center
 PMU-Based Power System Real-Time Stability Monitoring Chen-Ching Liu Boeing Distinguished Professor Director, ESI Center Dec. 2015 Real-Time Monitoring of System Dynamics EMS Real-Time Data Server Ethernet
A Novel Technique to Improve the Online Calculation Performance of Nonlinear Problems in DC Power Systems
 electronics Article A Novel Technique to Improve the Online Calculation Performance of Nonlinear Problems in DC Power Systems Qingshan Xu 1, Yuqi Wang 1, * ID, Minjian Cao 1 and Jiaqi Zheng 2 1 School
UNCERTAINTY-DRIVEN ADAPTIVE ESTIMATION WITH APPLICATIONS IN ELECTRICAL POWER SYSTEMS
 UNCERTAINTY-DRIVEN ADAPTIVE ESTIMATION WITH APPLICATIONS IN ELECTRICAL POWER SYSTEMS Jinghe Zhang A dissertation submitted to the faculty of the University of North Carolina at Chapel Hill in partial fulfillment
AS conceived during the 1970 s [1], [2], [3], [4] State
![AS conceived during the 1970 s [1], [2], [3], [4] State](/thumbs/88/116658926.jpg "AS conceived during the 1970 s [1], [2], [3], [4] State") A Framework for Estimation of Power Systems Based on Synchronized Phasor Measurement Data Luigi Vanfretti, Student Member, IEEE, Joe H. Chow, Fellow, IEEE, Sanjoy Sarawgi, Member, IEEE, Dean Ellis and
A Framework for Estimation of Power Systems Based on Synchronized Phasor Measurement Data Luigi Vanfretti, Student Member, IEEE, Joe H. Chow, Fellow, IEEE, Sanjoy Sarawgi, Member, IEEE, Dean Ellis and
A POWER FLOW CONTROL STRATEGY FOR FACTS DEVICES
 A POWER FLOW CONTROL STRATEGY FOR FACTS DEVICES RUSEJLA SADIKOVIC, ETH ZÜRICH, SWITZERLAND, sadikovic@eeh.ee.ethz.ch GÖRAN ANDERSSON, ETH ZÜRICH, SWITZERLAND, andersson@eeh.ee.ethz.ch PETR KORBA, ABB,
ECE 476. Exam #2. Tuesday, November 15, Minutes
 Name: Answers ECE 476 Exam #2 Tuesday, November 15, 2016 75 Minutes Closed book, closed notes One new note sheet allowed, one old note sheet allowed 1. / 20 2. / 20 3. / 20 4. / 20 5. / 20 Total / 100
Hierarchical State Estimation Using Phasor Measurement Units
 Herarchcal State Estmaton Usng Phasor Measurement Unts Al Abur Northeastern Unversty Benny Zhao (CA-ISO) and Yeo-Jun Yoon (KPX) IEEE PES GM, Calgary, Canada State Estmaton Workng Group Meetng July 28,
Fast Real-Time DC State Estimation in Electric Power Systems Using Belief Propagation
 Fast Real-Time DC State Estimation in Electric Power Systems Using Belief Propagation Mirsad Cosovic, Student Member, IEEE, Dejan Vukobratovic, Member, IEEE arxiv:170501376v2 [csit] 11 Aug 2017 Abstract
Analytical Study Based Optimal Placement of Energy Storage Devices in Distribution Systems to Support Voltage and Angle Stability
 University of Wisconsin Milwaukee UWM Digital Commons Theses and Dissertations June 2017 Analytical Study Based Optimal Placement of Energy Storage Devices in Distribution Systems to Support Voltage and
Power Grid State Estimation after a Cyber-Physical Attack under the AC Power Flow Model
 Power Grid State Estimation after a Cyber-Physical Attack under the AC Power Flow Model Saleh Soltan, Gil Zussman Department of Electrical Engineering Columbia University, New York, NY Email: {saleh,gil}@ee.columbia.edu
WIDE AREA CONTROL THROUGH AGGREGATION OF POWER SYSTEMS
 WIDE AREA CONTROL THROUGH AGGREGATION OF POWER SYSTEMS Arash Vahidnia B.Sc, M.Sc in Electrical Engineering A Thesis submitted in partial fulfilment of the requirements for the degree of Doctor of Philosophy
ELEC4612 Power System Analysis Power Flow Analysis
 ELEC462 Power Sstem Analsis Power Flow Analsis Dr Jaashri Ravishankar jaashri.ravishankar@unsw.edu.au Busbars The meeting point of various components of a PS is called bus. The bus or busbar is a conductor
A Fast Solution for the Lagrange Multiplier-Based Electric Power Network Parameter Error Identification Model
 Energies 2014, 7, 1288-1299; doi:10.3390/en7031288 Article OPE ACCESS energies ISS 1996-1073 www.mdpi.com/journal/energies A Fast Solution for the Lagrange ultiplier-based Electric Power etwork Parameter
SINGLE OBJECTIVE RISK- BASED TRANSMISSION EXPANSION
 Vol.2, Issue.1, Jan-Feb 2012 pp-424-430 ISSN: 2249-6645 SINGLE OBJECTIVE RISK- BASED TRANSMISSION EXPANSION V.Sumadeepthi 1, K.Sarada 2 1 (Student, Department of Electrical and Electronics Engineering,
An Accelerated Block-Parallel Newton Method via Overlapped Partitioning
 An Accelerated Block-Parallel Newton Method via Overlapped Partitioning Yurong Chen Lab. of Parallel Computing, Institute of Software, CAS (http://www.rdcps.ac.cn/~ychen/english.htm) Summary. This paper
Estimating Feasible Nodal Power Injections in Distribution Networks
 Estimating Feasible Nodal Power Injections in Distribution Networks Abdullah Al-Digs The University of British Columbia Vancouver, BC V6T 1Z4 Email: aldigs@ece.ubc.ca Sairaj V. Dhople University of Minnesota
New criteria for Voltage Stability evaluation in interconnected power system
 New criteria for Stability evaluation in interconnected power system Lavanya Neerugattu Dr.G.S Raju MTech Student, Dept.Of EEE Former Director IT, BHU Email: nlr37@gmail.com Visiting Professor VNR Vignana
Regular paper. Particle Swarm Optimization Applied to the Economic Dispatch Problem
 Rafik Labdani Linda Slimani Tarek Bouktir Electrical Engineering Department, Oum El Bouaghi University, 04000 Algeria. rlabdani@yahoo.fr J. Electrical Systems 2-2 (2006): 95-102 Regular paper Particle
arxiv: v1 [math.oc] 8 Nov 2010
![arxiv: v1 [math.oc] 8 Nov 2010](/thumbs/72/67505147.jpg "arxiv: v1 [math.oc] 8 Nov 2010") A Cyber Security Study of a SCADA Energy Management System: Stealthy Deception Attacks on the State Estimator arxiv:1011.1828v1 [math.oc] 8 Nov 2010 Abstract André Teixeira a György Dán b Henrik Sandberg
A Cyber Security Study of a SCADA Energy Management System: Stealthy Deception Attacks on the State Estimator arxiv:1011.1828v1 [math.oc] 8 Nov 2010 Abstract André Teixeira a György Dán b Henrik Sandberg
Simultaneous placement of Distributed Generation and D-Statcom in a radial distribution system using Loss Sensitivity Factor
 Simultaneous placement of Distributed Generation and D-Statcom in a radial distribution system using Loss Sensitivity Factor 1 Champa G, 2 Sunita M N University Visvesvaraya college of Engineering Bengaluru,
2015 IEEE. Digital Object Identifier: /PTC
 2015 IEEE. Personal use of this material is permitted. Permission from IEEE must be obtained for all other users, including reprinting/ republishing this material for advertising or promotional purposes,
INSTITUTE OF AERONAUTICAL ENGINEERING (Autonomous)
") INSTITUTE OF AERONAUTICAL ENGINEERING (Autonomous) Dundigal, Hyderabad - 500 043 ELECTRICAL AND ELECTRONICS ENGINEERING QUESTION BANK Course Name : Computer Methods in Power Systems Course Code : A60222
INSTITUTE OF AERONAUTICAL ENGINEERING (Autonomous) Dundigal, Hyderabad - 500 043 ELECTRICAL AND ELECTRONICS ENGINEERING QUESTION BANK Course Name : Computer Methods in Power Systems Course Code : A60222
668 IEEE TRANSACTIONS ON POWER SYSTEMS, VOL. 24, NO. 2, MAY 2009
 668 IEEE TRANSACTIONS ON POWER SYSTEMS, VOL. 24, NO. 2, MAY 2009 Measurement Placement in Distribution System State Estimation Ravindra Singh, Student Member, IEEE, Bikash C. Pal, Senior Member, IEEE,
CURENT Course Power System Coherency and Model Reduction
 CURENT Course Power System Coherency and Model Reduction Prof. Joe H. Chow Rensselaer Polytechnic Institute ECSE Department November 1, 2017 Slow Coherency A large power system usually consists of tightly
B.E. / B.Tech. Degree Examination, April / May 2010 Sixth Semester. Electrical and Electronics Engineering. EE 1352 Power System Analysis
 B.E. / B.Tech. Degree Examination, April / May 2010 Sixth Semester Electrical and Electronics Engineering EE 1352 Power System Analysis (Regulation 2008) Time: Three hours Answer all questions Part A (10
State Estimation in Power Distribution Systems
 State Estimation in Power Distribution Systems by Côme Carquex A thesis presented to the University of Waterloo in fulfillment of the thesis requirement for the degree of Master of Applied Science in Electrical
Incorporation of Asynchronous Generators as PQ Model in Load Flow Analysis for Power Systems with Wind Generation
 Incorporation of Asynchronous Generators as PQ Model in Load Flow Analysis for Power Systems with Wind Generation James Ranjith Kumar. R, Member, IEEE, Amit Jain, Member, IEEE, Power Systems Division,
Detection and Identification of Data Attacks in Power System
 2012 American Control Conference Fairmont Queen Elizabeth, Montréal, Canada June 27-June 29, 2012 Detection and Identification of Data Attacks in Power System Kin Cheong Sou, Henrik Sandberg and Karl Henrik
ESTIMATING STATISTICAL CHARACTERISTICS UNDER INTERVAL UNCERTAINTY AND CONSTRAINTS: MEAN, VARIANCE, COVARIANCE, AND CORRELATION ALI JALAL-KAMALI
 ESTIMATING STATISTICAL CHARACTERISTICS UNDER INTERVAL UNCERTAINTY AND CONSTRAINTS: MEAN, VARIANCE, COVARIANCE, AND CORRELATION ALI JALAL-KAMALI Department of Computer Science APPROVED: Vladik Kreinovich,
COMPARISON OF STATISTICAL ALGORITHMS FOR POWER SYSTEM LINE OUTAGE DETECTION
 COMPARISON OF STATISTICAL ALGORITHMS FOR POWER SYSTEM LINE OUTAGE DETECTION Georgios Rovatsos*, Xichen Jiang*, Alejandro D. Domínguez-García, and Venugopal V. Veeravalli Department of Electrical and Computer
Basic Concepts in Data Reconciliation. Chapter 6: Steady-State Data Reconciliation with Model Uncertainties
 Chapter 6: Steady-State Data with Model Uncertainties CHAPTER 6 Steady-State Data with Model Uncertainties 6.1 Models with Uncertainties In the previous chapters, the models employed in the DR were considered
Data-Driven Joint Topology and Line Parameter Estimation for Renewable Integration
 Data-Driven Joint Topology and Line Parameter Estimation for Renewable Integration Jiafan Yu Dept. of Electrical Engineering Email: jfy@stanford.edu Yang Weng Stanford Sustainable Systems Lab Email: yangweng@stanford.edu
EE 581 Power Systems. Admittance Matrix: Development, Direct and Iterative solutions
 EE 581 Power Systems Admittance Matrix: Development, Direct and Iterative solutions Overview and HW # 8 Chapter 2.4 Chapter 6.4 Chapter 6.1-6.3 Homework: Special Problem 1 and 2 (see handout) Overview
An Equivalent Circuit Formulation of the Power Flow Problem with Current and Voltage State Variables
 An Equivalent Circuit Formulation of the Power Flow Problem with Current and Voltage State Variables David M. Bromberg, Marko Jereminov, Xin Li, Gabriela Hug, Larry Pileggi Dept. of Electrical and Computer
ECEN 615 Methods of Electric Power Systems Analysis Lecture 19: State Estimation
 ECEN 615 Methods of Electric Power Systems Analysis Lecture 19: State Estimation Prof. Tom Overbye Dept. of Electrical and Computer Engineering Texas A&M University overbye@tamu.edu Announcements Homework
Performance analysis and comparison of load flow methods in a practical distribution system
 Performance analysis and comparison of load flow methods in a practical distribution system B.Muruganantham Dept. of Electrical and Electronics Engineering Pondicherry Engineering College Puducherry -
An Efficient Decoupled Power Flow Control Method by use of Phase Shifting Transformers
 FACTA UNIVERSITATIS (NIŠ) SER.: ELEC. ENERG. vol. 17, April 2004, 111-119 An Efficient Decoupled Power Flow Control Method by use of Phase Shifting Transformers Dragan P. Popović Abstract: This paper presents
Architectures and Algorithms for Distributed Generation Control of Inertia-Less AC Microgrids
 Architectures and Algorithms for Distributed Generation Control of Inertia-Less AC Microgrids Alejandro D. Domínguez-García Coordinated Science Laboratory Department of Electrical and Computer Engineering
ADEQUACY ASSESSMENT IN POWER SYSTEMS USING GENETIC ALGORITHM AND DYNAMIC PROGRAMMING. A Thesis DONGBO ZHAO
 ADEQUACY ASSESSMENT IN POWER SYSTEMS USING GENETIC ALGORITHM AND DYNAMIC PROGRAMMING A Thesis by DONGBO ZHAO Submitted to the Office of Graduate Studies of Texas A&M University in partial fulfillment of
Power Flow Analysis of Radial Distribution System using Backward/Forward Sweep Method
 Power Flow Analysis of Radial Distribution System using Backward/Forward Sweep Method Gurpreet Kaur 1, Asst. Prof. Harmeet Singh Gill 2 1,2 Department of Electrical Engineering, Guru Nanak Dev Engineering
Sparse Error Correction from Nonlinear Measurements with Applications in Bad Data Detection for Power Networks
 Sparse Error Correction from Nonlinear Measurements with Applications in Bad Data Detection for Power Networks 1 Weiyu Xu, Meng Wang, Jianfeng Cai and Ao Tang arxiv:1112.6234v2 [cs.it] 5 Jan 2013 Abstract
Optimal PMU Placement for Power System State Estimation with Random Communication Packet Losses
 2011 9th IEEE International Conference on Control and Automation (ICCA) Santiago, Chile, December 19-21, 2011 TueB1.1 Optimal PMU Placement for Power System State Estimation with Random Communication Packet
Wide Area Measurement Applications for Improvement of Power System Protection
 Wide Area Measurement Applications for Improvement of Power System Protection Mutmainna Tania Dissertation submitted to the faculty of the Virginia Polytechnic Institute and State University in partial
Saturation of Information Exchange in Locally Connected Pulse-Coupled Oscillators
 Saturation of Information Exchange in Locally Connected Pulse-Coupled Oscillators Will Wagstaff School of Computer Science, Georgia Institute of Technology, Atlanta, Georgia 30332, USA (Dated: 13 December
State Estimation Introduction 2.0 Exact Pseudo-measurments
 State Estimation. Introduction In these notes, we eplore two very practical and related issues in regards to state estimation: - use of pseudo-measurements - network observability. Eact Pseudo-measurments
Algebra of Random Variables: Optimal Average and Optimal Scaling Minimising
 Review: Optimal Average/Scaling is equivalent to Minimise χ Two 1-parameter models: Estimating < > : Scaling a pattern: Two equivalent methods: Algebra of Random Variables: Optimal Average and Optimal
Finite Elements for Nonlinear Problems
 Finite Elements for Nonlinear Problems Computer Lab 2 In this computer lab we apply finite element method to nonlinear model problems and study two of the most common techniques for solving the resulting
Voltage Stability Monitoring using a Modified Thevenin Impedance
 Voltage Stability Monitoring using a Modified Thevenin mpedance S. Polster and H. Renner nstitute of Electrical Power Systems Graz University of Technology Graz, Austria Abstract This paper presents a
Real power-system economic dispatch using a variable weights linear programming method
 Open Access Journal Journal of Power Technologies 95 (1) (2015) 34 39 journal homepage:papers.itc.pw.edu.pl Real power-system economic dispatch using a variable weights linear programming method M. Rahli,
ECE 422/522 Power System Operations & Planning/Power Systems Analysis II : 7 - Transient Stability
 ECE 4/5 Power System Operations & Planning/Power Systems Analysis II : 7 - Transient Stability Spring 014 Instructor: Kai Sun 1 Transient Stability The ability of the power system to maintain synchronism
Appendix A Solving Systems of Nonlinear Equations
 Appendix A Solving Systems of Nonlinear Equations Chapter 4 of this book describes and analyzes the power flow problem. In its ac version, this problem is a system of nonlinear equations. This appendix
Course notes for EE394V Restructured Electricity Markets: Locational Marginal Pricing
 Course notes for EE394V Restructured Electricity Markets: Locational Marginal Pricing Ross Baldick Copyright c 2013 Ross Baldick www.ece.utexas.edu/ baldick/classes/394v/ee394v.html Title Page 1 of 132
FLEXIBLE ac transmission system (FACTS) devices give
 devices give") 694 IEEE TRANSACTIONS ON POWER DELIVERY, VOL. 19, NO. 2, APRIL 2004 A Newton-Type Current Injection Model of UPFC for Studying Low-Frequency Oscillations Kwang M. Son, Member, IEEE, and Robert H. Lasseter,
694 IEEE TRANSACTIONS ON POWER DELIVERY, VOL. 19, NO. 2, APRIL 2004 A Newton-Type Current Injection Model of UPFC for Studying Low-Frequency Oscillations Kwang M. Son, Member, IEEE, and Robert H. Lasseter,
Minimization of Energy Loss using Integrated Evolutionary Approaches
 Minimization of Energy Loss using Integrated Evolutionary Approaches Attia A. El-Fergany, Member, IEEE, Mahdi El-Arini, Senior Member, IEEE Paper Number: 1569614661 Presentation's Outline Aim of this work,
POWER flow studies are the cornerstone of power system
 University of Wisconsin-Madison Department of Electrical and Computer Engineering. Technical Report ECE-2-. A Sufficient Condition for Power Flow Insolvability with Applications to Voltage Stability Margins
On Computing Power System Steady-State Stability Using Synchrophasor Data
 3 46th Hawaii International Conference on System Sciences On Computing Power System Steady-State Stability Using Synchrophasor Data Karl E. Reinhard Dept of Electrical & Computer Engr Univ of Illinois
Lossy DC Power Flow. John W. Simpson-Porco. Universidad de Chile Santiago, Chile. March 2, 2017
 Lossy DC Power Flow John W. Simpson-Porco Universidad de Chile Santiago, Chile March 2, 2017 Our 20th Century Bulk Power System A large-scale, nonlinear, hybrid, stochastic, distributed, cyber-physical...
Robust Dynamic State Estimation. In Power Systems
 Robust Dynamic State Estimation In Power Systems A Dissertation Presented by Alireza Rouhani to The Department of Electrical and Computer Engineering in partial fulfillment of the requirements for the
Optimal Placement & sizing of Distributed Generator (DG)
") Chapter - 5 Optimal Placement & sizing of Distributed Generator (DG) - A Single Objective Approach CHAPTER - 5 Distributed Generation (DG) for Power Loss Minimization 5. Introduction Distributed generators
Chapter - 5 Optimal Placement & sizing of Distributed Generator (DG) - A Single Objective Approach CHAPTER - 5 Distributed Generation (DG) for Power Loss Minimization 5. Introduction Distributed generators
Multi-Robotic Systems
 CHAPTER 9 Multi-Robotic Systems The topic of multi-robotic systems is quite popular now. It is believed that such systems can have the following benefits: Improved performance ( winning by numbers ) Distributed
Enforcing Passivity for Admittance Matrices Approximated by Rational Functions
 IEEE TRANSACTIONS ON POWER SYSTEMS, VOL. 16, NO. 1, FEBRUARY 2001 97 Enforcing Passivity for Admittance Matrices Approximated by Rational Functions Bjørn Gustavsen, Member, IEEE and Adam Semlyen, Life
APPLICATIONS OF SENSITIVITY ANALYSIS IN PLANNING AND OPERATION OF MODERN POWER SYSTEMS. Mohammed Ben-Idris
 APPLICATIONS OF SENSITIVITY ANALYSIS IN PLANNING AND OPERATION OF MODERN POWER SYSTEMS By Mohammed Ben-Idris A DISSERTATION Submitted to Michigan State University in partial fulfillment of the requirements