k-means clustering mark = which(md == min(md)) nearest[i] = ifelse(mark <= 5, "blue", "orange")}
|
|
|
- Kelley Underwood
- 5 years ago
- Views:
Transcription
1 1 / 16 k-means clustering km15 = kmeans(x[g==0,],5) km25 = kmeans(x[g==1,],5) for(i in 1:6831){ md = c(mydist(xnew[i,],km15$center[1,]),mydist(xnew[i,],km15$center[2, mydist(xnew[i,],km15$center[3,]),mydist(xnew[i,],km15$center[4,]), mydist(xnew[i,],km15$center[5,]),mydist(xnew[i,],km25$center[1,]), mydist(xnew[i,],km25$center[2,]),mydist(xnew[i,],km25$center[3,]), mydist(xnew[i,],km25$center[4,]),mydist(xnew[i,],km25$center[5,])) mark = which(md == min(md)) nearest[i] = ifelse(mark <= 5, "blue", "orange")} plot(xnew, type="n", xlab = "x1", ylab = "x2", main= "kmeans with 5 cluster centers") points(xnew, col=nearest, pch=".") points(km25$centers, col="orange", pch=19, cex=2) points(km15$centers, col="blue", pch=19, cex=2) points(x, col= ifelse(g==0, "blue","orange"))
2 kmeans with 2 cluster centers kmeans with 5 cluster centers x x x x1 data(mixture.example) p.16: m 1k N 2 {(1, 0), I}, k = 1,..., 10; m 2k N 2 {(0, 1), I}, k = 1,..., 10 bluex <- mvrnorm(100, mu = m1[sample(10,1),], Sigma = matrix(c(1,0,0,1),ncol=2))
3 3 / 16 The curse of dimensionality ( 2.5) local in R 1 is quite different than local in R p Example: each feature variable uniformly distributed on (0, 1). want 10% of the sample in R 1 : need a window of length 0.1. want 10% of the sample in R p : need a box with edge length 0.1 1/10 = 0.80 on each axis need a window of length 0.8. Figure 2.6
4
5 5 / curse Example: N data points uniformly distributed on a unit ball in R p. Distance from the origin to the nearest data point? Median: ( /N ) 1/p 0.52 if p = 10, N = 500. median distance N=500 N=100 N= dimension
6 6 / 16 Cluster Analysis ( 14.3) discover groupings among the cases; cases within clusters should be close and clusters should be far apart Figure 14.4 many (not all) clustering methods use as input an N N matrix D of dissimilarities require D ii > 0, D ii = D i i and D ii = 0 sometimes the data are collected this way (see ) more often D needs to be constructed from the N p data matrix often (usually) D ii = p j=1 d j(x ij, x i j), where d j (, ) to be chosen, e.g. (x ij x i j) 2, x ij x i j, etc. See p 504, 505 for more details on choosing a type of dissimilarity matrix this can be done using dist or daisy (the latter in the R library cluster)
7 7 / cluster analysis dissimilarities for categorical features binary: simple matching uses Jacard coefficient uses D ii = (#{(1, 0) or (0, 1) pairs )/p D ii = (#{(1, 0)or(0, 1) pairs )/(#{(1, 0), (0, 1) or (1, 1) pairs ) ordered categories use ranks as continuous data (see eq. (14.23)) unordered categories create binary dummy variables and use matching
8 8 / cluster analysis dist(x, method = c("euclidean", "maximum", "manhattan", "canberra", "binary", "minkowski")) where maximum is max 1 j p (x ij x i j) and binary is Jacard coefficient. daisy(x, metric=c("euclidean", "manhattan", "gower") standardize=f, type=c("ordratio","logratio","asymm","symm") (see the help files) > x = matrix(rnorm(100),nrow=5) > dim(x) [1] 5 20 > dist(x)
9 Combinatorial algorithms suppose number of clusters K is fixed (K < N) C(i) = k if observation i is assigned to cluster k T = 1 N N D ii 2 i=1 i =1 = 1 K D ii + D ii 2 = 1 2 k=1 C(i)=k K C(i )=k k=1 C(i)=k C(i )=k = W (C) + B(C) D ii C(i ) k K k=1 C(i)=k C(i ) k W (C) is a measure of within cluster dissimilarity B(C) is a measure of between cluster dissimilarity T is fixed given the data: minimizing W (C) same as maximizing B(C) D ii 9 / 16
10 K-Means clustering ( ) most algorithms use a greedy approach by modifying a given clustering to decrease within cluster distance: analogous to forward selection in regression K -means clustering is (usually) based on Euclidean distance: D ii = x i x i 2, so x s should be centered and scaled (and continuous) Use the result 1 2 K k=1 C(i)=k C(i )=k x i x i 2 = K k=1 N k C(i)=k x i x k 2 where N k is the number of observations in cluster k and x k = ( x 1k,..., x pk ) is the mean in the kth cluster The algorithm starts with a current set of clusters, and computes the cluster means. Then assign observations to clusters by finding the cluster whose mean is closest. Recompute the cluster means and continue. 10 / 16
11 11 / 16 Constructing dissimilarity matrices dist(x, method = c("euclidean", "maximum", "manhattan", "canberra", "binary")) where maximum is max 1 j p (x ij x i j) and binary is Jacard coefficient. daisy(x, metric=c("euclidean", "manhattan", "gower"), standardize=f, type=c("ordratio","logratio "asymm","symm") (see the help files)
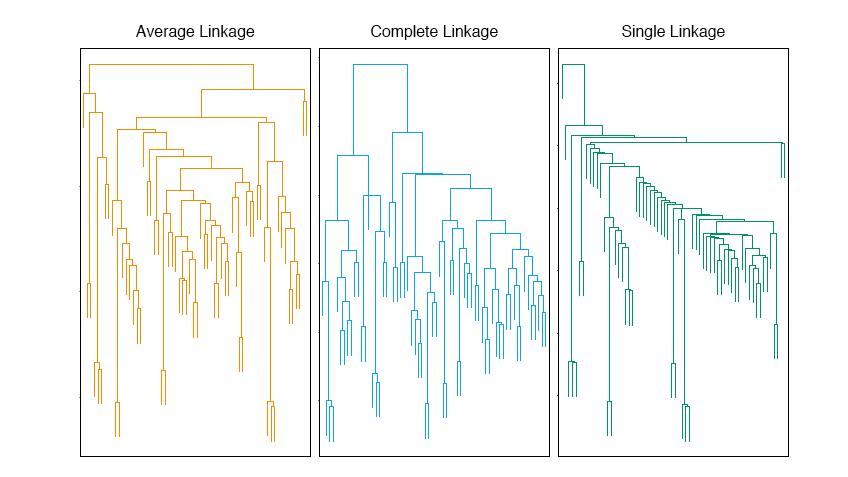
12 Hierarchical clustering no specification of number of clusters top down = divisive; bottom up = agglomerative bottom up: each value is a cluster, cluster the closest pair of points, iterate: find the closest pair of clusters C i and C i merge them need a measure for distance between points and between clusters (the clusters needn t be vectors) single link clustering measures the distance between clusters by the minimum distance d(c 1, C 2 ) = min i C1,i C 2 D ii susceptible to chaining ; long strings of points assigned to the same cluster sensitive to outliers complete linkage d(c 1, C 2 ) = max i C1,i C 2 D ii group average intermediate between complete and single linkage. 12 / 16
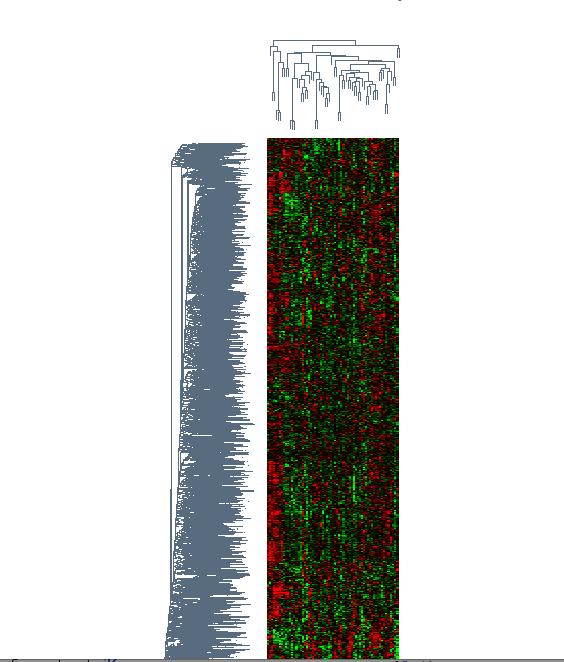
13 13 / hierarchical clustering easily pictured in a dendogram Figs and look is quite different for different linkages Implemented in R in hclust and agnes.
14
15
16
Clustering. CSL465/603 - Fall 2016 Narayanan C Krishnan
 Clustering CSL465/603 - Fall 2016 Narayanan C Krishnan ckn@iitrpr.ac.in Supervised vs Unsupervised Learning Supervised learning Given x ", y " "%& ', learn a function f: X Y Categorical output classification
Data Exploration and Unsupervised Learning with Clustering
 Data Exploration and Unsupervised Learning with Clustering Paul F Rodriguez,PhD San Diego Supercomputer Center Predictive Analytic Center of Excellence Clustering Idea Given a set of data can we find a
1 Basic Concept and Similarity Measures
 THE UNIVERSITY OF CHICAGO Graduate School of Business Business 41912, Spring Quarter 2016, Mr. Ruey S. Tsay Lecture 10: Cluster Analysis and Multidimensional Scaling 1 Basic Concept and Similarity Measures
Multivariate Statistics: Hierarchical and k-means cluster analysis
 Multivariate Statistics: Hierarchical and k-means cluster analysis Steffen Unkel Department of Medical Statistics University Medical Center Goettingen, Germany Summer term 217 1/43 What is a cluster? Proximity
Unsupervised machine learning
 Chapter 9 Unsupervised machine learning Unsupervised machine learning (a.k.a. cluster analysis) is a set of methods to assign objects into clusters under a predefined distance measure when class labels
Multivariate Analysis
 Multivariate Analysis Chapter 5: Cluster analysis Pedro Galeano Departamento de Estadística Universidad Carlos III de Madrid pedro.galeano@uc3m.es Course 2015/2016 Master in Business Administration and
Clustering. Stephen Scott. CSCE 478/878 Lecture 8: Clustering. Stephen Scott. Introduction. Outline. Clustering.
 1 / 19 sscott@cse.unl.edu x1 If no label information is available, can still perform unsupervised learning Looking for structural information about instance space instead of label prediction function Approaches:
Principles of Pattern Recognition. C. A. Murthy Machine Intelligence Unit Indian Statistical Institute Kolkata
 Principles of Pattern Recognition C. A. Murthy Machine Intelligence Unit Indian Statistical Institute Kolkata e-mail: murthy@isical.ac.in Pattern Recognition Measurement Space > Feature Space >Decision
Overview of clustering analysis. Yuehua Cui
 Overview of clustering analysis Yuehua Cui Email: cuiy@msu.edu http://www.stt.msu.edu/~cui A data set with clear cluster structure How would you design an algorithm for finding the three clusters in this
Machine Learning - MT Clustering
 Machine Learning - MT 2016 15. Clustering Varun Kanade University of Oxford November 28, 2016 Announcements No new practical this week All practicals must be signed off in sessions this week Firm Deadline:
IDENTIFYING MULTIPLE OUTLIERS IN LINEAR REGRESSION : ROBUST FIT AND CLUSTERING APPROACH
 SESSION X : THEORY OF DEFORMATION ANALYSIS II IDENTIFYING MULTIPLE OUTLIERS IN LINEAR REGRESSION : ROBUST FIT AND CLUSTERING APPROACH Robiah Adnan 2 Halim Setan 3 Mohd Nor Mohamad Faculty of Science, Universiti
Multivariate Statistics
 Multivariate Statistics Chapter 6: Cluster Analysis Pedro Galeano Departamento de Estadística Universidad Carlos III de Madrid pedro.galeano@uc3m.es Course 2017/2018 Master in Mathematical Engineering
Data Mining: Data. Lecture Notes for Chapter 2. Introduction to Data Mining
 Data Mining: Data Lecture Notes for Chapter 2 Introduction to Data Mining by Tan, Steinbach, Kumar Similarity and Dissimilarity Similarity Numerical measure of how alike two data objects are. Is higher
Hierarchical Clustering
 Hierarchical Clustering Example for merging hierarchically Merging Apples Merging Oranges Merging Strawberries All together Hierarchical Clustering In hierarchical clustering the data are not partitioned
Clustering: K-means. -Applied Multivariate Analysis- Lecturer: Darren Homrighausen, PhD
 Clustering: K-means -Applied Multivariate Analysis- Lecturer: Darren Homrighausen, PhD 1 Clustering Introduction When clustering, we seek to simplify the data via a small(er) number of summarizing variables
Clustering. Genome 559: Introduction to Statistical and Computational Genomics Elhanan Borenstein. Some slides adapted from Jacques van Helden
 Clustering Genome 559: Introduction to Statistical and Computational Genomics Elhanan Borenstein Some slides adapted from Jacques van Helden Small vs. large parsimony A quick review Fitch s algorithm:
Lecture 5: Clustering, Linear Regression
 Lecture 5: Clustering, Linear Regression Reading: Chapter 10, Sections 3.1-3.2 STATS 202: Data mining and analysis October 4, 2017 1 / 22 .0.0 5 5 1.0 7 5 X2 X2 7 1.5 1.0 0.5 3 1 2 Hierarchical clustering
Lecture 5: Clustering, Linear Regression
 Lecture 5: Clustering, Linear Regression Reading: Chapter 10, Sections 3.1-3.2 STATS 202: Data mining and analysis October 4, 2017 1 / 22 Hierarchical clustering Most algorithms for hierarchical clustering
Machine Learning. Chao Lan
 Machine Learning Chao Lan Clustering and Dimensionality Reduction Clustering Kmeans DBSCAN Gaussian Mixture Model Dimensionality Reduction principal component analysis manifold learning Other Feature Processing
diversity(datamatrix, index= shannon, base=exp(1))
)") Tutorial 11: Diversity, Indicator Species Analysis, Cluster Analysis Calculating Diversity Indices The vegan package contains the command diversity() for calculating Shannon and Simpson diversity indices.
Tutorial 11: Diversity, Indicator Species Analysis, Cluster Analysis Calculating Diversity Indices The vegan package contains the command diversity() for calculating Shannon and Simpson diversity indices.
Cluster Analysis (Sect. 9.6/Chap. 14 of Wilks) Notes by Hong Li
 Notes by Hong Li") 77 Cluster Analysis (Sect. 9.6/Chap. 14 of Wilks) Notes by Hong Li 1) Introduction Cluster analysis deals with separating data into groups whose identities are not known in advance. In general, even the
77 Cluster Analysis (Sect. 9.6/Chap. 14 of Wilks) Notes by Hong Li 1) Introduction Cluster analysis deals with separating data into groups whose identities are not known in advance. In general, even the
DM534: Introduction to Computer Science Autumn term Exercise Clustering: Clustering, Color Histograms
 University of Southern Denmark IMADA Rolf Fagerberg Richard Roettger based on the work of Arthur Zimek DM: Introduction to Computer Science Autumn term 0 Exercise Clustering: Clustering, Color Histograms
Chapter 5: Microarray Techniques
 Chapter 5: Microarray Techniques 5.2 Analysis of Microarray Data Prof. Yechiam Yemini (YY) Computer Science Department Columbia University Normalization Clustering Overview 2 1 Processing Microarray Data
EDAMI DIMENSION REDUCTION BY PRINCIPAL COMPONENT ANALYSIS
 EDAMI DIMENSION REDUCTION BY PRINCIPAL COMPONENT ANALYSIS Mario Romanazzi October 29, 2017 1 Introduction An important task in multidimensional data analysis is reduction in complexity. Recalling that
Multivariate Analysis Cluster Analysis
 Multivariate Analysis Cluster Analysis Prof. Dr. Anselmo E de Oliveira anselmo.quimica.ufg.br anselmo.disciplinas@gmail.com Cluster Analysis System Samples Measurements Similarities Distances Clusters
Clustering. Genome 559: Introduction to Statistical and Computational Genomics Elhanan Borenstein. Some slides adapted from Jacques van Helden
 Clustering Genome 559: Introduction to Statistical and Computational Genomics Elhanan Borenstein Some slides adapted from Jacques van Helden Gene expression profiling A quick review Which molecular processes/functions
Applying cluster analysis to 2011 Census local authority data
 Applying cluster analysis to 2011 Census local authority data Kitty.Lymperopoulou@manchester.ac.uk SPSS User Group Conference November, 10 2017 Outline Basic ideas of cluster analysis How to choose variables
Support Vector Machine. Industrial AI Lab.
 Support Vector Machine Industrial AI Lab. Classification (Linear) Autonomously figure out which category (or class) an unknown item should be categorized into Number of categories / classes Binary: 2 different
STATISTICA MULTIVARIATA 2
 1 / 73 STATISTICA MULTIVARIATA 2 Fabio Rapallo Dipartimento di Scienze e Innovazione Tecnologica Università del Piemonte Orientale, Alessandria (Italy) fabio.rapallo@uniupo.it Alessandria, May 2016 2 /
Lecture 5: Clustering, Linear Regression
 Lecture 5: Clustering, Linear Regression Reading: Chapter 10, Sections 3.1-2 STATS 202: Data mining and analysis Sergio Bacallado September 19, 2018 1 / 23 Announcements Starting next week, Julia Fukuyama
Data Preprocessing. Cluster Similarity
 1 Cluster Similarity Similarity is most often measured with the help of a distance function. The smaller the distance, the more similar the data objects (points). A function d: M M R is a distance on M
Clustering Ambiguity: An Overview
 Clustering Ambiguity: An Overview John D. MacCuish Norah E. MacCuish 3 rd Joint Sheffield Conference on Chemoinformatics April 23, 2004 Outline The Problem: Clustering Ambiguity and Chemoinformatics Preliminaries:
2. Sample representativeness. That means some type of probability/random sampling.
 1 Neuendorf Cluster Analysis Model: X1 X2 X3 X4 X5 Clusters (Nominal variable) Y1 Y2 Y3 Clustering/Internal Variables External Variables Assumes: 1. Actually, any level of measurement (nominal, ordinal,
Machine Learning. Clustering 1. Hamid Beigy. Sharif University of Technology. Fall 1395
 Machine Learning Clustering 1 Hamid Beigy Sharif University of Technology Fall 1395 1 Some slides are taken from P. Rai slides Hamid Beigy (Sharif University of Technology) Machine Learning Fall 1395 1
Revision: Chapter 1-6. Applied Multivariate Statistics Spring 2012
 Revision: Chapter 1-6 Applied Multivariate Statistics Spring 2012 Overview Cov, Cor, Mahalanobis, MV normal distribution Visualization: Stars plot, mosaic plot with shading Outlier: chisq.plot Missing
CSE446: Clustering and EM Spring 2017
 CSE446: Clustering and EM Spring 2017 Ali Farhadi Slides adapted from Carlos Guestrin, Dan Klein, and Luke Zettlemoyer Clustering systems: Unsupervised learning Clustering Detect patterns in unlabeled
Unsupervised clustering of COMBO-17 galaxy photometry
 STScI Astrostatistics R tutorials Eric Feigelson (Penn State) November 2011 SESSION 2 Multivariate clustering and classification ***************** ***************** Unsupervised clustering of COMBO-17
Clustering Lecture 1: Basics. Jing Gao SUNY Buffalo
 Clustering Lecture 1: Basics Jing Gao SUNY Buffalo 1 Outline Basics Motivation, definition, evaluation Methods Partitional Hierarchical Density-based Mixture model Spectral methods Advanced topics Clustering
Data Mining 4. Cluster Analysis
 Data Mining 4. Cluster Analysis 4.2 Spring 2010 Instructor: Dr. Masoud Yaghini Outline Data Structures Interval-Valued (Numeric) Variables Binary Variables Categorical Variables Ordinal Variables Variables
Support Vector Machine. Industrial AI Lab. Prof. Seungchul Lee
 Support Vector Machine Industrial AI Lab. Prof. Seungchul Lee Classification (Linear) Autonomously figure out which category (or class) an unknown item should be categorized into Number of categories /
STAT 753 Homework 3 SOLUTIONS
 STAT 753 Homework 3 SOLUTIONS. Y Weibull distribution W (α, ). The survival function is given by S Y (y) = P r(y y) = e ( y α), y 0, α, > 0. (a) Cumulative distribution and its inverse functions. The cumulative
Clustering. Genome 373 Genomic Informatics Elhanan Borenstein. Some slides adapted from Jacques van Helden
 Clustering Genome 373 Genomic Informatics Elhanan Borenstein Some slides adapted from Jacques van Helden The clustering problem The goal of gene clustering process is to partition the genes into distinct
Clusters. Unsupervised Learning. Luc Anselin. Copyright 2017 by Luc Anselin, All Rights Reserved
 Clusters Unsupervised Learning Luc Anselin http://spatial.uchicago.edu 1 curse of dimensionality principal components multidimensional scaling classical clustering methods 2 Curse of Dimensionality 3 Curse
Divide-and-conquer. Curs 2015
 Divide-and-conquer Curs 2015 The divide-and-conquer strategy. 1. Break the problem into smaller subproblems, 2. recursively solve each problem, 3. appropriately combine their answers. Known Examples: Binary
More on Unsupervised Learning
 More on Unsupervised Learning Two types of problems are to find association rules for occurrences in common in observations (market basket analysis), and finding the groups of values of observational data
Clustering. Genome 559: Introduction to Statistical and Computational Genomics Elhanan Borenstein. Some slides adapted from Jacques van Helden
 Clustering Genome 559: Introduction to Statistical and Computational Genomics Elhanan Borenstein Some slides adapted from Jacques van Helden Gene expression profiling A quick review Which molecular processes/functions
Package interspread. September 7, Index 11. InterSpread Plus: summary information
 Package interspread September 7, 2012 Version 0.2-2 Date 2012-09-07 Title Functions for analysing InterSpread Plus simulation output Author Mark Stevenson A package for analysing
University of Florida CISE department Gator Engineering. Clustering Part 1
 Clustering Part 1 Dr. Sanjay Ranka Professor Computer and Information Science and Engineering University of Florida, Gainesville What is Cluster Analysis? Finding groups of objects such that the objects
CSE 417T: Introduction to Machine Learning. Final Review. Henry Chai 12/4/18
 CSE 417T: Introduction to Machine Learning Final Review Henry Chai 12/4/18 Overfitting Overfitting is fitting the training data more than is warranted Fitting noise rather than signal 2 Estimating! "#$
Measurement, Scaling, and Dimensional Analysis Summer 2017 METRIC MDS IN R
 Measurement, Scaling, and Dimensional Analysis Summer 2017 Bill Jacoby METRIC MDS IN R This handout shows the contents of an R session that carries out a metric multidimensional scaling analysis of the
Unsupervised Learning Techniques Class 07, 1 March 2006 Andrea Caponnetto
 Unsupervised Learning Techniques 9.520 Class 07, 1 March 2006 Andrea Caponnetto About this class Goal To introduce some methods for unsupervised learning: Gaussian Mixtures, K-Means, ISOMAP, HLLE, Laplacian
Marielle Caccam Jewel Refran
 Marielle Caccam Jewel Refran Cluster analysis is a group of multivariate techniques whose primary purpose is to group objects (e.g., respondents, products, or other entities) based on the characteristics
Classification methods
 Multivariate analysis (II) Cluster analysis and Cronbach s alpha Classification methods 12 th JRC Annual Training on Composite Indicators & Multicriteria Decision Analysis (COIN 2014) dorota.bialowolska@jrc.ec.europa.eu
2/1/2016. Species Abundance Curves Plot of rank abundance (x-axis) vs abundance or P i (yaxis).
 vs abundance or P i (yaxis).") Specie Abundance Curve Plot of rank abundance (x-axi) v abundance or P i (yaxi). More divere communitie lack numerically dominant pecie, flatter line. Proportion abundance 0 200 400 600 800 A C DB F E
Specie Abundance Curve Plot of rank abundance (x-axi) v abundance or P i (yaxi). More divere communitie lack numerically dominant pecie, flatter line. Proportion abundance 0 200 400 600 800 A C DB F E
Chapter 8: Regression Models with Qualitative Predictors
 Chapter 8: Regression Models with Qualitative Predictors Some predictors may be binary (e.g., male/female) or otherwise categorical (e.g., small/medium/large). These typically enter the regression model
Clustering using Mixture Models
 Clustering using Mixture Models The full posterior of the Gaussian Mixture Model is p(x, Z, µ,, ) =p(x Z, µ, )p(z )p( )p(µ, ) data likelihood (Gaussian) correspondence prob. (Multinomial) mixture prior
SUPERVISED LEARNING: INTRODUCTION TO CLASSIFICATION
 SUPERVISED LEARNING: INTRODUCTION TO CLASSIFICATION 1 Outline Basic terminology Features Training and validation Model selection Error and loss measures Statistical comparison Evaluation measures 2 Terminology
CS246: Mining Massive Data Sets Winter Only one late period is allowed for this homework (11:59pm 2/14). General Instructions
. General Instructions") CS246: Mining Massive Data Sets Winter 2017 Problem Set 2 Due 11:59pm February 9, 2017 Only one late period is allowed for this homework (11:59pm 2/14). General Instructions Submission instructions: These
CS246: Mining Massive Data Sets Winter 2017 Problem Set 2 Due 11:59pm February 9, 2017 Only one late period is allowed for this homework (11:59pm 2/14). General Instructions Submission instructions: These
Measurement and Data. Topics: Types of Data Distance Measurement Data Transformation Forms of Data Data Quality
 Measurement and Data Topics: Types of Data Distance Measurement Data Transformation Forms of Data Data Quality Importance of Measurement Aim of mining structured data is to discover relationships that
STAT 730 Chapter 14: Multidimensional scaling
 STAT 730 Chapter 14: Multidimensional scaling Timothy Hanson Department of Statistics, University of South Carolina Stat 730: Multivariate Data Analysis 1 / 16 Basic idea We have n objects and a matrix
Similarity and Dissimilarity
 1//015 Similarity and Dissimilarity COMP 465 Data Mining Similarity of Data Data Preprocessing Slides Adapted From : Jiawei Han, Micheline Kamber & Jian Pei Data Mining: Concepts and Techniques, 3 rd ed.
Clustering. Léon Bottou COS 424 3/4/2010. NEC Labs America
 Clustering Léon Bottou NEC Labs America COS 424 3/4/2010 Agenda Goals Representation Capacity Control Operational Considerations Computational Considerations Classification, clustering, regression, other.
LEC1: Instance-based classifiers
 LEC1: Instance-based classifiers Dr. Guangliang Chen February 2, 2016 Outline Having data ready knn kmeans Summary Downloading data Save all the scripts (from course webpage) and raw files (from LeCun
Chapter 3. Measuring data
 Chapter 3 Measuring data 1 Measuring data versus presenting data We present data to help us draw meaning from it But pictures of data are subjective They re also not susceptible to rigorous inference Measuring
Unsupervised Learning. k-means Algorithm
 Unsupervised Learning Supervised Learning: Learn to predict y from x from examples of (x, y). Performance is measured by error rate. Unsupervised Learning: Learn a representation from exs. of x. Learn
Survival analysis in R
 Survival analysis in R Niels Richard Hansen This note describes a few elementary aspects of practical analysis of survival data in R. For further information we refer to the book Introductory Statistics
Relational Nonlinear FIR Filters. Ronald K. Pearson
 Relational Nonlinear FIR Filters Ronald K. Pearson Daniel Baugh Institute for Functional Genomics and Computational Biology Thomas Jefferson University Philadelphia, PA Moncef Gabbouj Institute of Signal
Package clustergeneration
 Version 1.3.4 Date 2015-02-18 Package clustergeneration February 19, 2015 Title Random Cluster Generation (with Specified Degree of Separation) Author Weiliang Qiu , Harry Joe
CISC 4631 Data Mining
 CISC 4631 Data Mining Lecture 02: Data Theses slides are based on the slides by Tan, Steinbach and Kumar (textbook authors) 1 10 What is Data? Collection of data objects and their attributes An attribute
THE UNIVERSITY OF CHICAGO Graduate School of Business Business 41912, Spring Quarter 2008, Mr. Ruey S. Tsay. Solutions to Final Exam
 THE UNIVERSITY OF CHICAGO Graduate School of Business Business 41912, Spring Quarter 2008, Mr. Ruey S. Tsay Solutions to Final Exam 1. (13 pts) Consider the monthly log returns, in percentages, of five
Package CEC. R topics documented: August 29, Title Cross-Entropy Clustering Version Date
 Title Cross-Entropy Clustering Version 0.9.4 Date 2016-04-23 Package CEC August 29, 2016 Author Konrad Kamieniecki [aut, cre], Przemyslaw Spurek [ctb] Maintainer Konrad Kamieniecki
DAA Unit- II Greedy and Dynamic Programming. By Mrs. B.A. Khivsara Asst. Professor Department of Computer Engineering SNJB s KBJ COE, Chandwad
 DAA Unit- II Greedy and Dynamic Programming By Mrs. B.A. Khivsara Asst. Professor Department of Computer Engineering SNJB s KBJ COE, Chandwad 1 Greedy Method 2 Greedy Method Greedy Principal: are typically
MixSim: An R Package for Simulating Data to Study Performance of Clustering Algorithms
 Statistics Publications Statistics 11-2012 MixSim: An R Package for Simulating Data to Study Performance of Clustering Algorithms Volodymyr Melnykov University of Alabama Wei-Chen Chen Oak Ridge National
Module Master Recherche Apprentissage et Fouille
 Module Master Recherche Apprentissage et Fouille Michele Sebag Balazs Kegl Antoine Cornuéjols http://tao.lri.fr 19 novembre 2008 Unsupervised Learning Clustering Data Streaming Application: Clustering
Artificial Neural Networks" and Nonparametric Methods" CMPSCI 383 Nov 17, 2011!
 Artificial Neural Networks" and Nonparametric Methods" CMPSCI 383 Nov 17, 2011! 1 Todayʼs lecture" How the brain works (!)! Artificial neural networks! Perceptrons! Multilayer feed-forward networks! Error
Graph Metrics and Dimension Reduction
 Graph Metrics and Dimension Reduction Minh Tang 1 Michael Trosset 2 1 Applied Mathematics and Statistics The Johns Hopkins University 2 Department of Statistics Indiana University, Bloomington November
Issues and Techniques in Pattern Classification
 Issues and Techniques in Pattern Classification Carlotta Domeniconi www.ise.gmu.edu/~carlotta Machine Learning Given a collection of data, a machine learner eplains the underlying process that generated
Package ForwardSearch
 Package ForwardSearch February 19, 2015 Type Package Title Forward Search using asymptotic theory Version 1.0 Date 2014-09-10 Author Bent Nielsen Maintainer Bent Nielsen
Clustering and classification with applications to microarrays and cellular phenotypes
 Clustering and classification with applications to microarrays and cellular phenotypes Gregoire Pau, EMBL Heidelberg gregoire.pau@embl.de European Molecular Biology Laboratory 1 Microarray data patients
Data Mining: Data. Lecture Notes for Chapter 2. Introduction to Data Mining
 Data Mining: Data Lecture Notes for Chapter 2 Introduction to Data Mining by Tan, Steinbach, Kumar Tan,Steinbach, Kumar Introduction to Data Mining 4/18/2004 1 10 What is Data? Collection of data objects
Discrimination Among Groups. Discrimination Among Groups
 Discrimination Among Groups Id Species Canopy Snag Canopy Cover Density Height 1 A 80 1.2 35 2 A 75 0.5 32 3 A 72 2.8 28..... 31 B 35 3.3 15 32 B 75 4.1 25 60 B 15 5.0 3..... 61 C 5 2.1 5 62 C 8 3.4 2
Focus was on solving matrix inversion problems Now we look at other properties of matrices Useful when A represents a transformations.
 Previously Focus was on solving matrix inversion problems Now we look at other properties of matrices Useful when A represents a transformations y = Ax Or A simply represents data Notion of eigenvectors,
Data Mining: Data. Lecture Notes for Chapter 2 Slides by Tan, Steinbach, Kumar adapted by Michael Hahsler
 Data Mining: Data Lecture Notes for Chapter 2 Slides by Tan, Steinbach, Kumar adapted by Michael Hahsler Look for accompanying R code on the course web site. 1 Topics Attributes/Features Types of Data
Descriptive Data Summarization
 Descriptive Data Summarization Descriptive data summarization gives the general characteristics of the data and identify the presence of noise or outliers, which is useful for successful data cleaning
Final Exam, Machine Learning, Spring 2009
 Name: Andrew ID: Final Exam, 10701 Machine Learning, Spring 2009 - The exam is open-book, open-notes, no electronics other than calculators. - The maximum possible score on this exam is 100. You have 3
Introduction to Statistics and R
 Introduction to Statistics and R Mayo-Illinois Computational Genomics Workshop (2018) Ruoqing Zhu, Ph.D. Department of Statistics, UIUC rqzhu@illinois.edu June 18, 2018 Abstract This document is a supplimentary
Dimension Reduc-on. Example: height of iden-cal twins. PCA, SVD, MDS, and clustering [ RI ] Twin 2 (inches away from avg)
![Dimension Reduc-on. Example: height of iden-cal twins. PCA, SVD, MDS, and clustering [ RI ] Twin 2 (inches away from avg)](/thumbs/74/70760823.jpg "Dimension Reduc-on. Example: height of iden-cal twins. PCA, SVD, MDS, and clustering [ RI ] Twin 2 (inches away from avg)") Dimension Reduc-on PCA, SVD, MDS, and clustering Example: height of iden-cal twins Twin (inches away from avg) 0 5 0 5 0 5 0 5 0 Twin (inches away from avg) Expression between two ethnic groups Frequency
Dimension Reduc-on PCA, SVD, MDS, and clustering Example: height of iden-cal twins Twin (inches away from avg) 0 5 0 5 0 5 0 5 0 Twin (inches away from avg) Expression between two ethnic groups Frequency
CS626 Data Analysis and Simulation
 CS626 Data Analysis and Simulation Instructor: Peter Kemper R 104A, phone 221-3462, email:kemper@cs.wm.edu Today: Data Analysis: A Summary Reference: Berthold, Borgelt, Hoeppner, Klawonn: Guide to Intelligent
A Partitioning Method for the Clustering of Categorical Variables
 A Partitioning Method for the Clustering of Categorical Variables Marie Chavent 1,2, Vanessa Kuentz 1,2, and Jérôme Saracco 1,2,3 1 Université de Bordeaux, IMB, CNRS, UMR 5251, France chavent@math.u-bordeaux1.fr;kuentz@math.u-bordeaux1.fr
Data Mining: Data. Lecture Notes for Chapter 2. Introduction to Data Mining
 Data Mining: Data Lecture Notes for Chapter 2 Introduction to Data Mining by Tan, Steinbach, Kumar 10 What is Data? Collection of data objects and their attributes Attributes An attribute is a property
Part I. Linear regression & LASSO. Linear Regression. Linear Regression. Week 10 Based in part on slides from textbook, slides of Susan Holmes
 Week 10 Based in part on slides from textbook, slides of Susan Holmes Part I Linear regression & December 5, 2012 1 / 1 2 / 1 We ve talked mostly about classification, where the outcome categorical. If
An Alternative Algorithm for Classification Based on Robust Mahalanobis Distance
 Dhaka Univ. J. Sci. 61(1): 81-85, 2013 (January) An Alternative Algorithm for Classification Based on Robust Mahalanobis Distance A. H. Sajib, A. Z. M. Shafiullah 1 and A. H. Sumon Department of Statistics,
Statistical Machine Learning
 Statistical Machine Learning Christoph Lampert Spring Semester 2015/2016 // Lecture 12 1 / 36 Unsupervised Learning Dimensionality Reduction 2 / 36 Dimensionality Reduction Given: data X = {x 1,..., x
Computer Vision Group Prof. Daniel Cremers. 14. Clustering
 Group Prof. Daniel Cremers 14. Clustering Motivation Supervised learning is good for interaction with humans, but labels from a supervisor are hard to obtain Clustering is unsupervised learning, i.e. it
Data Mining: Data. Lecture Notes for Chapter 2. Introduction to Data Mining
 Data Mining: Data Lecture Notes for Chapter 2 Introduction to Data Mining by Tan, Steinbach, Kumar Tan,Steinbach, Kumar Introduction to Data Mining 4/18/2004 1 10 What is Data? Collection of data objects
Experimental Design and Data Analysis for Biologists
 Experimental Design and Data Analysis for Biologists Gerry P. Quinn Monash University Michael J. Keough University of Melbourne CAMBRIDGE UNIVERSITY PRESS Contents Preface page xv I I Introduction 1 1.1
Solving Non-uniqueness in Agglomerative Hierarchical Clustering Using Multidendrograms
 Solving Non-uniqueness in Agglomerative Hierarchical Clustering Using Multidendrograms Alberto Fernández and Sergio Gómez arxiv:cs/0608049v2 [cs.ir] 0 Jun 2009 Departament d Enginyeria Informàtica i Matemàtiques,
Dimension Reduction and Iterative Consensus Clustering
 Dimension Reduction and Iterative Consensus Clustering Southeastern Clustering and Ranking Workshop August 24, 2009 Dimension Reduction and Iterative 1 Document Clustering Geometry of the SVD Centered
1.3. Principal coordinate analysis. Pierre Legendre Département de sciences biologiques Université de Montréal
 1.3. Pierre Legendre Département de sciences biologiques Université de Montréal http://www.numericalecology.com/ Pierre Legendre 2018 Definition of principal coordinate analysis (PCoA) An ordination method
Copyright 2000, Kevin Wayne 1
 Divide-and-Conquer Chapter 5 Divide and Conquer Divide-and-conquer. Break up problem into several parts. Solve each part recursively. Combine solutions to sub-problems into overall solution. Most common