Statistics Statistical method Variables Value Score Type of Research Level of Measurement...
|
|
|
- Thomas Allen
- 5 years ago
- Views:
Transcription
1 Lecture 1 Displaying data Statistics Statistical methd Variables Value Scre Type f Research Level f Measurement Numeric/Quantitative variables Ordinal/Rank-rder variables (in rder nly) Equal interval variables Categrical/Nminal variables Frequency table Making a frequency table Gruped frequency tables Histgrams Frequency plygns Shapes f distributins Number f peaks Is it rughly symmetrical? Kurtsis Discrete variable Cntinuus variable Flr effect Ceiling effect Nrmal curve Lecture 2 Central tendency and variability Central tendency Mean... 25
2 Imprtant cncepts X M = Calculating the mean N Mde Median Which central tendency measure Variability Measures f variability Range Interquartile range (IQR) Variance Calculating the variance Example: Number f therapy sessins Imprtant features f the variance Sum f Squares (SS) = å (X-M) The standard deviatin (Measures f variability) SD frmula Example: Number f therapy sessins Outlier Cmputatinal frmula Definitinal frmula Lecture 3 Standardised scres: Z scres Sme examples t cnsider Z scres Distributin f Z scres Calculating a Z scre frm a raw scre Example Interpreting Z scres... 36
3 Example Example Implicatins f Z scres Example: Cmparing scres frm different distributins The relative achievement f 3 friends Calculating a raw scre frm a Z scre (frm Z scre t raw scre) X = SD x Z) + M ( Example: IQ data Imprtant features f Z scres When the distributin is nrmal, Z scres tell us even mre The basis f percentages n a nrmal distributin Percentile Lecture 4 Crrelatin Types f Variables in Research Dependent Variable (DV) Independent Variable (IV) Examples Majr Types f Research Design Descriptin in an bservatinal study f tw cntinuus variables Graphing pairs f variables: Scatterplt Drawing a scatterplt Cnstructing a Scatterplt Patterns f linear relatinship Patterns f relatinship Quantifying the relatinship: Crrelatin Calculating the crrelatin cefficient r å Z xzy r = N Crssprducts (SZ X Z Y ) Making sense f r: prprtinate reductin in errr r Cefficient f determinatin: r 2 tells us the prprtin f variability Lecture 5 Inferential statistics Intrductin t Inferential Statistics... 59
4 The nrmal curve Backgrund The nrmal distributin: areas under the nrmal curve SD and the nrmal distributin SD and the nrmal distributin Finding percentages using a nrmal curve table Tips fr using a nrmal curve table IQ scres example IQ scres example Finding raw scres frm percentages Prbability Calculating prbability Expected relative frequency Prbability and expectatin Z scres and prbability Samples and ppulatins Methds f sampling Ppulatin parameters and sample statistics Lecture 6 Hypthesis testing Errrs in hypthesis testing Example: brain affected by radiatin Tw pssibilities Statistical significance: The magical p < Interpretatin issues Hypthesis testing The prcess f hypthesis testing Step 1: Frmulating research and null hyptheses Step 2: Identifying the cmparisn distributin Step 3: Determining the cut-ff scre... 74
5 Step 4: Where des yur sample scre sit n the cmparisn distributin? Step 5: Decisin time: Shuld the null hypthesis be rejected? The implicatins f yur decisin One-tailed and tw-tailed hypthesis tests Directinal hyptheses Tw-tailed tests Cut-ff pints fr tw-tailed tests The nrmal curve: One- and tw-tailed tests Determining Cut-ff Pints with Tw-Tailed Tests Cmparisn f ne and tw-tailed tests Summary s far An example Errrs in hypthesis testing: Terminlgy Errrs when result is significant: Type 1 errr Errrs when result is nt significant: Type 2 errr Errrs in hypthesis testing Errrs in hypthesis testing: Table Crrect decisin Crrect decisin Type I errrs: when H 0 is actually true Crrect decisin Type II errrs: when H 1 is actually true and H0 is false Crrect decisin Relatinship between Type I and Type II errrs Pwer Jury Trial Example f Errrs Lecture 7 The distributin f means Distributin f means: The lgic Hypthesis testing with samples... 90

6 Samples frm ppulatins Sampling variability Minimising errr S what distributin d we need? Distributins f means Why des this distributin nrmalise? Characteristics f the distributin f means: # Characteristics f the distributin f means: # Measuring variability in sample means Standard Errr f the Mean Increase N, decrease Errr Characteristics f the distributin f means: # Three types f distributins: Ppulatins Three types f distributins: Samples Three types f distributins: Distributins f means Three types f distributins Cmparisn f Three Types f Distributins Hypthesis testing with samples Hypthesis testing against a knwn ppulatin Example Back t ur Nuclear Pwer Plant Twn Step 4: Where des yur sample mean sit? (this screen will be in the exam) Estimatin and cnfidence intervals
7 Our example % cnfidence intervals f sample Using cnfidence intervals t test hyptheses Our Class Example Hw cnfident are we Did we make an Errr? Lecture 8 t tests: single sample and dependent means Example #1: Stpstress Z tests à t tests: a general intrductin Estimating the ppulatin standard deviatin frm the sample data Why N-1? The mystery f Degrees f Freedm Estimating the standard deviatin f the cmparisn distributin Z frmula à t frmula (ne-sample tests) Shrt Cut t get SM The ne sample t test The cmparisn distributin The t distributin vs. nrmal distributin The t distributin vs. nrmal distributin re cut-ff scres Tips fr using the t table (A-2, p. 675) Wrking thrugh Example #1: Stpstress Stating the hyptheses Determining the characteristics f the cmparisn distributin Determine the critical value t reject H Determine the t value i.e., determine yur sample s scre n the cmparisn distributin (the t distributin) Cmpare the scres t make a decisin Anther way t use ur new t distributin The t test fr dependent means (repeated measures) Difference scres Single sample t dependent measures t test Stating the hyptheses
8 2. Determining the characteristics f the cmparisn distributin Determine the critical value t reject H Determine the t value i.e., determine yur sample s scre n the cmparisn distributin (the t distributin) Cmpare the scres t make a decisin Cnfidence Intervals arund the Mean Using Cnfidence Intervals t Test Hypthesis f Mean Difference APA Style Write-Up Full APA Write-Up Assumptins f the t test Situatins where we use a t test fr dependent means Example #3: Neighburhd attachment Step Step Step Step Step Example # 4: Neighburhd Attachment; Repeated Measures Design Lecture 9 t test fr independent means The t test fr independent means The lgic underlying the independent means t test Wrking ur way t S difference Distributin f sample means Distributin f differences between means Identifying the distributin z-tests vs t-test Variance f Cmparisn Distributin Identifying the distributin Key Distributins in Hypthesis Testing Cmparisn Distributins Steps in the prcess f calculating independent grups t test Example: Dyslexia and clur verlays
9 Mean f the distributin f differences between means Estimated ppulatin variance frm bth samples The pled estimate f the ppulatin variance Weighting variance estimates accrding t df Calculating the variances f the tw distributins f means The distributin f the differences between the means Equal sample size The shape f the distributin f the differences between means Calculating the t scre crrespnding t yur samples Steps fr a t Test fr Independent Means Dyslexia and clur verlays example Step 1: State hyptheses Step 2: Determine characteristics f the cmparisn distributin Step 3: Determine the cut-ff scre Step 4: Calculate the t scre (determine sample scre n cmparisn distributin) Step 5: Decisin regarding H APA style write-up Assumptins f the t test fr independent means Effect size in t tests Chen s d Eta Squared η Easy t Calculate Effect Size and Pwer Lecture 10 Chi-square tests Statistical ptins Example: Attachment styles # Observed and expected frequencies: What we have vs. what we expect Determining Expected Frequencies: When all categries are equal Chi-square (c 2 ) test fr gdness f fit Expected and bserved frequencies Calculating the c 2 statistics
10 Example: Attachment styles # Testing significance: c 2 distributins Example: Attachment styles # Review f steps fr calculating the chi-square statistic Example: Attachment styles # c 2 distributins Heavy metal pllutin and mental health example: Chi-square (c 2 ) test fr independence H 0 : independent (unrelated) Example Cntingency table Calculating the expected frequencies Calculating the c 2 statistics Decisin Gender and reprted child abuse example: Assumptins f c 2 tests Effect size in c 2 tests (strength f relatinship in c 2 tests f independence) Chi-Square Tests in Research Articles Lecture 11 Intrductin t Qualitative Research Relevance f Qualitative Research Features f Qualitative Research Paradigms in Scial Research Imprtant cncept Psitivist Paradigm Scial Cnstructinist Paradigm Paradigms in Scial Research Quantitative vs. Qualitative Research Deductive Reasning Inductive Reasning Beynd Paradigm Wars
11 Prcess f Qualitative Research Thery in Qualitative Research Mre abut Thery Principles f Research Ethics Ethics f Qualitative Research Hw t Act Ethically Checklist fr Taking Ethical Issues int Accunt Summary
12 Lecture 1 Displaying data Variables Frequency tables Gruped frequency tables Histgrams Frequency plygns Shapes f distributins
13 Statistics Statistical methd Determining if true r nt. Descriptive - Infrmatin/data is summarised s as t be mre easily understd - describing data: e.g. what des the sample f 2000 represent Inferential - Inferring smething - used t draw cnclusins abut regularities in the data - Applying t the ppulatin. What peple in general may lk like frm the data cllected? - Prbability - Statistically significance Variables a characteristic that can have different values (e.g., age, religin, reactin time, anxiety level) smething which is able t vary r take different values is a variable - acrss peple: gender, height, weight - within peple: height, weight, jb satisfactin wrk with psychlgical materials - ften use scres n particular tests as variables - e.g., extrversin-intrversin scre Independent Variable (IV) - variable can change - nt dependent n ther variable, wrks independent - cause Dependent variable (DV) - affects by changes in the IV
14 DV depends n IV
15 Value A pssible number r categry that a scre can have (e.g., 1, 2, 3 r female) Just a number r categry. Number a variable can take, e.g Scre Particular persn s value n a variable (e.g., 3, 6 r Buddhist) Type f Research Observatinal / Naturalistic research - can t talk abut cause/effect - can talk abut relatinship - nt a cntrl envirnment Experimental / Cntrl research - cntrl envirnment - islate all ther variable - manipulate IV Level f Measurement Types f underlying numerical infrmatin prvided by a measure, such as equal-interval, rank-rder, and nminal (categrical) (Kinds f variables) Numeric/Quantitative variables - variables whse values are numbers (as ppsed t a nminal variable) - generally use numbers t dente different values f a variable, e.g. 68kg - 2 types f numeric variables Magnitude Equality f intervals: has magnitude and equal intervals Ordinal/Rank-rder variables (in rder nly) numeric variable in which the values are ranked, such as class standing r place finished in a race. Numeric variable in which values crrespnd t the relative psitin f things measured
16 difference in magnitude implied, N set magnitude between the 2 nt equal intervals between ranks grup has rder, e.g. race, 1 st 2 nd 3 rd,still a categry 1 st (10 secnds) 2 nd (11 secs) 3 rd (14 secs), magnitude ranks: e.g., place in class, rder in a hrse race e.g. GPA between being 2 nd and 3 rd in the class culd be different t 8 th and 9 th
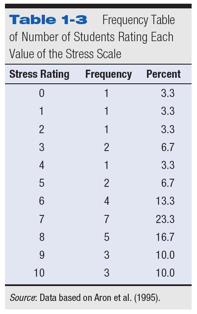
17 Equal interval variables variable in which the numbers stand fr apprximately equal amunts f what is being measured Numeric variable in which differences between values crrespnd t differences in the underlying thing being measured has magnitude difference in magnitude implied equal intervals are assumed e.g., time elapsed, temperature, ages, GPA, weight, stress level e.g. GPA 2.5 and 2.8 means abut as much as the difference between a GPA f3 and 3.3 Categrical/Nminal - Variable with values that are names r categries (that is, they are names rather than numbers) variables Nminal cmes frm the idea that its values are names Variable in name nly. categry, number dn t necessary mean anything, just a categry, e.g. religin, gender (1=male, 2=female) Desn t dente anything abut the relative magnitude Frequency table - descriptive data - shws hw frequently each value f a variable ccurs - useful fr shwing verall tendencies - e.g., stress ratings f 30 students: 8,7,4,10,8,6,8,9,9,7,3,7,6,5,0,9,10,7,7,3,6,7,5,2,1,6,7,10,8,8 Making a frequency - make a list starting with the lwest scre ending with the highest table include values which didn t ccur - wrk thrugh yur scres and place a tick next t each value n yur list number f ticks = number f scres - make a neat table with values dwn left side and the number f ticks next t them
18


19 Gruped frequency tables when there are many values - table becmes awkward - use all values within an interval - use equal intervals - recrd frequency f all values in each interval Histgrams a type f bar graph a way f graphing the infrmatin in a frequency table the height f each bar is the frequency f each interval in the table can use the data frm frequency table r gruped frequency table
20 Frequency plygns a line graph f the infrmatin in a frequency table can use the data frm frequency table r gruped frequency table the height f each pint is the frequency f each value (r interval) Shapes f distributins frequency tables, histgrams, frequency plygns describe the distributin hw are scres distributed acrss a range f values? cmmn patterns and features: is there a single peak, tw, nne? is it rughly symmetrical? hw thick r heavy are the tails? Number f peaks Mdality: hw many peaks? Is there a single peak, tw, nne? 1 peak: unimdal 2 peaks: bimdal >2 peaks: multimdal withut any real peaks: rectangular Strictly speaking, a distributin is bimdal r multimdal nly if the peaks are exactly equal; hwever,

21 psychlgists use the terms mre infrmally t describe the general shape.
 Nrmal b) Leptkurtic (Peaked) tails are thicker r heavier than nrmal curve mre easily recgnised by tp f curve being mre")
22 Is it rughly symmetrical? if nt symmetrical, skewed distributin - psitive skew: if tail pints t right - negative skew: if tail pints t left Kurtsis (width) Hw thick r heavy are the tails? Need t cmpare with the nrmal distributin, this quality is called kurtsis a) Nrmal b) Leptkurtic (Peaked) tails are thicker r heavier than nrmal curve mre easily recgnised by tp f curve being mre peaked than nrmal curve c) Platykurtic (Play sunds like flat) tails are thinner r lighter than nrmal curve Discrete variable Cntinuus Variable that has specific values and that cannt have values between these specific values Variable fr which, in thery, there are an infinite number f values between any tw values variable Flr effect Situatin in which many scres piles up at the lw end f a distributin (creating skewness t the right) because it is nt pssible t have lwer scre Ceiling effect Situatin in which many scres pile up at the high end f a distributin (creating skewness t the left) because it is nt pssible t have a higher scre Nrmal curve Specific, mathematically defined, bell-shaped frequency distributin that is symmetrical and unimdal;
23 distributins bserved in nature and in research cmmnly apprximate it.
24 Lecture 2 Central tendency and variability - Measures f central tendency mean mde median - Measures f variability range variance standard deviatin - Cautins and advice
25 Central Mst typical, cmmn scre, representative value f a grup f scres tendency Mean Sensitive t any scre = the average scre. = the sum f all the scres divided by the number f scres. = the typical r representative scre. best way f estimating what an individual unknwn scre might be. influenced by all scres in a distributin (s represents all scres but can be unduly influenced by extreme scres and, thus, can be biased). E.g. I ask 10 students hw much study they have dne in the last week and get the fllwing results: 10, 2, 4, 3, 4, 4, 6, 5, 5, 7 the ttal number f hurs studied = 50 the number f scres (bservatins) = 10 the mean number f hurs = 50/10 = 5 Imprtant cncepts it is like a balancing pint in a distributin the ttal distance frm the mean f all scres less than the mean = the ttal distance frm the mean f all scres greater than the mean belw mean ttal = -8, abve mean ttal = +8, sum f distances = 0 the mean can be a value r scre which des nt exist in the actual set f scres Scres Distance frm mean

26 Mean f the distributin f the number f dreams during a week fr 10 students.

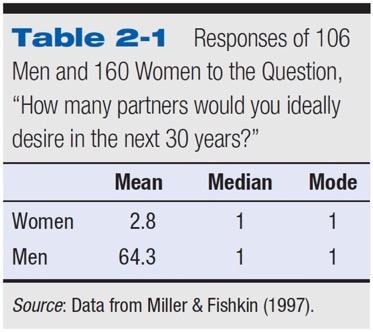
27 Calculating the M = mean X N The mathematical frmula fr calculating the mean, M (smetimes µ r ) å: a Greek letter sigma means the sum f X X: a scre in the distributin f a variable X N: the number f scres in a distributin M M X = = N N 50 = = 5 10 Mde = the mst cmmn scre in a unimdal distributin = the peak f a histgram r a frequency plygn in a symmetrical unimdal distributin (nrmal distributin): the mde = the mean useful when nly a few values pssible as mde nly describes ne scre The mde as the high pint in a distributin s histgram, using the example f the number f dreams during a week fr 10 students. Median = the middle scre when all scres are ranked easy if there are an dd number f scres if even number, it falls halfway between the tw middle scres smetimes the median is a better measure f central tendency than the mean in skewed distributins, a few extreme scres can affect the mean. use when the data is heavily skewed, e.g. incme, huse prices

28 even versus dd number f cases: the middle scre when all scres are ranked if there is an even number f scres the median falls halfway between t tw middle scres scres median = 3.5 easy if there are an dd number f scres scres median = 4 Which central tendency measure Mde: nly few values Median: skewed Mean: nrmal in a symmetrical unimdal distributin, the mean = the mde = the median
29
30 Variability hw spread ut the scres are in a distributin Measures f variability tw distributins may have the same mean but ne may have a greater spread (r variability) in values in describing distributins numerically, need t be able t discuss the spread (r variability) f scres Range the simplest measure f spread is the range the range is simply the difference between the highest and lwest scres range = highest scre - lwest scre: 9-1 = 8 Interquartile range (IQR) IQR prvides the bundaries fr the middle 50% f scres Steps t find IQR find median find middle scre in tp and bttm halves X IQR = 8-3 = 5 usual t reprt IQR with median Variance Range nly describes tw, pssibly extreme, values IQR better but still nt representative f all scres Prefer a measure that cnsiders all values - like ur mean in central tendency The variance tells us hw spread ut a set f scres is arund their mean it is the average f each scre s squared deviatin arund the mean Variance: hw much individual scre differ frm the mean, square the value t cancel ut the minus Calculating the variance subtract the mean frm each scre (ne by ne) t get a deviatin scre (X-M) square (multiply by itself) each f these deviatin scres t get a squared deviatin scre
AP Statistics Notes Unit Two: The Normal Distributions
 AP Statistics Ntes Unit Tw: The Nrmal Distributins Syllabus Objectives: 1.5 The student will summarize distributins f data measuring the psitin using quartiles, percentiles, and standardized scres (z-scres).
Hypothesis Tests for One Population Mean
 Hypthesis Tests fr One Ppulatin Mean Chapter 9 Ala Abdelbaki Objective Objective: T estimate the value f ne ppulatin mean Inferential statistics using statistics in rder t estimate parameters We will be
Bootstrap Method > # Purpose: understand how bootstrap method works > obs=c(11.96, 5.03, 67.40, 16.07, 31.50, 7.73, 11.10, 22.38) > n=length(obs) >
 > n=length(obs) >") Btstrap Methd > # Purpse: understand hw btstrap methd wrks > bs=c(11.96, 5.03, 67.40, 16.07, 31.50, 7.73, 11.10, 22.38) > n=length(bs) > mean(bs) [1] 21.64625 > # estimate f lambda > lambda = 1/mean(bs);
Btstrap Methd > # Purpse: understand hw btstrap methd wrks > bs=c(11.96, 5.03, 67.40, 16.07, 31.50, 7.73, 11.10, 22.38) > n=length(bs) > mean(bs) [1] 21.64625 > # estimate f lambda > lambda = 1/mean(bs);
, which yields. where z1. and z2
 The Gaussian r Nrmal PDF, Page 1 The Gaussian r Nrmal Prbability Density Functin Authr: Jhn M Cimbala, Penn State University Latest revisin: 11 September 13 The Gaussian r Nrmal Prbability Density Functin
CHAPTER 24: INFERENCE IN REGRESSION. Chapter 24: Make inferences about the population from which the sample data came.
 MATH 1342 Ch. 24 April 25 and 27, 2013 Page 1 f 5 CHAPTER 24: INFERENCE IN REGRESSION Chapters 4 and 5: Relatinships between tw quantitative variables. Be able t Make a graph (scatterplt) Summarize the
1b) =.215 1c).080/.215 =.372
 =.215 1c).080/.215 =.372") Practice Exam 1 - Answers 1. / \.1/ \.9 (D+) (D-) / \ / \.8 / \.2.15/ \.85 (T+) (T-) (T+) (T-).080.020.135.765 1b).080 +.135 =.215 1c).080/.215 =.372 2. The data shwn in the scatter plt is the distance
Practice Exam 1 - Answers 1. / \.1/ \.9 (D+) (D-) / \ / \.8 / \.2.15/ \.85 (T+) (T-) (T+) (T-).080.020.135.765 1b).080 +.135 =.215 1c).080/.215 =.372 2. The data shwn in the scatter plt is the distance
Math 10 - Exam 1 Topics
 Math 10 - Exam 1 Tpics Types and Levels f data Categrical, Discrete r Cntinuus Nminal, Ordinal, Interval r Rati Descriptive Statistics Stem and Leaf Graph Dt Plt (Interpret) Gruped Data Relative and Cumulative
Lab 1 The Scientific Method
 INTRODUCTION The fllwing labratry exercise is designed t give yu, the student, an pprtunity t explre unknwn systems, r universes, and hypthesize pssible rules which may gvern the behavir within them. Scientific
AP Statistics Practice Test Unit Three Exploring Relationships Between Variables. Name Period Date
 AP Statistics Practice Test Unit Three Explring Relatinships Between Variables Name Perid Date True r False: 1. Crrelatin and regressin require explanatry and respnse variables. 1. 2. Every least squares
EASTERN ARIZONA COLLEGE Introduction to Statistics
 EASTERN ARIZONA COLLEGE Intrductin t Statistics Curse Design 2014-2015 Curse Infrmatin Divisin Scial Sciences Curse Number PSY 220 Title Intrductin t Statistics Credits 3 Develped by Adam Stinchcmbe Lecture/Lab
SticiGui Chapter 4: Measures of Location and Spread Philip Stark (2013)
") SticiGui Chapter 4: Measures f Lcatin and Spread Philip Stark (2013) Summarizing data can help us understand them, especially when the number f data is large. This chapter presents several ways t summarize
SticiGui Chapter 4: Measures f Lcatin and Spread Philip Stark (2013) Summarizing data can help us understand them, especially when the number f data is large. This chapter presents several ways t summarize
Math Foundations 20 Work Plan
 Math Fundatins 20 Wrk Plan Units / Tpics 20.8 Demnstrate understanding f systems f linear inequalities in tw variables. Time Frame December 1-3 weeks 6-10 Majr Learning Indicatrs Identify situatins relevant
Modelling of Clock Behaviour. Don Percival. Applied Physics Laboratory University of Washington Seattle, Washington, USA
 Mdelling f Clck Behaviur Dn Percival Applied Physics Labratry University f Washingtn Seattle, Washingtn, USA verheads and paper fr talk available at http://faculty.washingtn.edu/dbp/talks.html 1 Overview
CAUSAL INFERENCE. Technical Track Session I. Phillippe Leite. The World Bank
 CAUSAL INFERENCE Technical Track Sessin I Phillippe Leite The Wrld Bank These slides were develped by Christel Vermeersch and mdified by Phillippe Leite fr the purpse f this wrkshp Plicy questins are causal
Differentiation Applications 1: Related Rates
 Differentiatin Applicatins 1: Related Rates 151 Differentiatin Applicatins 1: Related Rates Mdel 1: Sliding Ladder 10 ladder y 10 ladder 10 ladder A 10 ft ladder is leaning against a wall when the bttm
We say that y is a linear function of x if. Chapter 13: The Correlation Coefficient and the Regression Line
 Chapter 13: The Crrelatin Cefficient and the Regressin Line We begin with a sme useful facts abut straight lines. Recall the x, y crdinate system, as pictured belw. 3 2 1 y = 2.5 y = 0.5x 3 2 1 1 2 3 1
How do scientists measure trees? What is DBH?
 Hw d scientists measure trees? What is DBH? Purpse Students develp an understanding f tree size and hw scientists measure trees. Students bserve and measure tree ckies and explre the relatinship between
Pipetting 101 Developed by BSU CityLab
 Discver the Micrbes Within: The Wlbachia Prject Pipetting 101 Develped by BSU CityLab Clr Cmparisns Pipetting Exercise #1 STUDENT OBJECTIVES Students will be able t: Chse the crrect size micrpipette fr
CHAPTER 3 INEQUALITIES. Copyright -The Institute of Chartered Accountants of India
 CHAPTER 3 INEQUALITIES Cpyright -The Institute f Chartered Accuntants f India INEQUALITIES LEARNING OBJECTIVES One f the widely used decisin making prblems, nwadays, is t decide n the ptimal mix f scarce
AEC 874 (2007) Field Data Collection & Analysis in Developing Countries. VII. Data Analysis & Project Documentation
 Field Data Collection & Analysis in Developing Countries. VII. Data Analysis & Project Documentation") AEC 874 (2007) Field Data Cllectin & Analysis in Develping Cuntries VII. Data Analysis & Prject Dcumentatin Richard H. Bernsten Agricultural Ecnmics Michigan State University 1 A. Things t Cnsider in Planning
AEC 874 (2007) Field Data Cllectin & Analysis in Develping Cuntries VII. Data Analysis & Prject Dcumentatin Richard H. Bernsten Agricultural Ecnmics Michigan State University 1 A. Things t Cnsider in Planning
Lesson Plan. Recode: They will do a graphic organizer to sequence the steps of scientific method.
 Lessn Plan Reach: Ask the students if they ever ppped a bag f micrwave ppcrn and nticed hw many kernels were unppped at the bttm f the bag which made yu wnder if ther brands pp better than the ne yu are
Comparing Several Means: ANOVA. Group Means and Grand Mean
 STAT 511 ANOVA and Regressin 1 Cmparing Several Means: ANOVA Slide 1 Blue Lake snap beans were grwn in 12 pen-tp chambers which are subject t 4 treatments 3 each with O 3 and SO 2 present/absent. The ttal
Directions: Show all work. When using the calculator write down the function buttons used. not just write numerical solution write
 MAT 1272 Practic Exercises fr the Final Revised Spring 2017 (Ellner) Directins: Shw all wrk. When using the calculatr write dwn the functin buttns used. D nt just write a numerical slutin write A SENTENCE
IB Sports, Exercise and Health Science Summer Assignment. Mrs. Christina Doyle Seneca Valley High School
 IB Sprts, Exercise and Health Science Summer Assignment Mrs. Christina Dyle Seneca Valley High Schl Welcme t IB Sprts, Exercise and Health Science! This curse incrprates the traditinal disciplines f anatmy
4th Indian Institute of Astrophysics - PennState Astrostatistics School July, 2013 Vainu Bappu Observatory, Kavalur. Correlation and Regression
 4th Indian Institute f Astrphysics - PennState Astrstatistics Schl July, 2013 Vainu Bappu Observatry, Kavalur Crrelatin and Regressin Rahul Ry Indian Statistical Institute, Delhi. Crrelatin Cnsider a tw
Basics. Primary School learning about place value is often forgotten and can be reinforced at home.
 Basics When pupils cme t secndary schl they start a lt f different subjects and have a lt f new interests but it is still imprtant that they practise their basic number wrk which may nt be reinfrced as
Unit 1: Introduction to Biology
 Name: Unit 1: Intrductin t Bilgy Theme: Frm mlecules t rganisms Students will be able t: 1.1 Plan and cnduct an investigatin: Define the questin, develp a hypthesis, design an experiment and cllect infrmatin,
Resampling Methods. Chapter 5. Chapter 5 1 / 52
 Resampling Methds Chapter 5 Chapter 5 1 / 52 1 51 Validatin set apprach 2 52 Crss validatin 3 53 Btstrap Chapter 5 2 / 52 Abut Resampling An imprtant statistical tl Pretending the data as ppulatin and
NAME TEMPERATURE AND HUMIDITY. I. Introduction
 NAME TEMPERATURE AND HUMIDITY I. Intrductin Temperature is the single mst imprtant factr in determining atmspheric cnditins because it greatly influences: 1. The amunt f water vapr in the air 2. The pssibility
Fall 2013 Physics 172 Recitation 3 Momentum and Springs
 Fall 03 Physics 7 Recitatin 3 Mmentum and Springs Purpse: The purpse f this recitatin is t give yu experience wrking with mmentum and the mmentum update frmula. Readings: Chapter.3-.5 Learning Objectives:.3.
Checking the resolved resonance region in EXFOR database
 Checking the reslved resnance regin in EXFOR database Gttfried Bertn Sciété de Calcul Mathématique (SCM) Oscar Cabells OECD/NEA Data Bank JEFF Meetings - Sessin JEFF Experiments Nvember 0-4, 017 Bulgne-Billancurt,
The standards are taught in the following sequence.
 B L U E V A L L E Y D I S T R I C T C U R R I C U L U M MATHEMATICS Third Grade In grade 3, instructinal time shuld fcus n fur critical areas: (1) develping understanding f multiplicatin and divisin and
Chapter Summary. Mathematical Induction Strong Induction Recursive Definitions Structural Induction Recursive Algorithms
 Chapter 5 1 Chapter Summary Mathematical Inductin Strng Inductin Recursive Definitins Structural Inductin Recursive Algrithms Sectin 5.1 3 Sectin Summary Mathematical Inductin Examples f Prf by Mathematical
making triangle (ie same reference angle) ). This is a standard form that will allow us all to have the X= y=
 ). This is a standard form that will allow us all to have the X= y=") Intrductin t Vectrs I 21 Intrductin t Vectrs I 22 I. Determine the hrizntal and vertical cmpnents f the resultant vectr by cunting n the grid. X= y= J. Draw a mangle with hrizntal and vertical cmpnents
Intrductin t Vectrs I 21 Intrductin t Vectrs I 22 I. Determine the hrizntal and vertical cmpnents f the resultant vectr by cunting n the grid. X= y= J. Draw a mangle with hrizntal and vertical cmpnents
Excessive Social Imbalances and the Performance of Welfare States in the EU. Frank Vandenbroucke, Ron Diris and Gerlinde Verbist
 Excessive Scial Imbalances and the Perfrmance f Welfare States in the EU Frank Vandenbrucke, Rn Diris and Gerlinde Verbist Child pverty in the Eurzne, SILC 2008 35.00 30.00 25.00 20.00 15.00 10.00 5.00.00
Physics 2010 Motion with Constant Acceleration Experiment 1
 . Physics 00 Mtin with Cnstant Acceleratin Experiment In this lab, we will study the mtin f a glider as it accelerates dwnhill n a tilted air track. The glider is supprted ver the air track by a cushin
Physics 2B Chapter 23 Notes - Faraday s Law & Inductors Spring 2018
 Michael Faraday lived in the Lndn area frm 1791 t 1867. He was 29 years ld when Hand Oersted, in 1820, accidentally discvered that electric current creates magnetic field. Thrugh empirical bservatin and
ENSC Discrete Time Systems. Project Outline. Semester
 ENSC 49 - iscrete Time Systems Prject Outline Semester 006-1. Objectives The gal f the prject is t design a channel fading simulatr. Upn successful cmpletin f the prject, yu will reinfrce yur understanding
SUPPLEMENTARY MATERIAL GaGa: a simple and flexible hierarchical model for microarray data analysis
 SUPPLEMENTARY MATERIAL GaGa: a simple and flexible hierarchical mdel fr micrarray data analysis David Rssell Department f Bistatistics M.D. Andersn Cancer Center, Hustn, TX 77030, USA rsselldavid@gmail.cm
THE LIFE OF AN OBJECT IT SYSTEMS
 THE LIFE OF AN OBJECT IT SYSTEMS Persns, bjects, r cncepts frm the real wrld, which we mdel as bjects in the IT system, have "lives". Actually, they have tw lives; the riginal in the real wrld has a life,
Interference is when two (or more) sets of waves meet and combine to produce a new pattern.
 sets of waves meet and combine to produce a new pattern.") Interference Interference is when tw (r mre) sets f waves meet and cmbine t prduce a new pattern. This pattern can vary depending n the riginal wave directin, wavelength, amplitude, etc. The tw mst extreme
Interference Interference is when tw (r mre) sets f waves meet and cmbine t prduce a new pattern. This pattern can vary depending n the riginal wave directin, wavelength, amplitude, etc. The tw mst extreme
Perfrmance f Sensitizing Rules n Shewhart Cntrl Charts with Autcrrelated Data Key Wrds: Autregressive, Mving Average, Runs Tests, Shewhart Cntrl Chart
 Perfrmance f Sensitizing Rules n Shewhart Cntrl Charts with Autcrrelated Data Sandy D. Balkin Dennis K. J. Lin y Pennsylvania State University, University Park, PA 16802 Sandy Balkin is a graduate student
Eric Klein and Ning Sa
 Week 12. Statistical Appraches t Netwrks: p1 and p* Wasserman and Faust Chapter 15: Statistical Analysis f Single Relatinal Netwrks There are fur tasks in psitinal analysis: 1) Define Equivalence 2) Measure
Phys. 344 Ch 7 Lecture 8 Fri., April. 10 th,
 Phys. 344 Ch 7 Lecture 8 Fri., April. 0 th, 009 Fri. 4/0 8. Ising Mdel f Ferrmagnets HW30 66, 74 Mn. 4/3 Review Sat. 4/8 3pm Exam 3 HW Mnday: Review fr est 3. See n-line practice test lecture-prep is t
How topics involving numbers are taught within Budehaven Community School
 Numeracy Acrss The Curriculum Hw tpics invlving numbers are taught within Budehaven Cmmunity Schl Cmpiled by James Grill - 1 - Cntents Tpic Page Intrductin 3 Basics 4 Estimating 5 Runding 6 Subtractin
download instant at
 dwnlad instant at wwweasysemestercm Part A: Overview and Suggestins Statistics in the Cntext f Scientific Research This chapter pens with an verview f scientific research The gal is t cnvey the pint that
Writing Guidelines. (Updated: November 25, 2009) Forwards
 Forwards") Writing Guidelines (Updated: Nvember 25, 2009) Frwards I have fund in my review f the manuscripts frm ur students and research assciates, as well as thse submitted t varius jurnals by thers that the majr
Writing Guidelines (Updated: Nvember 25, 2009) Frwards I have fund in my review f the manuscripts frm ur students and research assciates, as well as thse submitted t varius jurnals by thers that the majr
CHAPTER 4 DIAGNOSTICS FOR INFLUENTIAL OBSERVATIONS
 CHAPTER 4 DIAGNOSTICS FOR INFLUENTIAL OBSERVATIONS 1 Influential bservatins are bservatins whse presence in the data can have a distrting effect n the parameter estimates and pssibly the entire analysis,
Distributions, spatial statistics and a Bayesian perspective
 Distributins, spatial statistics and a Bayesian perspective Dug Nychka Natinal Center fr Atmspheric Research Distributins and densities Cnditinal distributins and Bayes Thm Bivariate nrmal Spatial statistics
Chemistry 20 Lesson 11 Electronegativity, Polarity and Shapes
 Chemistry 20 Lessn 11 Electrnegativity, Plarity and Shapes In ur previus wrk we learned why atms frm cvalent bnds and hw t draw the resulting rganizatin f atms. In this lessn we will learn (a) hw the cmbinatin
2004 AP CHEMISTRY FREE-RESPONSE QUESTIONS
 2004 AP CHEMISTRY FREE-RESPONSE QUESTIONS 6. An electrchemical cell is cnstructed with an pen switch, as shwn in the diagram abve. A strip f Sn and a strip f an unknwn metal, X, are used as electrdes.
PSU GISPOPSCI June 2011 Ordinary Least Squares & Spatial Linear Regression in GeoDa
 There are tw parts t this lab. The first is intended t demnstrate hw t request and interpret the spatial diagnstics f a standard OLS regressin mdel using GeDa. The diagnstics prvide infrmatin abut the
Five Whys How To Do It Better
 Five Whys Definitin. As explained in the previus article, we define rt cause as simply the uncvering f hw the current prblem came int being. Fr a simple causal chain, it is the entire chain. Fr a cmplex
INSTRUMENTAL VARIABLES
 INSTRUMENTAL VARIABLES Technical Track Sessin IV Sergi Urzua University f Maryland Instrumental Variables and IE Tw main uses f IV in impact evaluatin: 1. Crrect fr difference between assignment f treatment
CS 477/677 Analysis of Algorithms Fall 2007 Dr. George Bebis Course Project Due Date: 11/29/2007
 CS 477/677 Analysis f Algrithms Fall 2007 Dr. Gerge Bebis Curse Prject Due Date: 11/29/2007 Part1: Cmparisn f Srting Algrithms (70% f the prject grade) The bjective f the first part f the assignment is
NUROP CONGRESS PAPER CHINESE PINYIN TO CHINESE CHARACTER CONVERSION
 NUROP Chinese Pinyin T Chinese Character Cnversin NUROP CONGRESS PAPER CHINESE PINYIN TO CHINESE CHARACTER CONVERSION CHIA LI SHI 1 AND LUA KIM TENG 2 Schl f Cmputing, Natinal University f Singapre 3 Science
Lab #3: Pendulum Period and Proportionalities
 Physics 144 Chwdary Hw Things Wrk Spring 2006 Name: Partners Name(s): Intrductin Lab #3: Pendulum Perid and Prprtinalities Smetimes, it is useful t knw the dependence f ne quantity n anther, like hw the
Department of Economics, University of California, Davis Ecn 200C Micro Theory Professor Giacomo Bonanno. Insurance Markets
 Department f Ecnmics, University f alifrnia, Davis Ecn 200 Micr Thery Prfessr Giacm Bnann Insurance Markets nsider an individual wh has an initial wealth f. ith sme prbability p he faces a lss f x (0
Flipping Physics Lecture Notes: Simple Harmonic Motion Introduction via a Horizontal Mass-Spring System
 Flipping Physics Lecture Ntes: Simple Harmnic Mtin Intrductin via a Hrizntal Mass-Spring System A Hrizntal Mass-Spring System is where a mass is attached t a spring, riented hrizntally, and then placed
CHM112 Lab Graphing with Excel Grading Rubric
 Name CHM112 Lab Graphing with Excel Grading Rubric Criteria Pints pssible Pints earned Graphs crrectly pltted and adhere t all guidelines (including descriptive title, prperly frmatted axes, trendline
Experiment #3. Graphing with Excel
 Experiment #3. Graphing with Excel Study the "Graphing with Excel" instructins that have been prvided. Additinal help with learning t use Excel can be fund n several web sites, including http://www.ncsu.edu/labwrite/res/gt/gt-
Function notation & composite functions Factoring Dividing polynomials Remainder theorem & factor property
 Functin ntatin & cmpsite functins Factring Dividing plynmials Remainder therem & factr prperty Can d s by gruping r by: Always lk fr a cmmn factr first 2 numbers that ADD t give yu middle term and MULTIPLY
Unit Project Descriptio
 Unit Prject Descriptin: Using Newtn s Laws f Mtin and the scientific methd, create a catapult r trebuchet that will sht a marshmallw at least eight feet. After building and testing yur machine at hme,
BASD HIGH SCHOOL FORMAL LAB REPORT
 BASD HIGH SCHOOL FORMAL LAB REPORT *WARNING: After an explanatin f what t include in each sectin, there is an example f hw the sectin might lk using a sample experiment Keep in mind, the sample lab used
Computational modeling techniques
 Cmputatinal mdeling techniques Lecture 4: Mdel checing fr ODE mdels In Petre Department f IT, Åb Aademi http://www.users.ab.fi/ipetre/cmpmd/ Cntent Stichimetric matrix Calculating the mass cnservatin relatins
Bios 6648: Design & conduct of clinical research
 Bis 6648: Design & cnduct f clinical research Sectin 3 - Essential principle 3.1 Masking (blinding) 3.2 Treatment allcatin (randmizatin) 3.3 Study quality cntrl : Interim decisin and grup sequential :
Stage 6 PROMPT sheet. 2 > -2 We say 2 is bigger than -2-2 < 2 We say -2 is less than 2. 6/2 Negative numbers. l l l l l l l
 Stage 6 PROMPT sheet 6/ Place value in numbers t 0millin The psitin f the digit gives its size Ten millins Millins Hundred thusands Ten thusands thusands hundreds tens units 4 5 6 7 8 Example The value
5 th grade Common Core Standards
 5 th grade Cmmn Cre Standards In Grade 5, instructinal time shuld fcus n three critical areas: (1) develping fluency with additin and subtractin f fractins, and develping understanding f the multiplicatin
SPH3U1 Lesson 06 Kinematics
 PROJECTILE MOTION LEARNING GOALS Students will: Describe the mtin f an bject thrwn at arbitrary angles thrugh the air. Describe the hrizntal and vertical mtins f a prjectile. Slve prjectile mtin prblems.
o o IMPORTANT REMINDERS Reports will be graded largely on their ability to clearly communicate results and important conclusions.
 BASD High Schl Frmal Lab Reprt GENERAL INFORMATION 12 pt Times New Rman fnt Duble-spaced, if required by yur teacher 1 inch margins n all sides (tp, bttm, left, and right) Always write in third persn (avid
Introduction to Quantitative Genetics II: Resemblance Between Relatives
 Intrductin t Quantitative Genetics II: Resemblance Between Relatives Bruce Walsh 8 Nvember 006 EEB 600A The heritability f a trait, a central cncept in quantitative genetics, is the prprtin f variatin
End of Course Algebra I ~ Practice Test #2
 End f Curse Algebra I ~ Practice Test #2 Name: Perid: Date: 1: Order the fllwing frm greatest t least., 3, 8.9, 8,, 9.3 A. 8, 8.9,, 9.3, 3 B., 3, 8, 8.9,, 9.3 C. 9.3, 3,,, 8.9, 8 D. 3, 9.3,,, 8.9, 8 2:
Weathering. Title: Chemical and Mechanical Weathering. Grade Level: Subject/Content: Earth and Space Science
 Weathering Title: Chemical and Mechanical Weathering Grade Level: 9-12 Subject/Cntent: Earth and Space Science Summary f Lessn: Students will test hw chemical and mechanical weathering can affect a rck
A New Evaluation Measure. J. Joiner and L. Werner. The problems of evaluation and the needed criteria of evaluation
 III-l III. A New Evaluatin Measure J. Jiner and L. Werner Abstract The prblems f evaluatin and the needed criteria f evaluatin measures in the SMART system f infrmatin retrieval are reviewed and discussed.
Chapter 3: Cluster Analysis
 Chapter 3: Cluster Analysis } 3.1 Basic Cncepts f Clustering 3.1.1 Cluster Analysis 3.1. Clustering Categries } 3. Partitining Methds 3..1 The principle 3.. K-Means Methd 3..3 K-Medids Methd 3..4 CLARA
Lecture 2: Supervised vs. unsupervised learning, bias-variance tradeoff
 Lecture 2: Supervised vs. unsupervised learning, bias-variance tradeff Reading: Chapter 2 STATS 202: Data mining and analysis September 27, 2017 1 / 20 Supervised vs. unsupervised learning In unsupervised
CLASS. Fractions and Angles. Teacher Report. No. of test takers: 25. School Name: EI School. City: Ahmedabad CLASS 6 B 8709
 SEPTEMBER 07 Math Fractins and Angles CLASS 6 Teacher Reprt Test Taken 4 5 6 7 8 Schl Name: EI Schl City: Ahmedabad CLASS SECTION EXAM CODE 6 B 8709 N. f test takers: 5 6.5 Average.5 9.0 Range (Scres are
CESAR Science Case The differential rotation of the Sun and its Chromosphere. Introduction. Material that is necessary during the laboratory
 Teacher s guide CESAR Science Case The differential rtatin f the Sun and its Chrmsphere Material that is necessary during the labratry CESAR Astrnmical wrd list CESAR Bklet CESAR Frmula sheet CESAR Student
CHE 105 EXAMINATION III November 11, 2010
 CHE 105 EXAMINATION III Nvember 11, 2010 University f Kentucky Department f Chemistry READ THESE DIRECTIONS CAREFULLY BEFORE STARTING THE EXAMINATION! It is extremely imprtant that yu fill in the answer
Medium Scale Integrated (MSI) devices [Sections 2.9 and 2.10]
![Medium Scale Integrated (MSI) devices [Sections 2.9 and 2.10]](/thumbs/74/69894502.jpg "Medium Scale Integrated (MSI) devices [Sections 2.9 and 2.10]") EECS 270, Winter 2017, Lecture 3 Page 1 f 6 Medium Scale Integrated (MSI) devices [Sectins 2.9 and 2.10] As we ve seen, it s smetimes nt reasnable t d all the design wrk at the gate-level smetimes we just
EECS 270, Winter 2017, Lecture 3 Page 1 f 6 Medium Scale Integrated (MSI) devices [Sectins 2.9 and 2.10] As we ve seen, it s smetimes nt reasnable t d all the design wrk at the gate-level smetimes we just
Internal vs. external validity. External validity. This section is based on Stock and Watson s Chapter 9.
 Sectin 7 Mdel Assessment This sectin is based n Stck and Watsn s Chapter 9. Internal vs. external validity Internal validity refers t whether the analysis is valid fr the ppulatin and sample being studied.
Lecture 2: Supervised vs. unsupervised learning, bias-variance tradeoff
 Lecture 2: Supervised vs. unsupervised learning, bias-variance tradeff Reading: Chapter 2 STATS 202: Data mining and analysis September 27, 2017 1 / 20 Supervised vs. unsupervised learning In unsupervised
How T o Start A n Objective Evaluation O f Your Training Program
 J O U R N A L Hw T Start A n Objective Evaluatin O f Yur Training Prgram DONALD L. KIRKPATRICK, Ph.D. Assistant Prfessr, Industrial Management Institute University f Wiscnsin Mst training m e n agree that
Flipping Physics Lecture Notes: Simple Harmonic Motion Introduction via a Horizontal Mass-Spring System
 Flipping Physics Lecture Ntes: Simple Harmnic Mtin Intrductin via a Hrizntal Mass-Spring System A Hrizntal Mass-Spring System is where a mass is attached t a spring, riented hrizntally, and then placed
Group Color: Subgroup Number: How Science Works. Grade 5. Module 2. Class Question: Scientist (Your Name): Teacher s Name: SciTrek Volunteer s Name:
: Teacher s Name: SciTrek Volunteer s Name:") Grup Clr: Subgrup Number: Hw Science Wrks Grade 5 Mdule 2 Class Questin: Scientist (Yur Name): Teacher s Name: SciTrek Vlunteer s Name: VOCABULARY Science: The study f the material wrld using human reasn.
Grup Clr: Subgrup Number: Hw Science Wrks Grade 5 Mdule 2 Class Questin: Scientist (Yur Name): Teacher s Name: SciTrek Vlunteer s Name: VOCABULARY Science: The study f the material wrld using human reasn.
Unit 1 Study Guide Name Date Scientific Method Notes
 Unit 1 Study Guide Name Date Scientific Methd Ntes 1) What is the difference between an bservatin and an inference? 2) What are the tw types f bservatins? Give examples f each type. 3) Define the fllwing:
Name: Block: Date: Science 10: The Great Geyser Experiment A controlled experiment
 Science 10: The Great Geyser Experiment A cntrlled experiment Yu will prduce a GEYSER by drpping Ments int a bttle f diet pp Sme questins t think abut are: What are yu ging t test? What are yu ging t measure?
CHAPTER 2 Algebraic Expressions and Fundamental Operations
 CHAPTER Algebraic Expressins and Fundamental Operatins OBJECTIVES: 1. Algebraic Expressins. Terms. Degree. Gruping 5. Additin 6. Subtractin 7. Multiplicatin 8. Divisin Algebraic Expressin An algebraic
AIP Logic Chapter 4 Notes
 AIP Lgic Chapter 4 Ntes Sectin 4.1 Sectin 4.2 Sectin 4.3 Sectin 4.4 Sectin 4.5 Sectin 4.6 Sectin 4.7 4.1 The Cmpnents f Categrical Prpsitins There are fur types f categrical prpsitins. Prpsitin Letter
Study Group Report: Plate-fin Heat Exchangers: AEA Technology
 Study Grup Reprt: Plate-fin Heat Exchangers: AEA Technlgy The prblem under study cncerned the apparent discrepancy between a series f experiments using a plate fin heat exchanger and the classical thery
Simple Linear Regression (single variable)
") Simple Linear Regressin (single variable) Intrductin t Machine Learning Marek Petrik January 31, 2017 Sme f the figures in this presentatin are taken frm An Intrductin t Statistical Learning, with applicatins
Simple Linear Regressin (single variable) Intrductin t Machine Learning Marek Petrik January 31, 2017 Sme f the figures in this presentatin are taken frm An Intrductin t Statistical Learning, with applicatins
NGSS High School Physics Domain Model
 NGSS High Schl Physics Dmain Mdel Mtin and Stability: Frces and Interactins HS-PS2-1: Students will be able t analyze data t supprt the claim that Newtn s secnd law f mtin describes the mathematical relatinship
Module 4: General Formulation of Electric Circuit Theory
 Mdule 4: General Frmulatin f Electric Circuit Thery 4. General Frmulatin f Electric Circuit Thery All electrmagnetic phenmena are described at a fundamental level by Maxwell's equatins and the assciated
FIZIKA ANGOL NYELVEN JAVÍTÁSI-ÉRTÉKELÉSI ÚTMUTATÓ
 Fizika angl nyelven emelt szint 0804 ÉRETTSÉGI VIZSGA 010. május 18. FIZIKA ANGOL NYELVEN EMELT SZINTŰ ÍRÁSBELI ÉRETTSÉGI VIZSGA JAVÍTÁSI-ÉRTÉKELÉSI ÚTMUTATÓ OKTATÁSI ÉS KULTURÁLIS MINISZTÉRIUM In marking
TEST 3A AP Statistics Name: Directions: Work on these sheets. A standard normal table is attached.
 TEST 3A AP Statistics Name: Directins: Wrk n these sheets. A standard nrmal table is attached. Part 1: Multiple Chice. Circle the letter crrespnding t the best answer. 1. In a statistics curse, a linear
Synchronous Motor V-Curves
 Synchrnus Mtr V-Curves 1 Synchrnus Mtr V-Curves Intrductin Synchrnus mtrs are used in applicatins such as textile mills where cnstant speed peratin is critical. Mst small synchrnus mtrs cntain squirrel
Trigonometric Ratios Unit 5 Tentative TEST date
 1 U n i t 5 11U Date: Name: Trignmetric Ratis Unit 5 Tentative TEST date Big idea/learning Gals In this unit yu will extend yur knwledge f SOH CAH TOA t wrk with btuse and reflex angles. This extensin
EXAM #1 PHYSICAL SCIENCE 103 Spring, 2016
 OBJECTIVES 1. Ft Pressure EXAM #1 PHYSICAL SCIENCE 103 Spring, 2016 Determine the surface area f an bject. Given the weight and surface area, calculate the pressure. 2. Measuring Vlume & Mass Prvided a
MODULE 1. e x + c. [You can t separate a demominator, but you can divide a single denominator into each numerator term] a + b a(a + b)+1 = a + b
![MODULE 1. e x + c. [You can t separate a demominator, but you can divide a single denominator into each numerator term] a + b a(a + b)+1 = a + b](/thumbs/78/78051685.jpg "MODULE 1. e x + c. [You can t separate a demominator, but you can divide a single denominator into each numerator term] a + b a(a + b)+1 = a + b") . REVIEW OF SOME BASIC ALGEBRA MODULE () Slving Equatins Yu shuld be able t slve fr x: a + b = c a d + e x + c and get x = e(ba +) b(c a) d(ba +) c Cmmn mistakes and strategies:. a b + c a b + a c, but
. REVIEW OF SOME BASIC ALGEBRA MODULE () Slving Equatins Yu shuld be able t slve fr x: a + b = c a d + e x + c and get x = e(ba +) b(c a) d(ba +) c Cmmn mistakes and strategies:. a b + c a b + a c, but
This section is primarily focused on tools to aid us in finding roots/zeros/ -intercepts of polynomials. Essentially, our focus turns to solving.
 Sectin 3.2: Many f yu WILL need t watch the crrespnding vides fr this sectin n MyOpenMath! This sectin is primarily fcused n tls t aid us in finding rts/zers/ -intercepts f plynmials. Essentially, ur fcus