Introduction to Probabilistic Graphical Models
|
|
|
- Randolph Sutton
- 5 years ago
- Views:
Transcription
1 Introduction to Probabilistic Graphical Models Sargur Srihari 1
2 Topics 1. What are probabilistic graphical models (PGMs) 2. Use of PGMs Engineering and AI 3. Directionality in graphs 4. Bayesian Networks 5. Generative Models and Sampling 6. Using PGMs with fully Bayesian Models 7. Complexity Issues 2
3 What are Graphical Models? They are diagrammatic representations of probability distributions marriage between probability theory and graph theory Also called probabilistic graphical models They augment analysis instead of using pure algebra 3
4 What is a Graph? Consists of nodes (also called vertices) and links (also called edges or arcs) In a probabilistic graphical model each node represents a random variable (or group of random variables) Links express probabilistic relationships between variables 4
5 Graphical Models in Engineering Natural tool for handling Uncertainty and Complexity which occur throughout applied mathematics and engineering Fundamental to the idea of a graphical model is the notion of modularity a complex system is built by combining simpler parts. 5
6 Why are Graphical Models useful in Engineering? Probability theory provides the glue whereby the parts are combined, ensuring that the system as a whole is consistent providing ways to interface models to data. Graph theoretic side provides: Intuitively appealing interface by which humans can model highly-interacting sets of variables Data structure that lends itself naturally to designing efficient general-purpose algorithms 6
7 Graphical models: Unifying Framework View classical multivariate probabilistic systems as instances of a common underlying formalism mixture models, factor analysis, hidden Markov models, Kalman filters and Ising models Encountered in systems engineering, information theory, pattern recognition and statistical mechanics Advantages of View: Specialized techniques in one field can be transferred between communities and exploited Provides natural framework for designing new systems 7
8 Role of Graphical Models in ML 1. Simple way to visualize structure of probabilistic model 2. Insights into properties of model Conditional independence properties by inspecting graph 3. Complex computations required to perform inference and learning expressed as graphical manipulations 8
9 Graph Directionality Directed graphical models directionality associated with arrows Bayesian networks Express causal relationships between random variables More popular in AI and statistics Undirected graphical models links without arrows Markov random fields Better suited to express soft constraints between variables More popular in Vision and physics 9
10 Independence and Inference MRFs have simple definition of independence Two sets of nodes are conditionally independent given a third set C if all nodes in A and B are connected through nodes in C BN independence is more complex Involves direction of arcs Inference problems Convenient to convert both to factor graph representation 10
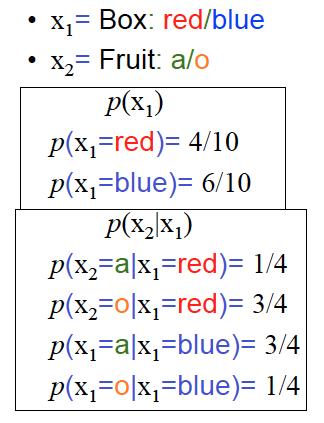
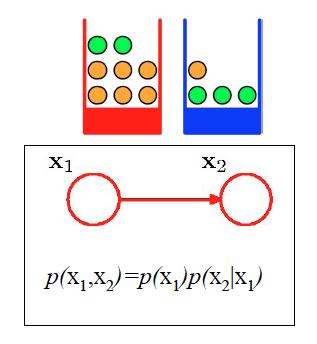
11 Bayesian Networks Directed graphs used to describe probability distributions Consider Joint distribution of three variables a,b,c Powerful aspect of graphical models Not necessary to state whether they are discrete or continuous A specific graph can make probabilistic statements about a broad class of distributions Bayesian Network is not necessarily Bayesian statistics 11
12 Joint and Conditional Distributions The necessary probability theory can be expressed in terms of two simple equations Sum Rule probability of a variable is obtained by marginalizing or summing out other variables Product Rule p( a) joint probability expressed in terms of conditionals p( a, b) = b = p( a, b) p( b a) p( a) All probabilistic inference and learning amounts to repeated application of sum and product rule 12
13 From Joint Distribution to Graphical Model Consider Joint distribution p(a,b,c) By product rule p(a,b,c)=p(c a,b)p(a,b) Again by product rule we get p(a,b,c)=p(c a,b)p(b a)p(a) This decomposition holds for any choice of the joint distribution 13
14 Directed Graphical Model p(a,b,c)=p(c a,b)p(b a)p(a) Now represent rhs by graphical model Introduce a node for each random variable Associate each node with conditional distribution on rhs For each conditional distribution add links (arrow): for p(c a,b) links from a and b to c Different ordering of variables would give a different graph TERMINOLOGY Node a is parent of node b Node b is child of node a No distinction between node 14 and variable

15 From Graph to Distribution 15
16 Ex: Conditional Probabilities 16
17 Joint distribution of K variables Repeated application of product rule gives p(x 1,..,x K )=p(x K x 1,..,x K-1 )..p(x 2 x 1 )p(x 1 ) Represent by K nodes, one for each conditional distribution Each node has incoming nodes from all lower-numbered nodes These are fully connected Link between every pair of nodes x 2 x 4 x 1 x 5 K=6 x 3 x 6 17
18 Not a fully connected graph Absence of links carry interesting information Not a fully connected graph with 7 variables No link from x 1 to x 2 or from x 3 to x 7 Joint distribution given by p(x 1 ) p(x 2 ) p(x 3 )p(x 4 x 1,x 2, x 3 )p(x 5 x 1, x 3 ) p(x 6 x 4 ) p(x 7 x 4,x 5 ) Directed acyclic graph over seven variables 18
19 Graph to Probability Distribution Joint distribution defined by a graph is given by a product Product terms are conditional distributions of each node conditioned on variables corresponding to parents of that node in the graph p(x) = K k = 1 p( x k pa k ) where x=(x 1,..,x K ) and pa k denotes set of parents of a k By inspection, joint distribution given by p(x 1 ) p(x 2 ) p(x 3 )p(x 4 x 1,x 2, x 3 )p(x 5 x 1, x 3 )p(x 6 x 4 ) p(x 7 x 4,x 5 ) 19
20 Examples of graphs and distributions Each graph has three nodes Applying parent rule we get the factors for each graph p(a,b,c)=p(a c)p(b c)p(c) p(a,b,c)=p(a)p(b)p(c a,b) p(a,b,c)=p(a)p(c a)p(b c) 20
21 Example: Bayesian Polynomial Regression Illustration of directed graph to describe probability distributions The polynomial regression problem y(x,w) = w 0 + w 1 x + w 2 x w M x M Probabilistic formulation with Random variables: Vector of polynomial coefficients w Observed data t =(t 1,..,t N ) T where t n =y(x n,w)+e is a noise corrupted version of x n Focusing on random variables, joint distribution is given by From product rule p( t, w) = p(t,w)=p(w)p(t w) N p( t n n= 1 p(w) w) Since samples are independent prior Conditional distributions 21
")
22 Graph for Polynomial Regression Joint distribution is given by p( t, w) = p(w) n= 1 It is to be represented by a graphical model Observing rhs introduce a node for each variable Introduce associations A link for each conditional distribution Equivalent plate representation N p( t n w) 22
23 Parameters in Bayesian Poly Regression Random variables: Vector of polynomial coefficients w Observed data t =(t 1,..,t N ) T where t n is a noise corrupted version of x n Additionally model contains: Input data x =(x 1,..,x N ) T Noise variance σ 2 Hyper-parameter α, which is the precision (inverse variance) of Gaussian prior Focusing on random variables, joint distribution is given by Parameters of model rather than random variables p( t, w) = p(w) N p( t n w) Gaussian prior with precision n= 1 α Conditional distributions with variance σ 2 23
24 With Deterministic Parameters Sometimes useful to explicitly show parameters of model Same model with deterministic parameters p(t, w x,α,σ 2 ) = p(w α ) p(t n w,x n,σ 2 ) Random variables are denoted by open circles Deterministic parameters by smaller (tiny) solid circles N n=1 24
25 Observed and Latent Variables In ML some random variables are set to specific observed values Observed variable nodes are shaded Variable w is not observed It is latent or hidden Nodes t n are shaded to indicate corresponding variables are set to observed values 25
26 Including predictions Polynomial Regression model including input and predicted values Need to write out longer probability expression including new input value xˆ and model prediction t^ Joint distribution of all variables in this model 2 p(ˆ, t t, w xˆ, x, α, σ ) = p(w α) Predictive distribution N n= 1 p( t w, x p(ˆt ˆx,x,α,σ 2 ) α p(ˆt, t, w ˆx,x,α,σ 2 ) n n 2, σ ) p(ˆ t dw 2 xˆ, w, σ ) 26
27 Generative Models Many situations where we need to draw samples from a probability distribution Many methods of sampling exist Ancestral Sampling is relevant to graphical models Given a graphical model we can specify how samples can be drawn from the joint or marginal distributions Conditional can be drawn by setting the parent value to known value 27
28 Specifying Sampling Problem Joint distribution p(x 1,..,x K ) over K variables which factorizes according to p(x) = K k = 1 p( x k pa k ) Assume each node has a higher numbered node than its parents Goal is to draw a sample x, xˆ,.., ˆ from this distribution ˆ1 2 x K 28
29 Ancestral Sampling Start with lowest numbered node Draw a sample from the distribution p(x 1 ) which we call Work through each of the nodes in order For node n we draw a sample from conditional distribution p(x n pa n ) Where parent variables are set to their sampled values Once final variable x K is sampled Achieved objective of obtaining a single sample from joint distribution To sample from marginal distribution Sample from full distribution and discard unnecessary values E.g., to draw from distribution p(x 2,x 4 ) simply sample from full distribution, retain values x 2^,x 4^ and discard remaining values { ˆx j 2,4 } ˆx 1 29
30 Numbering in Practical Applications Higher numbered variables Correspond to terminal nodes of graph Represent observations Lower numbered nodes Correspond to latent variables Latent variables allow complicated distribution over observed variables to be represented in terms of simpler (typically exponential family) distributions 30
31 Causal Model Example Models can express processes by which the observed data arose Object recognition task Observed data point is an image of one of the objects Latent variables are position and orientation of object To find posterior distribution over object Integrate over all positions and orientations The graphical model captures causal process by which data is generated 31
32 Generative Model Since data can be generated from causal model it is a generative model Ancestral sampling could be used to generate synthetic data Mimics creation of observed data Gives rise to fantasy data whose probability distribution is the same as model Synthetic observation is informative in understanding form of distribution represented by model Image pixel intensities are dependent on identity of object as well as its pose 32
33 But..Polynomial Regression Model is not generative No probability distribution associated with input variable x Not possible to generate synthetic data points from this model Can make it generative by introducing a prior distribution p(x) 33
34 Discrete Variables When constructing more complex probability distributions from simpler (exponential) distributions graphical models are useful Graphical models have nice properties when each parent-child pair are conjugate Two cases of interest: Both correspond to discrete variables Both correspond to Gaussian variables 34
35 Discrete Case Probability distribution variable x having K states Using 1 of K representation for a single discrete For K=6 when x 3 =1 then x represented as x=(0,0,1,0,0,0) T Note that K x = k = 1 k If probability of x k =1 is given by parameter K ( x µ) = x p µ where µ = ( µ,.., µ k = 1 The distribution is normalized: 1 k k p(x µ) There are K-1 independent values for needed to define distribution 35 x: 1 K K k = 1 x 1 x K ) T µ k µ k = 1 µ k
36 Two Discrete Variables x 1 and x 2 each with K states each Denote probability of both x 1k =1 and x 2l =1 by x 1 : x 2 : x 11 x 21 µ kl x 1K x 2K where x 1k denotes k th component of x 1 Joint distribution is p(x 1, x 2 µ) = Since parameters are subject to constraint There are K 2-1 parameters K k=1 K l=1 x µ 1k x 2 l kl k l µ kl For arbitrary distribution over M variables there are K M -1 parameters =1 36
 has K-1 parameters Conditional distribution p(x 2 x 1 ) also requires K-1 parameters for each of K values of x 1 Total number of parameters is (K-1)+K(K-1) =K 2-1 As before")
37 Graphical Models for Two Discrete Variables Joint distribution p(x 1,x 2 ) Using product rule is factored as p(x 2 x 1 )p(x 1 ) Has two node graph Marginal distribution p(x 1 ) has K-1 parameters Conditional distribution p(x 2 x 1 ) also requires K-1 parameters for each of K values of x 1 Total number of parameters is (K-1)+K(K-1) =K 2-1 As before 37
38 Two Independent Discrete Variables x 1 and x 2 are independent Has graphical model Each variable described by a separate multinomial distribution Total no of parameters is 2(K-1) For M variables no of parameters is M(K-1) Reduced number of parameters by dropping links in graph Grows linearly with no of variables 38
39 Fully connected has high complexity General case of M discrete variables x 1,.., x M If BN is fully connected Completely general distribution with K M -1 parameters If there are no links Joint distribution factorizes into product of marginals Total no of parameters is M(K-1) Graphs of intermediate levels of connectivity More general distribution than fully factorized ones Require fewer parameters than general joint distribution Example: chain of nodes 39
40 Special Case: Chain of Nodes Marginal distribution p(x 1 ) requires K-1 parameters Each of the M-1 conditional distributions p(x i x i-1 ), for i=2,..,m requires K(K-1) parameters Total parameter count is K-1+(M-1)K(K-1) Which is quadratic in K Grows linearly (not exponentially) with length of chain 40
41 Alternative: Sharing Parameters Reduce parameters by sharing or tying parameters In above, all conditional distributions p(x i x i-1 ), for i=2,..,m share same set of K(K-1) parameters governing distribution of x 1 Total of K 2-1 parameters needed to specify distribution 41
42 Conversion into Bayesian Model Given graph over discrete variables We can turn it into a Bayesian model by introducing Dirichlet priors for parameters Each node acquires an additional parent for each discrete node Tie the parameters governing conditional distributions p(x i x i-1 ) Chain of Nodes With priors Sharing Parameters 42
43 Bernoulli: p(x=1 µ)=µ Likelihood of Bernoulli with D={x 1,..x N } p(d µ) = Binomial: Conjugate Prior: Binomial: Beta Prior Bin(m N, µ) = Beta(µ a, b) = N µ x n n=1 N m (1 µ) 1 x n µ m (1 µ) N m Γ(a + b) Γ(a)Γ(b) µ a 1 (1 µ) b 1
44 Multinomial: Dirichlet Prior Generalized Bernoulli (1-of-K) x=(0,0,1,0,0,0) T K=6 Multinomial K x ( x µ) = µ k k where µ = ( 1 k = 1 p µ,.., µ ) Mult ( m1m 2 mk µ, N) = Where the normalization coefficient is the no of ways of partitioning N objects into K groups of size Conjugate prior distribution for parameters m k Normalized form is K N K.. µ k m1m 2.. mk k= 1 m m m.. 1, 2 α k k 1 p( µ α) α µ where 0 µ k 1 and µ = k k 1 Dir k= 1 K=2 is Binomial Γ( α ) K K 0 αk 1 ( µ α) = µ where α = k 0 αk Γ( α1)... Γ( αk ) k= 1 k= 1 K k m k T K=2 is Bernoulli N N! m1m 2.. m = k m1! m2!.. mk!
45 Controlling Number of parameters in models: Parameterized Conditional Distributions Control exponential growth of parameters in models of discrete variables Use parameterized models for conditional distributions instead of complete tables of conditional probability values 45
46 Parameterized Conditional Distributions Consider graph with binary variables Each parent variable x i governed by single parameter m i representing probability p(x i =1) M parameters in total for parent nodes Conditional distribution p(y x 1,..,x M ) requires 2 M parameters Representing probability p(y=1) for each of the 2 M settings of parent variables to
47 Conditional distribution using logistic sigmoid Parsimonious form of conditional distribution Logistic sigmoid acting on linear combination of parent variables p( y M = 1 x1,.., xm ) = σ w0 + wi xi = σ i= 1 T ( w x) where s(a) = (1+exp(-a)) -1 is the logistic sigmoid x=(x 0,x 1,..,x M ) T is vector of parent states No of parameters grows linearly with M Analogous to choice of a restrictive form of covariance matrix in multivariate Gaussian 47
48 Linear Gaussian Models Expressing multivariate Gaussian as a directed graph Corresponding to linear Gaussian model over component variables Mean of a conditional distribution is a linear function of the conditioning variable Allows expressing interesting structure of distribution General Gaussian case and diagonal covariance case represent opposite extremes 48
49 Graph with continuous random variables Arbitrary acyclic graph over D variables Node i represents a single continuous random variable x i having Gaussian distribution Mean of distribution is a linear combination of states of its parent nodes pa i of node i p ( x = Ν i pai ) xi + wijx j bi, v j pa i Where w ij and b i are parameters governing the mean v i is the variance of the conditional distribution for x i i 49
50 Joint Distribution Log of joint distribution ln p(x) = = - 1 2v x Where x=( x 1,..,x D ) T D i= 1 D i= 1 ln p( x i i i + const This is a quadratic function of x pa i ) j pa i w ij x j b i Hence joint distribution p(x) is a multivariate Gaussian 2 Terms independent of x 50
51 Mean and Covariance of Joint Distribution Recursive Formulation Since each variable x i has, conditional on the states of its parents, a Gaussian distribution, we can write where e i is a zero mean, unit variance Gaussian random variable satisfying E[e i ]=0 and E[e i e j ]=I ij and I ij is the i,j element of the identity matrix Taking expectation E[ x i ] = wije[ x j ] + bi j pa i Thus we can find components of E[x]=(E[x 1 ],..E[x D ]) T by starting at lowest numbered node and working recursively through the graph Similarly elements of covariance matrix cov[ x, x ] = w cov[ x, x ] + I i j j pa j jk i k ij x v i j = j pa i w ij + b i + v ε i i 51
52 Three cases for no. of parameters No links in the graph 2D parameters Fully connected graph D(D+1)/2 parameters Graphs with intermediate level of complexity Chain x 2 x 4 x 1 x 5 x 3 x 6 52
53 Extreme Case with no links D isolated nodes There are no parameters w ij Only D parameters b i and D parameters v i Mean of p(x) given by (b 1,..,b D ) T Covariance matrix is diagonal of form diag(v 1,..,v D ) Joint distribution has total of 2D parameters Represents set of D independent univariate Gaussian distributions 53
54 Extreme case with all links Fully connected graph Each node has all lower numbered nodes as parents Matrix w ij has i-1 entries on the ith row and hence is a lower triangular matrix (with no entries on leading diagonal) Total no of parameters w ij is to take D 2 no of elements in D x D matrix, subtracting D to account for diagonal and divide by 2 to account for elements only below diagonal 54
55 Graph with intermediate complexity Link missing between variables x 1 and x 3 Mean and covariance of joint distribution are µ = ( b, b + w b, b + w b + w w b ) 1 2 v1 = w21v1 w32w21v w v ( v w v w w v v 1 ) 32 w w w 1 32 ( v ( v 2 2 T w v w w v1 ) v1 ) 55
56 Extension to multivariate Gaussian variables Nodes in the graph represent multivariate Gaussian variables Write conditional distribution for node i in the form p (x i pai ) Ν xi Wijx j + bi, j pa i = where W ij is a matrix (non-square if x i and x j have different dimensionalities) v i 56
57 Summary 1. PGMs allow visualizing probabilistic models Joint distributions are directed/undirected PGMs 2. PGMs can be used to generate samples Ancestral sampling with directed PGMs is simple 3. PGMs are useful for Bayesian statistics Discrete variable PGM represented using Dirichlet priors 4. Parameter explosion controlled by tying parameters 5. Multivariate Gaussian expressed as PGM Graph is a linear Gaussian model over components 57
Chris Bishop s PRML Ch. 8: Graphical Models
 Chris Bishop s PRML Ch. 8: Graphical Models January 24, 2008 Introduction Visualize the structure of a probabilistic model Design and motivate new models Insights into the model s properties, in particular
Graphical Models 359
 8 Graphical Models Probabilities play a central role in modern pattern recognition. We have seen in Chapter 1 that probability theory can be expressed in terms of two simple equations corresponding to
STA 4273H: Statistical Machine Learning
 STA 4273H: Statistical Machine Learning Russ Salakhutdinov Department of Statistics! rsalakhu@utstat.toronto.edu! http://www.utstat.utoronto.ca/~rsalakhu/ Sidney Smith Hall, Room 6002 Lecture 3 Linear
A graph contains a set of nodes (vertices) connected by links (edges or arcs)
 connected by links (edges or arcs)") BOLTZMANN MACHINES Generative Models Graphical Models A graph contains a set of nodes (vertices) connected by links (edges or arcs) In a probabilistic graphical model, each node represents a random variable,
BOLTZMANN MACHINES Generative Models Graphical Models A graph contains a set of nodes (vertices) connected by links (edges or arcs) In a probabilistic graphical model, each node represents a random variable,
Conditional Independence
 Conditional Independence Sargur Srihari srihari@cedar.buffalo.edu 1 Conditional Independence Topics 1. What is Conditional Independence? Factorization of probability distribution into marginals 2. Why
Using Graphs to Describe Model Structure. Sargur N. Srihari
 Using Graphs to Describe Model Structure Sargur N. srihari@cedar.buffalo.edu 1 Topics in Structured PGMs for Deep Learning 0. Overview 1. Challenge of Unstructured Modeling 2. Using graphs to describe
Basic Sampling Methods
 Basic Sampling Methods Sargur Srihari srihari@cedar.buffalo.edu 1 1. Motivation Topics Intractability in ML How sampling can help 2. Ancestral Sampling Using BNs 3. Transforming a Uniform Distribution
Linear Dynamical Systems
 Linear Dynamical Systems Sargur N. srihari@cedar.buffalo.edu Machine Learning Course: http://www.cedar.buffalo.edu/~srihari/cse574/index.html Two Models Described by Same Graph Latent variables Observations
An Introduction to Bayesian Machine Learning
 1 An Introduction to Bayesian Machine Learning José Miguel Hernández-Lobato Department of Engineering, Cambridge University April 8, 2013 2 What is Machine Learning? The design of computational systems
Probability and Information Theory. Sargur N. Srihari
 Probability and Information Theory Sargur N. srihari@cedar.buffalo.edu 1 Topics in Probability and Information Theory Overview 1. Why Probability? 2. Random Variables 3. Probability Distributions 4. Marginal
Graphical Models and Kernel Methods
 Graphical Models and Kernel Methods Jerry Zhu Department of Computer Sciences University of Wisconsin Madison, USA MLSS June 17, 2014 1 / 123 Outline Graphical Models Probabilistic Inference Directed vs.
Learning Bayesian network : Given structure and completely observed data
 Learning Bayesian network : Given structure and completely observed data Probabilistic Graphical Models Sharif University of Technology Spring 2017 Soleymani Learning problem Target: true distribution
ECE521 Tutorial 11. Topic Review. ECE521 Winter Credits to Alireza Makhzani, Alex Schwing, Rich Zemel and TAs for slides. ECE521 Tutorial 11 / 4
 ECE52 Tutorial Topic Review ECE52 Winter 206 Credits to Alireza Makhzani, Alex Schwing, Rich Zemel and TAs for slides ECE52 Tutorial ECE52 Winter 206 Credits to Alireza / 4 Outline K-means, PCA 2 Bayesian
STA 4273H: Statistical Machine Learning
 STA 4273H: Statistical Machine Learning Russ Salakhutdinov Department of Computer Science! Department of Statistical Sciences! rsalakhu@cs.toronto.edu! h0p://www.cs.utoronto.ca/~rsalakhu/ Lecture 7 Approximate
Chapter 16. Structured Probabilistic Models for Deep Learning
 Peng et al.: Deep Learning and Practice 1 Chapter 16 Structured Probabilistic Models for Deep Learning Peng et al.: Deep Learning and Practice 2 Structured Probabilistic Models way of using graphs to describe
Undirected Graphical Models
 Outline Hong Chang Institute of Computing Technology, Chinese Academy of Sciences Machine Learning Methods (Fall 2012) Outline Outline I 1 Introduction 2 Properties Properties 3 Generative vs. Conditional
Part I. C. M. Bishop PATTERN RECOGNITION AND MACHINE LEARNING CHAPTER 8: GRAPHICAL MODELS
 Part I C. M. Bishop PATTERN RECOGNITION AND MACHINE LEARNING CHAPTER 8: GRAPHICAL MODELS Probabilistic Graphical Models Graphical representation of a probabilistic model Each variable corresponds to a
Gaussian Processes. Le Song. Machine Learning II: Advanced Topics CSE 8803ML, Spring 2012
 Gaussian Processes Le Song Machine Learning II: Advanced Topics CSE 8803ML, Spring 01 Pictorial view of embedding distribution Transform the entire distribution to expected features Feature space Feature
STA 4273H: Statistical Machine Learning
 STA 4273H: Statistical Machine Learning Russ Salakhutdinov Department of Statistics! rsalakhu@utstat.toronto.edu! http://www.utstat.utoronto.ca/~rsalakhu/ Sidney Smith Hall, Room 6002 Lecture 7 Approximate
Alternative Parameterizations of Markov Networks. Sargur Srihari
 Alternative Parameterizations of Markov Networks Sargur srihari@cedar.buffalo.edu 1 Topics Three types of parameterization 1. Gibbs Parameterization 2. Factor Graphs 3. Log-linear Models Features (Ising,
Bayesian Linear Regression. Sargur Srihari
 Bayesian Linear Regression Sargur srihari@cedar.buffalo.edu Topics in Bayesian Regression Recall Max Likelihood Linear Regression Parameter Distribution Predictive Distribution Equivalent Kernel 2 Linear
{ p if x = 1 1 p if x = 0
 Discrete random variables Probability mass function Given a discrete random variable X taking values in X = {v 1,..., v m }, its probability mass function P : X [0, 1] is defined as: P (v i ) = Pr[X =
Probabilistic Graphical Models (I)
") Probabilistic Graphical Models (I) Hongxin Zhang zhx@cad.zju.edu.cn State Key Lab of CAD&CG, ZJU 2015-03-31 Probabilistic Graphical Models Modeling many real-world problems => a large number of random
Probabilistic Graphical Models (I) Hongxin Zhang zhx@cad.zju.edu.cn State Key Lab of CAD&CG, ZJU 2015-03-31 Probabilistic Graphical Models Modeling many real-world problems => a large number of random
CS839: Probabilistic Graphical Models. Lecture 7: Learning Fully Observed BNs. Theo Rekatsinas
 CS839: Probabilistic Graphical Models Lecture 7: Learning Fully Observed BNs Theo Rekatsinas 1 Exponential family: a basic building block For a numeric random variable X p(x ) =h(x)exp T T (x) A( ) = 1
Bayesian Networks: Construction, Inference, Learning and Causal Interpretation. Volker Tresp Summer 2016
 Bayesian Networks: Construction, Inference, Learning and Causal Interpretation Volker Tresp Summer 2016 1 Introduction So far we were mostly concerned with supervised learning: we predicted one or several
Bayesian Machine Learning
 Bayesian Machine Learning Andrew Gordon Wilson ORIE 6741 Lecture 4 Occam s Razor, Model Construction, and Directed Graphical Models https://people.orie.cornell.edu/andrew/orie6741 Cornell University September
STA414/2104. Lecture 11: Gaussian Processes. Department of Statistics
 STA414/2104 Lecture 11: Gaussian Processes Department of Statistics www.utstat.utoronto.ca Delivered by Mark Ebden with thanks to Russ Salakhutdinov Outline Gaussian Processes Exam review Course evaluations
Alternative Parameterizations of Markov Networks. Sargur Srihari
 Alternative Parameterizations of Markov Networks Sargur srihari@cedar.buffalo.edu 1 Topics Three types of parameterization 1. Gibbs Parameterization 2. Factor Graphs 3. Log-linear Models with Energy functions
Based on slides by Richard Zemel
 CSC 412/2506 Winter 2018 Probabilistic Learning and Reasoning Lecture 3: Directed Graphical Models and Latent Variables Based on slides by Richard Zemel Learning outcomes What aspects of a model can we
A Brief Introduction to Graphical Models. Presenter: Yijuan Lu November 12,2004
 A Brief Introduction to Graphical Models Presenter: Yijuan Lu November 12,2004 References Introduction to Graphical Models, Kevin Murphy, Technical Report, May 2001 Learning in Graphical Models, Michael
Inference and estimation in probabilistic time series models
 1 Inference and estimation in probabilistic time series models David Barber, A Taylan Cemgil and Silvia Chiappa 11 Time series The term time series refers to data that can be represented as a sequence
Bayesian Networks: Construction, Inference, Learning and Causal Interpretation. Volker Tresp Summer 2014
 Bayesian Networks: Construction, Inference, Learning and Causal Interpretation Volker Tresp Summer 2014 1 Introduction So far we were mostly concerned with supervised learning: we predicted one or several
CPSC 540: Machine Learning
 CPSC 540: Machine Learning Undirected Graphical Models Mark Schmidt University of British Columbia Winter 2016 Admin Assignment 3: 2 late days to hand it in today, Thursday is final day. Assignment 4:
p L yi z n m x N n xi
 y i z n x n N x i Overview Directed and undirected graphs Conditional independence Exact inference Latent variables and EM Variational inference Books statistical perspective Graphical Models, S. Lauritzen
Probabilistic Graphical Models
 2016 Robert Nowak Probabilistic Graphical Models 1 Introduction We have focused mainly on linear models for signals, in particular the subspace model x = Uθ, where U is a n k matrix and θ R k is a vector
STA 4273H: Statistical Machine Learning
 STA 4273H: Statistical Machine Learning Russ Salakhutdinov Department of Statistics! rsalakhu@utstat.toronto.edu! http://www.utstat.utoronto.ca/~rsalakhu/ Sidney Smith Hall, Room 6002 Lecture 11 Project
Directed Graphical Models or Bayesian Networks
 Directed Graphical Models or Bayesian Networks Le Song Machine Learning II: Advanced Topics CSE 8803ML, Spring 2012 Bayesian Networks One of the most exciting recent advancements in statistical AI Compact
Directed and Undirected Graphical Models
 Directed and Undirected Davide Bacciu Dipartimento di Informatica Università di Pisa bacciu@di.unipi.it Machine Learning: Neural Networks and Advanced Models (AA2) Last Lecture Refresher Lecture Plan Directed
Nonparametric Bayesian Methods (Gaussian Processes)
") [70240413 Statistical Machine Learning, Spring, 2015] Nonparametric Bayesian Methods (Gaussian Processes) Jun Zhu dcszj@mail.tsinghua.edu.cn http://bigml.cs.tsinghua.edu.cn/~jun State Key Lab of Intelligent
[70240413 Statistical Machine Learning, Spring, 2015] Nonparametric Bayesian Methods (Gaussian Processes) Jun Zhu dcszj@mail.tsinghua.edu.cn http://bigml.cs.tsinghua.edu.cn/~jun State Key Lab of Intelligent
Variational Message Passing. By John Winn, Christopher M. Bishop Presented by Andy Miller
 Variational Message Passing By John Winn, Christopher M. Bishop Presented by Andy Miller Overview Background Variational Inference Conjugate-Exponential Models Variational Message Passing Messages Univariate
Probabilistic Graphical Networks: Definitions and Basic Results
 This document gives a cursory overview of Probabilistic Graphical Networks. The material has been gleaned from different sources. I make no claim to original authorship of this material. Bayesian Graphical
Undirected Graphical Models: Markov Random Fields
 Undirected Graphical Models: Markov Random Fields 40-956 Advanced Topics in AI: Probabilistic Graphical Models Sharif University of Technology Soleymani Spring 2015 Markov Random Field Structure: undirected
Need for Sampling in Machine Learning. Sargur Srihari
 Need for Sampling in Machine Learning Sargur srihari@cedar.buffalo.edu 1 Rationale for Sampling 1. ML methods model data with probability distributions E.g., p(x,y; θ) 2. Models are used to answer queries,
Probabilistic Graphical Models
 Probabilistic Graphical Models David Sontag New York University Lecture 4, February 16, 2012 David Sontag (NYU) Graphical Models Lecture 4, February 16, 2012 1 / 27 Undirected graphical models Reminder
Mixtures of Gaussians. Sargur Srihari
 Mixtures of Gaussians Sargur srihari@cedar.buffalo.edu 1 9. Mixture Models and EM 0. Mixture Models Overview 1. K-Means Clustering 2. Mixtures of Gaussians 3. An Alternative View of EM 4. The EM Algorithm
Chapter 17: Undirected Graphical Models
 Chapter 17: Undirected Graphical Models The Elements of Statistical Learning Biaobin Jiang Department of Biological Sciences Purdue University bjiang@purdue.edu October 30, 2014 Biaobin Jiang (Purdue)
Graphical Models - Part I
 Graphical Models - Part I Oliver Schulte - CMPT 726 Bishop PRML Ch. 8, some slides from Russell and Norvig AIMA2e Outline Probabilistic Models Bayesian Networks Markov Random Fields Inference Outline Probabilistic
Machine Learning using Bayesian Approaches
 Machine Learning using Bayesian Approaches Sargur N. Srihari University at Buffalo, State University of New York 1 Outline 1. Progress in ML and PR 2. Fully Bayesian Approach 1. Probability theory Bayes
Introduction to Probabilistic Graphical Models
 Introduction to Probabilistic Graphical Models Kyu-Baek Hwang and Byoung-Tak Zhang Biointelligence Lab School of Computer Science and Engineering Seoul National University Seoul 151-742 Korea E-mail: kbhwang@bi.snu.ac.kr
Pattern Recognition and Machine Learning
 Christopher M. Bishop Pattern Recognition and Machine Learning ÖSpri inger Contents Preface Mathematical notation Contents vii xi xiii 1 Introduction 1 1.1 Example: Polynomial Curve Fitting 4 1.2 Probability
PMR Learning as Inference
 Outline PMR Learning as Inference Probabilistic Modelling and Reasoning Amos Storkey Modelling 2 The Exponential Family 3 Bayesian Sets School of Informatics, University of Edinburgh Amos Storkey PMR Learning
Deep Learning Srihari. Deep Belief Nets. Sargur N. Srihari
 Deep Belief Nets Sargur N. Srihari srihari@cedar.buffalo.edu Topics 1. Boltzmann machines 2. Restricted Boltzmann machines 3. Deep Belief Networks 4. Deep Boltzmann machines 5. Boltzmann machines for continuous
2 : Directed GMs: Bayesian Networks
 10-708: Probabilistic Graphical Models 10-708, Spring 2017 2 : Directed GMs: Bayesian Networks Lecturer: Eric P. Xing Scribes: Jayanth Koushik, Hiroaki Hayashi, Christian Perez Topic: Directed GMs 1 Types
DEEP LEARNING CHAPTER 3 PROBABILITY & INFORMATION THEORY
 DEEP LEARNING CHAPTER 3 PROBABILITY & INFORMATION THEORY OUTLINE 3.1 Why Probability? 3.2 Random Variables 3.3 Probability Distributions 3.4 Marginal Probability 3.5 Conditional Probability 3.6 The Chain
Intelligent Systems:
 Intelligent Systems: Undirected Graphical models (Factor Graphs) (2 lectures) Carsten Rother 15/01/2015 Intelligent Systems: Probabilistic Inference in DGM and UGM Roadmap for next two lectures Definition
Bayesian Methods for Machine Learning
 Bayesian Methods for Machine Learning CS 584: Big Data Analytics Material adapted from Radford Neal s tutorial (http://ftp.cs.utoronto.ca/pub/radford/bayes-tut.pdf), Zoubin Ghahramni (http://hunch.net/~coms-4771/zoubin_ghahramani_bayesian_learning.pdf),
13: Variational inference II
 10-708: Probabilistic Graphical Models, Spring 2015 13: Variational inference II Lecturer: Eric P. Xing Scribes: Ronghuo Zheng, Zhiting Hu, Yuntian Deng 1 Introduction We started to talk about variational
Bayesian Learning. HT2015: SC4 Statistical Data Mining and Machine Learning. Maximum Likelihood Principle. The Bayesian Learning Framework
 HT5: SC4 Statistical Data Mining and Machine Learning Dino Sejdinovic Department of Statistics Oxford http://www.stats.ox.ac.uk/~sejdinov/sdmml.html Maximum Likelihood Principle A generative model for
Outline. Spring It Introduction Representation. Markov Random Field. Conclusion. Conditional Independence Inference: Variable elimination
 Probabilistic Graphical Models COMP 790-90 Seminar Spring 2011 The UNIVERSITY of NORTH CAROLINA at CHAPEL HILL Outline It Introduction ti Representation Bayesian network Conditional Independence Inference:
NPFL108 Bayesian inference. Introduction. Filip Jurčíček. Institute of Formal and Applied Linguistics Charles University in Prague Czech Republic
 NPFL108 Bayesian inference Introduction Filip Jurčíček Institute of Formal and Applied Linguistics Charles University in Prague Czech Republic Home page: http://ufal.mff.cuni.cz/~jurcicek Version: 21/02/2014
Lecture 13 : Variational Inference: Mean Field Approximation
 10-708: Probabilistic Graphical Models 10-708, Spring 2017 Lecture 13 : Variational Inference: Mean Field Approximation Lecturer: Willie Neiswanger Scribes: Xupeng Tong, Minxing Liu 1 Problem Setup 1.1
10708 Graphical Models: Homework 2
 10708 Graphical Models: Homework 2 Due Monday, March 18, beginning of class Feburary 27, 2013 Instructions: There are five questions (one for extra credit) on this assignment. There is a problem involves
1 Undirected Graphical Models. 2 Markov Random Fields (MRFs)
") Machine Learning (ML, F16) Lecture#07 (Thursday Nov. 3rd) Lecturer: Byron Boots Undirected Graphical Models 1 Undirected Graphical Models In the previous lecture, we discussed directed graphical models.
Machine Learning (ML, F16) Lecture#07 (Thursday Nov. 3rd) Lecturer: Byron Boots Undirected Graphical Models 1 Undirected Graphical Models In the previous lecture, we discussed directed graphical models.
Mathematical Formulation of Our Example
 Mathematical Formulation of Our Example We define two binary random variables: open and, where is light on or light off. Our question is: What is? Computer Vision 1 Combining Evidence Suppose our robot
Introduction to Probabilistic Graphical Models: Exercises
 Introduction to Probabilistic Graphical Models: Exercises Cédric Archambeau Xerox Research Centre Europe cedric.archambeau@xrce.xerox.com Pascal Bootcamp Marseille, France, July 2010 Exercise 1: basics
Study Notes on the Latent Dirichlet Allocation
 Study Notes on the Latent Dirichlet Allocation Xugang Ye 1. Model Framework A word is an element of dictionary {1,,}. A document is represented by a sequence of words: =(,, ), {1,,}. A corpus is a collection
Learning Bayesian networks
 1 Lecture topics: Learning Bayesian networks from data maximum likelihood, BIC Bayesian, marginal likelihood Learning Bayesian networks There are two problems we have to solve in order to estimate Bayesian
Probability Theory for Machine Learning. Chris Cremer September 2015
 Probability Theory for Machine Learning Chris Cremer September 2015 Outline Motivation Probability Definitions and Rules Probability Distributions MLE for Gaussian Parameter Estimation MLE and Least Squares
Multivariate Gaussians. Sargur Srihari
 Multivariate Gaussians Sargur srihari@cedar.buffalo.edu 1 Topics 1. Multivariate Gaussian: Basic Parameterization 2. Covariance and Information Form 3. Operations on Gaussians 4. Independencies in Gaussians
CS839: Probabilistic Graphical Models. Lecture 2: Directed Graphical Models. Theo Rekatsinas
 CS839: Probabilistic Graphical Models Lecture 2: Directed Graphical Models Theo Rekatsinas 1 Questions Questions? Waiting list Questions on other logistics 2 Section 1 1. Intro to Bayes Nets 3 Section
Probabilistic Graphical Models
 Probabilistic Graphical Models Lecture 12 Dynamical Models CS/CNS/EE 155 Andreas Krause Homework 3 out tonight Start early!! Announcements Project milestones due today Please email to TAs 2 Parameter learning
COS513 LECTURE 8 STATISTICAL CONCEPTS
 COS513 LECTURE 8 STATISTICAL CONCEPTS NIKOLAI SLAVOV AND ANKUR PARIKH 1. MAKING MEANINGFUL STATEMENTS FROM JOINT PROBABILITY DISTRIBUTIONS. A graphical model (GM) represents a family of probability distributions
Graphical Models. Andrea Passerini Statistical relational learning. Graphical Models
 Andrea Passerini passerini@disi.unitn.it Statistical relational learning Probability distributions Bernoulli distribution Two possible values (outcomes): 1 (success), 0 (failure). Parameters: p probability
MAP Examples. Sargur Srihari
 MAP Examples Sargur srihari@cedar.buffalo.edu 1 Potts Model CRF for OCR Topics Image segmentation based on energy minimization 2 Examples of MAP Many interesting examples of MAP inference are instances
Intelligent Systems: Reasoning and Recognition. Reasoning with Bayesian Networks
 Intelligent Systems: Reasoning and Recognition James L. Crowley ENSIMAG 2 / MoSIG M1 Second Semester 2016/2017 Lesson 13 24 march 2017 Reasoning with Bayesian Networks Naïve Bayesian Systems...2 Example
Introduction to Probability and Statistics (Continued)
") Introduction to Probability and Statistics (Continued) Prof. icholas Zabaras Center for Informatics and Computational Science https://cics.nd.edu/ University of otre Dame otre Dame, Indiana, USA Email:
Introduction to Probability and Statistics (Continued) Prof. icholas Zabaras Center for Informatics and Computational Science https://cics.nd.edu/ University of otre Dame otre Dame, Indiana, USA Email:
Recent Advances in Bayesian Inference Techniques
 Recent Advances in Bayesian Inference Techniques Christopher M. Bishop Microsoft Research, Cambridge, U.K. research.microsoft.com/~cmbishop SIAM Conference on Data Mining, April 2004 Abstract Bayesian
Probabilistic Graphical Models
 Probabilistic Graphical Models Brown University CSCI 295-P, Spring 213 Prof. Erik Sudderth Lecture 11: Inference & Learning Overview, Gaussian Graphical Models Some figures courtesy Michael Jordan s draft
Bayesian Approaches Data Mining Selected Technique
 Bayesian Approaches Data Mining Selected Technique Henry Xiao xiao@cs.queensu.ca School of Computing Queen s University Henry Xiao CISC 873 Data Mining p. 1/17 Probabilistic Bases Review the fundamentals
CSci 8980: Advanced Topics in Graphical Models Gaussian Processes
 CSci 8980: Advanced Topics in Graphical Models Gaussian Processes Instructor: Arindam Banerjee November 15, 2007 Gaussian Processes Outline Gaussian Processes Outline Parametric Bayesian Regression Gaussian
Variational Inference (11/04/13)
") STA561: Probabilistic machine learning Variational Inference (11/04/13) Lecturer: Barbara Engelhardt Scribes: Matt Dickenson, Alireza Samany, Tracy Schifeling 1 Introduction In this lecture we will further
STA561: Probabilistic machine learning Variational Inference (11/04/13) Lecturer: Barbara Engelhardt Scribes: Matt Dickenson, Alireza Samany, Tracy Schifeling 1 Introduction In this lecture we will further
Probabilistic classification CE-717: Machine Learning Sharif University of Technology. M. Soleymani Fall 2016
 Probabilistic classification CE-717: Machine Learning Sharif University of Technology M. Soleymani Fall 2016 Topics Probabilistic approach Bayes decision theory Generative models Gaussian Bayes classifier
The Monte Carlo Method: Bayesian Networks
 The Method: Bayesian Networks Dieter W. Heermann Methods 2009 Dieter W. Heermann ( Methods)The Method: Bayesian Networks 2009 1 / 18 Outline 1 Bayesian Networks 2 Gene Expression Data 3 Bayesian Networks
Multivariate Bayesian Linear Regression MLAI Lecture 11
 Multivariate Bayesian Linear Regression MLAI Lecture 11 Neil D. Lawrence Department of Computer Science Sheffield University 21st October 2012 Outline Univariate Bayesian Linear Regression Multivariate
Lecture 4: Types of errors. Bayesian regression models. Logistic regression
 Lecture 4: Types of errors. Bayesian regression models. Logistic regression A Bayesian interpretation of regularization Bayesian vs maximum likelihood fitting more generally COMP-652 and ECSE-68, Lecture
Computational Complexity of Inference
 Computational Complexity of Inference Sargur srihari@cedar.buffalo.edu 1 Topics 1. What is Inference? 2. Complexity Classes 3. Exact Inference 1. Variable Elimination Sum-Product Algorithm 2. Factor Graphs
Y1 Y2 Y3 Y4 Y1 Y2 Y3 Y4 Z1 Z2 Z3 Z4
 Inference: Exploiting Local Structure aphne Koller Stanford University CS228 Handout #4 We have seen that N inference exploits the network structure, in particular the conditional independence and the
Unsupervised Learning
 Unsupervised Learning Bayesian Model Comparison Zoubin Ghahramani zoubin@gatsby.ucl.ac.uk Gatsby Computational Neuroscience Unit, and MSc in Intelligent Systems, Dept Computer Science University College
Probabilistic Graphical Models. Guest Lecture by Narges Razavian Machine Learning Class April
 Probabilistic Graphical Models Guest Lecture by Narges Razavian Machine Learning Class April 14 2017 Today What is probabilistic graphical model and why it is useful? Bayesian Networks Basic Inference
These slides follow closely the (English) course textbook Pattern Recognition and Machine Learning by Christopher Bishop
 course textbook Pattern Recognition and Machine Learning by Christopher Bishop") Music and Machine Learning (IFT68 Winter 8) Prof. Douglas Eck, Université de Montréal These slides follow closely the (English) course textbook Pattern Recognition and Machine Learning by Christopher Bishop
Music and Machine Learning (IFT68 Winter 8) Prof. Douglas Eck, Université de Montréal These slides follow closely the (English) course textbook Pattern Recognition and Machine Learning by Christopher Bishop
Fundamentals. CS 281A: Statistical Learning Theory. Yangqing Jia. August, Based on tutorial slides by Lester Mackey and Ariel Kleiner
 Fundamentals CS 281A: Statistical Learning Theory Yangqing Jia Based on tutorial slides by Lester Mackey and Ariel Kleiner August, 2011 Outline 1 Probability 2 Statistics 3 Linear Algebra 4 Optimization
Machine Learning Lecture 14
 Many slides adapted from B. Schiele, S. Roth, Z. Gharahmani Machine Learning Lecture 14 Undirected Graphical Models & Inference 23.06.2015 Bastian Leibe RWTH Aachen http://www.vision.rwth-aachen.de/ leibe@vision.rwth-aachen.de
Pattern Recognition and Machine Learning. Bishop Chapter 2: Probability Distributions
 Pattern Recognition and Machine Learning Chapter 2: Probability Distributions Cécile Amblard Alex Kläser Jakob Verbeek October 11, 27 Probability Distributions: General Density Estimation: given a finite
CS 2750: Machine Learning. Bayesian Networks. Prof. Adriana Kovashka University of Pittsburgh March 14, 2016
 CS 2750: Machine Learning Bayesian Networks Prof. Adriana Kovashka University of Pittsburgh March 14, 2016 Plan for today and next week Today and next time: Bayesian networks (Bishop Sec. 8.1) Conditional
DAG models and Markov Chain Monte Carlo methods a short overview
 DAG models and Markov Chain Monte Carlo methods a short overview Søren Højsgaard Institute of Genetics and Biotechnology University of Aarhus August 18, 2008 Printed: August 18, 2008 File: DAGMC-Lecture.tex
PATTERN RECOGNITION AND MACHINE LEARNING
 PATTERN RECOGNITION AND MACHINE LEARNING Chapter 1. Introduction Shuai Huang April 21, 2014 Outline 1 What is Machine Learning? 2 Curve Fitting 3 Probability Theory 4 Model Selection 5 The curse of dimensionality
Partially Directed Graphs and Conditional Random Fields. Sargur Srihari
 Partially Directed Graphs and Conditional Random Fields Sargur srihari@cedar.buffalo.edu 1 Topics Conditional Random Fields Gibbs distribution and CRF Directed and Undirected Independencies View as combination
Linear Models for Classification
 Linear Models for Classification Oliver Schulte - CMPT 726 Bishop PRML Ch. 4 Classification: Hand-written Digit Recognition CHINE INTELLIGENCE, VOL. 24, NO. 24, APRIL 2002 x i = t i = (0, 0, 0, 1, 0, 0,
Machine Learning Srihari. Gaussian Processes. Sargur Srihari
 Gaussian Processes Sargur Srihari 1 Topics in Gaussian Processes 1. Examples of use of GP 2. Duality: From Basis Functions to Kernel Functions 3. GP Definition and Intuition 4. Linear regression revisited
9/12/17. Types of learning. Modeling data. Supervised learning: Classification. Supervised learning: Regression. Unsupervised learning: Clustering
 Types of learning Modeling data Supervised: we know input and targets Goal is to learn a model that, given input data, accurately predicts target data Unsupervised: we know the input only and want to make