Mechanisms of active folding of the landscape (southern Tian Shan, China)
|
|
|
- Antonia Harrington
- 5 years ago
- Views:
Transcription
1 Click Here for Full Article JOURNAL OF GEOPHYSICAL RESEARCH, VOL. 112,, doi: /2006jb004362, 2007 Mechanisms of active folding of the landscape (southern Tian Shan, China) Aurélia Hubert-Ferrari, 1,2 John Suppe, 3 Ramon Gonzalez-Mieres, 3 and Xin Wang 4 Received 23 February 2006; revised 2 October 2006; accepted 28 November 2006; published 29 March [1] We explore the kinematic mechanisms of active large-scale folding, based on analysis of two adjacent major anticlines in Tian Shan (central Asia) that share an acceleration of shortening rate leading to topographic emergence and folded geomorphic surfaces. Their folding mechanisms are fundamentally different. Yakeng anticline is a gentle pure shear detachment fold with 1200 m of shortening and a well-constrained history of growth beginning at 5.5 Ma with an order-of-magnitude increase in shortening rate from 0.16 to mm/yr at Ma. The shape of the deformed topographic surface and of subsurface horizons deposited during deformation is a linearly proportional image at reduced amplitude of the deeper structure, which shows that instantaneous uplift rates have been pointwise linearly proportional to the current finite fold amplitude. In contrast, Quilitak anticline is a complex fault bend fold with uplift rates proportional to the sine of the fault dip, showing discontinuities in uplift rate across active axial surfaces. The 10- to 20-km-wide anticline is topographically emergent only in a central 5- to 7-km-wide mountainous uplift, the abrupt southern edge of which is marked by 600- to 700-m-high triangular facets that result from active folding of a pediment across an active axial surface. The giant facets are shown to form by kink band migration and record postemergence deformation since an order-of-magnitude acceleration in shortening rate from 0.6 to 4 5 mm/yr, apparently contemporaneous with Yakeng. Sections logged across the active 115-m-wide hinge zone show that recent strata provide a bedby-bed record of fold scarp growth, which is quantitatively deciphered by fitting bed shapes to a finite width kink band migration model. Citation: Hubert-Ferrari, A., J. Suppe, R. Gonzalez-Mieres, and X. Wang (2007), Mechanisms of active folding of the landscape (southern Tian Shan, China), J. Geophys. Res., 112,, doi: /2006jb Introduction [2] An unfortunate reality in tectonic geomorphology and coseismic geodesy has been the normal lack of strong constraints on the associated subsurface structure, making it difficult to form relationships between deformation of the land surface and actual underlying processes. Typically the subsurface structure in areas of active tectonics is known in only rather general terms, although there are some notable exceptions [e.g., Medwedeff, 1992; Mueller and Tailing, 1997; Shaw et al., 2002; Ishiyama et al., 2004]. Here we take advantage of an unusual coincidence of excellent subsurface data and wellpreserved geomorphic expression for the active Yakeng and Quilitak anticlines of the southern Tian Shan thrust belt of western China. These two folds display fundamentally different folding mechanisms and associated surface expressions: (1) The Yakeng anticline is a detachment fold with uplift 1 Institut de Géologie, Université de Neuchâtel, Neuchâtel, Switzerland. 2 Now at Royal Observatory of Belgium, Brussels, Belgium. 3 Department of Geosciences, Princeton University, Princeton, New Jersey, USA. 4 Geosciences Department, Zhejiang University, Hangzhou, China. Copyright 2007 by the American Geophysical Union /07/2006JB004362$09.00 displaying progressive large-scale rotation of fold limbs and incremental uplift that is linearly proportional to total uplift. (2) In contrast, the Quilitak anticline is a complex fault bend fold involving kink band migration defined by largescale fold scarps that mark localized discontinuities in uplift rate across the structure, with little evidence of rotation of fold limbs. Making use of these examples, we present evidence for a variety of little recognized but probably widespread active tectonic phenomena, applying some new techniques of analysis and modeling. [3] A number of simple kinematic models have been developed to describe the diverse folding mechanisms that have been recognized in thrust belts, including detachment folding, fault bend folding, and fault propagation folding models [e.g., Erslev, 1991; Epard and Groshong, 1995; Poblet and McClay, 1996; Suppe, 1983; Suppe et al., 1992, 2004; Hardy and Ford, 1997; Allmendinger, 1998]. These models make very different predictions for the distribution of instantaneous uplift relative to total uplift. If these models are reasonable approximations to the kinematics of actual structures, then we expect to see a rich variety of contrasting geomorphic expressions of the underlying active folding mechanisms. Figure 1 shows several of these models in their most elemental form. 1of39
2 Figure 1. Comparisons between instantaneous and total uplift for three simple fold models with identical shortening: (a) classical fault bend fold, (b) pure shear fault bend fold, and (c) detachment fold. The detachment fold model shown in Figure 1c has an instantaneous uplift rate and a total uplift that are collocated (spatially coincident) and linearly proportional. In contrast, the two fault bend folding models in Figures 1a and 1b show noncollocated instantaneous and total uplift such that the instantaneous uplift is not everywhere proportional to the total uplift. The abrupt discontinuities in uplift rate across active axial surfaces in Figure 1a are normally indicative of kink band migration, whereas a slope to the uplift rate over a substantial horizontal distance in Figures 1b and 1c is indicative of limb rotation. The fault bend fold models are based on the models of Suppe [1983] and Suppe et al. [2004]; the detachment fold model in Figure 1c is similar to the pure shear model of Epard and Groshong [1995]. [4] The simplest fault bend folding model (Figure 1a) displays an instantaneous uplift rate that is simply the fault slip rate times the sine of the underlying fault dip, which has been observed on geomorphic timescales [Hutrez et al., 1999; Lavé and Avouac, 2000] and even in the coseismic geodetic displacement of a single large shallow earthquake (Chi-Chi earthquake) [Yue et al., 2005]. The active axial surfaces of fault bend fold models are pinned to fault bends and bound regions of different underlying fault dip. Therefore active axial surfaces represent localized discontinuities in uplift rate (Figure 1a). These abrupt transitions in uplift rate appear at the land surface in the form of fold scarps, which are the instantaneous locus of surface folding [Suppe et al., 1997]. For the simple model of a ramp anticline (Figure 1a) the instantaneous uplift will occur only above a fault ramp in the region bounded by the two active axial surfaces. As large slip accumulates, the finite fold becomes displaced with respect to the instantaneous uplift because particles move progressively through the active fold by kink band migration. The instantaneous and total uplift are thus not collocated (not spatially coincident) and produce different shapes. For even more complex fault bend fold structures involving wedging, imbrication and multiple fault bends (Figure 2), the instantaneous uplift rate is still simply the fault slip rate times the sine of the local underlying fault dip. In this paper we focus considerable attention on the geomorphic and stratigraphic effects of active axial surfaces intersecting the topographic surface in the Quilitak anticline, especially the generation of fold scarps. [5] In contrast with classical fault bend folding driven by its characteristic kink band migration, many other significant folding mechanisms predict limb rotation or a combination of limb rotation and kink band migration, including detachment folding, trishear fault propagation folding and shear fault bend folding (Figure 1) [Erslev, 1991; Epard and Groshong, 1995; Poblet et al., 1997; Hardy and Ford, 1997; Allmendinger, 1998; Suppe et al., 2004]. For example, detachment fold growth can be modeled using a selfsimilar heterogeneous pure shear model in which the instantaneous uplift rate is a linear function of the finite uplift at any point (Figure 1c) [cf. Epard and Groshong, 1995]. During an earthquake or other increment of deformation, surface warping is spread continuously over the entire structure and is not characterized by abrupt transitions in uplift rate, in contrast with fault bend folding. This simple model predicts that a young deformed geomorphic surface would be spatially coincident with the finite fold structure and have the same shape but at a reduced linearly proportional amplitude. Total uplift and instantaneous uplift rate are collocated, in contrast with classical fault bend folding. In this paper we show evidence for such linearly proportional collocated uplift in Yakeng anticline. 2. Tectonic Setting of Active Folding [6] The Tian Shan range is a locus of active compression induced by the collision between India and Asia [Molnar and Tapponnier, 1975; Tapponnier and Molnar, 1979]. It is one of the largest and most active intracontinental mountain ranges (Figure 3) [Avouac et al., 1993; Molnar and Deng, 1984]. Up to 20 mm/yr of shortening [Abdrakhmatov et al., 1996; Reigber et al., 2001; Molnar and Ghose, 2000] is accommodated in thrust belts on both sides and within the range [Allen et al., 1999; Burchfiel et al., 1999; Burbank et 2of39


3 Figure 2. A complex fault bend fold model showing many discontinuities in the instantaneous uplift rate across active axial surfaces, which is indicative of kink band migration. The uplift rate is everywhere equal to the sine of the underlying fault dip times the local fault slip rate. The instantaneous uplift rate and total uplift are neither collocated nor proportional. Figure 3. Eastern end of Kuche fold-and-thrust belt, southern Tian Shan. Present deformation is localized almost entirely along the Quilitak and Yakeng anticlines. Boxes are areas of Figures 10a, 12, 14, 16, 17, and 20a. Viewpoints of Figures 15 and 20b and location of the seismic line of Figure 4 are shown. Inset gives location of Tian Shan range within the framework of the Indo-Eurasia collision and GPS data of Wang et al. [2001]. Box is area of Figure 3. 3of39
.")
4 Figure 4. Balanced cross section across the Quilitak and Yakeng anticlines along the East Quilitak River integrating surface geology, seismic reflection profiles, and well data (see Figure 3 for location). Location of 6 Ma time horizon (blue line) in northern Quilitak syncline is from magnetostratigraphy of Charreau et al. [2006]. Location of 6 Ma time horizon (blue line) in southern syncline is at the same stratigraphic level as the 6 Ma horizon in the northern syncline. The stratigraphic thickness (vertical blue lines) in both synclines above the 6 Ma time horizon is consistent with a constant 0.43 mm/yr sedimentation rate. al., 1999; Chen et al., 2002; Thompson et al., 2002; Hubert- Ferrari et al., 2005b]. In the eastern part of the southern Tian Shan between and 85 E, the main locus of deformation is the 350-km-long Kuche fold-and-thrust belt that deforms an 8- to 10-km-thick Triassic to Recent sequence of continental strata [Yin et al., 1998]. In the Kuche belt, active deformation is accommodated mainly on its southern edge by the Quilitak and Yakeng anticlines [Burchfiel et al., 1999] where active faulting is mostly blind, but folding is well expressed at the surface. In addition, seismic reflection profiles and drilling image the deep structures of both anticlines. The relationships between the surface morphological expressions and the related faulting and folding processes at depth can therefore be addressed. [7] The Yakeng and Quilitak anticlines show strongly contrasting surface morphology. Their dissimilarities reflect differences in underlying fold mechanisms and in total shortening consumed by folding with associated variation in fold amplitude. The Yakeng anticline is barely visible in large-scale satellite images and topographic maps and forms a low ridge that extends for about 110 km parallel to the Tian Shan with a width of 5 8 km and maximum topographic relief of 150 m (Figure 3). The near-surface internal structure is exposed along a few major transverse valleys that are incised into the ridge and show it to be a gentle anticline with limb dips of 3 4 in Quaternary dark gray conglomerates and yellow gray sandstones. Seismic lines show that the Yakeng anticline at depth is similar but somewhat broader (10 km) than its active surface expression, with the flanks being buried by recent sedimentation. [8] In contrast, the Quilitak anticline is expressed topographically as a rugged and largely inaccessible mountainous ridge that extends for about 225 km along the Tian Shan with a 5 7 km width and maximum relief of 1 km (Figure 3). Seismic lines show that the Quilitak anticline is substantially wider at depth (10 20 km), where it is characterized by gently dipping flanks (10 30 ) (Figure 4). The low-dipping flanks in many places are buried by recent sediments and elsewhere are exposed as regions of low relief adjacent to the high-relief ridge. The Quilitak ridge exposes a tight anticlinal core of Miocene to Pleistocene strata with steeply dipping fold limbs that are in many places nearly vertical or overturned. 3. Yakeng Anticline: A Classic Detachment Fold 3.1. Deep Structure and Growth Analysis [9] The contrasting deep structure of the Yakeng and Quilitak anticlines is illustrated in a cross section along the East Quilitak valley (Figure 4, see location in Figure 3). This section integrates surface geology, seismic reflection profiles and well log data. The seismic reflection profiles were depth converted using a velocity model obtained from stacking velocities and calibrated using wells. The velocity model was generated using the procedure of Süss and Shaw [2003]. The Yakeng fold is characterized by gentle warping above a detachment level, whereas Quilitak 4of39

5 Figure 5. Yakeng detachment fold (see location in Figure 3). Seismic profile shows gentle upward warping of distinctive sedimentary layers above a basal detachment. The 27 seismic horizons mapped through the structure indicate that no topographic emergence occurred until after horizon 27. The timescale on the left is interpolated from a constant sedimentation rate of 0.43 mm/yr from Charreau et al. [2006]. is a fault bend fold with a relatively simple deep thrust ramp overlain by a complex wedge system responsible for the steep to vertical dips on both limbs of the anticline at the surface. [10] The deep structure of Yakeng is similar to its surface expression (Figures 4 and 5). It extends to a depth of 5 6 km as a broad, smoothly curved anticline with limbs that dip generally 5 6 or less. The amplitude and area of structural relief of the fold progressively decrease downward to a 6 km deep evaporitic basal detachment horizon in the Jidike Formation (horizon 4, Figures 5 and 6a) [Hubert-Ferrari et al., 2005a]. This same detachment horizon is the upper detachment of the deep ramp of Quilitak anticline and thus provides the direct fault link at depth between the Yakeng and Quilitak structures. [11] We have quantified the magnitude of shortening and history of growth of Yakeng [Hubert-Ferrari et al., 2005a] using a modification of the method of Epard and Groshong [1995] based on measurements of area relief in the thickness domain combined with conservation of area [Gonzalez-Mieres and Suppe, 2006, also Analysis of growth of detachment folds, submitted to AAPG Memoir, 2006, hereinafter referred to as Gonzalez-Mieres and Suppe, submitted manuscript, 2006]. Measurements of area of relief as a function of elevation for 27 mapped horizons of Yakeng yield a well-constrained total shortening of 1200 m based on the rate of change of area of relief with respect to height in the pregrowth interval (horizons 5 to 14) (Figure 6b). A marked inflection in the rate of change of relief indicates the beginning of growth at horizon 15 (Figure 6b). Furthermore there is a significant excess area A e 0.83 km 2 within the core of the fold at the level of the basal evaporitic detachment layer as given by the nonzero intercept of the linear regression at horizon 4 which is the bottom of the detachment layer (see Figure 6b). This excess area may be an effect of minor flow in the basal evaporitic layers into the core of the fold, although other explanations of excess area are possible [Suppe, 2006]. The mean shortening S between the detachment and any horizon is given by S ¼ A A e H where A is the area of structural relief for that horizon, A e is the excess area and H is the height above the detachment (Figure 7 and Table 1). Equation (1) assumes that flow of the basal layer occurred later as discussed below. The ratio of shortening rate to sedimentation rate ds/dh has been nearly constant ( ) between the beginning of growth and the topographic surface, with 950 m of shortening and 2.3 km of sedimentation. As discussed below, this ratio has increased by an order of magnitude (to 3.3) ð1þ 5of39
6 Figure 6. (a) Yakeng anticline flattened to horizon 4 (horizontal scale equal to vertical scale). By this process, stratigraphic gradients are identified and we get a reliable measurement of area of structural relief (A) and undeformed height (H). This analysis shows that horizons 5 14 have undergone 1200 m of shortening and thickening above an evaporitic detachment (see Figure 6b). There is an additional 0.83 km 2 excess area in the basal layer (4 5) [Hubert-Ferrari et al., 2005a]. (b) Area of structural relief as a function of height above detachment horizon 4. The slope of the linear increase in area of relief between layers 5 and 15 indicates a constant shortening of 1200 m. The nonzero intercept indicates an excess area of 0.83 km 2 within the basal evaporite interval (4 5). The beginning of growth is horizon 15 or 16. since the deposition of the deformed topographic surface, with 250 m shortening during a period in which m sedimentation occurred in the Tarim basin south of Yakeng. Therefore the deformation rate of Yakeng must have greatly increased recently, whereas sedimentation rate stayed nearly constant because base level changes are regionally controlled in the Tarim basin. Seismic reflector geometry (Figure 5) shows no evidence of any prior topographic emergence exceeding the seismic resolution prior to horizon 27 time. 6of39
7 Figure 7. Shortening accommodated in Yakeng anticline. Shortening is calculated from area of relief minus the excess area (squares and triangles) based on equation (1) and from relief regression relative to pregrowth horizon 15 (diamond) as discussed in the text (see equation (4)). Linear shortening within the growth interval (15 27) implies constant sedimentation rate, suggesting a late development of excess area in the basal evaporitic layer (equation (1)) or a growth in excess area coupled to shortening (equation (2)). Larger apparent shortening of layers 5 6 suggests a small additional excess area component [see also Gonzalez-Mieres and Suppe, 2006, also submitted manuscript, 2006]. [12] A nearby magnetostratigraphic study across the steep north limb of the Quilitak anticline (along the line of Figure 4) provides excellent age control over a 3000-mthick section between 13 and 5 Ma [Charreau et al., 2006]. This study shows a remarkably constant sedimentation rate of 0.43 mm/yr over the interval 5 10 Ma. Extrapolation of this rate to the top of the stratigraphic section north of the Quilitak anticline yields an approximate zero age for the top 7of39
8 Table 1. Yakeng Anticline Shortening a Horizon Height H Above Detachment h4, km Area of Structural Relief A s,km 2 Relief Ratio From Regression r Regression Parameter R 2 Shortening FromArea of Relief S a,km Shortening From Ratio of Relief S r Regional Stratigraphic Gradient km topo <5.1 > > a S a =(A s A e )/H, mean shortening computed from area of structural relief with excess area A e = 0.83 km 2 ; S r =[ra 15 +(r 1)A e ]/H, shortening computed from ratio of relief. of the section, therefore a nearly constant sedimentation rate of 0.43 mm/yr between 10 Ma and the present is indicated. This constant sedimentation rate is consistent with the observed constant ratio of shortening rate to sedimentation rate for all the preemergent growth horizons (Figure 7) and with the balanced cross section of Quilitak (Figure 4). The reason that the same sedimentation rate is valid for both north and south of the Quilitak anticline is because the observed regional gradients in the thickness of the growth interval are slight (Figure 4) [see also Hubert-Ferrari et al., 2005a]. In contrast with many foreland basins, the sedimentation rate near Kuche is not dominated by local tectonic effects such as basement flexure or sediment supply, but rather by the regionally steady rise of base level for the entire closed Tarim basin, which is controlled by the integrated effects of a vast region (Figure 3, inset). A similar nearly constant sedimentation rate of mm/yr over the last 5 Myr is indicated 150 km to the east in wells [Sun et al., 1999]. Adopting this constant sedimentation rate chronology for the Yakeng-Quilitak area predicts a beginning of growth for Yakeng (horizon 15) at 5.5 Ma (Figures 4 and 5), a topographic emergence at Ma and shortening rate of 0.16 mm/yr for Yakeng between horizon 15 and the deformed topographic surface. The average shortening rate since emergence is then mm/yr. [13] Some ambiguity exists over the timing of development of the excess fold area A e in the basal evaporitic layer (Figures 6 and 7), particularly if we consider only the areas of relief as a function of height (Figure 6b), because A e is a modest fraction (20%) of total structural relief at horizon 15. The above computation of shortening by equation (1) assumes that evaporitic flow (or other processes responsible for the excess area) occurred entirely after deposition of the growth horizons; this yields a nearly constant rate of shortening relative to sedimentation since 5.5 Ma until emergence, which is an attractive hypothesis because of the observed constant sedimentation rate. Alternatively, it is possible that this growth in excess area is distributed smoothly through some or all of the growth section, representing a process coupled to the shortening [Suppe, 2006], such that some fraction f of the total excess area A e developed after the deposition of the horizon in question. Equation (1) becomes S ¼ A fa e H If, for example, f is a linear function of height for the preemergent growth interval, the mean shortening increases by 10 20% over equation (1). However, Hubert- Ferrari et al. [2005a] pointed out that considering the spatial distribution of relief due to A e, it appears that a substantial fraction of the excess area could be late. The locus of relief of the basal evaporitic layer (horizon 4 5) is displaced 3 km to the south of the total relief due to shortening (horizons 5 15), but is collocated with the relief postdating horizon 27 (topo-27) (Figure 8). The distribution of relief postdating horizon 27 (topo-27) thus appears to include a significant fraction of A e whereas the older growth sequence (horizon 15 27) may not. Therefore late flow of evaporites into the core of the fold may have contributed to topographic emergence; however, the order-of-magnitude increase in the rate of shortening associated with emergence is required by the relief data regardless of the timing of the basal flow [see ð2þ 8of39
9 Figure 8. Present thickness variations across Yakeng anticline, which helps separate structural and stratigraphic components of the fold shape. The basal evaporitic interval (4 5) shows thickness variation presumably caused by flow. Interval 5 15 shows regional northward stratigraphic thickening reflecting syndepositional flexure of the basement, plus local structural thickening at Yakeng. The overlying interval shows stratigraphic thinning over Yakeng indicating growth. The uppermost interval (topo- 27) shows thinning over Yakeng, indicating accelerated growth including the development of excess area throughflow of the basal layer [Hubert-Ferrari et al., 2005a]. also Gonzalez-Mieres and Suppe, 2006, also submitted manuscript, 2006] Morphological Expression of an Emergent Detachment Fold [14] At the surface Yakeng forms a low asymmetric ridge (Figures 3, 5, and 9) characterized by a 1.3-km-wide nearly flat top, a 1.7-km-wide back limb and a much wider 5-km-long front limb (Figure 10). Even though its topographic relief is modest, the emergence of this ridge has strongly disrupted the river networks by changing topographic gradients (Figures 9 and 10). The river responses have depended mainly on stream power [e.g., Howard and Kerby, 1983; Howard et al., 1994; Burbank et al., 1996a, 1996b]. Rivers with relatively high stream power have been able to maintain their original courses by incision (Figure 10). Some rivers have adopted a southward converging pattern along the Yakeng northern limb, which increases their stream power sufficiently to continue incising. Rivers with relatively low stream power have been diverted and flow along the base of the Yakeng northern limb parallel to the fold axis [e.g., Burbank et al., 1999; Humphrey and Konrad, 2000]. Finally, a new northward flowing drainage system was established along the Yakeng northern limb. [15] The rise of Yakeng above the river base level has also locally lowered river gradients producing increased local sedimentation upstream and downstream of the fold [Ouchi, 1985; Holbrook and Schumm, 1999]. Upstream of Yakeng five major rivers crossing the high Quilitak ridge have deposited the bulk of their bed load producing dark gray pebble conglomerate in alluvial fans (Figure 9). The amount of sediment deposited and the size of related alluvial fans depend mainly on the river size or stream power [e.g., Humphrey and Konrad, 2000]. The biggest fan is that of the Kuche River, which entirely covers the western plunging nose of the Yakeng anticline. The other fans have a more restricted extension, and fill the 5- to 10-km-wide low area in between the Quilitak ridge and the emergent Yakeng ridge. Downstream of Yakeng sedimentation includes the development of small dark gray alluvial fans that cover part of the south limb of Yakeng. Farther south the sedimentation pattern changes, and yellow to gray sandstones and siltstones, which are typical Tarim basin sediments, have been deposited on the far southern limb of Yakeng. [16] Active sedimentation has partly modified the surface expression of the fold relative to its deep structure. The surface width of Yakeng (8 km in Figure 10) is, in fact, narrower than the 13-km-wide deep fold structure (Figure 5) because of continuous burial of the anticlinal flanks (Figure 11). The surface expression thus does not fully reflect the area over which active uplift occurs, but represents a trade-off between surface and tectonic processes. Yakeng emergence occurs only where uplift rate is greater than sedimentation rate. Some variation in the morphological expression of the Yakeng anticline along strike may be accordingly interpreted as dominated by sedimentation processes, and not by structural change along strike. For example, the northern edge of the emergent Yakeng high has a sinuous contact in map view, which strongly contrasts with its straight southern edge (Figure 9). The north edge of the emergent Yakeng is closer to Quilitak away from the apex of all the major fans deposited in between the two anticlines. This phenomenon may simply reflect variation in sedimentation rate, which is higher at the fan apexes than at their edges. A locally higher sedimentation rate would imply a local higher capacity to bury Yakeng and balance its uplift rate. The latter pattern is possible only if uplift rate varies smoothly across the Yakeng structure Linearly Proportional Growth of the Yakeng Detachment Fold [17] Up to this point we have only used areas of relief and mass balance considerations to constrain the shortening and growth history of the Yakeng anticline (Figures 6 and 7). We have not yet made any use of information on 9of39

10 Figure 9. Inherited preemergence fan morphology preserved in the Yakeng detachment fold. The present Yakeng topographic ridge, though subtle, disrupts river networks and enhances sedimentation upstream and downstream. The major facies change between dark conglomerate and light sandstone deposition occurs today south of Yakeng. The morphology prior to topographic emergence was completely different: the large alluvial fans emerging from the water gaps of Quilitak anticline extended farther south than today. The southern edges of these preemergent fans are recorded by the conglomerateto-sandstone facies change, which lie within the emergent Yakeng anticline and 5 10 km north of its present location. Former fan drainages are still preserved on the anticlinal crest and have channel orientations shown as black lines that project to the present fan apices at the edge of Quilitak (see also Figure 10b). fold shape. We can more fully constrain both the folding kinematics and history by comparing the shape of the emergent Yakeng surface with the shapes of the directly underlying seismically imaged horizons. We use the topographic profile and profiles of the underlying growth horizons to measure their relief as a function of horizontal position relative to pregrowth horizon 15 (Figure 11a). Remarkably, these measurements yield a strong linearly proportional relationship both in relief and elevation (Figures 11b and 11c). This means that the local relief of the warped topographic surface, as well as the other growth horizons, is pointwise linearly proportional to the finite structure but at a reduced amplitude. Thus, if at a horizontal location x the relief of a reference horizon is h o (x), then the relief h(x) of some other horizon is observed for all x to be hx ðþrh o ðþ x ð3þ For example, the local relief of the emergent topographic surface is 42% of the relief of the uppermost pregrowth horizon (15) and 57% of the relief of the uppermost seismic horizon (27) (Table 1 and Figure 11b). Such linearly proportional ratios of relief are shown for all the growth horizons with very good statistical fits (R 2 > 0.9) and an upward decrease in the ratios of relief r (Table 1). This behavior of Yakeng is similar to behavior of the kinematic detachment fold model in Figure 1 that assumed the present uplift rate is a collocated linear function of the finite fold shape at any point. [18] However, Yakeng differs slightly from this model (Figure 1) because of (1) the existence of primary stratigraphic thickness gradients that contribute to the ratios of relief and (2) the contribution of the growth of excess area to the growth in total relief. If there is a nonzero gradient in primary stratigraphic thickness between two horizons, then their ratio of elevation (Figure 11c), as opposed to Figure 10. Yakeng morphology in the East Quilitak area. (a) Yakeng forms a 6-km-wide rounded topographic ridge that few rivers can incise, as shown by many wind gaps (left, Spot image; right, morphological interpretation; see location in Figure 3). Northward tilting of the north flank of Yakeng and alluvial deposition both decrease stream gradients, which favors development of a new river network along the northern limb of Yakeng. When Yakeng developed its present topographic expression, part of the former river network was preserved on its crest (see also Figure 10b). The latter is in straight continuity with present East Quilitak fan network (thick dashed lines Figure 10a), attesting that the fan extended across Yakeng. The old southern edge of East Quilitak fan was located 4 km southward as shown by the facies boundary between dark fan conglomerates and light Tarim sandstones (see also Figure 9). Box is area of Figure 10b. (b) Present river network formed by a combination of old fan drainage preserved on anticlinal crest and newly established drainage along Yakeng steepest flanks. Former river geometry yields southward converging drainage networks interrupted by wind gaps at Yakeng crest. 10 of 39


11 relief (Figure 11b), will include this stratigraphic gradient in addition to the structural relief. Therefore the stratigraphic gradients must be removed if we want to quantify the deformational component, particularly for determining the shortening from the ratios of relief. The effect of these stratigraphic gradients on the ratio of relief is small but not entirely negligible in the case of Yakeng (<4%), so we have removed them in determining the ratios of Figure of 39
12 Figure 11. Linearly proportional collocated growth of Yakeng. (a) Digitized shapes of the topographic surface and the underlying growth horizon 27 (see Figure 5). The folded topographic surface that has emerged on the crest of the anticline is buried on its flanks. We estimate its buried position based on the observed point-wise linear proportionality of elevations and relief (Figures 11b and 11c and Table 1). The folded topographic surface has 55% of the topographic amplitude and 57% of the structural relief of horizon 27, which indicates m deposition south of Yakeng since emergence. This thickness suggests a time since emergence is ka based on a long-term sedimentation rate of 0.43 mm/yr. (b and c) Graphs showing the point-wise linear proportionality between fold amplitude on different horizons at the same horizontal position, shown as both relief and elevation. The fold shapes on younger horizons are the same as older horizons but at reduced amplitude, with the fractional amplitude given by the slope of the regression. For example, the present structural relief (elevation minus regional stratigraphic gradient) of the deformed topographic surface is 55% of horizon 27. The relief in elevation of the deformed topographic surface is 45% of the relief of pregrowth horizon 15 relief, and the relief in elevation of growth horizon 27 is 81% of pregrowth horizon 15. All growth horizons show similar pointwise linearly proportional amplitudes (Table 1), similar to the simple detachment fold model of Figure 1c. This linear relationship is used to compute shortening in Figure 7 (diamonds). relief in Table 1. The measured stratigraphic gradients are 1.05 ± 0.17 with adjacent horizons having nearly identical gradients, which yields generally second-order contributions to the ratios of topographic relief because the fold limbs have dips of 4 7 that dominate the ratios of relief. [19] The excess area A e makes a more important and systematic contribution to the ratios of relief. We begin by 12 of 39
13 noting that it follows from equation (3) that the ratio of relief r between a horizon and a reference horizon such as the uppermost pregrowth horizon (15) is equal to the ratios of their total areas of relief and from equation (2) r ¼ A A 15 ¼ Z n Zo n o rh 15 ðþdx x h 15 ðþdx x r ¼ A ¼ SH þ fa e A 15 S 15 H 15 þ A e where SH and S 15 H 15 are the contributions of shortening to the total area of relief and f is the fractional contribution of the excess area A e. Rearranging we obtain the mean shortening between the detachment and the horizon in question S ¼ rs 15H 15 þ ðr f ÞA e H [20] In the case of Yakeng we can approximate the fraction as f = 1 given the evidence for significant postemergent excess area (see discussion equations (1) and (2)). Application of this equation to the Yakeng data yields shortening within the growth interval based on regressions of relief that are generally within a few percent of shortening obtained from area of structural relief (Figure 7 and Table 1). [21] Using this linear growth model, we can estimate the magnitude of sedimentation on the flanks of Yakeng during its latest phase of growth and emergence (Figure 11a). We use the proportional relationship between the elevations of the deformed topography and horizon 27 (Figure 11b) to compute the subsurface shape of the time horizon representing the present emergent topographic surface by taking an unburied topography that is 55% of horizon 27 (Figure 11a). In this way we infer that about 70 to 90 m of sediments were deposited on the edges of the anticline. Given the long-term sedimentation rate of 0.43 mm/yr controlled by base level, we infer an emergence of the Yakeng anticline at ka. This age of emergence may not coincide precisely with the time of acceleration of growth because (1) some acceleration may be needed before the entire surface emerges and (2) the development of excess area may contribute to emergence. The acceleration could begin as much as kyr before emergence based on linear extrapolation (Figure 7). The date of emergence combined with a shortening of 250 m since emergence (Table 1) yields a postemergence shortening rate in the range mm/yr, which is an order of magnitude greater than the preemergent rate of 0.16 mm/yr. The ratio of sedimentation rate to shortening rate ds/dh is preemergence and 3.3 postemergence (Figure 7). [22] The flexural contribution to the shortening (the bed length shortening, S c = L L o ) is about 5% throughout the growth and pregrowth intervals [Gonzalez-Mieres and Suppe, 2006, also submitted manuscript, 2006]. Therefore ð4þ ð5þ ð6þ Yakeng is dominated by layer-parallel pure shear and is closely approximated by a linearly proportional collocated growth model (Figure 1). In addition, Gonzalez-Mieres and Suppe [2006] have shown that there is no layer-parallel simple shear within the pregrowth section (constant shortening as a function of height) Morphological and Stratigraphic Evidence for the Preemergent Yakeng [23] We make use of the fact that Yakeng was completely buried to further analyze the details of its present morphology. Former complete burial of Yakeng implies that the five large alluvial fans now deformed by the fold did not exist in their present constrained form, where they onlap the north dipping side of the topographic high. Also the rivers emerging from Quilitak were the only source of conglomerates, whereas today Yakeng is also a local source. Therefore the sedimentation processes and associated river networks changed when Yakeng emerged. Part of this morphological change is recorded in the uplifted morphology and stratigraphy of Yakeng. [24] The present-day location of the conglomerate-tosandstone facies change is clearly visible 3 5 km south of Yakeng in remote sensing images because the finergrained Tarim basin sandstones have a much lighter hue than the coarser dark gray conglomerates of the alluvial fans (Figure 9). The preemergence transition between conglomerates and sandstones is exposed km north of the present one within the Yakeng uplift (Figure 9). Its shape is arcuate with the center of curvature of each arc being the apex of one of the major fans emerging from Quilitak. Therefore the old sandstone-to-conglomerate transition maps the southern edge of the fan systems as it existed just before topographic emergence of Yakeng. [25] The orientations of relict river channels preserved on the crest of the Yakeng uplift also radiate from the apices of the major Quilitak fans, confirming the location and extent of the preemergent fans (Figure 9). The old fan shape and the associated river network are particularly well preserved in the East Quilitak area (Figure 10). Characteristic wind gaps with southward converging channels are ubiquitous over the crest of Yakeng attesting to the presence of the previously throughgoing drainage system (Figure 10a). These former drainages can be most clearly mapped on the nearly flat crest of the anticline, forming a radiating pattern of incised channels typical of alluvial fans. These are continuous with the present East Quilitak fan and its apex (Figure 10b). The emergence of Yakeng above the river base level has thus clearly preserved the former fan morphology on its anticlinal crest. The old drainage network is poorly preserved on the limbs of the fold where younger incised channel networks have developed in response to folding of the previous fan surfaces (Figure 10b). 4. Quilitak Anticline: A Complex Fault Bend Fold 4.1. Deep Structure [26] The 350-km-long Quilitak anticline shows substantial along-strike variation in its geometry [Guan, 2004], but it is everywhere composed of two distinct structural levels. As seen in cross section these include (1) a deep thrust ramp that produces a broad deep anticline with limb dips of of 39

14 Figure of 39
15 20 and (2) an overlying wedging system that produces the near-vertical dips in its core. Figure 4 shows these two structural levels. A deep thrust ramp steps up southward from a 9-km-deep lower detachment in Upper Jurassic coal horizons to a 5-km-deep upper detachment in evaporates of the Miocene Jidike Formation, which extends southward to form the detachment of the Yakeng anticline. Slip on the deep ramp (6 km), plus deeper folding of the fault, has generated a 7- to 8-km-wide north dipping kink band X-Z imaged in the seismic profile. This kink band is the convolution of kink band X-X bounding the footwall fold and Z-Z bounding the conventional thrust ramp (Figure 4). The deep kink X-X band is related to a basement fold. Another well-imaged axial surface Y defines the southern limit of the south limb of Quilitak and indicates that 5 km of slip has emerged southward on the Jidike detachment. [27] However, the shallower structure is necessarily more complex because Yakeng, which is located above the same Jidike detachment, has consumed only 1.2 km of the 5 km slip coming from Quilitak. Much of the remaining 3.8 km is apparently wedged back in the anticlinal core of Quilitak. This wedge geometry implies that the southern axial surface Y, which is pinned to the wedge tip, has functioned as an active axial surface. Above the deep ramp, additional wedging occurs at a shallower level in the anticlinal core. The latter wedge is located at the intersection between the backthrust and an upper bedding-parallel detachment level. At this shallower wedge tip (labeled A in Figure 4) the thrust system splits into two main faults. The upper thrust reaches the surface in the south limb of Quilitak. Slip on the lower thrust is consumed in folding. Additional deep detachment folding and associated wedging in the north syncline completes the slip budget of Quilitak. This backand-forth wedging system generates a complex set of active axial surfaces interacting with one another in way qualitatively similar to the model in Figure 2. [28] The first-order along-strike changes in the structure of the Quilitak anticline in the Kuche area can be seen by mapping the most important fault bends and associated axial surfaces at depth, based on a grid of seismic reflection profiles using axial surface mapping techniques [Shaw et al., 1994; Shaw and Suppe, 1994]. We mapped the terminations of axial surfaces X and Y, which define the deep extent of Quilitak, corresponding to the base of the deep northern kink band and the southern wedge tip. The resulting axial surface map (Figure 12) shows that the deep extent of the Quilitak anticline narrows substantially from west to east within the Kuche area, changing from km west of the Kuche River to km east of the East Quilitak River. Approximately half of this eastward narrowing occurs within the southern deep flank of Quilitak that reflects a reduction of fault slip on the deep ramp from 9 10 to 5 km. This eastward reduction in width and slip also is reflected in the eastward plunging topographic relief of the Quilitak core. Ultimately, 70 km east of the Kuche River, the anticline does not show any topographic relief and is covered by a discontinuous unconformable veneer of alluvial sediments (Figure 3). [29] We note two additional structural changes along strike (Figure 12). First the axial surface X is shifted southward east of the Kuche River without any marked change for the axial surface Y, which reflects a deeper level of the northern base of the deep ramp. Secondly, near the Kuche Tow water gap, axial surfaces X and Y are both shifted southward related to an offset of the entire anticline structure along a major transverse zone near Kuche Tow, which also marks the western limit of Yakeng anticline (Figure 3) Large-Scale Morphological Expression of a Fault Bend Fold [30] The link between the deep structure of Quilitak and its surface morphology is not as simple as for Yakeng. Nevertheless, high-relief topography coincides with the anticlinal structural core characterized by steeply dipping beds. This suggests that a direct relation exists between high topography in Quilitak and the underlying anticlinal structure, as confirmed below. [31] High relief in Quilitak is characterized by very well defined edges along which a sharp rise in topography occurs. These form continuous linear range fronts labeled A and B (Figures 12a and 12b). These range fronts generally correspond to structural changes and not differences in erodability of uplifted strata. For example, fieldwork conducted along the East Quilitak valley shows that fronts along lines A and B coincide with synclinal axial surfaces along which major (40 70 ) changes in the dip of bedding occur (Figures 12c and 12d). The seismic line located along the East Quilitak River (Figure 4) further confirms that range fronts A and B correspond to intersections between topography and active axial surfaces related to the deep Quilitak wedging system. The Quilitak moun- Figure 12. Quilitak anticline: relationship between morphology and structure. (a) Axial surface map on top of Landsat image (see location on Figure 3). Black squares indicate the deep locations of footwall terminations of the active axial surfaces X and Y, which indicate the full width of Quilitak anticline at depth (see Figure 4). These terminations can be unambiguously located on seismic lines to within ±100 m except in the tear zone area; the positions of all seismic profiles used are indicated with thin lines. The topographically expressed Quilitak anticline is much narrower than its subsurface extent; the Quilitak high mountainous ridge is bounded by its sharp linear edges A and B, which correspond to active axial surfaces bounding a central region of higher uplift rate, as discussed in text. Box shows the area of Figures 13b and 13c. The locations of the profile used in Figures 12b and 13a, the viewpoint in Figure 12c, and the location of section in Figure 12d are shown. (b) Topographic profile highlights again that the topographic expression of Quilitak is much narrower than the full width of the anticline at depth indicated by axial surface terminations X and Y, which have no topographic expressions. (c) View of 40 dip change along axial surface A. (d) Section logged along eastern edge of East Quilitake River Valley across the wide axial surface B and related field photographs. In Figures 12c and 12d, structural data along the East Quilitak River show that the Quilitak topographic edges A and B correspond to marked change in bedding dip or axial surfaces. The Quilitak topographic high is related to the steep anticlinal core where wedging occurs (see cross section in Figure 4). 15 of 39
 Topographic profile (location in Figure 12a) that has a shape similar to that predicted by folding due to slip on the underlying thrust fault.")
16 Figure 13. Active folding of the landscape across axial surfaces A and B. (a) Topographic profile (location in Figure 12a) that has a shape similar to that predicted by folding due to slip on the underlying thrust fault. (b) Satellite image showing folding across the same axial surfaces at the surface (location in Figure 12a). Location of seismic lines, which image the deep fold and confirm the interpretation, is marked. (c) Folding of conglomeratic alluvial sediments at the southern front of Quilitak high (location in Figure 12a). (d) Simple fault bend fold model with onlap of recent alluvium over an active axial surface, predicting a morphology similar to Figure 13c. tainous relief is thus bounded by active axial surfaces, which represent bends on underlying thrust surfaces. [32] Axial surfaces A and B are active, implying that they mark discontinuities in uplift rate and are the active locus of bending (Figure 1a). The ridge morphology of Quilitak indeed testifies that active folding occurs across both axial surfaces. Figure 13a shows that the predicted shape of the topographic surface due to slip on the underlying thrust through axial surface A, computed using folding vectors [Shaw et al., 2005], is very similar in form and slightly above the observed topographic profile. Therefore the topographic profile is consistent with fault bend folding of the land surface with only modest erosion. Folding of the landscape across the same axial surface just east of the East Quilitak valley is clearly visible in remote sensing images (Figure 13b). In addition, just south of Quilitak ridge, Figure 14. Southern edge of Quilitak topographic high: West Quilitak area (location in Figure 3). Large triangular fold scarp facets (Figure 15) above a synclinal axial surface mark this southern topographic front. The surface of the triangular facets is interpreted to be the folded equivalent of the low-relief erosional surface that exists south of the synclinal axial surface, as discussed in text. (a) Structural measurements reported on top of Landsat images. Inset is a topographic map with contour lines every 50 m. Wind gaps are indicated by letter w. Triangular facets limit the Quilitak topographic high to the south (see also Figure 15). A steep bedding-parallel thrust fault limits Quilitak topographic high to the north. (b) Bedding dip data and topographic profiles showing that a synclinal axial surface marks the base of the fold scarp facet (see location in Figure 14a). These dips and the 31 slope of the facet are used to test the interpretation that the facet is the folded equivalent of the eroded low-relief surface to the south (see Figure 14d and Table 2). (c) Cross section based on seismic line and surface geology across Quilitak (location in Figure 14a) showing relationships between structure, surface dip measurements, and uplifted topography. The synclinal axial surface that marks the southern edge of the uplift is produced by the steepening of the dip on the back thrust. Well-imaged throughgoing seismic reflectors are shown as light lines. (d) Kink band migration model that quantitatively fits the structural measurements and observed morphology (see Table 2). Approximately 1.1 km of fault slip since topographic emergence is indicated. 16 of 39

17 Figure of 39
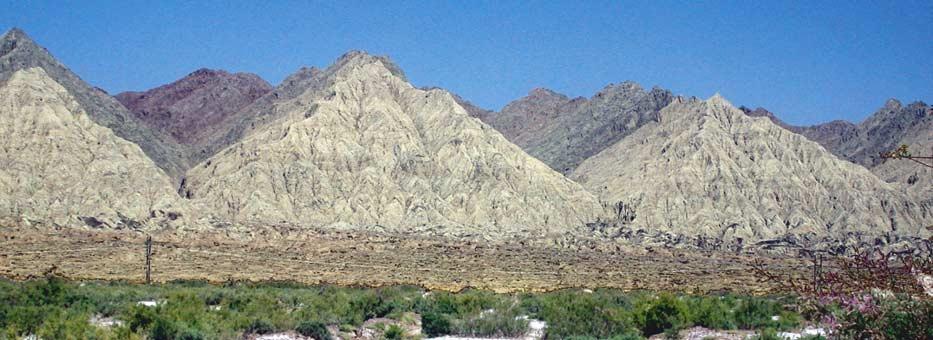
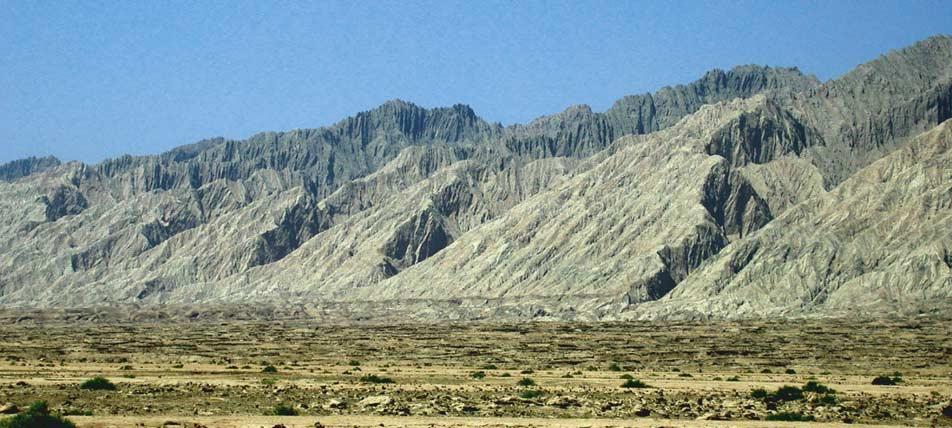
18 alluvial conglomerates that onlap steeply dipping strata of the Quilitak ridge (Figure 12d), are presently uplifted and folded as they pass through axial surface B (Figure 13c). The dark gray conglomeratic alluvium, which visually contrasts with older steeply dipping sandstone strata, is now incorporated by uplift into the Quilitak topographic high. Its overall morphology is similar to what can be predicted by a simple fault bend fold model involving onlap of alluvium over the active axial surface (Figure 13d). [33] The edges of the Quilitak mountainous relief can thus be interpreted as a direct surface expression of active axial surfaces bounding the anticlinal core. The morphology is consistent with the kink band migration deformation mechanism inferred for Quilitak. In fault bend folds active axial surfaces are the only locus of active deformation during earthquake rupture on the underlying thrust fault. It is thus expected that active axial surfaces have a specific morphological expression, as do faults. [34] Even if the Quilitak topographic high is related to active differential uplift across active axial surfaces pinned to the underlying wedging structure, some active axial surfaces, like X and Y, have no obvious topographic expression. In fact, the axial surface map in Figure 12 shows that the width of Quilitak anticline at depth is up to 4 times the surface topographic width, which is only 5 km. However, Figure 12 also highlights a close relationship between the surface shape and changes along strike of the X-Y axial surfaces. For instance, the shape of the Quilitak ridge along strike mimics changes in the deep ramp geometry. Near Kuche Tow the relief is also offset along the transverse structure. Finally, axial surface X corresponds at times to a change in the sedimentation pattern, with active sedimentation (fan deposits) to the south and some incision to the north. [35] The fact that only some axial surfaces have a topographic signature is a result of the relative magnitude of uplift and sedimentation rates. By analogy with Yakeng, for which topographic emergence occurs only where uplift rate is greater than sedimentation rate, some active axial surfaces of Quilitak such as X and Y are continuously buried. The situation for Quilitak is somewhat different than for Yakeng, because of the contrasting folding mechanism. The Yakeng uplift rate is a direct function of the amplitude of the finite deep structure and varies smoothly across it; therefore the edge of the morphologic uplift represents a line along which postemergence sedimentation and uplift are equal. In contrast the Quilitak uplift rate is constant between axial surfaces. In addition Quilitak is a complex fault bend fold and therefore has multiple discontinuities in uplift rate related to multiple fault bends. As the uplift rate depends on the sine of the underlying fault dip, uplift rates must show substantial variation and discontinuity across the structure (see also Figure 2). In particular the changes in uplift rate related to bends in the wedging system in Quilitak core where faults are steeply dipping (60 70 ) can be at least twice as great as the uplift change related to the Quilitak ramp (20 25 dip). Uplift discontinuities along axial surfaces related to the wedging system in Quilitak may be such that the uplift suddenly exceeds sedimentation. In contrast, uplift discontinuities related to the other axial surfaces X and Y may not be enough to exceed sedimentation, so the related axial surfaces are not apparent in the topography. Similarly axial surfaces A and B that bound Quilitak ridge start to be buried east of the East Quilitak River, as slip on the underlying thrust decreases. For example, Figure 13b highlights river pattern changes along axial surface A east of Quilitak River. The river network is no more deviated along the axial surface but simply change from aggrading to incising. As slip further decreases eastward, the whole anticline is fully covered by sediments, while active folding still occurs along active axial surfaces A and B Development of Large-Scale Triangular Fold Scarp Facets, Southern Front of Quilitak Anticline [36] In this section, we further document the large-scale geomorphic effect of active axial surfaces or hinge zones intersecting the topographic surface. We focus specifically on the southern front line labeled B in Figure 12. Study of the northern Quilitak front labeled A in Figure 12a is less suitable because of erosion by rivers flowing along the topographic northern edge. [37] The Quilitak southern front is characterized by an abrupt rise in topography and shows a distinctive faceted morphology composed of steep triangular/trapezoidal mountain front facets (Figure 3, details in Figures 14, 15, 16, and 17) separated by distinct V-shaped, wine glass valleys (Figures 14a and 15a) marked by incised stems just upstream from the mountain front [cf. Armijo et al., 1986]. West of the East Quilitak River, the set of facets is continuously developed except where major river incision and erosion has occurred near water gaps (Figure 3). To the south of the facets, the topography is nearly flat or very gently dipping southward (Figures 14, 15, 16, and 17). The junction between the facets and the low dipping surface to the south corresponds to the continuous and linear front line B in Figure 12, which defines the southern edge of the Quilitak ridge. [38] Triangular mountain front facets are usually considered the morphological signature of normal faults. They form on the footwall blocks and are marked at their base by the active fault trace. By analogy with normal fault facets, the Quilitak facet morphology (Figure 15) suggests that sustained recent uplift is occurring along the Quilitak front line. However, no active fault is observed reaching the surface at the Quilitak mountain front. What is observed is a major synclinal axial surface running at the base of the facets. Figure 15. Views of west Quilitak triangular facets looking north. The surfaces of the 600- to 700-m-high triangular facets are shown to be the folded equivalent of the low-relief landscape to the south in the foreground. The base of the slope is the locus of a synclinal axial surface across which there is a 45 change in bedding dip, which predicts the observed 31 slope of facet b (Figure 14 and Table 2). (a) Photographs. Labels b and c refer to facet labeling in Figure 14a. (b) Shaded three-dimensional (3-D) view of the Quilitak topographic high and its facets with a vertical exaggeration of two. Viewpoint is shown in Figure of 39

19 Figure of 39

20 Figure of 39
21 [39] To decipher the origin of these facets and determine their relationship with the deep structure, we examine in detail the surface structure and topography of the Quilitak southern front in three different areas: West Quilitak (Figures 14 and 15), West Kuche Tow (Figure 16), and Kuche River (Figure 17); see Figure 3 for area locations. We combine fieldwork, seismic reflection data and a stereophotogrammetry to measure bedding strikes and dips in those remote areas. Seismic reflection data particularly constrains low dips in the West Quilitak area whereas the stereo imaging method constrains high dips in all the areas (see Appendix A). [40] Structural measurements show that Quilitak surface structure is generally similar in the three studied areas. The southern limit of the Quilitak mountainous topography (front line B) at the facet base coincides with an axial surface or hinge zone along which a sharp change in bedding dips occurs (Figure 14, West Quilitak area; Figure 16, West Kuche Tow area; Figure 17, Kuche River area). On the southern flank of the Quilitak topographic high, beds are dipping steeply southward (80 75 in West Quilitak, 70 in West Kuche Tow, and 65 in Kuche River), whereas the nearly flat erosional surface to the south is underlain by bedding that dips 30 or less. Minor structural differences exist in the three different areas, including some secondary folding, but the base of the facets in Quilitak is always a synclinal hinge along which a change in dip of at least 35 occurs. We thus conclude that the front line B bounding the southern edge of the Quilitak topographic high (Figure 12a) is an axial surface zone. [41] The facet morphology and wine glass canyons (Figure 15) further indicates that active uplift is occurring along the hinge zone at its base, which means that the axial surface is active. The triangular facets and the associated sudden rising in the topography attest that rocks move with respect to the axial surface and are folded as they pass through it. We thus interpret the facets as cumulative fold scarps resulting from the folding of the erosional surface to the south as it passes northward across the active axial surface by a kink band migration mechanism. On the basis of surface mapping and seismic imaging, the underlying cause of the kink band migration in this case is likely fault bend folding (Figure 14) above the thrust emerging to the north, but the analysis of the facets does not depend on any assumptions about the specific cause of the kink band migration. Fault propagation folding and some types of box folding and fold interference also drive kink band migration. However, using a simple fault bend fold model, we can match the observed changes in bedding dip, the slope of the facets and the overall Quilitak relief in the three previously studied areas: West Quilitak (Figure 14), West Kuche Tow (Figure 16), and Kuche River (Figure 17). [42] We test the kink band migration hypothesis for the formation of the triangular facets by computing the predicted dip of the facet surface and comparing it to the observed topographic dip (Table 2). Using the changes in dip across the axial surfaces, we compute the predicted topographic inclination of the triangular facets in each of the three areas based on the assumption that it is the folded equivalent of the land surface south of the mountain front. This is computed using folding vectors assuming a flexural slip mechanism [Shaw et al., 2005] or using a fault bend folding equation (see Table 2). In West Quilitak where a change in bedding dip of 45 occurs, we predict a 31 dip for the folded erosional surface which agrees with the 31 facet topographic slope (Figure 14); in West Kuche Tow where a change in bedding dip of 40 occurs, we predict a 25 dip for the folded erosional surface which agrees with the 26 facet topographic slope (Figure 16); and at Kuche River where a change in bedding dip of 35 is observed, we predict a 23 dip for the folded erosional surface which agrees with the 23 facet topographic slope (Figure 17). Quilitak large-scale morphology that looks like a box fold with a nearly flat top can also be reproduced using the same fault bend folding model. In West Quilitak (Figure 14) and West Kuche Tow (Figure 16), about 1.1 km of slip along the northern thrust is required to match the facet relief. The fact that the relief and the facet slopes are lower in West Kuche Tow relative to West Quilitak is related to smaller changes in bedding dips across the hinge in West Kuche Tow (Figure 16). East of the Kuche River (Figure 17) the morphology is slightly different and a much greater slip of km is required to generate the observed topography. [43] We have thus established a direct relationship between the southern topographic front of Quilitak and active axial surfaces related to the deep structure: the whole ridge can be approximated by a simple kink band migration model, driven by fault bend folding. The particular facet morphology also highlights the fact that active axial surfaces are significant phenomena for understanding and interpreting thrust-related active tectonic morphology Role of Surface Processes in Shaping Quilitak Relief [44] The relief of Quilitak appears to result from a nonsteady competition between tectonic and geomorphic processes. The mismatch between the km of topographic relief of Quilitak and its 4 5 km of pregrowth structural relief (Figure 4) suggest that surface processes are on the average nearly as important as tectonics over the entire history of deformation. Erosion, combining river incision and denudation of hillslopes, tends to lower the Quilitak ridge. Furthermore, adjacent sedimentation raises the elevation of the flanks of the fold, thereby lowering the topographic relief of the central Quilitak uplift. As discussed in section 3.1 on the rate of growth of Yakeng, the long-term sedimentation rate has been quite constant since 10 Ma [Charreau et al., 2006], not showing the upward increase typical of some foreland basins. Therefore the progressive burial of the flanks of both the Quilitak and Figure 16. Southern edge of the Quilitak topographic high, West Kuche Tow area (location in Figure 3). (a) Structural measurements mapped on top of Spot image. Triangular facets are highlighted. (b) Topography (contour lines every 50 m) with facets morphology highlighted (location in a). Wind gaps are indicated by letter w. (c) Facet dip and topographic high constrained by a topographic profile (location in Figure 16a). Structural measurements are reported. (d) Kink band migration model fitting structural measurements and observed morphology (see also Table 2). 21 of 39

22 Figure of 39
23 Table 2. Facet Dips Computed From Structural Measurements and Compared With Observed Facet Dips a Initial Bedding Dip d o, deg Folded Bedding Dip d, deg Axial Surface Angle g, deg Unconformity Dip d u, deg Observed Facet Dip d fo, deg Computed Facet Dip d f, deg West Quilitak (Figure 14) West KucheTow (Figure 16) West Kuche Tow (Figure 22) Kuche River East (Figure 17) a Here cot(d f d u ) = [sin 2 g / sin 2g sin 2 (g d o + d u )] cot (g d o + d u ), where g =90 (d d o )/2; modified from Suppe [1983, equation 7]. Yakeng anticlines appears primarily to reflect a steadily rising base level of the closed Tarim basin rather than local sediment sources or basin flexure. The rise in base level is 2.4 km since the beginning of Yakeng deformation (Figure 7), which is an upper bound on the beginning of Quilitak deformation because they are linked by the same basal fault. There has been little flexure of the Kuche subbasin since the beginning of deformation [Hubert-Ferrari et al., 2005a]. Therefore the basin-wide rise in base level reduces the potential topographic relief of Quilitak by 45 60% and erosion contributes another 20 35% reduction. Surface processes have thus limited the relief of Quilitak over its entire history. However, because of the steadiness of erosion/sedimentation rates, the present morphological relief still directly reflects along-strike and temporal changes in uplift rate as discussed below. [45] In section 4.2, we have shown that west of the Kuche Tow transverse structure, differences in relief along strike between West Quilitak (Figure 14) and West Kuche Tow (Figure 16) may be related to minor changes in the axial surface geometry, and thus in uplift rate. In addition east of the East Quilitak River, the eastward decreasing Quilitak topography (Figures 3, 12, and 13) correlates with the eastward decreasing slip on the underlying ramp. Furthermore in the area between the Kuche Tow transverse structure and the East Quilitak River (Figure 3), Yakeng and Quilitak relief are anticorrelated (Figure 18), which agrees with the fact that the structures lie above the same basal thrust. West of the Kuche River Yakeng does not exist; Quilitak is the frontal structure accommodating the shortening and it reaches its highest elevation here. East of the Kuche River, Quilitak relief decreases in two steps that correspond with increases in Yakeng relief. The first 150-m-high decrease in Quilitak relief across the Kuche River occurs where Yakeng appears. The existence of Yakeng, which accommodates part of total shortening, implies that the shortening accommodated in Quilitak must decrease. About 5 km farther to the east, the second 280-m-high decrease in Quilitak relief and the related decrease in facet height (to less than 340 m) corresponds with the emergence of Yakeng at the surface and with an increase in its amplitude of folding at depth. East of this second step, the shortening accommodated in Yakeng is 3.5 times greater than further west [Dittmann, 2005], which implies again that slip accommodated in Quilitak must have decreased. The latter observations confirm that even if surface processes are dominant, Quilitak topographic relief is still a first-order record of both its geometry and of the total slip accommodated in the structure Topographic Emergence of Quilitak [46] A last consideration that is important in understanding the present surface morphology of Quilitak is the recent acceleration of growth of Yakeng. Because Yakeng and Quilitak are structures linked at depth by a common detachment (Figure 4), their topographic relief must be interdependent such that the observed acceleration of growth of Yakeng will have implications for Quilitak. We consider the following two possibilities. First, acceleration of growth of Yakeng may simply reflect a decrease in the shortening accommodated in Quilitak. A second possibility would reflect an acceleration of shortening in the southern Kuche belt and thus represent a somewhat larger scale event in the Tian Shan [e.g., Abdrakhmatov et al., 1996; Burchfiel et al., 1999; Burbank et al., 1999; Zheng et al., 2000]. We favor the latter hypothesis, because a close examination of Quilitak morphology suggests that the anticline was previously buried in a way similar to Yakeng, raising the possibility that the Quilitak emergence may correlate with Yakeng emergence. Three lines of evidence suggest a relatively young emergence for Quilitak and are discussed below: (1) the triangular facets, (2) throughgoing drainage networks with wind gaps, and (3) disequilibrium ridge lines. [47] 1. The facet morphology resulting from the folding of the pediment to the south and the existence of such an erosional surface suggest a sudden change in the fold history. This type of morphology cannot exist continuously since the beginning of Quilitak growth, 6 Ma. [48] 2. In the three studied areas, West Quilitak, West Kuche Tow and Kuche River, we can map valleys aligned or continuous across the anticlinal crest line that contain rivers that flow in opposite directions. Numerous wind gaps exist along the crest line, analogous to the wind gaps of Yakeng (Figures 14, 16, and 17). Valley continuity over the crest line is most striking in the West Kuche Tow area (Figure 16b). A particular drainage morphology characterizes this area. The Quilitak crest line is not centered in the middle of the 5-km-wide Quilitak relief but is lies 4 kmto the north of the southern topographic front of Quilitak. For all rivers incising the present Quilitak relief an apparent river valley can be mapped over the crest line. The most striking example is the drainage system just west of the Figure 17. Southern edge of Quilitak topographic high, Kuche River East area (location in Figure 3). (a) Topography (50-m contour interval) with facet morphology highlighted. Wind gaps and interpreted old throughgoing drainage are indicated. (b) Structural measurements reported on top of Spot image (see location in Figure 17a). (c) Facet dip and topographic high constrained by a topographic profile (see location in Figure 17a). Structural measurements are reported. (d) Kink band migration model fitting structural measurements and observed facet morphology (see also Table 2). 23 of 39
24 Figure 18. East-west topographic profiles (a) along the strike of the Quilitak crest line and facets and (b) along the strike of the Yakeng crest line. topographic profile marked on Figure 16b. Without the topographic maps indicating wind gap locations, the topology of the drainage system through the structure is identical to that of a single continuous watershed with southward convergent rivers. In West Quilitak the morphology is similar with long deeply incised valleys south of the crest line and elongated ridge divides, but higher relief (Figure 14a). Therefore topographic emergence and drainage reversal in West Quilitak may have occurred earlier than in West Kuche Tow, which is consistent with the higher rate inferred across the southern axial surface in West Quilitak. In the Kuche River area (Figure 17a), relief is even higher, and the crest line is centered more on the middle of the Quilitak relief but the continuity of valleys and drainage divides across the crest line is still apparent. [49] 3. Another indication of recent emergence or accelerated growth of Quilitak includes disequilibrium gradients of the ridgelines (Figure 19), indicating that the topography has not yet reached steady state. Modeling of Koons [1989] of the morphologic evolution of an eroding and uplifting fault block shows a transient memory of the preuplift flat topographic surface (Figure 19b). Koons shows that the disequilibrium is recorded in the difference between adjacent ridgeline and stream profiles. As steady state is approached the ridgeline and stream profiles become parallel. Comparison of adjacent ridgeline and stream profiles for three areas of south Quilitak (Figures 14, 16, and 17) show strongly disequilibrium profiles with the ridgeline profiles having very gentle south dipping gradients in contrast with the adjacent stream profiles for all, as summarized in Figure 19c. [50] On the basis of the existence of throughgoing southward converging relict drainage with wind gaps and disequilibrium ridgeline gradients, we therefore conclude that Quilitak shows a recent acceleration of uplift rate similar to Yakeng anticline. Prior to this acceleration Quilitak appears have had very low topographic relief with an uplift rate in approximate balance with erosion and rise of base level, and also a throughgoing drainage network similar to present-day stream channels at the eastern end of Quilitak anticline Figure 19. Comparison between Quilitak morphology and numerical erosion models above a block uplift done by Koons [1989], showing the transient topographic memory of the initially flat state before uplift. (a) A 3-D view along the West Quilitak topographic ridge looking east with the fold scarp facets to the right and the thrust fault to the left bounding the uplift (vertical exaggeration 1.5; location in Figure 14). This view, as well as Figure 19c, shows the low topographic gradients of the transverse ridges in contrast with deeply incised transverse valleys, and steep facets, similar to left-hand model in Figure 19b. (b) Numerical erosion models of Koons [1989] for fault-bounded block uplift of a preexisting flat surface with imposed drainage, with uplift in meters indicated. The transverse ridge line profiles initially approximate the initial flat surface so that the ridge profiles are substantially flatter than the stream profiles (model to left). All memory of the initial state is eventually erased by erosion as steady state is approached in which ridge profiles and stream profiles are approximately parallel (models center and right). Quilitak anticline approximates the transient state shown to the left. (c) Summary of topographic sections in West Quilitak (Figure 14), West Kuche Tow (Figure 16), and Kuche River (Figure 17), also showing river valley and ridge crest profiles. Subhorizontal ridge lines, in contrast with river valley profiles, indicate a topographic disequilibrium and an order of magnitude increase in deformation rate estimated at Ma, as discussed in text. 24 of 39


25 (Figure 20) where uplift rate must be approximately equal to rise in base level or higher if balanced by erosion. We should note that this required low preacceleration topographic relief of Quilitak anticline may not have existed for its entire early history. In particular erosion rates may not have always been enough to balance uplift rate because 1.6 km pregrowth strata have been eroded in the core of anticline, given the observed pregrowth structural relief of Figure of 39


26 5 km, a present topographic relief of 1 km and growth sedimentation of 2.4 km. [51] On the basis of the assumption that uplift and sedimentation were in approximate balance, the rate of preacceleration slip on the back thrusts can therefore be estimated as the long-term sedimentation rate divided by the sine of the dip of the thrust. To get a reliable back-thrust rate, we use a decompacted sedimentation rate of 0.53 mm/yr Figure of 39
27 [Charreau et al., 2006], which yields back-thrust rates of mm/yr for the areas of Figures 14, 16, and 17, which is a region 50 km along strike. This rate represents a lower bound on the preemergent shortening rate because of erosion of the central uplift, discussed above. These rates, increased by 10% to reflect slip consumed in folding on the deep ramp [Suppe, 1983], give a preacceleration slip rate for the deep fault of Quilitak of mm/yr, not including slip consumed in Yakeng. [52] Given the observation that both Yakeng and Quilitak show an acceleration of uplift and that they are linked to the same Jidike detachment, we may use the age of emergence ( ka) or acceleration (< ka) of Yakeng as an estimate of the age of acceleration of Quilitak. Given the magnitude of slip on the back thrust since the assumed time of acceleration ka (or later) of km in three areas studied (Figures 14, 16, and 17), we estimate a slip rate for Quilitak of 4 5 mm/yr or greater. The accelerated rate for Yakeng in the East Quilitak section is mm/yr. The Yakeng and Quilitak rates, even though they are both above the Jidike detachment, they cannot be immediately added because they are in different cross sections. In west Kuche (Figure 14) Yakeng is missing, at west Kuche- Tow (Figure 16) an unstudied anticline exists to the south, at Kuche River (Figure 17) Yakeng has an amplitude and total shortening that is about a quarter of the value of our studied section, and the structure is substantially different in the East Quilitak section where shortening in Yakeng is highest (Figure 4). Therefore we can estimate a total shortening rate above the Jidike detachment for the Kuche River section of about 6 mm/yr or greater, including the 10% consumed in folding at the top of the deep ramp and based on an assumed ka time of acceleration for Quilitak. This uncertain estimated current shortening rate is a significant fraction of the current geodetic rate across this part of the Tian Shan of 9 ± 3 mm/yr [Reigber et al., 2001] and therefore suggests a significant tectonic change within the last half million years. The most proximal source of that change would be a termination of shortening consumed within the northern part of the Kuche thrust belt, which currently shows few indications of active deformation. [53] We can test this somewhat speculative chronology for Quilitak by computing the total shortening on the deep fault, which is independently known to be 5.5 km (Figures 4 and 14) and 9 km near the Kuche River (Figure 12). This fault has been active since at least the beginning of growth on Yakeng anticline at 5.5 Ma. The total slip rate for Quilitak ( mm/yr) plus Yakeng ( 1/3.5 of 0.6 mm/yr) near the Kuche River [Dittmann, 2005] prior to acceleration is 0.65 mm/yr which yields a total shortening of 3.4 km between and 5.5 Ma. The total shortening of Quilitak along the Kuche River since acceleration is 1.8 km and for Yakeng in the Kuche River section is 100 m: 1/3.5 of the shortening in the East Quilitak section [Dittmann, 2005]. The sum of these shortening estimates for the Yakeng and Quilitak system above the basal fault since 5.5 Ma is 5.3 km which is 3.7 km (40%) less than the total slip on the Kuche River section on the deep ramp obtained from seismic imaging of 9 km (Figure 12). However, it should be noted that this estimated post-5.5 Ma shortening must represent a lower bound because (1) possible contemporaneous erosion of the central uplift of Quilitak could contribute an additional 0.3 mm/yr based on the observed 1.6 km of erosion of pregrowth strata and (2) horizontal compaction of the stratigraphic section above the Jidike detachment would contribute an additional 2 3 km shortening over the 20- to 30-km-wide region based on observed horizontal gradients in seismic velocities south of Yakeng anticline [see Gonzalez-Mieres and Suppe, 2006]. The magnitude of this additional shortening associated with the erosive and compaction components is substantially uncertain, but must be within the range km. Therefore it appears, in spite of the rough nature of these estimates, that more than 80% and perhaps all of the 9 km deep slip of the Yakeng-Quilitak thrust system was consumed since 5.5 Ma when the Yakeng anticline began to grow. Therefore it is likely that this frontal thrust system of the southern Tian Shan began about 5.5 Ma and has not propagated since then. This 5.5 Ma date yields a preacceleration total shortening rate of this frontal system of about 1.3 mm/yr until the system accelerated by half an order of magnitude at about Ma to the current rate of about 6 mm/yr. 5. Detailed Record of Deformation at a Fold Scarp Along Quilitak Southern Front [54] In section 4 we considered the effects of kink band migration on the large-scale folding of the landscape at Figure 20. Low-relief eastern extremity of Quilitak anticline where present uplift rate is approximately in balance with an 0.43 mm/yr rise in base level by sedimentation on its flanks, plus any crestal erosion. This region approximates the inferred state of the present high-relief parts of Quilitak anticline to the west prior to topographic emergence at Ma. (a) Corona image (location in Figure 3) showing that Quilitak is not a barrier to throughgoing stream networks. West of section C-C, streams are incising sandstone/siltstone strata of Kuche/KunChung Formation [Yin et al., 1998]; uplifted alluvial terraces are indicated in yellow. East of C-C, drainage is not incising, and Quilitak tip is largely buried under recent alluvial sediments, which are being folded along a fold scarp in the area of the box (Figure 20c). The main river that crosses this part of eastern Quilitak is indicated by the letter R. (b) A 3-D view of Quilitak eastern tip vertically exaggerated 1.5; viewpoint in Figure 3. (c) Corona image showing active folding along southern edge of the low Quilitak uplift. Axial surface B (Figure 12) is active, and incised flat gravel fans overlying steeply dipping sandstone beds on Quilitak ridge are folded along southern edge of the anticline, similar to the outcrop section of Figure 12d and the model of Figure 13d. White dots indicate the location of field views in Figures 20d and 20e. (d) Synclinal active axial surface at the southern edge of Quilitak ridge. (e and f) Growth unconformity similar to Figures 12d and 13d showing flat gravels unconformably on top of steeply dipping gravel beds, whereas the overlying beds become parallel to the underlying beds to the south where they are folded, which is the expected geometry for folding by kink band migration (see also folding of T horizon in Figure 27c and Suppe et al. [1997]). 27 of 39
 is in straight continuation with facet base to the west, indicating that it is along the same active axial surface.")
28 Figure 21. Fold scarp in the Kuche Tow area (location in Figure 16). (a) Corona image with structural measurements. White arrows show location of fold scarp. Folding of alluvium (terrace T) is in straight continuation with facet base to the west, indicating that it is along the same active axial surface. (b) Topographic map (50 m contour interval) with alluvial sediments mapped (dot and circle pattern) and facet morphology highlighted. Thick line indicates active axial surface along which active folding is occurring. Sections logged in the field through the fold scarp are indicated (short thick lines, see Figures 22, 23, 24, and 25). Quilitak anticline as recorded in large triangular fold scarp facets, relict drainage networks with wind gaps and disequilibrium ridgeline profiles. Here we consider the finerscale kinematic details of this kink band migration by defining the progressive deformation of young alluvial strata as they traverse the finite width hinge zone of the active axial surface. To do this, we must evaluate a region that has a complete stratigraphic record of deformation, which is provided by the Kuche Tow transverse structure where there is an en echelon segment of axial surface B in a small subbasin that has been characterized by rapid sedimentation where the Kuche Tow River emerges from the Quilitak mountain front (Figures 12a and 21) Morphology in Kuche Tow: Recent Alluvium Deformed Across an Active Hinge Zone [55] Analysis of remote sensing images shows that in Kuche Tow the main terrace level, labeled T, is uplifted and folded along a line that is in straight continuity with the active axial surface bounding the triangular facets 5 km to the west (Figure 21). The folded terrace deposits are deposited by the Kuche Tow River, which is a small stream that has exploited the structural low created by the Kuche Tow transverse structure to cross the anticlinal high. Terrace T is composed of a few meters thick, dark gray conglomerate unit deposited above abraded yellow gray steeply dipping sandstone beds forming the bulk of the Quilitak 28 of 39


29 Figure 22. Folding of recent alluvium along an active axial surface, West Kuche Tow area. (a) Structural section (see location in Figures 16 and 21). (b) View to west of the 0.85-m-high fold scarp in straight continuity with axial surface at large-scale facet base, which is seen in profile on the horizon. (c) Surveyed field section West Kuche Tow at the location in the foreground of Figure 22b, showing the hinge zone in young alluvial sediments underlying the fold scarp, with progressive folding. southern limb. The folding of terrace T is not only visible in remote sensing (Figure 21a), but is also exposed for detailed examination in several incised valleys: (1) the West Kuche Tow section (Figure 22) near the western limit of the T terrace close to the triangular facets and (2) the Kuche Tow and East Kuche Tow sections (Figures 23, 24, and 25) along the Kuche Tow River (see Figure 21b for locations). Both incised valleys show the progressive folding of young strata which we show to fit the predictions of kink band migration (Figures 26 and 27). [56] In the field photograph of Figure 22b, we see in profile in the background the facet to the north, the erosional surface to the south and the sudden intervening change in bedding dips at the axial surface. In the foreground folding of recent alluvium of the westernmost development of terrace T results in a 0.85-m-high fold scarp. The cross section measured in the streambed below the fold scarp (Figure 22c) further shows that surface folding occurs right at the synclinal hinge where the bedding dip changes from 0 to 60. [57] The morphology in Kuche Tow thus shows that recent Quaternary alluvial sediments are uplifted and folded along an active axial surface or hinge. The fold scarp formed in this way records the most recent uplift of the steeply dipping core of the Quilitak anticline along active axial surface B (Figure 12a). The 0.85-m-high fold scarp in Figure 22c is indeed likely to represent incremental instantaneous folding across an active axial surface because alluvium deposited in front of the axial surface would roll through the hinge during an earthquake rupture on the underlying thrust. Farther east, the fold scarp across the main terrace T is higher (Figure 23) and represents cumulative folding across the active hinge. As active sedimentation occurs south of the fold scarp, the apparent scarp height across T is only produced by folding since river incision and is not the total deformation of the terrace. Just north of the scarp, flat-lying alluvial beds lie unconformably over 55 southward dipping sandstone beds (Figure 23). This pattern of deformation is expected because the alluvium deposited beyond the active axial surface would never be folded and will remain flat-lying [Suppe et al., 1997]. The 29 of 39

30 Figure 23. Large-scale fold scarp east of the Kuche Tow River (location in Figure 21). The underlying structure and stratigraphy show that the folded surface is not a single preexisting terrace; rather the flat alluvium to the south is much younger than the uplifted flat T terrace to the north (see Figure 27c and text). The fold scarp records the total postincision deformation of a previously flat landscape. (a) View to east of postincision fold scarp. (b) Topographic profile across the preincision surface showing that warping occurs over a 100- to 200-m-wide zone. horizontal nature of these beds also indicates that the component of large-scale limb rotation is negligible Quantitative Measurements of Folding Across an Active Hinge Zone [58] In order to better understand the folding processes across active hinges and the interaction between deformation and sedimentation, we logged structural sections across the fold scarp in natural river cuts. We measured three sections (locations in Figure 21). One is located along the Kuche Tow River (Kuche Tow section, Figure 25), the next one is 100 m more to the east (East Kuche Tow section, Figure 24), and third one along a small river channel at the western extremity of terrace T about 3 km west of the Kuche Tow River (West Kuche Tow section, Figure 22b). The cross sections provide a bed-by-bed image of the folding process in the hinge zone. [59] In each river cut we use a combination of laser surveys and digital photographs to map the variation in bedding shape in the hinge zone. Laser surveys allow us to obtain an undistorted view of the growth structure in cross section that was not possible with only outcrop photographs. The intrinsic precision of the instrument we used and the length of the section (<300 m) ensure that instrumental errors are a few tens of centimeters at most. The primary uncertainty comes from identifying the stratal continuity of a bed during laser surveying. To increase our accuracy, we measured bed shapes on both sides of the river channel when possible and created a composite cross section by stacking them. Finally, data are projected into cross sections (Figures 22c, 24b, and 25b) that are perpendicular to the strike of the active hinge. [60] All the sections show a progressive decrease in bedding dip from in the north to flat in the south. Dip changes occur over a distance of about 200 m in the Kuche Tow and East Kuche Tow sections, and over a much shorter distance, 25 m, in the West Kuche Tow section. Therefore the changes in dip do not occur abruptly but are distributed across a hinge or axial surface of finite width along which progressive folding occurs [Suppe et al., 1997]. A distinct synclinal hinge is present in all sections, which marks the beginning of active folding and thus the entrance of strata into the hinge zone. North of the synclinal hinge, beds become progressively more folded northward until a dip that is conformable to the dip of the steep south limb of the Quilitak core is attained. The process is best recorded in the Kuche Tow and East Kuche Tow sections that have the greatest width and vertical depth of exposure. We will thus mostly focus on those areas. [61] In the Kuche Tow (Figure 25) and East Kuche Tow (Figure 24) sections, a key horizon is the dark gray fanglomerate of the uplifted T horizon and the underlying erosional surface. North of its anticlinal hinge the T horizon has a flat dip and unconformably overlies 56 dipping yellow gray sandstone beds similar to the present Tarim sediments (Figures 24 and 25). South of the anticlinal hinge the T horizon has a 30 dip, with overlying alluvial beds having slightly gentler dips and underlying sandstone beds slightly steeper dips. Furthermore, above the 30 dipping T horizon changes in bedding dip appears to be quite gradual, whereas below the T horizon changes in bedding dip are more abrupt with distinct angular disconformities or unconformities. The latter attest to frequent episodes of nondeposition or minor erosion north of the hinge zone 30 of 39
 View of progressive changes in bedding dip below folded preincision surface. Note that this preincision surface is not a single terrace.")
 Section measured with a laser. (c) View of sharp disconformities occurring below terrace T level. prior to the deposition of the T horizon.")
31 Figure 24. Main East Kuche Tow River section through the folded preincision surface (see location in Figure 21), approximately 100 m east of Kuche Tow River and section in Figure 25. (a) View of progressive changes in bedding dip below folded preincision surface. Note that this preincision surface is not a single terrace. The uplifted T terrace level corresponds to an intermediate level within the stratigraphic section approximately 50 m below the level of the incised terrace south of the fold scarp. (b) Section measured with a laser. (c) View of sharp disconformities occurring below terrace T level. prior to the deposition of the T horizon. In contrast the gradual decrease in dips without distinct angular disconformities or unconformities attests to a slightly higher sedimentation rate during folding after the deposition of the T horizon. The bedding pattern in the Kuche Tow wide hinge zone thus suggests fine interaction between tectonics and erosion/sedimentation in shaping bed geometry within active hinge zones, which we explore in more detail below Kinematics of Folding Processes Across a Wide Active Hinge Zone [62] To understand in a more quantitative way the observed bedding geometry in the hinge zone, we model the folding processes involved and their interaction with sedimentation using hinge zone migration theory [Suppe et al., 1997]. Large-scale fault bend fold models such as in Figure 14 cannot account for the progressive changes in dip observed in the hinge zone area over distances of up to hundreds of meters. Such models have sharp hinges of zero width. Sharp hinge fault bend fold models were built to approximate the behavior of large-scale structures where hinges are narrow relative to limb width and limb dips are relatively constant over large regions. To account for folding processes at the bed-by-bed scale, Suppe et al. [1997] simply proposed to expand the sharp axial surface line used in fault bend folding to be of finite width, bounded by entry and exit axial surfaces (Figure 26a). Within the wide axial surface zone, the bedding dips would change gradually in a rounded hinge zone of given width, and the local kinematics would be similar to curved similar folding. [63] The kinematics of this balanced forward model of growth folding is illustrated in Figure 26. We use a steady 31 of 39
 Views of progressive changes in bedding dip below folded preincision surface. Note that this preincision surface is not a single terrace.")
32 Figure 25. Kuche Tow River section through the folded preincision surface (see location in Figure 19), approximately 100 m west of the section in Figure 24. (a) Views of progressive changes in bedding dip below folded preincision surface. Note that this preincision surface is not a single terrace. The uplifted T terrace level corresponds to an intermediate level within the stratigraphic section approximately 50 m below the level of the incised terrace south of the fold scarp. (b) Section surveyed with a laser. sedimentation rate relative to deformation to get an initial picture of the behavior. This model has a substantially higher ratio of sedimentation to deformation than the folds in Kuche, which allows us to illustrate more clearly the progressive folding that takes place as beds traverse the hinge zone. In this wide curved hinge model, as in sharp hinge models, sediments that are deposited in front of the active hinge (i.e., particles 1 to 6 in Figure 26) will move through it and be folded to a dip equal to the pregrowth fold limb dip once they exit the hinge zone. As hinge zones can be m wide, which is an order of magnitude greater than characteristic 1 10 m slip in a single large earthquake, sediments will pass progressively through the active hinge zone and will be gradually folded (like particles 1 to 6 in Figure 26b which are deposited in front of the hinge zone). Sediments will be fully folded only once they have crossed the whole hinge zone (like particles 1 to 6 Figure 26c), which may take 10,000 to 100,000 years (see particle 5 in Figure 26d). Finally, sediments deposited beyond the hinge zone (like particles 8 to 9 in Figure 26) will not be folded, and sediments deposited over the hinge zone (like particle 7 in Figure 26) will be only partly folded. [64] This active curved hinge kink band migration model yields progressive changes in dip across the fold scarp as observed in the field, and also a gentle fold scarp surface slope if ongoing sedimentation occurs. Indeed when an earthquake rupture occurs on the deep thrust related to the hinge zone, the sediments deposited above the hinge zone, or just in front of it, will be instantaneously folded to a gentle dip that is a function of how much of the hinge zone they have traversed. As deformation accumulates, as a result of more earthquakes, the sediments move farther through the hinge zone and become progressively more folded. Nevertheless, if new sediments are deposited on and in front of the hinge zone, very gentle bedding dips next to the entry axial surface are produced similar to what we observe in Kuche Tow (Figures 22b and 23) Modeling Data From Active Wide Hinge Zones [65] We use the balanced wide hinge kink band migration model described in section 5.3 to quantitatively analyze sections logged in the Kuche Tow area. For that purpose, a composite section was first built by stacking together bedding data from the nearby sections at Kuche Tow (Figure 25b) and East Kuche Tow (Figure 24b), which are separated by 100 m. This gives us a greater vertical extent to the section (40 m). Then we fit the wide hinge model to the composite section. The West Kuche Tow section (Figure 22b) is less suitable because of its limited vertical extent (7 m). [66] To get the appropriate hinge zone model for the Kuche Tow fold, we build a dimensionless forward model of growth folding with a total change in bedding dip across the hinge zone that matches the observed change in dip of 56. We choose an arbitrary simple curved hinge zone geometry, which is the geometry that would exist in pregrowth, fully folded strata. Our choice is similar to common upper crustal hinge zone geometries [cf. Suppe et al., 1997]. This hinge zone geometry represents the trajectories of all particles through the fold in self-similar kink band migration (Figure 27a). On the basis of these trajectories we compute, using folding vectors, the unique sequence of dimensionless fold shapes that all layers undergo for incrementally increasing displacements through the hinge zone. We start the computation by placing an undeformed flat horizon across the hinge zone and then track the motion of the particles that compose that horizon as they move progressively along the trajectories. By this process, we obtain Figure 27a, which 32 of 39
surface uplift of fault-related folds rely primarily on their limbs and associated
 Finite and Quaternary shortening calculation Finite shortening Models commonly used to constrain the structural evolution, shortening, and surface uplift of fault-related folds rely primarily on their
Determination of uplift rates of fluvial terraces across the Siwaliks Hills, Himalayas of central Nepal
 Determination of uplift rates of fluvial terraces across the Siwaliks Hills, Himalayas of central Nepal Martina Böhme Institute of Geology, University of Mining and Technology, Freiberg, Germany Abstract.
Modeling the shortening history of a fault tip fold using structural and geomorphic records of deformation
 Click Here for Full Article JOURNAL OF GEOPHYSICAL RESEARCH, VOL. 112,, doi:10.1029/2006jb004460, 2007 Modeling the shortening history of a fault tip fold using structural and geomorphic records of deformation
Continental Landscapes
 Continental Landscapes Landscape influenced by tectonics, climate & differential weathering Most landforms developed within the last 2 million years System moves toward an equilibrium Continental Landscapes
STRUCTURE AND HOLOCENE SLIP OF THE JID FAULT, MONGOLIA ALTAI
 STRUCTURE AND HOLOCENE SLIP OF THE JID FAULT, MONGOLIA ALTAI LAURA K.O. SMITH AND SARAHTSETSEG PUREDORG Princeton University, Mongolian University of Science and Technology Sponsors: Ramon Gonzalez-Mieres
Short note: A velocity description of shear fault-bend folding
 Journal of Structural Geology 28 (2006) 536 543 www.elsevier.com/locate/jsg Short note: A velocity description of shear fault-bend folding Stuart Hardy a, *, Christopher D. Connors b a ICREA (Institució
Supplementary Material
 GSA Data Repository item 2018118 Brardinoni, F., Picotti, V., Maraio, S., Paolo Bruno, P., Cucato, M., Morelli, C., and Mair, V., 2018, Postglacial evolution of a formerly glaciated valley: Reconstructing
A. Refer to Appendix F in back of lab manual for list of commonly used geologic map symbols
 Structural Geology Lab 2: Outcrop Patterns and Structure Contours I. Geologic Map Symbols A. Refer to Appendix F in back of lab manual for list of commonly used geologic map symbols 1. Emphasis: a. strike
Name. GEOL.5220 Structural Geology Faults, Folds, Outcrop Patterns and Geologic Maps. I. Properties of Earth Materials
 I. Properties of Earth Materials GEOL.5220 Structural Geology Faults, Folds, Outcrop Patterns and Geologic Maps Name When rocks are subjected to differential stress the resulting build-up in strain can
Answers: Internal Processes and Structures (Isostasy)
") Answers: Internal Processes and Structures (Isostasy) 1. Analyse the adjustment of the crust to changes in loads associated with volcanism, mountain building, erosion, and glaciation by using the concept
Answers: Internal Processes and Structures (Isostasy) 1. Analyse the adjustment of the crust to changes in loads associated with volcanism, mountain building, erosion, and glaciation by using the concept
Lecture 6 Folds, Faults and Deformation Dr. Shwan Omar
 Fold: A fold is a bend or wrinkle of rock layers or foliation; folds form as a sequence of ductile deformation. Folding is the processes by which crustal forces deform an area of crust so that layers of
Edinburgh Research Explorer
 Edinburgh Research Explorer GEOMORPHOLOGY Rivers split as mountains grow Citation for published version: Attal, M 2009, 'GEOMORPHOLOGY Rivers split as mountains grow' Nature Geoscience, vol. 2, no. 11,
Dip-Sequence Analysis
 Chapter 9 Dip-Sequence Analysis 9.1 Introduction The three-dimensional geometry of a structure can be determined from the bedding attitudes measured in a single well bore or on a traverse through a structure.
Strike-Slip Faults. ! Fault motion is parallel to the strike of the fault.
 Strike-Slip Faults! Fault motion is parallel to the strike of the fault.! Usually vertical, no hanging-wall/footwall blocks.! Classified by the relative sense of motion. " Right lateral opposite block
Active Tectonics. Earthquakes, Uplift, and Landscape. Edward A. Keller University of California, Santa Barbara
 Prentice Hall Earth Science Series SUB Gottingen 214 80416X, im ^, 2002 A 7883 lllllllilwii Active Tectonics Earthquakes, Uplift, and Landscape Second Edition V Edward A. Keller University of California,
APPENDIX C GEOLOGICAL CHANCE OF SUCCESS RYDER SCOTT COMPANY PETROLEUM CONSULTANTS
 APPENDIX C GEOLOGICAL CHANCE OF SUCCESS Page 2 The Geological Chance of Success is intended to evaluate the probability that a functioning petroleum system is in place for each prospective reservoir. The
Geologic Structures. Changes in the shape and/or orientation of rocks in response to applied stress
 Geologic Structures Changes in the shape and/or orientation of rocks in response to applied stress Figure 15.19 Can be as big as a breadbox Or much bigger than a breadbox Three basic types Fractures >>>
Modeling the shortening history of a fault-tip fold using structural and geomorphic records of deformation
 Modeling the shortening history of a fault-tip fold using structural and geomorphic records of deformation Mathieu DAËRON daeron@gps.caltech.edu Division of Geological and Planetary Sciences, California
Tectonics is a study of the major structural features of the Earth s crust or a broad structure of a region. Tecto- means building
 TECTONICS AND TECTONIC STRUCTURES Tectonics is a study of the major structural features of the Earth s crust or a broad structure of a region. Tecto- means building The plate theory Different stages are
GLY 155 Introduction to Physical Geology, W. Altermann. Press & Siever, compressive forces. Compressive forces cause folding and faulting.
 Press & Siever, 1995 compressive forces Compressive forces cause folding and faulting. faults 1 Uplift is followed by erosion, which creates new horizontal surface. lava flows Volcanic eruptions cover
Structural Geology of the Mountains
 Structural Geology of the Mountains Clinton R. Tippett Shell Canada Limited, Calgary, Alberta clinton.tippett@shell.ca INTRODUCTION The Southern Rocky Mountains of Canada (Figure 1) are made up of several
In this lab, we will study and analyze geologic maps from a few regions, including the Grand Canyon, western Wyoming, and coastal California.
 Name: Lab Section: work in groups, but each person turns in his/her own GEOSCIENCE 001 LAB UNDERSTANDING GEOLOGIC MAPS Geologic maps are colorful and even beautiful, but they also contain an amazing amount
Neotectonic Implications between Kaotai and Peinanshan
 Neotectonic Implications between Kaotai and Peinanshan Abstract Longitudinal Valley was the suture zone between the Philippine Sea plate and the Eurasia plate. Peinanshan was the southest segment of the
UNDERSTANDING GEOLOGIC M APS
 Name: Lab Section: work in groups, but each person turns in his/her own GEOSCIENCE 001 L AB UNDERSTANDING GEOLOGIC M APS Geologic maps are colorful and even beautiful, but they also contain an amazing
Using structural validation and balancing tools to aid interpretation
 Using structural validation and balancing tools to aid interpretation Creating a balanced interpretation is the first step in reducing the uncertainty in your geological model. Balancing is based on the
Structural Style in the Peel Region, NWT and Yukon
 Structural Style in the Peel Region, NWT and Yukon Adriana Taborda* Husky Energy and University of Calgary, Calgary, AB Adriana.Taborda@huskyenergy.ca and Deborah Spratt University of Calgary, Calgary,
Constrained Fault Construction
 Constrained Fault Construction Providing realistic interpretations of faults is critical in hydrocarbon and mineral exploration. Faults can act as conduits or barriers to subsurface fluid migration and
Faults, folds and mountain building
 Faults, folds and mountain building Mountain belts Deformation Orogens (Oro = Greek all changes for mountain, in size, shape, genesis orientation, = Greek for or formation) position of a rock mass Structural
Surface changes caused by erosion and sedimentation were treated by solving: (2)
") GSA DATA REPOSITORY 214279 GUY SIMPSON Model with dynamic faulting and surface processes The model used for the simulations reported in Figures 1-3 of the main text is based on two dimensional (plane strain)
GSA DATA REPOSITORY 214279 GUY SIMPSON Model with dynamic faulting and surface processes The model used for the simulations reported in Figures 1-3 of the main text is based on two dimensional (plane strain)
Chapter 15 Structures
 Chapter 15 Structures Plummer/McGeary/Carlson (c) The McGraw-Hill Companies, Inc. TECTONIC FORCES AT WORK Stress & Strain Stress Strain Compressive stress Shortening strain Tensional stress stretching
Lecture 9 faults, folds and mountain building
 Lecture 9 faults, folds and mountain building Rock deformation Deformation = all changes in size, shape, orientation, or position of a rock mass Structural geology is the study of rock deformation Deformation
depression above scarp scarp
 1 LAB 1: FIELD TRIP TO McKINLEYVILLE AND MOUTH OF THE MAD RIVER OBJECTIVES: a. to look at geomorphic and geologic evidence for large scale thrust-faulting of young sediments in the Humboldt Bay region
GEOLOGIC MAPS PART II
 EARTH AND ENVIRONMENT THROUGH TIME LABORATORY - EES 1005 LABORATORY FIVE GEOLOGIC MAPS PART II Introduction Geologic maps of orogenic belts are much more complex than maps of the stable interior. Just
Plate Tectonics. entirely rock both and rock
 Plate Tectonics I. Tectonics A. Tectonic Forces are forces generated from within Earth causing rock to become. B. 1. The study of the origin and arrangement of Earth surface including mountain belts, continents,
Course Title: Discipline: Geology Level: Basic-Intermediate Duration: 5 Days Instructor: Prof. Charles Kluth. About the course: Audience: Agenda:
 Course Title: Structural Geology Discipline: Geology Level: Basic-Intermediate Duration: 5 Days Instructor: Prof. Charles Kluth About the course: This course covers the basic ideas of structural geometry
Earth Science, (Tarbuck/Lutgens) Chapter 10: Mountain Building
 Chapter 10: Mountain Building") Earth Science, (Tarbuck/Lutgens) Chapter 10: Mountain Building 1) A(n) fault has little or no vertical movements of the two blocks. A) stick slip B) oblique slip C) strike slip D) dip slip 2) In a(n) fault,
Earth Science, (Tarbuck/Lutgens) Chapter 10: Mountain Building 1) A(n) fault has little or no vertical movements of the two blocks. A) stick slip B) oblique slip C) strike slip D) dip slip 2) In a(n) fault,
Seismic Reflection Imaging across the Johnson Ranch, Valley County, Idaho
 Seismic Reflection Imaging across the Johnson Ranch, Valley County, Idaho Report Prepared for the Skyline Corporation Lee M. Liberty Center for Geophysical Investigation of the Shallow Subsurface (CGISS)
Seismic stratigraphy, some examples from Indian Ocean, interpretation of reflection data in interactive mode
 Seismic stratigraphy, some examples from Indian Ocean, interpretation of reflection data in interactive mode K. S. Krishna National Institute of Oceanography, Dona Paula, Goa-403 004. krishna@nio.org Seismic
Lab 6: Plate tectonics, structural geology and geologic maps
 Geology 103 Name(s): Lab 6: Plate tectonics, structural geology and geologic maps Objective: To show the effects of plate tectonics on a large-scale set of rocks and to reconstruct the geological history
Lecture # 6. Geological Structures
 1 Lecture # 6 Geological Structures ( Folds, Faults and Joints) Instructor: Dr. Attaullah Shah Department of Civil Engineering Swedish College of Engineering and Technology-Wah Cantt. 2 The wavy undulations
Kinematic structural forward modeling for fault trajectory prediction in seismic interpretation
 Fault prediction by forward modeling Kinematic structural forward modeling for fault trajectory prediction in seismic interpretation Mohammed Alarfaj and Don C. Lawton ABSTRACT The unique relationship
Folds and Folding. Processes in Structural Geology & Tectonics. Ben van der Pluijm. WW Norton+Authors, unless noted otherwise 3/4/ :15
 Folds and Folding Processes in Structural Geology & Tectonics Ben van der Pluijm WW Norton+Authors, unless noted otherwise 3/4/2017 17:15 We Discuss Folds and Folding Fold Description Fold Classification
Abstract. Introduction. Regional Setting. GCSSEPM to be published December 2003
 Shelf Margin Deltas and Associated Deepwater Deposits: Implications on Reservoir Distribution and Hydrocarbon Entrapment, Block VI-1, Ulleung Basin, East Sea, South Korea Sneider, John S. Sneider Exploration,
GEOL 02: Historical Geology Lab 14: Topographic Maps. Name: Date:
 GEOL 02: Historical Geology Lab 14: Topographic Maps Name: Date: A topographic map is a two dimensional (flat) representation (model) of a three dimensional land surface (landscape). It shows landforms
Rogun Hydropower Project
 Rogun Hydropower Project Dam site Geological investigations in the Downstream Right Bank Ascencio Lara Coyne et Bellier Almaty, 11-12 February 2013 Objectives of the presentation As the stability conditions
Stress and Strain. Stress is a force per unit area. Strain is a change in size or shape in response to stress
 Geologic Structures Geologic structures are dynamically-produced patterns or arrangements of rock or sediment that result from, and give information about, forces within the Earth Produced as rocks change
Structural Geology Lab. The Objectives are to gain experience
 Geology 2 Structural Geology Lab The Objectives are to gain experience 1. Drawing cross sections from information given on geologic maps. 2. Recognizing folds and naming their parts on stereoscopic air
FOLDS AND THRUST SYSTEMS IN MASS TRANSPORT DEPOSITS
 FOLDS AND THRUST SYSTEMS IN MASS TRANSPORT DEPOSITS G.I Aslop, S. Marco, T. Levi, R. Weinberger Presentation by Aaron Leonard INTRODUCTION Examine fold and thrust geometries associated with downslope movement
Crags, Cracks, and Crumples: Crustal Deformation and Mountain Building
 Crags, Cracks, and Crumples: Crustal Deformation and Mountain Building Updated by: Rick Oches, Professor of Geology & Environmental Sciences Bentley University Waltham, Massachusetts Based on slides prepared
Uplift of the Longmen Shan and Tibetan plateau, and the 2008 Wenchuan (M=7.9) earthquake
 earthquake") Uplift of the Longmen Shan and Tibetan plateau, and the 2008 Wenchuan (M=7.9) earthquake Judith Hubbard 1,* & John H. Shaw 1 1 Department of Earth and Planetary Sciences, Harvard University, 20 Oxford
Uplift of the Longmen Shan and Tibetan plateau, and the 2008 Wenchuan (M=7.9) earthquake Judith Hubbard 1,* & John H. Shaw 1 1 Department of Earth and Planetary Sciences, Harvard University, 20 Oxford
Topographic metrics and bedrock channels Outline of this lecture
 Topographic metrics and bedrock channels Outline of this lecture Topographic metrics Fluvial scaling and slope-area relationships Channel steepness sensitivity to rock uplift Advancing understanding of
SSSS Unome Geologic Mapping Answer Key p1
 Scioly Summer Study Session 2018-2019 Geologic Mapping Answer Key Written by Unome Instructions Because this test is written for SSSS, the answer key includes explanations for most questions. It is also
Geomorphology Final Exam Study Guide
 Geomorphology Final Exam Study Guide Geologic Structures STRUCTURAL GEOLOGY concerned with shapes, arrangement, interrelationships of bedrock units & endogenic (within) forces that cause them. Tectonic
Description of faults
 GLG310 Structural Geology Description of faults Horizontal stretch Crustal thickness Regional elevation Regional character Issues Normal Thrust/reverse Strike-slip >1 1 in one direction and < 1 in
1. What define planetary surfaces geologically? 2. What controls the evolution of planetary surfaces?
 Planetary Surfaces: 1. What define planetary surfaces geologically? 2. What controls the evolution of planetary surfaces? 3. How do surface-shaping processes scale across planetary bodies of different
NAME HOMEWORK ASSIGNMENT #3 MATERIAL COVERS CHAPTERS 8, 9, 10, 11
 NAME HOMEWORK ASSIGNMENT #3 MATERIAL OVERS HAPTERS 8, 9, 10, 11 Assignment is due the beginning of the class period on November 23, 2004. Answers for each chapter will be discussed in class, as Exam #3
Section 7. Reading the Geologic History of Your Community. What Do You See? Think About It. Investigate. Learning Outcomes
 Chapter 3 Minerals, Rocks, and Structures Section 7 Reading the Geologic History of Your Community What Do You See? Learning Outcomes In this section, you will Goals Text Learning Outcomes In this section,
EPS 50 Lab 6: Maps Topography, geologic structures and relative age determinations
 Name: EPS 50 Lab 6: Maps Topography, geologic structures and relative age determinations Introduction: Maps are some of the most interesting and informative printed documents available. We are familiar
Crustal Deformation. (Building Earth s Surface, Part 1) Science 330 Summer Mapping geologic structures
 Science 330 Summer Mapping geologic structures") Crustal Deformation (Building Earth s Surface, Part 1) Science 330 Summer 2005 Mapping geologic structures When conducting a study of a region, a geologist identifies and describes the dominant rock structures
Crustal Deformation (Building Earth s Surface, Part 1) Science 330 Summer 2005 Mapping geologic structures When conducting a study of a region, a geologist identifies and describes the dominant rock structures
ALONG STRIKE VARIATION AND THE ROLE OF FAULT PROPAGATION FOLDING IN GENERATION OF STRUCTURAL RELIEF IN THE KOCHKOR VALLEY, TIEN SHAN, KYRGYZSTAN
 ALONG STRIKE VARIATION AND THE ROLE OF FAULT PROPAGATION FOLDING IN GENERATION OF STRUCTURAL RELIEF IN THE KOCHKOR VALLEY, TIEN SHAN, KYRGYZSTAN by KATHRYN TERESA PAULSON A THESIS Presented to the Department
!'f \, w. Alan Stewart Colorado Exploration Company, Golden STRUCTURE OF THE FOOTHILLS AREA WEST OF DENVER, COLORADO. Introduction
 STRUCTURE OF THE FOOTHLLS AREA WEST OF DENVER, COLORADO w. Alan Stewart Colorado Exploration Company, Golden ntroduction i ; The dominant structural features west of Denver and along the mountain front
Distortion Effects of Faults on Gravity Worm Strings Robin O Leary
 Distortion Effects of Faults on Gravity Worm Strings Robin O Leary Problem Can upward continued gravity anomaly worm strings be used as a tool to determine the dip direction of an offsetting structure
Seismic Expressions of Submarine Channel - Levee Systems and Their Architectural Elements
 Seismic Expressions of Submarine Channel - Levee Systems and Their Architectural Elements Summary D.V. Ramana, Santanu De* and Kalyanbrata Datta KDMIPE, ONGC, Dehradun E-mail- devvenram@rediffmail.com
Deepwater Niger Delta fold-and-thrust belt modeled as a critical-taper wedge: The influence of a weak detachment on styles of fault-related folds
 Deepwater Niger Delta fold-and-thrust belt modeled as a critical-taper wedge: The influence of a weak detachment on styles of fault-related folds Frank Bilotti 1, Chris Guzofski 1, John H. Shaw 2 1 Chevron
Staple this part to part one of lab 6 and turn in. Lab 6, part two: Structural geology (analysis)
") Geology 101 Staple this part to part one of lab 6 and turn in Lab 6, part two: Structural geology (analysis) Recall that the objective of this lab is to describe the geologic structures of Cougar Mountain
Geology 101 Staple this part to part one of lab 6 and turn in Lab 6, part two: Structural geology (analysis) Recall that the objective of this lab is to describe the geologic structures of Cougar Mountain
mountain rivers fixed channel boundaries (bedrock banks and bed) high transport capacity low storage input output
 high transport capacity low storage input output") mountain rivers fixed channel boundaries (bedrock banks and bed) high transport capacity low storage input output strong interaction between streams & hillslopes Sediment Budgets for Mountain Rivers Little
mountain rivers fixed channel boundaries (bedrock banks and bed) high transport capacity low storage input output strong interaction between streams & hillslopes Sediment Budgets for Mountain Rivers Little
Interactions of growing folds and coeval depositional systems
 Basin Research (1996) 8, 199 223 Interactions of growing folds and coeval depositional systems Douglas Burbank, Andrew Meigs and Nicholas Brozović Department of Earth Sciences, University of Southern California,
Ge Problem Set 1
 Ge 101 2012 Problem Set 1 This problem set covers basic techniques in structural geology, geomorphology and the construction of cross sections. Questions 2 and 3 are simple exercises; 1 and 4 are reallife
CRUSTAL DEFORMATION. Chapter 10
 CRUSTAL DEFORMATION and dgeologic Structures t Chapter 10 Deformation Df Deformation involves: Stress the amount of force applied to a given area. Types of Stress: Confining Stress stress applied equally
Stratigraphic modelling using CHILD
 5 Stratigraphic modelling using CHILD 5.1 Triangular irregular network Surface process models are widely used in geomorphology and geology, and the developments in the field follow each other rapidly.
What Causes Rock to Deform?
 Crustal Deformation Earth, Chapter 10 Chapter 10 Crustal Deformation What Causes Rock to Deform? Deformation is a general term that refers to all changes in the shape or position of a rock body in response
Copyright McGraw-Hill Education. All rights reserved. No reproduction or distribution without the prior written consent of McGraw-Hill Education
 Copyright McGraw-Hill Education. All rights reserved. No reproduction or distribution without the prior written consent of McGraw-Hill Education Tibetan Plateau and Himalaya -southern Asia 11.00.a VE 10X
 Sedimentary Basin Analysis http://eqsun.geo.arizona.edu/geo5xx/geos517/ Sedimentary basins can be classified based on the type of plate motions (divergent, convergent), type of the lithosphere, distance
Landforms and Rock Structure
 Landforms and Rock Structure Rock Structure as a Landform Control Landforms of Horizontal Strata and Coastal Plains Landforms of Warped Rock Layers Landforms Developed on Other Land-Mass Types Landforms
Pleistocene alteration of drainage network and diverse surface morphology forced by basement structure in the foreland of the Eastern Alps
 This study was carried out in the framework of a project sponsored by the Hungarian National Science Foundation (OTKA NK83400) and TÁMOP-4.2.2/B-10/1-2010-0030 Pleistocene alteration of drainage network
Geohistory Review. Things you need to know:
 Geohistory Review Things you need to know: a) The earth and the solar system are 4.5 billion years old (4.5 X 10 9 ) b) Law of original horizontality: Sedimentary rock layers are always deposited as horizontal
29. IMPLICATIONS OF DEEP SEA DRILLING, SITES 186 AND 187 ON ISLAND ARC STRUCTURE
 29. IMPLICATIONS OF DEEP SEA DRILLING, SITES 186 AND 187 ON ISLAND ARC STRUCTURE John A. Grow 1, Marine Physical Laboratory, Scripps Institution of Oceanography, La Jolla, California INTRODUCTION Pacific
A CROSS-SECTION the internal shape of folds. This is what you would see in a roadcut or a canyon wall. It is a view from the side.
 FOLDS Basic Fold Geometry A CROSS-SECTION the internal shape of folds. This is what you would see in a roadcut or a canyon wall. It is a view from the side. Closer to Earth s surface Deeper in Earth HINGE
Structural Geology and Geology Maps Lab
 Structural Geology and Geology Maps Lab Mesa College Geology 101 Lab Ray Rector: Instructor Structural Geology Lab Pre-Lab Resources Pre-Lab Internet Links 1) Fundamentals of Structural Geology 2) Visualizing
Lab 7: STRUCTURAL GEOLOGY FOLDS AND FAULTS
 Lab 7: STRUCTURAL GEOLOGY FOLDS AND FAULTS This set of labs will focus on the structures that result from deformation in earth s crust, namely folds and faults. By the end of these labs you should be able
Zeumann and Hampel, 2017, Impact of Cocos Ridge (Central America) subduction on the forearc drainage system: Geology, doi: /g
 subduction on the forearc drainage system: Geology, doi: /g") GSA Data Repository 2017296 Zeumann and Hampel, 2017, Impact of Cocos Ridge (Central America) subduction on the forearc drainage system: Geology, doi:10.1130/g39251.1. DESCRIPTION OF CASQUS To implement
GSA Data Repository 2017296 Zeumann and Hampel, 2017, Impact of Cocos Ridge (Central America) subduction on the forearc drainage system: Geology, doi:10.1130/g39251.1. DESCRIPTION OF CASQUS To implement
Search and Discovery Article #40536 (2010) Posted June 21, 2010
 Posted June 21, 2010") Modern Examples of Mass Transport Complexes, Debrite and Turbidite Associations: Geometry, Stratigraphic Relationships and Implications for Hydrocarbon Trap Development* Fabiano Gamberi 1, Marzia Rovere
Modern Examples of Mass Transport Complexes, Debrite and Turbidite Associations: Geometry, Stratigraphic Relationships and Implications for Hydrocarbon Trap Development* Fabiano Gamberi 1, Marzia Rovere
Kinematic analysis of the Pakuashan fault tip fold, west central Taiwan: Shortening rate and age of folding inception
 Click Here for Full Article JOURNAL OF GEOPHYSICAL RESEARCH, VOL. 112,, doi:10.1029/2005jb004198, 2007 Kinematic analysis of the Pakuashan fault tip fold, west central Taiwan: Shortening rate and age of
Structural Geology Lab. The Objectives are to gain experience
 Geology 2 Structural Geology Lab The Objectives are to gain experience 1. Drawing cross sections from information given on geologic maps. 2. Recognizing folds and naming their parts on stereoscopic air
Learning Objectives (LO) What we ll learn today:!
 What we ll learn today:!") Learning Objectives (LO) Lecture 13: Mountain Building Read: Chapter 10 Homework #11 due Tuesday 12pm What we ll learn today:! 1. Define the types of stress that are present in the crust! 2. Define the
Learning Objectives (LO) Lecture 13: Mountain Building Read: Chapter 10 Homework #11 due Tuesday 12pm What we ll learn today:! 1. Define the types of stress that are present in the crust! 2. Define the
Description of faults
 GLG310 Structural Geology Description of faults Horizontal stretch Crustal thickness Regional elevation Regional character Issues Normal Thrust/reverse Strike-slip >1 1 in one direction and < 1 in
Landforms. Why does the land look like it does? 1. Controlled by water 2. Controlled by the rocks
 Landforms Why does the land look like it does? 1. Controlled by water 2. Controlled by the rocks Landforms Made by Running Water Stream erosion The evolution of a river system Entrenched meanders Fluvial
Vail et al., 1977b. AAPG 1977 reprinted with permission of the AAPG whose permission is required for further use.
 Well 5 Well 4 Well 3 Well 2 Well 1 Vail et al., 1977b AAPG 1977 reprinted with permission of the AAPG whose permission is required for further use. Well 5 Well 4 Well 3 Well 2 Well 1 Vail et al., 1977b
Crustal Deformation Earth - Chapter Pearson Education, Inc.
 Crustal Deformation Earth - Chapter 10 Structural Geology Structural geologists study the architecture and processes responsible for deformation of Earth s crust. A working knowledge of rock structures
Part I. PRELAB SECTION To be completed before labs starts:
 Student Name: Physical Geology 101 Laboratory #13 Structural Geology II Drawing and Analyzing Folds and Faults Grade: Introduction & Purpose: Structural geology is the study of how geologic rock units
Continuity and Compartmentalization of Viking Formation gas production from the Ricinus / Bearberry area of the Rocky Mountain Triangle Zone
 Page No. 001-1 Continuity and Compartmentalization of Formation gas production from the Ricinus / Bearberry area of the Rocky Mountain Triangle Zone David Halwas* (Senior Staff Geologist), Darryl Parry
How mountains are made. We will talk about valleys (erosion and weathering later)
") How mountains are made We will talk about valleys (erosion and weathering later) http://www.ilike2learn.com/ilike2learn/mountainmaps/mountainranges.html Continent-continent plate convergence Less dense,
How mountains are made We will talk about valleys (erosion and weathering later) http://www.ilike2learn.com/ilike2learn/mountainmaps/mountainranges.html Continent-continent plate convergence Less dense,
Journal of Earth Sciences and Geotechnical Engineering, vol. 4, no. 1, 2014, ISSN: (print), (online) Scienpress Ltd, 2014
, (online) Scienpress Ltd, 2014") Journal of Earth Sciences and Geotechnical Engineering, vol. 4, no. 1, 2014, 17-24 ISSN: 1792-9040 (print), 1792-9660 (online) Scienpress Ltd, 2014 Reconstruction of Relative Tectonic Movements Using Transgressive
Journal of Earth Sciences and Geotechnical Engineering, vol. 4, no. 1, 2014, 17-24 ISSN: 1792-9040 (print), 1792-9660 (online) Scienpress Ltd, 2014 Reconstruction of Relative Tectonic Movements Using Transgressive
Down-stream process transition (f (q s ) = 1)
 = 1)") Down-stream process transition (f (q s ) = 1) Detachment Limited S d >> S t Transport Limited Channel Gradient (m/m) 10-1 Stochastic Variation { Detachment Limited Equilibrium Slope S d = k sd A -θ d S
Down-stream process transition (f (q s ) = 1) Detachment Limited S d >> S t Transport Limited Channel Gradient (m/m) 10-1 Stochastic Variation { Detachment Limited Equilibrium Slope S d = k sd A -θ d S
Coseismic fold scarps and their kinematic behavior in the 1999 Chi-Chi earthquake Taiwan
 Click Here for Full Article JOURNAL OF GEOPHYSICAL RESEARCH, VOL. 11, B03S0, doi:10.109/006jb004388, 007 Coseismic fold scarps and their kinematic behavior in the 1999 Chi-Chi earthquake Taiwan Yue-Gau
11.1 Rock Deformation
 Tarbuck Lutgens Mountain Building 11.1 Rock Deformation Factors Affecting Deformation Factors that influence the strength of a rock and how it will deform include temperature, confining pressure, rock
Serial Cross-Section Trishear Modeling: Reconstructing 3-D Kinematic Evolution of the Perdido Fold Belt*
 Serial Cross-Section Trishear Modeling: Reconstructing 3-D Kinematic Evolution of the Perdido Fold Belt* Dian He 1 and John Paul Brandenburg 2 Search and Discovery Article #30313 (2014)** Posted January
Velocity eld for the trishear model
 Journal of Structural Geology (000) 1009±1014 www.elsevier.nl/locate/jstrugeo Velocity eld for the trishear model Alan T. Zehnder a, *, Richard W. Allmendinger b a Department of Theoretical and Applied
EDIMENTARY BASINS. What is a Sedimentary Basin? by Prof. Dr. Abbas Mansour
 EDIMENTARY BASINS What is a Sedimentary Basin? by Prof. Dr. Abbas Mansour WHAT IS A SEDIMENTARY BASIN? A low area on the Earth s surface relative to surroundings e.g. deep ocean basin (5-10 km deep) e.g.
Lecture 9. Folds and Folding. Earth Structure (2 nd Edition), 2004 W.W. Norton & Co, New York Slide show by Ben van der Pluijm
, 2004 W.W. Norton & Co, New York Slide show by Ben van der Pluijm") Lecture 9 Folds and Folding Earth Structure (2 nd Edition), 2004 W.W. Norton & Co, New York Slide show by Ben van der Pluijm WW Norton; unless noted otherwise Fold Classification Maryland Appalachians
Lecture 9 Folds and Folding Earth Structure (2 nd Edition), 2004 W.W. Norton & Co, New York Slide show by Ben van der Pluijm WW Norton; unless noted otherwise Fold Classification Maryland Appalachians