Sand Distribution and Statistical Spatial Characteristics on Pacific Reef Platforms
|
|
|
- Dominic Norman
- 5 years ago
- Views:
Transcription
1 Sand Distribution and Statistical Spatial Characteristics on Pacific Reef Platforms Charles H. Fletcher Geology and Geophysics, School of Ocean and Earth Science and Technology, University of Hawaii, 1680 East-West Road, Honolulu, Hawaii, 96822, USA phone: (808) fax: (808) Award Number: N LONG-TERM GOALS Our long-term goal was to improve understanding of sand distribution, temporal variability, and response to geologic substrate factors on Hawaiian reef platforms within the depth zone from 20 m to the shoreline. OBJECTIVES We analyzed patterns of sand deposit distribution on the reef platform, and documented relationships between sand deposits and reef morphology. Sand deposit patterns, the surrounding morphology, and the environments they are located in are best understood using a combination of statisitics, GIS software, spatial analysis tools, and analyst interpretation. The work consisted of several steps including remote sensing analysis, characterizing and classifying sand deposits, identification of patterns in sand deposit distribution, and interpretation of five general reef types and their ability to store sands. Our top-level goal was to design and quantify a geologic model of the spatial distribution of carbonate sand on fringing reefs. Fringing reef sands are controlled by a combination of waves and currents (hydrologic environment) on the reefs and geologic factors governing hard substrate relief (i.e., karst bathymetry, spur and groove development, antecedent topography, etc.). These geologic factors exert important controls on the sandy seafloor that work together with dynamic sediment transport processes to determine sand accumulation. We identified several relationships between active sand accumulation and reef geologic factors controlling substrate relief. There were three sub-goals targeted to facilitate designing and quantifying our geologic model. First, we refined our remotely sensed data processing techniques. This allowed us to prospect for sandy substrate across large areas of the fringing reef, creating sandy substrate maps for nearshore fringing reefs. Second, we developed a means to characterize individual deposits and segment them into functional subgroups. We selected a group of shape measurements that allowed us to characterize individual sand deposits by their 2-D surface shape. Then we developed a supervised class structure for segmenting sand deposits by their relationship between shape measurements and types of depressions. We also segmented sand deposits by depth across the fringing reef. Third, we viewed all sand deposits and segmented sand deposits as they are located on the fringing reef and within the coastal environment to define five general reef types that control sand storage. 1
2 Report Documentation Page Form Approved OMB No Public reporting burden for the collection of information is estimated to average 1 hour per response, including the time for reviewing instructions, searching existing data sources, gathering and maintaining the data needed, and completing and reviewing the collection of information. Send comments regarding this burden estimate or any other aspect of this collection of information, including suggestions for reducing this burden, to Washington Headquarters Services, Directorate for Information Operations and Reports, 1215 Jefferson Davis Highway, Suite 1204, Arlington VA Respondents should be aware that notwithstanding any other provision of law, no person shall be subject to a penalty for failing to comply with a collection of information if it does not display a currently valid OMB control number. 1. REPORT DATE 30 SEP REPORT TYPE 3. DATES COVERED to TITLE AND SUBTITLE Sand Distribution and Statistical Spatial Characteristics on Pacific Reef Platforms 5a. CONTRACT NUMBER 5b. GRANT NUMBER 5c. PROGRAM ELEMENT NUMBER 6. AUTHOR(S) 5d. PROJECT NUMBER 5e. TASK NUMBER 5f. WORK UNIT NUMBER 7. PERFORMING ORGANIZATION NAME(S) AND ADDRESS(ES) University of Hawaii,Geology and Geophysics, School of Ocean and Earth,Science and Technology,Honolulu,HI, PERFORMING ORGANIZATION REPORT NUMBER 9. SPONSORING/MONITORING AGENCY NAME(S) AND ADDRESS(ES) 10. SPONSOR/MONITOR S ACRONYM(S) 12. DISTRIBUTION/AVAILABILITY STATEMENT Approved for public release; distribution unlimited 13. SUPPLEMENTARY NOTES code 1 only 11. SPONSOR/MONITOR S REPORT NUMBER(S) 14. ABSTRACT We analyzed patterns of sand deposit distribution on the reef platform, and documented relationships between sand deposits and reef morphology. Sand deposit patterns, the surrounding morphology, and the environments they are located in are best understood using a combination of statisitics, GIS software, spatial analysis tools, and analyst interpretation. The work consisted of several steps including remote sensing analysis, characterizing and classifying sand deposits, identification of patterns in sand deposit distribution, and interpretation of five general reef types and their ability to store sands. 15. SUBJECT TERMS 16. SECURITY CLASSIFICATION OF: 17. LIMITATION OF ABSTRACT a. REPORT unclassified b. ABSTRACT unclassified c. THIS PAGE unclassified Same as Report (SAR) 18. NUMBER OF PAGES 12 19a. NAME OF RESPONSIBLE PERSON Standard Form 298 (Rev. 8-98) Prescribed by ANSI Std Z39-18
3 The five general reef types are our model for sand accumulation and storage. This model highlights the relationship between hydrologic environment (wave and currents) and substrate geology. Within the model several factors are emphasized: relationship between sand deposit surface shape and types of depressions, depth on the reef, general reef shape, hydrographic environment, and geologic substrate controls. APPROACH Step 1 Remote Sensing Analysis Methods are focused on developing simple and accurate techniques for sand identification in digital images. Digital images with red, green, and blue components, are the chosen media because they are more common, cheaper, and require less specialized acquisition equipment than hyper-spectral images. A georectified satellite digital image is our base image (Figure 1A). Red, green, and blue bands all have different attenuation coefficients, with the red band penetrating only a short distance through the water column even in optically ideal conditions. To remove the confounding effects of depth within the water column on reflected data, we fuse individual color bands with a rasterized LIDAR depth band. LIDAR (USACE SHOALS, ca 1999) datasets of the study sites are interpolated into bathymetry surfaces at the same resolution as the image data, and co-registered to the base image (Figure 1B). Modern LIDAR point collection in many sites is at almost the same scale as satellite imagery like that provided by Quickbird. Another useful derivative of the interpolated surface is a slope surface, recorded as increased intensity for steeper slopes it provides detailed information on relief and slope variability. Attenuation in the water column is logarithmic with depth. Each color band (Figure 2A) is log transformed, creating a linear relationship between the color band and the depth channel, as long as the color band is in optically shallow waters. We assume our interpolated depth channel represents real depths, thus the relationship between light loss in each band and depth can be empirically derived. Each band pair is rotated, according to this relationship, with a Principal Component Analysis (PCA). This maximizes variation in the first component, and leaves all remaining variation in a second orthogonal component. The rotation coefficients are computed using a model that is carbonate sand pixels from all depths, identified within each image. Using a single reflector (bottom type such as carbonate sand) eliminates any variation that would be present from multiple reflectors. Rotation removes any correlation between the color band and depth, leaving a second component that is the color band as if the water column was not present (Figure 2B). In the case of the red band, this will not work when looking beyond its depth of detection, thus the results from rotating the red band beyond 5 m are not useful. The new depth decorrelated blue and green bands are then used for sandy substrate discrimination. We used a combination of techniques to accommodate variable water qualities within each image. We began with generic classification algorithms, using which ever had the best initial results. Then we used a band threshold tool to identify the intensity value in each band, above which all brighter pixels were sandy substrate, and below which all darker pixels were not sandy substrate. The final step was hand digitizing to clean up some borders and fill in gaps not accurately represented in the data. We found this combination of techniques to be an effective and efficient method for rapid segregation of 2
4 basic substrate information classes, ( sandy substrate class and not sandy substrate class ). The result is a two-information class data set, with the primary information class identifying sandy substrate (Figure 2C). After applying this technique to all of data, we had created sandy substrate maps for ~40% of the fringing reefs around Oahu, Hawaii (Figure 3). Step 2 Sand Deposit Characterization and Classification Following sandy substrate discrimination in the base image, we identified all unique sand deposits as continuous shapes within the sand class (14,037 total). These individual sand deposits were then quantified using six unique shape measurements: area, orientation of the major axis, form factor, roundness, solidity, and eccentricity. These six measures provided quantitative values for different characteristics in the sand deposit s surface shape. We then defined a class structure (Figure 4) that identified specific ranges of shape measurements that were related to different types of depressions on the reef s surface. The five sand deposit classes are: Channels and connected fields (97 identified), Complex fields and very large depressions (103), large depressions and fields (1282), linear deposits (1618), and small depressions and simple fields (10,937). This enabled us to compare the types of depressions holding sandy substrate and patterns of sand deposit shape characteristics from one area of the island to another. After segmenting the data into five sand deposit classes, we also wanted to investigate the effect of the hydrologic environment on sand distribution. We defined three depth controlled sub-environments: shallower than 10 m, deeper than 10 m, and crossing the 10 m contour. These three environments, though generic in nature, were extremely informative into the depth controls on present on Oahu s fringing reefs. Shallower than 10 m is indicative of an environment controlled by antecedent topography and hydrologic shear stress. Deeper than 10 m is indicative of reef accreation s control on morphology. And crossing 10 m is a product of both shallower and deeper controls. We were able to compare sand deposit shape characteristics, class distribution, and percent sandy substrate coverage for the reef, in each of these depth ranges within the different areas of the island. Step 3 Identification of Patterns in Sand Deposit Distribution We divided our study area, the fringing reefs of Oahu, into nine study regions (Figure 5, inset map). These regions were identified by changes in coastline orientation and differences in overall reef shape. Six were located on the east side, one on the west side, and two on the south side of Oahu. To identify patterns in sand deposit distribution we combined all quantifiable and interpretable data and compared the nine regions. We identified four major groups from the percent sandy substrate coverage values. Using sand deposit shape characteristics, presence of sand deposit classes, depth controlled subenvironment data, generalized wave environments, and overall reef shape, we were able to refine the four initial groups into five final groups. These five final groups were representative of distinct sand deposit distribution patterns within specific environments. Step 4 5 General Reef Types Figure 5 shows the five general reef types and their locations on Oahu, Hawaii. Each general reef type is named with a general reference to annual wave climate and general reef shape. Also listed with each general reef type is the percent of sandy substrate coverage. Energy level are for annual wave climate comparisons between general types. References to shape (wide, variable, and deep) are to whole reef shape interpretation. The most significant sand coverage was in Low-energy wide reef with >28%. 3
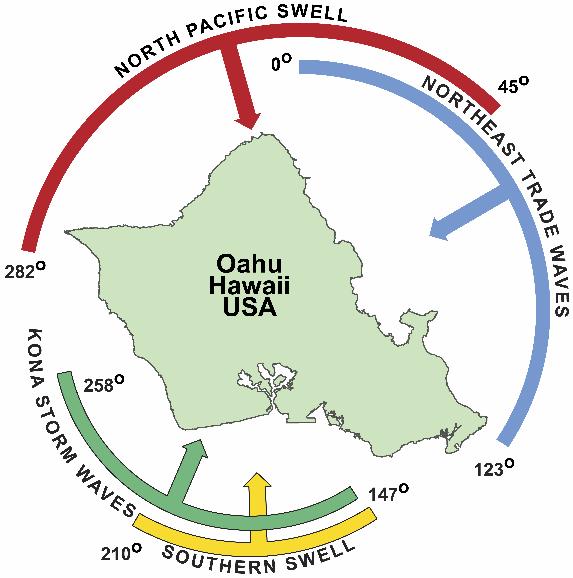
5 This type is exposed to southern Pacific swell (April-October) and occasional Kona storm waves (~9% of the year); has a wide back reef (~0.5 km) and a shallow reef crest (<3 m); and has a strong presence of Channels and connected fields, and Complex fields and very large depressions classes. The next general reef type is Medium-energy wide reef with the second highest sand cover at ~26%. This type is exposed to trade wind waves (~90% of year) and north Pacific swell (October-March); has a similar reef shape to Low-energy wide reef; and has similar presence of classes. Third is Seasonally highenergy variable reef with ~22% sand cover. This type is exposed to north Pacific swell, southern Pacific swell, and Kona storm waves; has a variable width back reef and a variable depth (3-15 m) reef crest; and has strong presence of Channels and connected fields class. Medium-energy deep reef has 14-15% sand cover; is exposed to trade wind waves and north Pacific swell; has a narrow back reef (<0.5 km) and a deep reef crest (>8 m); and has a strong presence of Channels and connected fields and Large depressions and fields classes. Similar to Medium-energy deep reef is High-energy deep reef that has 14-15% sand cover. One difference between the two is that High-energy deep reef is exposed to more direct north Pacific swell, as well as being exposed to trade wind waves. It also has a narrow back reef and a deep reef crest, and has a strong presence of Channels and connected fields, Large depressions and fields, and small depressions and simple fields. These five general reef types express the interrelationship between hydrologic environment and nearshore geology in controlling the presence on nearshore sands and sand deposit shape and distribution patterns. These five types are a combination of quantifiable measurement data and interpreted environmental and morphology data. The final result provides a first order estimation for amount of nearshore sands and the type of reef depressions holding these features. As stated earlier, our research seeks to understand sand accumulation on fringing reefs and how it is influenced by hard substrate morphology. The steps outlined above provide necessary information for the construction of a geological model that is expressed as five general reef types. Chris Conger, who completed his Master s of Science for Coastal Geology in the Department of Geology and Geophysics at the University of Hawaii in 2005, is the primary analyst. Chip Fletcher, professor of Geology in the Department of Geology and Geophysics at the University of Hawaii, is the principal investigator. WORK COMPLETED The project has been successfully completed. Results have been significant for refining classification techniques for nearshore sands, for developing new techniques for remote sensing data fusion and processing, for creating a classification structure for nearshore sands, and for defining general reef through sand storage, hydrologic environment, and geologic factors. As a result, this work has been presented at three conferences and will be published in three peer-reviewed journals. RESULTS Development of new remote sensing data fusion and processing techniques has significantly improved our ability to accurate and effeciently identify nearshore carbonate sands on the fringing reef. Our selection of 2-D shape measurements allows us to quantify a unique assemblage of data for each sand deposit. Creation of a classification system that relates types and shapes of depressions on the reef s surface to quantifiable ranges in 2-D shape data allows us to unterpret subgroups within our sand deposits and relate them to nearshore geology. Dividing sand deposits by depth ranges allows us to investigate and quantify the effects of hydrologic environment on sand distribution. And finally, 4
6 defining general reef types that control sand distribution links hydrologic environmental controls, nearshore geology, and sand deposit storage data to better understand sasndy substrate distribution across the fringing reef, between 20 m depth and the shoreline. A manuscript describing a portion of this work has been accepted by Journal of Coastal Research for publication, and will be published in the Winter 2005 journal. A manuscript describing the reomote sensing data fusion and processing technique has been accepted contingent on revisions by IEEE s Transactions on Geosciences and Remote Sensing. A mansucript describing the characterization and classification of sand deposits and the five general reef types controlling sandy substrate distribution is under review at Marine Geology. An abstract for the work completed on the Waikiki Test Area was accepted for presentation at the Geological Society of America Annual Meeting in A poster for spatial analysis work completed in Waikiki and Kailua was presented at the American Geophysical Union s annual meeting in The remote sensing data fusion and processing techniques were presented at the 6 th annual Joint Airborne LIDAR Bathymetry Technical Expertice Center (JALBTEC) conference in IMPACT/APPLICATIONS This research has improved understanding the relationship of sandy and hard substrate on fringing reefs, and sandy substrate is controlled by a combination of hydrologic environment and geologic factors. This research has also defined a new method to decorrelate color band data from depth, a significant improvement in current techniques. RELATED PROJECTS We are collaborating on bottom characterization with the ONR funded mine burial study. We collaborated with the Department of Land and Natural Resources in a sand resource study on Oahu, Hawaii. PUBLICATIONS Conger, C.L., Fletcher, C.H., Barbee, M., Marine Carbonate Sand Location and Substrate Morphology Analysis Using PCA and Neural Networks on RGB Images. GSA Annual Meeting, Seattle, WA. Conger, C.L., Fletcher, C. H., Hochberg, E.J., Identification and spatial distribution of remotely sensed sand on fringing reefs of Oahu, Hawaii. AGU Annual Meeting, San Fransisco, CA. Conger, C.L., Hochberg, E.J., Fletcher, C.H., Atkinson, M., Decorrelating remotely sensed color bands from bathymetry. JALBTCX 6 th Annual Conference, Philidelphia, PA. Conger, C.L., Fletcher, C.H., Barbee, M., Artificial Neural Network Classification of Sand in all Visible Submarine and Subaerial Regions of a Digital Image. Journal of Coastal Research, scheduled for print Winter 2005 issue. Conger, C.L., Hochberg, E.J., Fletcher, C.H., Atkinson, M., Decorrelating remotely sensed color bands from bathymetry in optically shallow waters. IEEE Transactions on Geoscience and Remote Sensing Letters, submitted and revised. 5
7 Conger, C.L., Fletcher, C.H., Hochberg, E.J., Frazer, N., Rooney, J.J., Patterns of sand distribution across fringing reefs on Oahu, Hawaii. Marine Geology, Submitted. 6

 Bathymetry raster (image) for test section of Kailua Bay, Hawaii.")
8 A B Figure 1. A) Color satellite image of Kailua Bay, Hawaii. This is a georectified Quickbird Satellite image with 2.4m pixel resolution. Blue, Green, and Red bands are used for image analysis. B) Bathymetry raster (image) for test section of Kailua Bay, Hawaii. Red areas are shallowest, black areas are deepest. This depth image was interpolated at the same pixel resolution and orientation as the digital color image. 7
 The depth decorrelated color image, produced by rotating the blue color band and the depth band together, thus removing the")
 Classified sand map created by application of substrate discrimination techniques on depth decorrelated color bands.")
9 A B C Figure 2. A) Original Kailua Bay, Hawaii, Quickbird blue band displayed in gray scale. B) The depth decorrelated color image, produced by rotating the blue color band and the depth band together, thus removing the confounding effects of the water column. C) Classified sand map created by application of substrate discrimination techniques on depth decorrelated color bands. Gray pixels are identified sandy substrate, black pixels are masked from the scene, and white pixels are marine substrates that are not sand. 8
 comprise ~40% of the nearshore fringing reef of Oahu.")
 Nearshore sands along the Waianae coastline on western Oahu.")


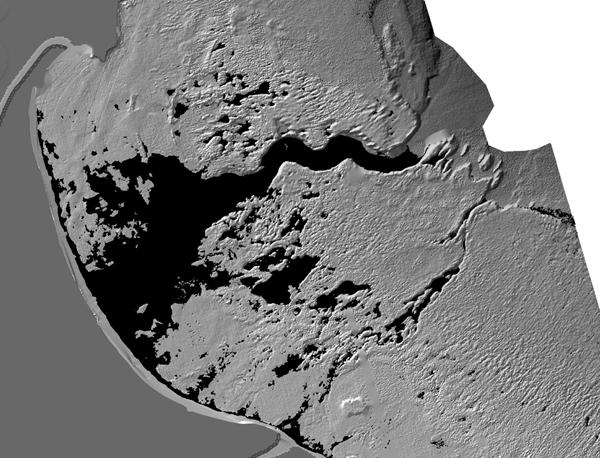
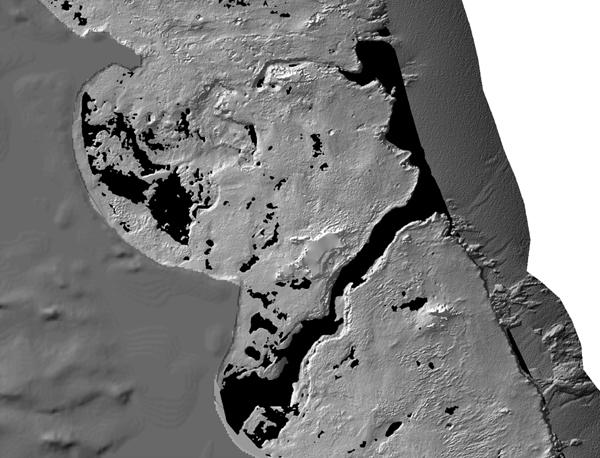
10 Figure 3. Identified sandy substrate on the nearshore fringing reefs of Oahu, Hawaii. These four areas (A-D) comprise ~40% of the nearshore fringing reef of Oahu. All black pixels are identified sands, Oahu is represented by a gray scale topographic map. A) Nearshore sands along the Waianae coastline on western Oahu. B) Nearshore sands along the north-eastern coastline of Oahu, from Punaluu in the south to Kahuku in the north. C) Nearshore sands along the southern coastline of Oahu, from Diamond Head in the east to Pearl Harbor channel in the west. D) Nearshore sands along the eastern coastline of Oahu, from Waimanalo Bay in the south through Kaneohe Bay in the north. 9


 Complex fields and very large depressions class.")


 Linear deposits class.")
11 A B A E C D C B D E Figure 4. Image of coastal zone for Kailua Bay, Oahu. Red pixels are identified carbonate sands. Magenta ovals identify regions used as examples for each sand deposit class. Each class example is labeled in both the scene on the left, and the blown up image on the right. A) Channels and connected fields class. These sand deposits are winding and elongate shapes with complex borders and lots of open space. They typically fill paleo-stream channels and have connected nearshore and/or offshore sand fields. B) Complex fields and very large depressions class. These sand deposits are rounded with complex borders and lots of open space. They typically fill multiple depressions linked through sand and large terraces or back reefs. C) Large depressions and fields class. These sand deposits are elongate with moderately complex borders and minor open space. They typically fill single depressions and isolated sections of terrace or back reef. D) Linear deposits class. These deposits are very elongate with simple borders and fill almost all open space. They typically fill very elongate and narrow depressions or are sediments strung out across flat bottom. E) Small depressions and simple fields class. These deposits are very rounded with very simple borders and fill almost all open space. They are typically filling small circular depressions or shallow and small swales on the reef s surface. 10


12 Low-energy wide reef Medium-energy wide reef >28% Sand Seasonal-energy var. reef ~26% Sand Medium-energy deep reef ~22% Sand 14-15% Sand High-energy deep reef 14-15% Sand 11
13 Figure 5. Display of 5 general reef types and their locations on the nearshore fringing reefs of Oahu, Hawaii. These general reef types were identified by combining percent reef covered by sand data, shape measurement data on individual and groups of sand deposits, sand deposit classification data, depth controlled sub-environment data, regional distribution data, whole reef shape interpretation, and annual wave climate information. References to energy level are for annual wave climate comparisons between general types. References to shape (wide, variable, and deep) are to whole reef shape interpretation. Bottom number on each reef type is the percent of reef covered by sandy substrate. The color in each type s label matches the colored ovals on the map of Oahu, Hawaii, marking regions of nearshore reef that are identified as that general reef type. A) Lowenergy wide reef has the highest percent sand cover (>28%); is exposed to southern Pacific swell (April-October) and occasional Kona storm waves (~9% of the year); has a wide back reef (~0.5 km) and a shallow reef crest (<3 m); and has a strong presence of Channels and connected fields, and Complex fields and very large depressions classes. B) Medium-energy wide reef has the second highest sand cover (~26%); is exposed to trade wind waves (~90% of year) and north Pacific swell (October-March); has a similar reef shape to A; and has similar presence of classes. C) Seasonally high-energy variable reef has ~22% sand cover; is exposed to north Pacific swell, southern Pacific swell, and Kona storm waves; has a variable width back reef and a variable depth (3-15 m) reef crest; and has strong presence of Channels and connected fields class. D) Medium-energy deep reef has 14-15% sand cover; is exposed to trade wind waves and north Pacific swell; has a narrow back reef (<0.5 km) and a deep reef crest (>8 m); and has a strong presence of Channels and connected fields and Large depressions and fields classes. E) High-energy deep reef has 14-15% sand cover; is exposed to trade wind waves and north Pacific swell; has a narrow back reef and a deep reef crest; and has a strong presence of Channels and connected fields, Large depressions and fields, and small depressions and simple fields. 12
Seafloor Reconnaissance Surveys and Change Monitoring Using a Small AUV and a Small ROV
 Seafloor Reconnaissance Surveys and Change Monitoring Using a Small AUV and a Small ROV Grant Number: N00014-05-1-0665 Acquisition of a REMUS Autonomous Underwater Vehicle and a Small ROV for the University
Computer Simulation of Sand Ripple Growth and Migration.
 Computer Simulation of Sand Ripple Growth and Migration. Douglas J. Wilson OGI School of Environmental Science and Engineering at the Oregon Health and Sciences University 20000 N.W. Walker Road, Beaverton,
Estimation of Vertical Distributions of Water Vapor from Spaceborne Observations of Scattered Sunlight
 Estimation of Vertical Distributions of Water Vapor from Spaceborne Observations of Scattered Sunlight Dale P. Winebrenner Applied Physics Laboratory, Box 355640 University of Washington Seattle, WA 98195
UUV Operations to Characterize Circulation and Morphology of Tidal Flats
 UUV Operations to Characterize Circulation and Morphology of Tidal Flats Mark A. Moline Center for Coastal Marine Sciences and Biological Sciences Department California Polytechnic State University 1 Grand
Shelf And Slope Sediment Transport In Strataform
 Shelf And Slope Sediment Transport In Strataform David A. Cacchione Woods Hole Group 1167 Oddstad Drive Redwood City, MA 94063 phone: 650-298-0520 fax: 650-298-0523 email: dcacchione@whgrp.com Award #:
Predicting Tropical Cyclone Formation and Structure Change
 Predicting Tropical Cyclone Formation and Structure Change Patrick A. Harr Department of Meteorology Naval Postgraduate School Monterey, CA 93943-5114 Telephone: (831)656-3787 FAX:(831)656-3061 email:
Closed-form and Numerical Reverberation and Propagation: Inclusion of Convergence Effects
 DISTRIBUTION STATEMENT A. Approved for public release; distribution is unlimited. Closed-form and Numerical Reverberation and Propagation: Inclusion of Convergence Effects Chris Harrison Centre for Marine
Models of Marginal Seas Partially Enclosed by Islands
 Models of Marginal Seas Partially Enclosed by Islands Roxana C. Wajsowicz Dept. of Meteorology University of Maryland 3433 Computer and Space Science Building College Park, MD 20852 Phone: (301) 405-5396
Understanding Near-Surface and In-cloud Turbulent Fluxes in the Coastal Stratocumulus-topped Boundary Layers
 Understanding Near-Surface and In-cloud Turbulent Fluxes in the Coastal Stratocumulus-topped Boundary Layers Qing Wang Meteorology Department, Naval Postgraduate School Monterey, CA 93943 Phone: (831)
Understanding Near-Surface and In-Cloud Turbulent Fluxes in the Coastal Stratocumulus-Topped Boundary Layers
 Understanding Near-Surface and In-Cloud Turbulent Fluxes in the Coastal Stratocumulus-Topped Boundary Layers Qing Wang Meteorology Department, Naval Postgraduate School Monterey, CA 93943 Phone: (831)
Scattering of Internal Gravity Waves at Finite Topography
 Scattering of Internal Gravity Waves at Finite Topography Peter Muller University of Hawaii Department of Oceanography 1000 Pope Road, MSB 429 Honolulu, HI 96822 phone: (808)956-8081 fax: (808)956-9164
Flocculation, Optics and Turbulence in the Community Sediment Transport Model System: Application of OASIS Results
 DISTRIBUTION STATEMENT A: Approved for public release; distribution is unlimited. Flocculation, Optics and Turbulence in the Community Sediment Transport Model System: Application of OASIS Results Emmanuel
Impact of Typhoons on the Western Pacific Ocean DRI: Numerical Modeling of Ocean Mixed Layer Turbulence and Entrainment at High Winds
 Impact of Typhoons on the Western Pacific Ocean DRI: Numerical Modeling of Ocean Mixed Layer Turbulence and Entrainment at High Winds Ramsey R. Harcourt Applied Physics Laboratory, University of Washington,
Satellite Observations of Surface Fronts, Currents and Winds in the Northeast South China Sea
 Satellite Observations of Surface Fronts, Currents and Winds in the Northeast South China Sea Michael J. Caruso Department of Physical Oceanography, MS #21 Woods Hole Oceanographic Institution Woods Hole,
Contract No. N C0123
 Particle Size Distribution and Optical Volume Scattering Function in the Mid and Upper Water Column of Optically Deep Coastal Regions: Transport from the Bottom Boundary Layer Y. C. Agrawal Sequoia Scientific,
Sediment Flux and Trapping on the Skagit Tidal Flats
 Sediment Flux and Trapping on the Skagit Tidal Flats W. Rockwell Geyer Woods Hole Oceanographic Institution MS 11, Woods Hole, MA 02543 phone: 508-289-2868 fax: 508-457-2194 email: rgeyer@whoi.edu Peter
Mine Burial Studies with a Large Oscillating Water-Sediment Tunnel (LOWST)
") Mine Burial Studies with a Large Oscillating Water-Sediment Tunnel (LOWST) Marcelo H. Garcia Department of Civil and Environmental Engineering University of Illinois at Urbana-Champaign 205 North Mathews
Mine Burial Studies with a Large Oscillating Water-Sediment Tunnel (LOWST) Marcelo H. Garcia Department of Civil and Environmental Engineering University of Illinois at Urbana-Champaign 205 North Mathews
Margin Morphodynamics: Debris Flows, Turbidity Currents and Experimental Margin Stratigraphy
 Margin Morphodynamics: Debris Flows, Turbidity Currents and Experimental Margin Stratigraphy Gary Parker St. Anthony Falls Laboratory University of Minnesota Mississippi River at 3 rd Ave. SE Minneapolis,
Modeling the Formation and Offshore Transport of Dense Water from High-Latitude Coastal Polynyas
 Modeling the Formation and Offshore Transport of Dense Water from High-Latitude Coastal Polynyas David C. Chapman Woods Hole Oceanographic Institution Woods Hole, MA 02543 phone: (508) 289-2792 fax: (508)
Analysis of Infrared Measurements of Microbreaking and Whitecaps
 Analysis of Infrared Measurements of Microbreaking and Whitecaps Andrew T. Jessup Applied Physics Laboratory, University of Washington 1013 NE 40th St. Seattle, WA 98105-6698 phone (206) 685-2609 fax (206)
Regional Stratification and Shear of the Various Streams Feeding the Philippine Straits ESR Component
 Regional Stratification and Shear of the Various Streams Feeding the Philippine Straits ESR Component Amy Ffield Earth & Space Research, 290 Clausland Mountain Road, Upper Grandview, NY 10960-4113 phone:
Marginal Sea - Open Ocean Exchange
 Marginal Sea - Open Ocean Exchange Michael A. Spall Mail Stop 21 Department of Physical Oceanography Woods Hole Oceanographic Institution Woods Hole, MA 02543-1541 phone: (508) 289-3342 fax: (508) 457-2181
Super-Parameterization of Boundary Layer Roll Vortices in Tropical Cyclone Models
 DISTRIBUTION STATEMENT A. Approved for public release; distribution is unlimited. Super-Parameterization of Boundary Layer Roll Vortices in Tropical Cyclone Models PI Isaac Ginis Graduate School of Oceanography
Sea Ice Model for Marginal Ice Zone
 Sea Ice Model for Marginal Ice Zone Max D. Coon Northwest Research Associates, Inc. 14508 N.E. 20 th Street Bellevue, WA 98007-3713 Phone: (425) 644-9660 ext. 332 Fax: (425) 644-8422 E-mail: max@nwra.com
Internal Tide Generation in the Indonesian Seas
 Internal Tide Generation in the Indonesian Seas Amy Ffield Earth and Space Research, 290 Clausland Mountain Road, Upper Grandview, NY 10960 Phone: (845) 353-1733 Fax: (845) 353-1733 Email: ffield@esr.org
SW06 Shallow Water Acoustics Experiment Data Analysis
 DISTRIBUTION STATEMENT A: Approved for public release; distribution is unlimited. SW06 Shallow Water Acoustics Experiment Data Analysis James F. Lynch MS #12, Woods Hole Oceanographic Institution Woods
Parameterizing the Effects of Upper-Ocean Large Eddies on Air-Sea Interaction
 Parameterizing the Effects of Upper-Ocean Large Eddies on Air-Sea Interaction Ming Li Horn Point Laboratory University of Maryland Center for Environmental Science 2020 Horn Point Road, Cambridge, MD 21613
Nonlinear Internal Waves: Test of the Inverted Echo Sounder
 Nonlinear Internal Waves: Test of the Inverted Echo Sounder David M. Farmer Graduate School of Oceanography (educational) University of Rhode Island Narragansett, RI 02882 Phone: (401) 874-6222 fax (401)
Estimation of Vertical Distributions of Water Vapor and Aerosols from Spaceborne Observations of Scattered Sunlight
 Estimation of Vertical Distributions of Water Vapor and Aerosols from Spaceborne Observations of Scattered Sunlight Dale P. Winebrenner Polar Science Center/Applied Physics Laboratory University of Washington
Coupled Ocean-Atmosphere Modeling of the Coastal Zone
 Coupled Ocean-Atmosphere Modeling of the Coastal Zone Eric D. Skyllingstad College of Oceanic and Atmospheric Sciences, Oregon State University 14 Ocean Admin. Bldg., Corvallis, OR 97331 Phone: (541) 737-5697
Curating and Maintenance of the Sediment Library and Dredge Collection
 Curating and Maintenance of the Sediment Library and Dredge Collection Gerard C. Bond Lamont-Doherty Earth Observatory Deep-Sea Sample Repository of Columbia University Palisades, New York 10964 Phone:
Analysis of Mixing and Dynamics Associated with the Dissolution of Hurricane-Induced Cold Wakes
 DISTRIBUTION STATEMENT A: Approved for public release; distribution is unlimited. Analysis of Mixing and Dynamics Associated with the Dissolution of Hurricane-Induced Cold Wakes Carol Anne Clayson Dept.
Upper Ocean Measurements of Water Masses and Circulation in the Japan Sea
 Upper Ocean Measurements of Water Masses and Circulation in the Japan Sea Stephen C. Riser School of Oceanography, University of Washington, Seattle, Washington 98195 USA Phone: (206) 543-1187 Fax: (206)
Coastal Mixing and Optics
 Coastal Mixing and Optics W. Scott Pegau College of Oceanic and Atmospheric Sciences Ocean. Admin. Bldg. 104 Oregon State University Corvallis, OR 97331-5503 Phone: (541) 737-5229 fax: (541) 737-2064 email:
Near-Surface Dispersion and Circulation in the Marmara Sea (MARMARA)
") DISTRIBUTION STATEMENT A. Approved for public release; distribution is unlimited. Near-Surface Dispersion and Circulation in the Marmara Sea (MARMARA) Pierre-Marie Poulain Istituto Nazionale di Oceanografia
DISTRIBUTION STATEMENT A. Approved for public release; distribution is unlimited. Near-Surface Dispersion and Circulation in the Marmara Sea (MARMARA) Pierre-Marie Poulain Istituto Nazionale di Oceanografia
Report Documentation Page
 Report Documentation Page Form Approved OMB No. 0704-0188 Public reporting burden for the collection of information is estimated to average 1 hour per response, including the time for reviewing instructions,
Determining the Stratification of Exchange Flows in Sea Straits
 Determining the Stratification of Exchange Flows in Sea Straits Lawrence J. Pratt Physical Oceanography Department, MS #21 Woods Hole Oceanographic Institution, Woods Hole, MA 02543 phone: (508) 289-2540
FRACTAL CONCEPTS AND THE ANALYSIS OF ATMOSPHERIC PROCESSES
 1 FRACTAL CONCEPTS AND THE ANALYSIS OF ATMOSPHERIC PROCESSES Robert L. Street Environmental Fluid Mechanics Laboratory Department of Civil Engineering Stanford University Stanford, CA 94305-4020 650-723-4969;
Internal Waves and Mixing in the Aegean Sea
 Internal Waves and Mixing in the Aegean Sea PI: Michael Gregg Applied Physics Lab/Univ. Washington, Seattle, WA 98105 phone: (206) 543-1353 fax: (206) 543-6785 email: gregg@apl.washington.edu CO-PI: Matthew
Real-Time Environmental Information Network and Analysis System (REINAS)
") Calhoun: The NPS Institutional Archive Faculty and Researcher Publications Faculty and Researcher Publications 1998-09 Real-Time Environmental Information Network and Analysis System (REINAS) Nuss, Wendell
Calhoun: The NPS Institutional Archive Faculty and Researcher Publications Faculty and Researcher Publications 1998-09 Real-Time Environmental Information Network and Analysis System (REINAS) Nuss, Wendell
Assimilation of Synthetic-Aperture Radar Data into Navy Wave Prediction Models
 Assimilation of Synthetic-Aperture Radar Data into Navy Wave Prediction Models David T. Walker Earth Sciences Group, Veridian ERIM International P.O. Box 134008, Ann Arbor, MI 48113-4008 phone: (734)994-1200
Modeling the Impact of Extreme Events on Margin Sedimentation
 Modeling the Impact of Extreme Events on Margin Sedimentation Jasim Imran Department of Civil and Environmental Engineering, University of South Carolina, 3 Main Street, Columbia, SC 2928. phone: (83)
High Resolution Surface Characterization from Marine Radar Measurements
 DISTRIBUTION STATEMENT A: Distribution approved for public release; distribution is unlimited High Resolution Surface Characterization from Marine Radar Measurements Hans C. Graber CSTARS - University
Hurricane Wave Topography and Directional Wave Spectra in Near Real-Time
 Hurricane Wave Topography and Directional Wave Spectra in Near Real-Time Edward J. Walsh NASA/Goddard Space Flight Center, Code 972 Wallops Flight Facility, Wallops Island, VA 23337 phone: (303) 497-6357
Coastal Ocean Circulation Experiment off Senegal (COCES)
") DISTRIBUTION STATEMENT A: Approved for public release; distribution is unlimited. Coastal Ocean Circulation Experiment off Senegal (COCES) Pierre-Marie Poulain Istituto Nazionale di Oceanografia e di Geofisica
DISTRIBUTION STATEMENT A: Approved for public release; distribution is unlimited. Coastal Ocean Circulation Experiment off Senegal (COCES) Pierre-Marie Poulain Istituto Nazionale di Oceanografia e di Geofisica
Range-Dependent Acoustic Propagation in Shallow Water with Elastic Bottom Effects
 DISTRIBUTION STATEMENT A. Approved for public release; distribution is unlimited. Range-Dependent Acoustic Propagation in Shallow Water with Elastic Bottom Effects Robert I. Odom Applied Physics Laboratory
Laboratory Benchmark for Models of the Transport in the Kara Sea
 Laboratory Benchmark for Models of the Transport in the Kara Sea Thomas McClimans SINTEF Civil and Environmental Engineering N-7465 Trondheim Norway voice: +47 73592417 fax: +47 73 592376 email: thomas.mcclimans@civil.sintef.no
Sediment Acoustics. Award #: N Thrust Category: High-Frequency LONG-TERM GOAL
 Sediment Acoustics Robert D. Stoll Lamont-Doherty Earth Observatory of Columbia University Palisades, New York 10964 phone: (845) 365 8392 fax: (845) 365 8179 email: stoll@ldeo.columbia.edu Award #: N00014-94-1-0258
Analysis of Subsurface Velocity Data from the Arctic Ocean
 Analysis of Subsurface Velocity Data from the Arctic Ocean Albert J. Plueddemann 202A Clark Lab, MS-29 Woods Hole Oceanographic Institution Woods Hole, MA 02541-1541 ph: (508) 289-2789, fax: (508) 457-2163
INTERACTION AND REMOTE SENSING OF SURFACE WAVES AND TURBULENCE
 INTERACTION AND REMOTE SENSING OF SURFACE WAVES AND TURBULENCE W. Kendall Melville Scripps Institution of Oceanography University of California, San Diego La Jolla, CA 9293-23 phone: (69) 534-478, fax:
Award # N LONG TERM GOALS
 Non-Invasive Characterization Of Small-Scale Patterns Of Benthic Biogenic Structure By Ultrasound: Infaunal Dynamics And Sediment Structure, And Effect Of Sediment Disturbance Donald G. Webb Graduate School
The Mechanics of Bubble Growth and Rise in Sediments
 The Mechanics of Bubble Growth and Rise in Sediments PI: Bernard P. Boudreau Department of Oceanography Dalhousie University Halifax, Nova Scotia B3H 4J1, Canada phone: (902) 494-8895 fax: (902) 494-3877
Characterization of Caribbean Meso-Scale Eddies
 Characterization of Caribbean Meso-Scale Eddies Jose M. Lopez P.O. Box 9013 Mayaguez, Puerto Rico 00681-9013 phone: (787) 834-7620 fax: (787) 834-8025 email: jlopez@uprm.edu phone: (787) 899-2049 Jorge
Ocean Acoustics Turbulence Study
 Ocean Acoustics Turbulence Study PI John Oeschger Coastal Systems Station 6703 West Highway 98 Panama City, FL 32407 phone: (850) 230-7054 fax: (850) 234-4886 email: OeschgerJW@ncsc.navy.mil CO-PI Louis
PIPS 3.0. Pamela G. Posey NRL Code 7322 Stennis Space Center, MS Phone: Fax:
 PIPS 3.0 Ruth H. Preller Naval Research Laboratory, Code 7322 Stennis Space Center, MS 39529 phone: (228) 688-5444 fax: (228)688-4759 email: preller@nrlssc.navy.mil Pamela G. Posey NRL Code 7322 Stennis
Super-Parameterization of Boundary Layer Roll Vortices in Tropical Cyclone Models
 DISTRIBUTION STATEMENT A. Approved for public release; distribution is unlimited. Super-Parameterization of Boundary Layer Roll Vortices in Tropical Cyclone Models PI Isaac Ginis Graduate School of Oceanography
Predictive Model for Archaeological Resources. Marine Corps Base Quantico, Virginia John Haynes Jesse Bellavance
 Predictive Model for Archaeological Resources Marine Corps Base Quantico, Virginia John Haynes Jesse Bellavance Report Documentation Page Form Approved OMB No. 0704-0188 Public reporting burden for the
Development of Ocean and Coastal Prediction Systems
 Development of Ocean and Coastal Prediction Systems Tal Ezer Program in Atmospheric and Oceanic Sciences P.O.Box CN710, Sayre Hall Princeton University Princeton, NJ 08544-0710 phone: (609) 258-1318 fax:
Attribution Concepts for Sub-meter Resolution Ground Physics Models
 Attribution Concepts for Sub-meter Resolution Ground Physics Models 76 th MORS Symposium US Coast Guard Academy Approved for public release distribution. 2 Report Documentation Page Form Approved OMB No.
Experimental and Theoretical Studies of Ice-Albedo Feedback Processes in the Arctic Basin
 LONG TERM GOALS Experimental and Theoretical Studies of Ice-Albedo Feedback Processes in the Arctic Basin D.K. Perovich J.A. Richter-Menge W.B. Tucker III M. Sturm U. S. Army Cold Regions Research and
Experimental and Theoretical Studies of Ice-Albedo Feedback Processes in the Arctic Basin
 LONG TERM GOALS Experimental and Theoretical Studies of Ice-Albedo Feedback Processes in the Arctic Basin D.K. Perovich J.A. Richter-Menge W.B. Tucker III M. Sturm U. S. Army Cold Regions Research and
A 1/10th Degree Global Ocean Simulation Using the Parallel Ocean Program
 A 1/10th Degree Global Ocean Simulation Using the Parallel Ocean Program Mathew E Maltrud Fluid Dynamics Group MS B216 Los Alamos National Laboratory Los Alamos, NM 87545 phone: (505) 667-9097 fax: (505)
SENSORS FOR MEASURING THE VOLUME SCATTERING FUNCTION OF OCEANIC WATERS
 SENSORS FOR MEASURING THE VOLUME SCATTERING FUNCTION OF OCEANIC WATERS Robert A. Maffione Hydro-Optics, Biology, and Instrumentation Laboratories 55 Penny Lane, Suite 104 Watsonville, CA 95076 Phone: (408)
Grant Number: N IP To compare obtained theoretical results with NPAL experimental data.
 Coherence of Low-Frequency Sound Signals Propagating through a Fluctuating Ocean: Analysis and Theoretical Interpretation of 2004 NPAL Experimental Data Alexander G. Voronovich NOAA/ESRL, PSD4, 325 Broadway,
Weak Turbulence in Ocean Waves
 Weak Turbulence in Ocean Waves Yuri V. Lvov Rensselaer Polytechnic Institute Troy, New York 12180-3590 Phone: (518) 276-6893 fax: (518) 276-4824 email: lvov@rpi.edu Award Number N000140210528 http://www.rpi.edu/~lvovy
Generation and Propagation of Internal Solitary Waves on the Continental Shelf and Slope
 Generation and Propagation of Internal Solitary Waves on the Continental Shelf and Slope Roger H.J. Grimshaw Department of Mathematical Sciences Loughborough University Loughborough, LE11 3TU, UK phone:
Coastal Engineering Technical Note
 Coastal Engineering Technical Note CETN I-48 (12/91) Evaluation and Application of the Wave Information Study for the Gulf of Mexico INTRODUCTION The Wave Information Study (WIS) for the Gulf of Mexico
Modeling of Coastal Ocean Flow Fields
 Modeling of Coastal Ocean Flow Fields John S. Allen College of Oceanic and Atmospheric Sciences Oregon State University 104 Ocean Admin Building Corvallis, OR 97331-5503 phone: (541) 737-2928 fax: (541)
Use of Wijsman's Theorem for the Ratio of Maximal Invariant Densities in Signal Detection Applications
 Use of Wijsman's Theorem for the Ratio of Maximal Invariant Densities in Signal Detection Applications Joseph R. Gabriel Naval Undersea Warfare Center Newport, Rl 02841 Steven M. Kay University of Rhode
Topographic Effects on Stratified Flows
 Topographic Effects on Stratified Flows Laurence Armi Institute of Geophysics and Planetary Physics Scripps Institution of Oceanography La Jolla, CA 92093-0225 phone: (858) 534-6843 fax: (858) 534-5332
Two-Dimensional Simulation of Truckee River Hydrodynamics
 Two-Dimensional Simulation of Truckee River Hydrodynamics by Stephen H. Scott PURPOSE: The purpose of this Coastal and Hydraulics Engineering Technical Note (CHETN) is to demonstrate the use of multidimensional
EFFECTS OF LOCAL METEOROLOGICAL VARIABILITY ON SURFACE AND SUBSURFACE SEISMIC-ACOUSTIC SIGNALS
 EFFECTS OF LOCAL METEOROLOGICAL VARIABILITY ON SURFACE AND SUBSURFACE SEISMIC-ACOUSTIC SIGNALS Jason R. McKenna and Mihan H. McKenna U.S. Army Engineer Research & Development Center, Vicksburg, MS 39180
Sensitivity of West Florida Shelf Simulations to Initial and Boundary Conditions Provided by HYCOM Data-Assimilative Ocean Hindcasts
 Sensitivity of West Florida Shelf Simulations to Initial and Boundary Conditions Provided by HYCOM Data-Assimilative Ocean Hindcasts George Halliwell, MPO/RSMAS, University of Miami Alexander Barth, University
Sediment Dispersal from the Apennine Rivers
 Sediment Dispersal from the Apennine Rivers Gail C. Kineke Dept of Geology and Geophysics Boston College Chestnut Hill, MA 02467 phone: 617-552-3655 fax: 617-552-2462 email:kinekeg@bc.edu Award # N00014-02-1-0234
The Extratropical Transition of Tropical Cyclones
 The Extratropical Transition of Tropical Cyclones Elizabeth A. Ritchie Department of Electrical and Computer Engineering and the Center for High Performance Computing Room 125, EECE Building Albuquerque,
Shallow Water Fluctuations and Communications
 Shallow Water Fluctuations and Communications H.C. Song Marine Physical Laboratory Scripps Institution of oceanography La Jolla, CA 92093-0238 phone: (858) 534-0954 fax: (858) 534-7641 email: hcsong@mpl.ucsd.edu
DIRECTIONAL WAVE SPECTRA USING NORMAL SPREADING FUNCTION
 CETN-I-6 3185 DIRECTIONAL WAVE SPECTRA USING NORMAL SPREADING FUNCTION PURPOSE : To present a parameterized model of a directional spectrum of the sea surface using an energy spectrum and a value for the
NAVGEM Platform Support
 DISTRIBUTION STATEMENT A. Approved for public release; distribution is unlimited. NAVGEM Platform Support Mr. Timothy Whitcomb Naval Research Laboratory 7 Grace Hopper Ave, MS2 Monterey, CA 93943 phone:
Evolution of Tropical Cyclone Characteristics
 Evolution of Tropical Cyclone Characteristics Patrick A. Harr Department of Meteorology Naval Postgraduate School Monterey, CA 93943-5114 Telephone : (831) 656-3787 FAX: (831) 656-3061 email: paharr@nps.navy.mil
System Reliability Simulation and Optimization by Component Reliability Allocation
 System Reliability Simulation and Optimization by Component Reliability Allocation Zissimos P. Mourelatos Professor and Head Mechanical Engineering Department Oakland University Rochester MI 48309 Report
COASTAL MIXING AND OPTICS
 COASTAL MIXING AND OPTICS J. Ronald V. Zaneveld College of Oceanic and Atmospheric Sciences Ocean. Admin. Bldg. 104 Oregon State University Corvallis, OR 97331-5503 Phone: (541) 737-3571 fax: (541) 737-2064
Swash Zone Dynamics: Modeling and Data Analysis
 Swash Zone Dynamics: Modeling and Data Analysis Donald N. Slinn Department of Civil and Coastal Engineering University of Florida Gainesville, FL 32611-6590 phone: (352) 392-1436 x 1431 fax: (352) 392-3466
Using a Near-Bed Sediment Flux Sensor to Measure Wave Formed Bedform Migrations and Formation Processes
 Using a Near-Bed Sediment Flux Sensor to Measure Wave Formed Bedform Migrations and Formation Processes Peter A. Traykovski Woods Hole Oceanographic Institution Woods Hole, MA 02543 1Tel.: (508) 289-2638,
Surface Fluxes and Wind-Wave Interactions in Weak Wind Conditions
 Surface Fluxes and Wind-Wave Interactions in Weak Wind Conditions Jielun Sun Microscale and Mesoscale Meteorology National Center for Atmospheric Research phone: (303) 497-8994 fax: (303) 497-8171 email:
An Examination of 3D Environmental Variability on Broadband Acoustic Propagation Near the Mid-Atlantic Bight
 An Examination of 3D Environmental Variability on Broadband Acoustic Propagation Near the Mid-Atlantic Bight Kevin B. Smith Code PH/Sk, Department of Physics Naval Postgraduate School Monterey, CA 93943
Analysis of South China Sea Shelf and Basin Acoustic Transmission Data
 DISTRIBUTION STATEMENT A: Approved for public release; distribution is unlimited. Analysis of South China Sea Shelf and Basin Acoustic Transmission Data Ching-Sang Chiu Department of Oceanography Naval
Broadband matched-field source localization in the East China Sea*
 Broadband matched-field source localization in the East China Sea* Renhe Zhang Zhenglin Li Jin Yan Zhaohui Peng Fenghua Li National Laboratory of Acoustics, Institute of Acoustics, Chinese Academy of Sciences,
Sediment Acoustics LONG-TERM GOAL
 Sediment Acoustics Robert D. Stoll Lamont-Doherty Earth Observatory of Columbia University Palisades, New York 10964 phone: (914) 365 8392 fax: (914) 365 8179 email: rdstoll@worldnet.att.net Award #: N00014-94-1-0258
Crowd Behavior Modeling in COMBAT XXI
 Crowd Behavior Modeling in COMBAT XXI Imre Balogh MOVES Research Associate Professor ilbalogh@nps.edu July 2010 831-656-7582 http://movesinstitute.org Report Documentation Page Form Approved OMB No. 0704-0188
Internal Waves in the Vicinity of the Kuroshio Path
 Internal Waves in the Vicinity of the Kuroshio Path Ren-Chieh Lien Applied Physics Laboratory University of Washington Seattle, Washington 98105 phone: (206) 685-1079 fax: (206) 543-6785 email: lien@apl.washington.edu
Inferring Atmospheric Turbulence Structure Using Synthetic Aperture Radar Images Of The Ocean Surface
 Inferring Atmospheric Turbulence Structure Using Synthetic Aperture Radar Images Of The Ocean Surface Pierre D. Mourad Applied Physics Laboratory University of Washington 1013 NE 40th Street Seattle, WA
Advanced Numerical Methods for NWP Models
 Advanced Numerical Methods for NWP Models Melinda S. Peng Naval Research Laboratory Monterey, CA 93943-552 Phone: (831) 656-474 fax: (831) 656-4769 e-mail: melinda.peng@nrlmry.navy.mil Award #: N148WX2194
Nonlinear Internal Tide Generation at the Luzon Strait: Integrating Laboratory Data with Numerics and Observation
 DISTRIBUTION STATEMENT A: Approved for public release; distribution is unlimited. Nonlinear Internal Tide Generation at the Luzon Strait: Integrating Laboratory Data with Numerics and Observation Thomas
Award Number N
 Toward Linking Seabed Stratigraphy and Nested Seismic Datasets in STRATAFORM: Finalizing Plans for Long Coring and Synthesizing Existing Physical Property Data Dr. Clark R. Alexander Skidaway Institute
Convection and Shear Flow in TC Development and Intensification
 DISTRIBUTION STATEMENT A. Approved for public release; distribution is unlimited. Convection and Shear Flow in TC Development and Intensification C.-P. Chang Department of Meteorology Naval Postgraduate
DISTRIBUTION STATEMENT A. Approved for public release; distribution is unlimited.
 DISTRIBUTION STATEMENT A. Approved for public release; distribution is unlimited. Understanding Impacts of Outflow on Tropical Cyclone Formation and Rapid Intensity and Structure Changes with Data Assimilation
Investigation of the Air-Wave-Sea Interaction Modes Using an Airborne Doppler Wind Lidar: Analyses of the HRDL data taken during DYNAMO
 DISTRIBUTION STATEMENT: Approved for public release, distribution is unlimited. Investigation of the Air-Wave-Sea Interaction Modes Using an Airborne Doppler Wind Lidar: Analyses of the HRDL data taken
Improvement of Mesoscale Numerical Weather Prediction For Coastal Regions of Complex Terrain FY2003
 Improvement of Mesoscale Numerical Weather Prediction For Coastal Regions of Complex Terrain FY2003 Clifford F. Mass Department of Atmospheric Sciences Box 351640 University of Washington Seattle, Washington
Synthetic Aperture Radar Imagery of the Ocean Surface During the Coastal Mixing and Optics Experiment
 Synthetic Aperture Radar Imagery of the Ocean Surface During the Coastal Mixing and Optics Experiment LONG TERM GOAL Donald R. Thompson and David L. Porter Ocean Remote Sensing Group Johns Hopkins University/APL
Testing Turbulence Closure Models Against Oceanic Turbulence Measurements
 Testing Turbulence Closure Models Against Oceanic Turbulence Measurements J. H. Trowbridge Woods Hole Oceanographic Institution Woods Hole, MA 02543 phone: 508-289-2296 fax: 508-457-2194 e-mail: jtrowbridge@whoi.edu