Phillips Ditch Drainage Study
|
|
|
- Mark Bell
- 5 years ago
- Views:
Transcription


1 Phillips Ditch Drainage Study By: David L. McCormick, PE, D. WRE McCormick Engineering, LLC For: St. Joseph County, Indiana Revision Date: March 29, 2017
2 Table of Contents 1. INTRODUCTION Review of Previous Drainage Studies and Data Field Investigation Hydrologic Modeling Hydraulic Modeling Evaluation of Impacts REVIEW OF PREVIOUS DRAINAGE STUDIES AND DATA Previous studies provided by the County Federal Studies IDNR-Supplied Studies INDOT-Supplied US 31 Plans and Calculations Miami Road Project Southfield Lake Dam American Electric Power Structure Precipitation Data HYDROLOGIC MODELING Treatment of Existing Storage within Watershed Model Discharge Calibration Historic Condition Hydrologic Model Storage Effects within the Historic Condition Hydrologic Model Current Condition Hydrologic Model As-Designed Conditions As-Built Conditions Comparison of Hydrologic Model Peak Discharges Storage Effects of INDOT Facilities HYDRAULIC MODELING Hydraulic Analysis Results Other Hydraulic Considerations SUMMARY OF RESULTS & RECOMMENDATION Summary of Results Recommendations BIBLIOGRAPHY Page i
3 List of Figures Figure 1. Figure 2. Figure 3. Figure 4. Figure 5. Figure 6. Figure 7. Figure 8. Figure 9. Storage Effects of Wetlands Upstream of Madison Road Crossing Storage Effects of Wetlands Upstream of Roosevelt Road Crossing Storage Effects of Wetlands Upstream of Southfield Lake Dam Storage Effects of Wetlands Upstream of Johnson Road tributary Crossing Model Storage Effects of INDOT Facility N1 Model Storage Effects of INDOT Facility M1 Model Storage Effects of INDOT Facility M2 Model Storage Effects of INDOT Facility M3 Model Storage Effects of INDOT Facility S1 List of Exhibits Exhibit 1. Exhibit 2. Exhibit 3. Exhibit 4. Exhibit 5. Exhibit 6. Exhibit 7. Exhibit 8. Exhibit 9. DHS-FEMA Flood Map National Wetland Inventory Historic Condition Subbasins Current Condition Subbasins Hydraulic Work Map Cross Sections Hydraulic Work Map Roughness Coefficients Hydraulic Work Map Building Obstructions Hydraulic Work Map 1% AEP (100-year) Flood Inundation Extent General Location of Report Recommendation Features Page ii
4 List of Tables Table 1. Table 2. Table 3. Table 4. Table 5. Table 6. Table 7. Table 8. Table 9. Historic Condition Hydrologic Subbasin Parameters Existing Condition Hydrologic Subbasin Parameters 100-Year, 12-hour Event Simulation Result Comparison (Historic vs Design) 100-Year, 12-hour Event Simulation Result Comparison (Design vs As-Built) 100-Year, 12-hour Event Simulation Result Comparison (As-Built vs Design) HEC-RAS Analysis Discharges Cross-Section Naming Correlation Historic Condition Modeling Cross-Section Naming Correlation Current Condition Modeling Summary of Hydraulic Model Profiles and Impacts for 1% AEP Event List of Appendices Appendix A IDNR-Supplied Data Previous Permits along Phillips Ditch Discharge Estimate Calculations along Phillips Ditch Appendix B Precipitation Data Appendix C Hydrologic Model Support Calculations Appendix D Hydraulic Model Support Calculations Appendix E Electronic Data HEC-HMS Hydrologic Models HEC-RAS Hydraulic Models INDOT-Supplied Plans and Calculations IDNR-Supplied Hydraulic Calculations along Phillips Ditch Abonmarche 2016 Field Survey Data Miscellaneous Spreadsheet Support Calculations GIS Support Page iii
5 Phillips Ditch Drainage Study SPRING INTRODUCTION This project was undertaken primarily to assess the causes of flooding conditions for the August 2016 extreme precipitation event, and whether adverse impacts can be directly attributed to recent construction activity within the watershed, including: The historic condition hydrologic model was calibrated to the best available estimate of 100-year discharge. A hydrologic model estimating the current conditions along Phillips Ditch watershed upstream of Ireland Road was prepared A representation of the August 2016 precipitation event was formulated to estimate the response of the watershed to this extreme event Steady State Hydraulic analysis of the Phillips Ditch mainline was performed to estimate the level of inundation to be expected for the 1% AEP (100-year) flooding event. US 31 relocation, Miami Road construction or issues at the American Electric Power site near the US 31 bypass. As part of this Drainage Study, the following were performed: A review of previous drainage studies along Phillips Ditch A hydrologic model estimating the historic conditions (prior to US 31 relocation and recent projects) along Phillips Ditch watershed upstream of Ireland Road was prepared 1.1. REVIEW OF PREVIOUS DRAINAGE STUDIES AND DATA Existing drainage studies for Phillips Ditch from the County were reviewed and evaluated, including studies associated with the US 31 Relocation Project. In addition to Plans and calculations provided by Indiana Department of Transportation (INDOT) directly, the support calculations associated with the regulatory permitting of said project was obtained directly from the Indiana Department of Natural Resources (IDNR). IDNR permitting files also include regulatory discharges for the 1% Annual Exceedance Probability (1% AEP) event (often referred to as the 100-year event). This data is useful for a hydrologic model calibration
6 The State and Federal agencies also provide GIS background data, such as the 2011 condition aerial photography, land use characterization, soil characteristics, stream location layers, and 2011 LiDAR topographic data for the watershed. In order to assess the watershed response to the 2016 precipitation event, it was necessary to estimate the distribution of rainfall during the event, based on available rain gage data. For clarity, note that precipitation depths reported for a given day follow a convention which span portions of two calendar days, starting at 5 a.m. of a noted day until 4:59 a.m. of the next calendar day. So the gage depth precipitation report of 7.69 inches of rain on August 15 was actually from 5 a.m. on August 15, 2017 to 4:59 a.m. on August 16, FIELD INVESTIGATION A field investigation of Phillips Ditch was performed to verify hydraulic structure (pipe culverts and bridges) size and inverts along the Phillips Ditch mainline. Starting at Ireland Road, a survey crew measured the visible mainline hydraulic structures upstream to Roosevelt Road HYDROLOGIC MODELING The watershed limits were determined using GIS software for the 2011 LiDAR topographic data. The watershed was subdivided into relevant subbasins using points of interest and generally accepted modeling techniques regarding the relative size of subbasins within a hydrologic model. Hydrologic parameters were established for the watershed conditions that existed prior to the US 31 relocation project as the basis for the hydrologic base model. This model shall be referred to as the historic condition hydrologic model for the purposes of this report. Information from the Plans, calculations and support data for the US 31 and Miami Road projects were reviewed to assess impacts to the historic condition hydrologic model. Detention basins for the US 31 relocation project were incorporated into the current condition hydrologic model. The estimation of conditions resulting from the planned detention facility operations by the INDOT Consultant is referred to as the design condition hydrologic model. Updates to the Design condition hydrologic model incorporating field survey of the as-constructed INDOT detention facilities are referred to as the existing condition hydrologic model or current condition hydrologic model for the purposes of this report. The terms existing condition hydrologic model and current condition hydrologic model are to be considered synonymous for the purposes of this report HYDRAULIC MODELING The regulatory data available includes hydraulic models vetted by IDNR for a portion of Phillips Ditch before and after the US 31 relocation project. This hydraulic modeling does not address potential impacts to peak discharges along Phillips Ditch as a result of the US 31 relocation project. Discharge impacts are addressed in the hydrologic modeling performed as part of this drainage study. In addition, the available hydraulic modeling was extended both upstream and downstream from the portion reviewed by the IDNR, so as to include the entire reach of Phillips Ditch from Ireland Road to Roosevelt Road
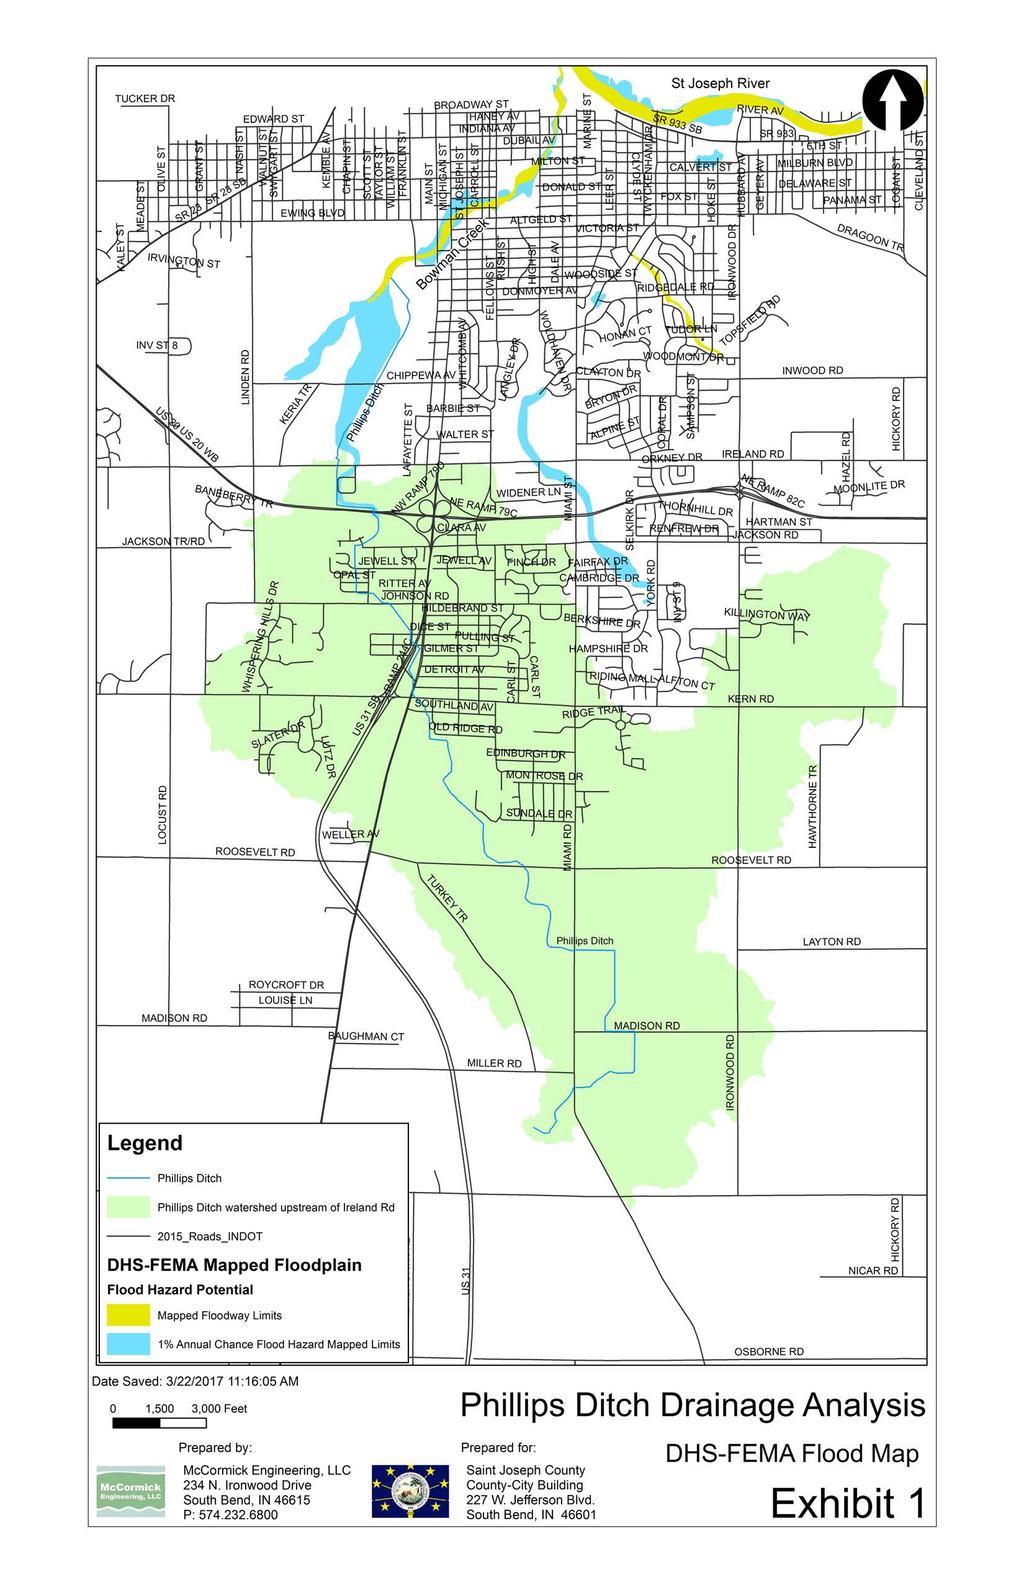
7 1.5. EVALUATION OF IMPACTS This report includes: 1. A summary of information obtained from previous studies and the results of hydrologic and hydraulic analyses. 2. An estimate of construction impacts on the peak discharges and hydraulic flood profiles for the 1% AEP event, as well as the peak discharge impacts of the August 2016 storm event. 2. REVIEW OF PREVIOUS DRAINAGE STUDIES AND DATA 2.1. PREVIOUS STUDIES PROVIDED BY THE COUNTY The following studies were used as reference to better understand the history of the watershed. Design Memorandum Phillips Ditch Improvements by Lawson Associates, December Included structure and channel inventory with photos. Design Alternatives Summary Phillips Ditch Hydraulic/Economic Study by Lawson Associates, Drainage Study for Master Plan Area of Jackson Road, Miami Road, Johnson Road and Phillips Ditch, by Lawson-Fisher Associates, The study included the areas of Jewell Street, Forest Park and South Land including detention basins, culverts and recommendations. In addition to these three studies, historic drainage surveys of residents subject to flooding in Forest Park from 1988 and several newspaper articles demonstrate that there has been some level of concern about flooding along Phillips Ditch for several decades FEDERAL STUDIES The Department of Homeland Security Federal Emergency Management Agency (DHS-FEMA) establishes maps of areas subject to inundation by flooding. These areas are designated as Special Flood Hazard Areas (SFHA). The Flood Disaster Protection Act of 1973 made the purchase of flood insurance mandatory for the protection of property located in Special Flood Hazard Areas (FEMA, 2016). In addition to insurance for individual homeowners, participation in the Federal program results in increased opportunities for disaster relief funding for bridges and highways to the local agencies. In this particular case, the official mapping of SFHA boundaries along Phillips Ditch extends only a short distance upstream of the St. Joseph Valley Parkway, also known locally as the US 20 Bypass, as shown in Exhibit 1. A significant number of residential structures, damaged during the August 2016 event, exist along the Phillips Ditch mainline upstream of this location, including the Jewell Woods and Jewell Park neighborhoods. Although it is beyond the scope of the current study, consideration might be given in the future to extending the official SFHA mapping upstream to include the full extent of Phillips Ditch
8 2.3. IDNR-SUPPLIED STUDIES The IDNR acts as the State parallel representative to the Federal DHS-FEMA agency in protecting development within SFHA. Regardless of whether SFHA mapping exists for a particular area, IDNR is charged by the State under 312 IAC 10 with regulating waterways having a drainage area of at least one square mile (Indiana Administrative Code, 2014). The IDNR governs a portion of the area inundated by the 1% AEP (100-year flood) known as the floodway for watersheds with drainage areas greater than one square mile, regardless of Federal SFHA mapping extents. The construction permit for work within the floodway of watercourses governed by the IDNR is known as the Construction in a Floodway (CIF) Permit. The INDOT consultant submitted for a CIF in accordance with State law for the relocation of US 31. This included detailed modelling of the hydraulic response of Phillips Ditch to specific discharges prior to and after work along Phillips Ditch. The hydraulic calculations submitted by INDOT to IDNR as part of the US 31 Relocation Project, as well as well as those submitted in support of a culvert extension at the American Electric Power site near the US 20 Bypass, are included in electronic form as part of Appendix E. IDNR generally has jurisdiction over the official 1% AEP (100-year) discharge. Along Phillips Ditch, IDNR has performed two 1% AEP discharge determinations. This information is provided in Appendix A. The first request is part of IDNR File BQ-23088, dated July 28, 2008, at a point along Phillips Ditch approximately 1300 feet downstream of the Old US 31 crossing. The support calculations show that eight methods were used to estimate the discharge. With calculated estimates ranging from 294 cubic feet per second (cfs) to 1833 cfs, IDNR ultimately determined an official 1% AEP discharge of 650 cfs for the site. The second request is part of IDNR file BQ-23127, dated August 12, 2008 at the US 20 Bypass crossing. IDNR based the official regulatory discharge of 750 cfs at this site on the relative drainage area compared to the previous noted site. Ultimately, with no direct stream gage data to analyze or corroborate the IDNR results, this data point of 650 cfs is the best available calibration point for the historic condition hydrologic model of this drainage study. Neither the IDNR nor INDOT performed hydrologic analyses of the overall watershed similar to those in this report to assess US 31 relocation project impacts on discharges. Included in the INDOT drainage calculations is an exhibit of drainage patterns. This was accepted to define the general flow patterns associated with the US 31 vicinity, including the direction of the historicconditions of clover-leaf ramp areas on the east side of the US 31 bypass INDOT-SUPPLIED US 31 PLANS AND CALCULATIONS In response to a Records Request to INDOT by the County, INDOT supplied the extensive information provided as part of Appendix E. This includes Plans and final regulatory permits for the US 31 relocation projects. For reference, US 31 relocation work within the Phillips Ditch watershed is generally - 4 -
9 contained within the following INDOT contract number files: Contract Contract Contract Contract The Section Water Quality Certification from IDEM is designated as IDEM No EMP-A, dated October 28, The US Army Corps of Engineers permit, including wetland mitigation requirements, is designated as LRE S08, dated March 5, The IDNR CIF permit is designated as FW-26399, dated January 3, The hydrologic calculations prepared by the INDOT consultant includes the construction of five localized detention basins along the relocated US 31 corridor: Near Kern Road (called Area S) North of Jackson Rd (called Area N) South of Johnson Road (in three basins called M1, M2 and M3) The INDOT calculations generally indicate that the detention areas are intended to offset or compensate for adverse increases in localized discharges from impacted areas that are not detained. However, a watershed analysis including all offsite areas along Phillips Ditch was not performed as part of the INDOT study. The effects of the INDOT detention basins are included in the existing condition hydrologic model. In areas where INDOT provided no detention, the current study rejects the approach of the INDOT consultant to limit impact analysis to the areas immediately adjacent to the roadway location in favor of the watershed approach provided in this study. The proposed INDOT roadway alignments were used to estimate the amount of additional impervious areas of runoff as a result of the relocated US 31 for existing condition hydrologic analysis MIAMI ROAD PROJECT As part of this study, McCormick Engineering was able to review the 2011 aerial photographs and to estimate additional impervious areas of runoff as a result of the Miami Road widening and improvements within the watershed from approximately Johnson Road to a few hundred feet south of Kern Road SOUTHFIELD LAKE DAM The drainage area upstream of Southfield Lake Dam appears to include significant wetland storage. This impoundment was included in the analysis based on the GIS resource estimates of elevationarea curves and field estimated elevations of the impoundment outfall structures AMERICAN ELECTRIC POWER STRUCTURE An extension to a culvert crossing of the mainline on Phillips Ditch at what would be the extension of Jackson Road (immediately upstream of the American Electric Power site) was submitted to IDNR in Based on field survey, it does not appear that this regulatory permit to extend the culvert was actually implemented, but did include - 5 -
10 information related to the American Electric Power culvert that washed out during the August 2016 storm event. This permit information, noted as IDNR file number FW-25080, is included in the information provided in Appendix A. During the August 2016 rainfall event, there is anecdotal evidence that a farm gate was carried downstream to this culvert and caused a partial blockage of the culvert opening. This culvert and associated access road were completely washed out by the storm event. The complete blockage of a culvert would normally have high potential to cause adverse impacts upstream of the blockage. In this particular case, however, the downstream culvert at Saint Joseph Valley Parkway (US 20 Bypass) causes the American Electric Power culvert embankment to be fully submerged for the 1% AEP design rainfall event and more extreme events, such as was experienced in the watershed in August of PRECIPITATION DATA There are no known precipitation gages within the Phillips Ditch watershed that would provide an estimate of the rainfall distribution during the August 2016 rainfall event. However, there is an official National Oceanic and Atmospheric Administration (NOAA) precipitation gage at the South Bend International Airport. The records for this NOAA gage indicate the following rainfall depths for the event: August 12 th : 1.40 August 13 th : 0.78 August 14 th : trace August 15 th : 7.69 August 16 th : 0.80 Of the inches of total gaged precipitation noted, 8.5 inches of this occurred in the 19 hour period between 4pm EST on August 15 th and 11 am EST on August 16 th. The 2.18 inches of rainfall on August th could be considered a separate event from the significant rainfall on August 15 th. However, this precursor storm would serve to pre-wet the soil, and possibly reduce the absorption capacity of the soil for the event beginning on August 15 th. Therefore, the dates of August 12 th -August 16 th was treated as a single event for the August 2016 simulation. The calculations associated with the distribution of this inches of rainfall over these five days is provided in Appendix B. It is known that rainfall depth probability is closely tied to storm duration. For example, four inches of precipitation occurring steadily over a three day period would produce a significantly different watershed response than those same four inches occurring in a half hour period. The probability of various precipitation depths as a function of time are addressed in a publication known as B71B (Huff & Angel, 1992) and more recently in NOAA Atlas 14 (Bonnin, et al., 2006). Running storm events of various durations with the same level of AEP (example 1% annual chance of a storm of equal or greater precipitation for a given duration) allows for the analysis of critical duration. While the concept of critical duration is simply the storm event that produces the greatest peak runoff for a given AEP, the subject can become complicated by the effects of storage and whether the critical duration is evaluated at a single or multiple locations within the watershed
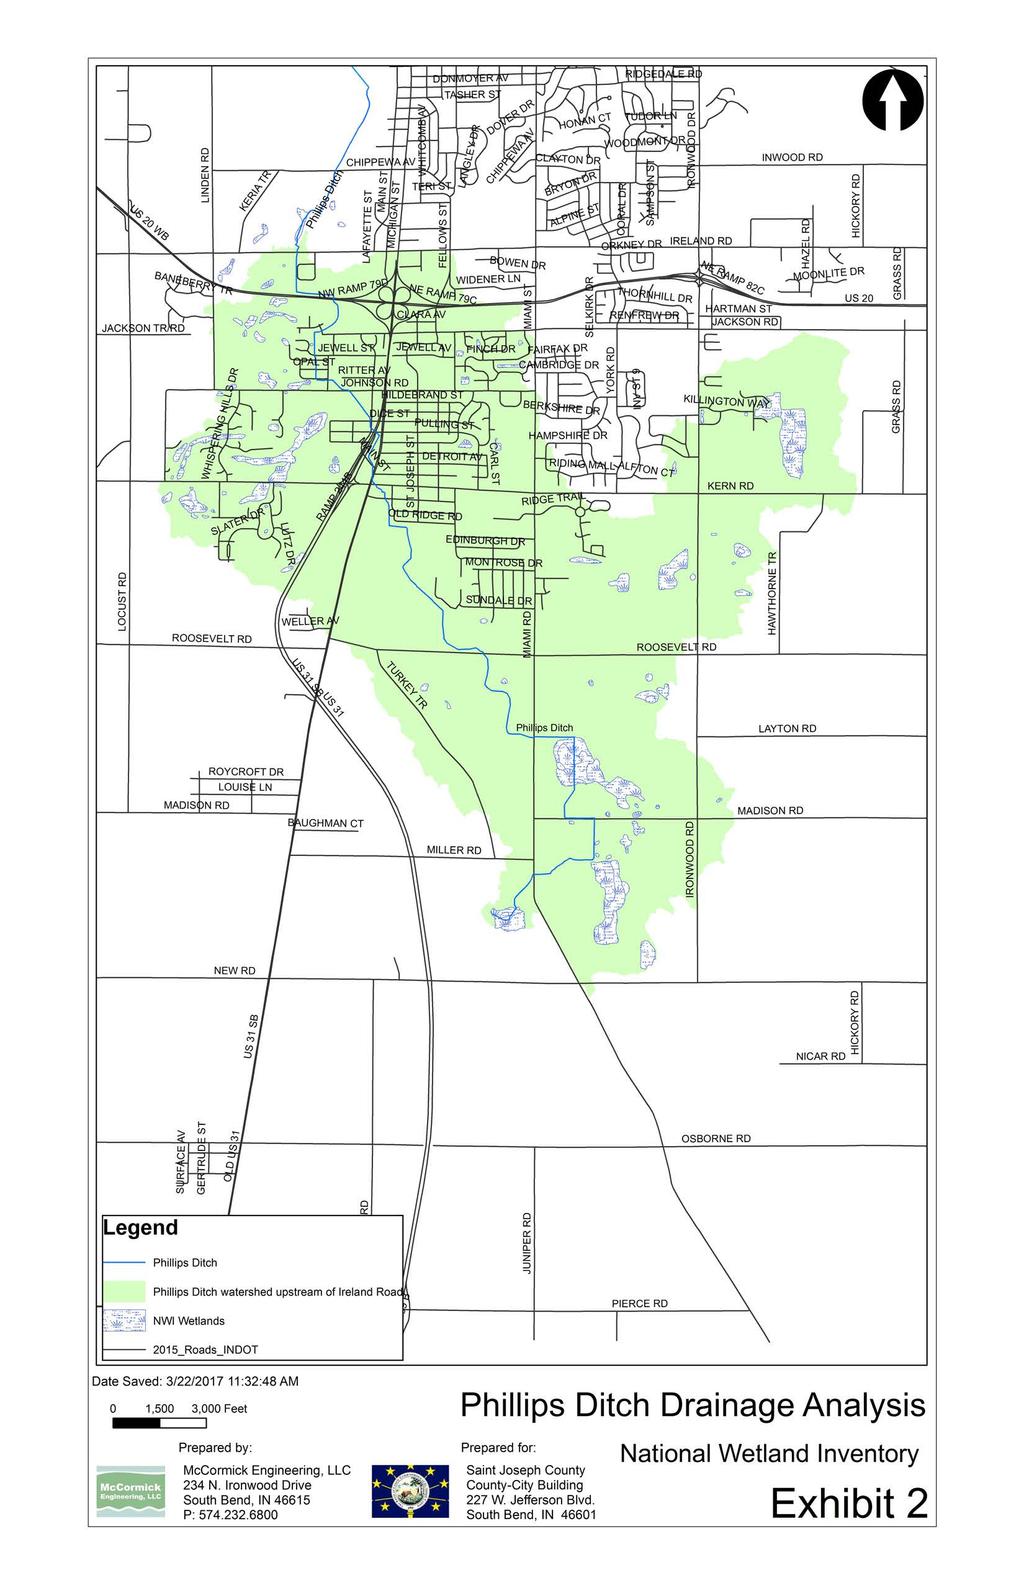
11 For this particular study, the following design storm durations were analysed for the 1% AEP (100-year) storm event: 6 hour, NOAA Q1 6-hour curve 12 hour, NOAA Q1 12-hour curve 24 hour, NOAA Q1 24-hour curve 96 hour, NOAA Q1 96-hour curve For the purposes of calibration, the critical duration was analysed at the IDNR regulatory discharge point discussed in Section 2.3. The selected NOAA Atlas 14 rainfall depth and distribution patterns are just one design method available for hydrologic analyses. These rainfall depths were chosen over the traditional standard of B71 depths because the NOAA Atlas 14 is a much more recent publication. INDOT has adopted the general use of NOAA Atlas 14 into their Design Manual, and the detention calculations from INDOT are based on NOAA Atlas 14 precipitation depths. As an example of the magnitude of difference, the NOAA Atlas 14 rainfall depth is 6.28 inches for a 24- hour storm event. The same duration-frequency depth for the B71 distribution is 7.12 inches of rainfall. 3. HYDROLOGIC MODELING 3.1. TREATMENT OF EXISTING STORAGE WITHIN WATERSHED The IDNR will not accept a discharge that is based on the effect of detention basins that are not approved as flood control projects under IC and that are not operated and maintained by a government entity in perpetuity. This includes the majority of subdivision detention basins. If a project is approved as a flood control structure under IC , then the effect of the storage caused by the structure can be included in the hydrologic model all routed discharges should be reviewed by the IDNR and approved through the coordination procedure before they are used in a FIS or any other study requiring IDNR approval. (Indiana Department of Natural Resources, 2002) There are several existing storage locations upstream of potentially restrictive structures that should be considered in the hydrologic model for the current drainage study. Exhibit 2 shows some extensive wetlands in the headwaters of the overall watershed. Neglecting the storage effects within these areas could lead to overestimation of discharges that would be difficult to adjust by calibration. The primary purpose of the hydrologic modeling associated with this drainage study is not to adhere to IDNR policy for potential SFHA remapping, but is to provide a more realistic estimate of the watershed response to extreme rainfall than was available prior to this drainage study. This IDNR detention storage policy is noted to simply point out a potential future obstacle or hurdle that might need to be addressed if the modelling performed under this study was considered for IDNR acceptance or concurrence. Under that scenario, the modelling would need to be revised to provide reasonable discharge estimates without some or all of the detention storage included in this study or the submitting authority would need to perform the necessary steps for IDNR to accept the modeled detention storage as being adequately - 7 -
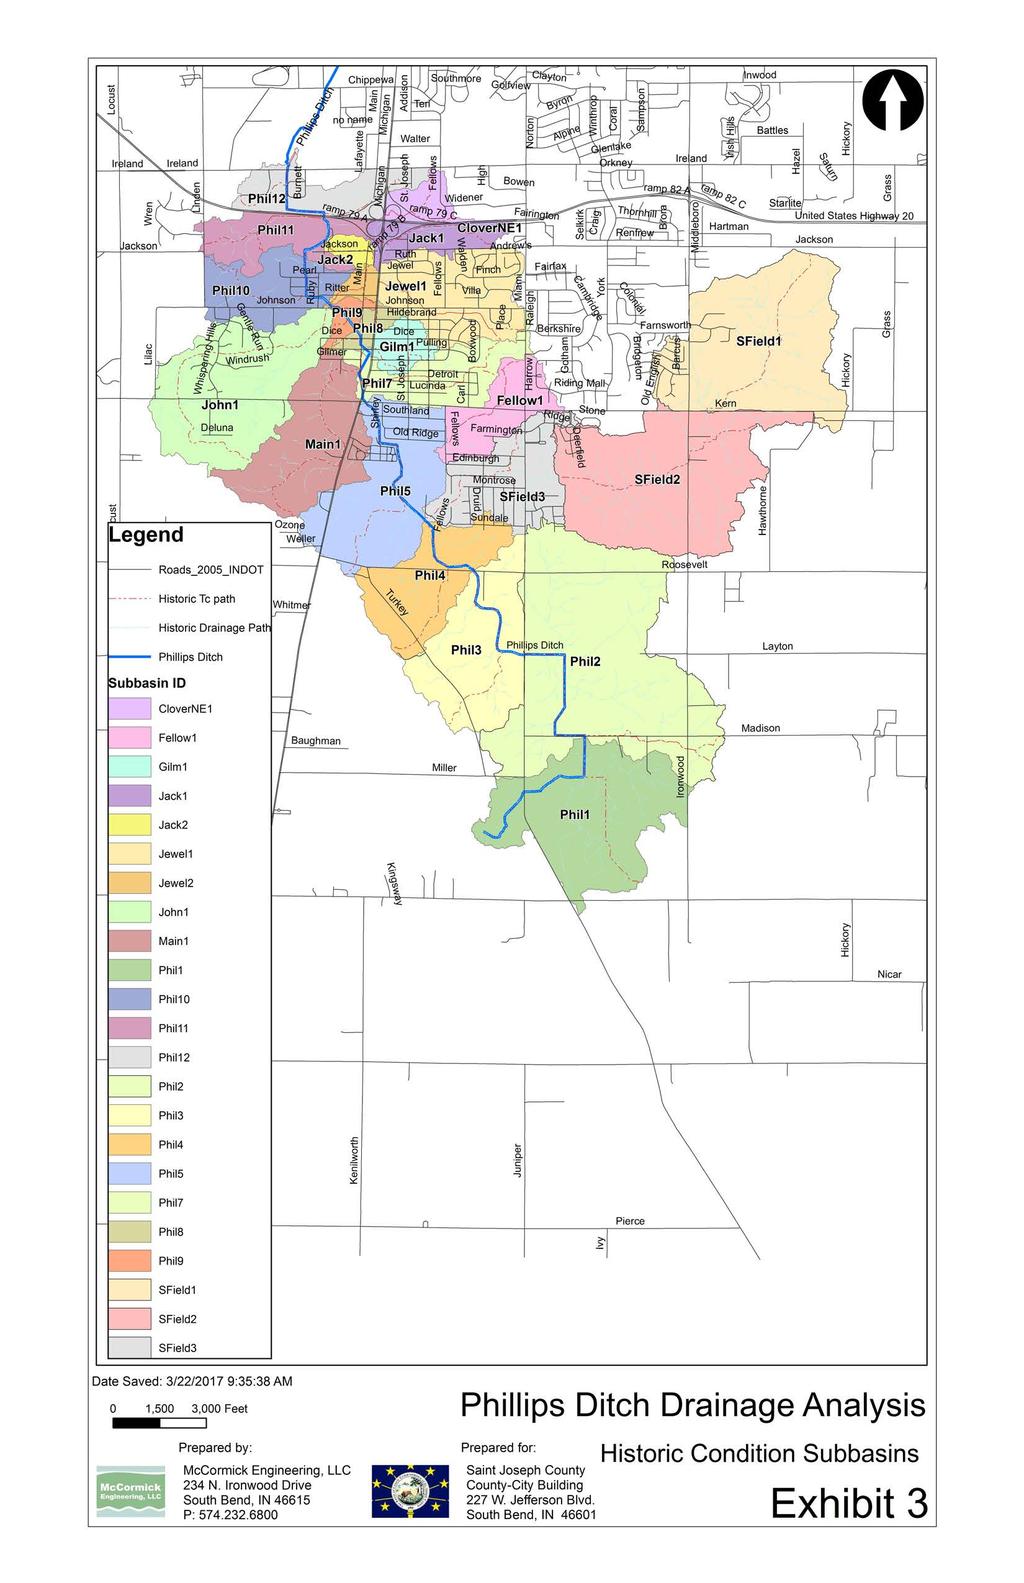
12 protected from modification for inclusion in some future IDNR submittal MODEL DISCHARGE CALIBRATION As noted in Section 2.3, the calibration discharge point for the hydrologic model is 650 cfs for the 1% AEP at a point approximately 1300 feet downstream of the Old US 31 crossing. This request was made for watershed conditions prior to the relocation of US 31, and would therefore inherently apply to the historic condition hydrologic model, rather than the existing condition hydrologic model. A secondary point for comparison is just upstream of the St. Joseph Valley Parkway (US 20) crossing, where the IDNR recommended a 1% AEP (100-year) discharge of 750 cfs based upon the relation of the contributing area to that of the primary calibration point. For the purposes of this study, the hydrologic model was calibrated by applying a calibration factor uniformly to all calculated time-of-concentrations. A hydrologic model represents a simplification of actual field conditions. For example, standard practice for the Soil Conservation Service (SCS) Curve Number methodology assumes that varying soil conditions and land uses within a subbasin can be effectively weight averaged if the variation is homogeneous across the subbasin. There are also inherent complications with the potential effects of groundwater, but these are often ignored for peak discharge determination because of the slower response time of groundwater discharges compared to peak surface water discharges. Within the same location, there can be seasonal variation in the response of the watershed. For example, the watershed will likely respond differently to precipitation during the height of the growing season than during winter when the ground is frozen. Therefore, even the calibrated historic condition model should be considered as the interpretation of the average condition watershed response to precipitation, rather than as an absolute determination of response HISTORIC CONDITION HYDROLOGIC MODEL Indiana is fortunate to have public domain Statewide LiDAR data at roughly 5-foot spacing for all 92 Counties. In St. Joseph County, the LiDAR elevation data was captured in 2011, prior to the relocation of US 31. This elevation data for the watershed was downloaded in raster Digital Elevation Map (DEM) format from the OpenTopography Website (Indiana Geograpic Information Office, 2016). Due to the large storage and computational requirements of the original data, the original raster was resampled to a 10-foot cell resolution. The National Hydrography Dataset (NHD) local-resolution layers were downloaded to establish approximate locations of (historic) flow paths (Indiana Geographic Information Council, 2013). ArcMap (version ) was used to delineate the (historic condition) watershed for Phillips Ditch. The historic base model does not include the effects of the US 31 relocation Project, as the DEM and stream data layers used to perform the analysis were prepared prior to this project. The overall watershed was further divided into several subbasins at strategic flow point - 8 -
13 determination locations using the same GIS software. The historic condition watershed and subbasins are shown in Exhibit 3. Within the boundaries of four subbasins, potential restrictive outlet culverts at wetlands were field surveyed for inclusion in the hydrologic modeling. These include: Culvert crossing of Madison Road from wetland in subbasin Phil1 Culvert crossing of Miami Road from wetland in subbasin Phil2 Culvert crossing of Johnson Road from wetland in subbasin John1 Dam culverts and spillway outlet from Southfield Lake in subbasin SField2 Using GIS, the elevation-area relationship for potential inundation of the wetlands within these particular subbasins were estimated from the DEM. The HY-8 program was used to estimate the discharge-elevation relationships at these same locations. The background data associated with these storage locations is provided in Appendix C. A description of the subbasins is as follows: SField1 drainage to unnamed tributary upstream of Kern Road crossing SField2 incremental drainage area along unnamed tributary to the outlet of the Southfield Lake Dam outlet SField3 incremental drainage area downstream of Southfield Lake to confluence with Phillips Ditch mainline Phil1 Phillips Ditch mainline drainage area upstream of Madison Road Phil2 incremental Phillips Ditch mainline drainage area upstream of Miami Road Phil3 incremental Phillips Ditch mainline drainage area upstream of Roosevelt Road Phil4 incremental Phillips Ditch mainline tributary area to confluence with unnamed tributary area Fellow1 - drainage to unnamed tributary upstream of Fellow Street (outlets through McCracken subdivision) Phil5 - incremental Phillips Ditch mainline tributary area upstream of Kern Road Phil7 - incremental Phillips Ditch mainline tributary area to IDNR discharge calibration location Main1 - drainage to unnamed tributary upstream of historic Main Street confluence Gilm1 - drainage to unnamed tributary from Gilmer Street vicinity Phil8 - incremental Phillips Ditch mainline tributary area Phil9 - incremental Phillips Ditch mainline tributary area to confluence with unnamed tributaries near Johnson Road John1 - drainage to an unnamed tributary upstream of Johnson Road Jewel1 - drainage to an unnamed tributary upstream of Jewel Road crossing of Old US 31 Jewel2 incremental drainage to an unnamed tributary to confluence with Phillips Ditch mainline Phil10 - incremental Phillips Ditch mainline tributary area to point upstream of Jackson Road Jack1 - drainage to an unnamed tributary along Jackson Road at confluence of - 9 -
14 drainage from southern cloverleaves of US 20 bypass. Modeled as draining through subbasin Phil11 based upon INDOT flow path exhibit of area Jack2 incremental drainage to an unnamed tributary along Jackson Road at confluence with Phillips Ditch mainline Phil11 - incremental Phillips Ditch mainline tributary area to upstream of US 20 Bypass CloverNE1 drainage area to northeast cloverleaf of US 20 Bypass. Modeled as draining through subbasin Phil12 based upon INDOT flow path exhibit of area Phil12 - incremental Phillips Ditch mainline tributary area to upstream of Ireland Road The current study extends downstream to the Ireland Road crossing for the purpose of including potential impacts at the limits of County jurisdiction near the US 20 Bypass. The NHD flowline path at Ireland Road follows the roadway overtopping path at Ireland Road, rather than the mainline of Phillips Ditch. The delineation of subbasin Phil12 was adjusted based on the topographic contours associated with the 2011 condition LiDAR data to reflect the drainage area upstream of the Ireland Road culvert, as this is the maximum flow that would be routed through the culvert crossing during the hydraulic analysis. Land Use, Soil Conditions, Curve Numbers and Time of Concentrations were estimated using available GIS data for historic conditions. Channel routing between subbasins were incorporated using a lag technique. Basic subbasin parameters are shown in Table 1. The precipitation and hydrologic data was input into the HEC-HMS (version 4.2) program, with the model included in Appendix E. The node at J-7 is intended to represent the IDNR discharge calibration location. The historic condition HEC-HMS mode was calibrated to produce a critical discharge of 650 cfs at node J-7, to be consistent with the IDNR regulatory discharge. This was accomplished by uniformly adjusting the factor used to relate calculated time of concentration to lag time. For small watersheds, this conversion factor is often initially assumed to be 0.6. However, the calibration of lag times in the model resulted in a calibration factor of 4.0. The critical duration at node J-7 for the four storm duration simulations considered (6-hr, 12-hr, 24-hr and 96-hr) was the 12-hour event, with a simulated peak discharge of cfs for the 1% AEP (100- yr) event. The calibrated 1% AEP discharge is within 0.3% of the target IDNR regulatory discharge. At the secondary calibration location (US 20 crossing, node J-14), the historic condition hydrologic model produced a 100-year, 12-hour discharge of 842 cfs, which is significantly higher than the recommended discharge of 750 cfs by IDNR at this secondary location. Because the IDNR discharge recommendation at this secondary location was based purely upon an exponential ratio of the corresponding drainage areas, the nearly 12% difference at this secondary calibration point is not unexpected
15 TABLE 1 Historic Condition Hydrologic Parameters Calib. Subbasin Area SCS Tc est. Lag Time ID Mi2 CN Minutes Minutes CloverNE Fellow Gilm Jack Jack Jewel Jewel John Main Phil Phil Phil Phil Phil Phil Phil Phil Phil Phil Phil SField SField SField TOTAL STORAGE EFFECTS WITHIN THE HISTORIC CONDITION HYDROLOGIC MODEL The discharge reduction effects for the 100-year 12- hour duration storm at the four storage locations considered for inclusion in the hydrologic modeling are shown in Figures 1-4. In the lower portion of Figures 1-4, the dashed line represents the inflow hydrograph to the storage facility, while the solid line represents the outflow from the facility. The wetland storages upstream of Madison Road and Roosevelt Road have a significant effect on reducing discharges, protecting downstream reaches from increased flooding. In contrast, the Southfield Lake Dam and the wetlands along the Johnson Road tributary appear to be virtually ineffective in reducing peak discharges for the 1% AEP (100- year) storm in question. In the case of the Southfield Lake Dam, it is at least possible that the actual storage is greater than modeled if construction of the dam included excavation of storage after the effective date of the LiDAR elevation contour data. The storage results have significant policy implications for the protection of residents and facilities along Phillips Ditch. Theoretically, the existing wetland storage should not be filled without a regulatory permit from the US Army Corps of Engineers and the Indiana Department of Environmental Management. This consideration may or may not satisfy the general policies of the IDNR if there was ever a need or desire for the IDNR to review the hydrologic modeling of this report. Just as important is the future treatment of the crossings associated with these locations at Madison Road and Miami Road (south of Roosevelt Road). If these structures were to be enlarged, for example, the storage effects would be reduced and peak discharges might be increased downstream along Phillips Ditch. Therefore, special consideration should be given to the size and configuration of future replacement of these two crossings
16 Figure 1. Storage Effects of Wetlands Upstream of Madison Road Crossing Figure 4. Storage Effects of Wetlands Upstream of Johnson Road tributary Crossing 3.5. CURRENT CONDITION HYDROLOGIC MODEL As-Designed Conditions Figure 2. Storage Effects of Wetlands Upstream of Roosevelt Road Crossing Figure 3. Storage Effects of Wetlands Upstream of Southfield Lake Dam The hydrologic calculations prepared by the INDOT consultant includes subbasins for detention facilities constructed as part of the US 31 Relocation Project, as well as calculations for undetained areas. In areas where INDOT provided no detention for increased impervious surface, the INDOT calculations appear to be based on hypothetical boundaries of roadway impacts, rather than a true analysis of all tributary areas draining to a given location. As such, the INDOT calculations in these undetained areas cannot be verified or fully duplicated by a traditional watershed analysis based on topographic characteristics. For this study, a different approach was taken than the INDOT consultant in the random locations identified by the INDOT consultant as undetained. The hard surface associated with the US 31 relocation project and Miami Road widening projects were digitized based upon best available information. This
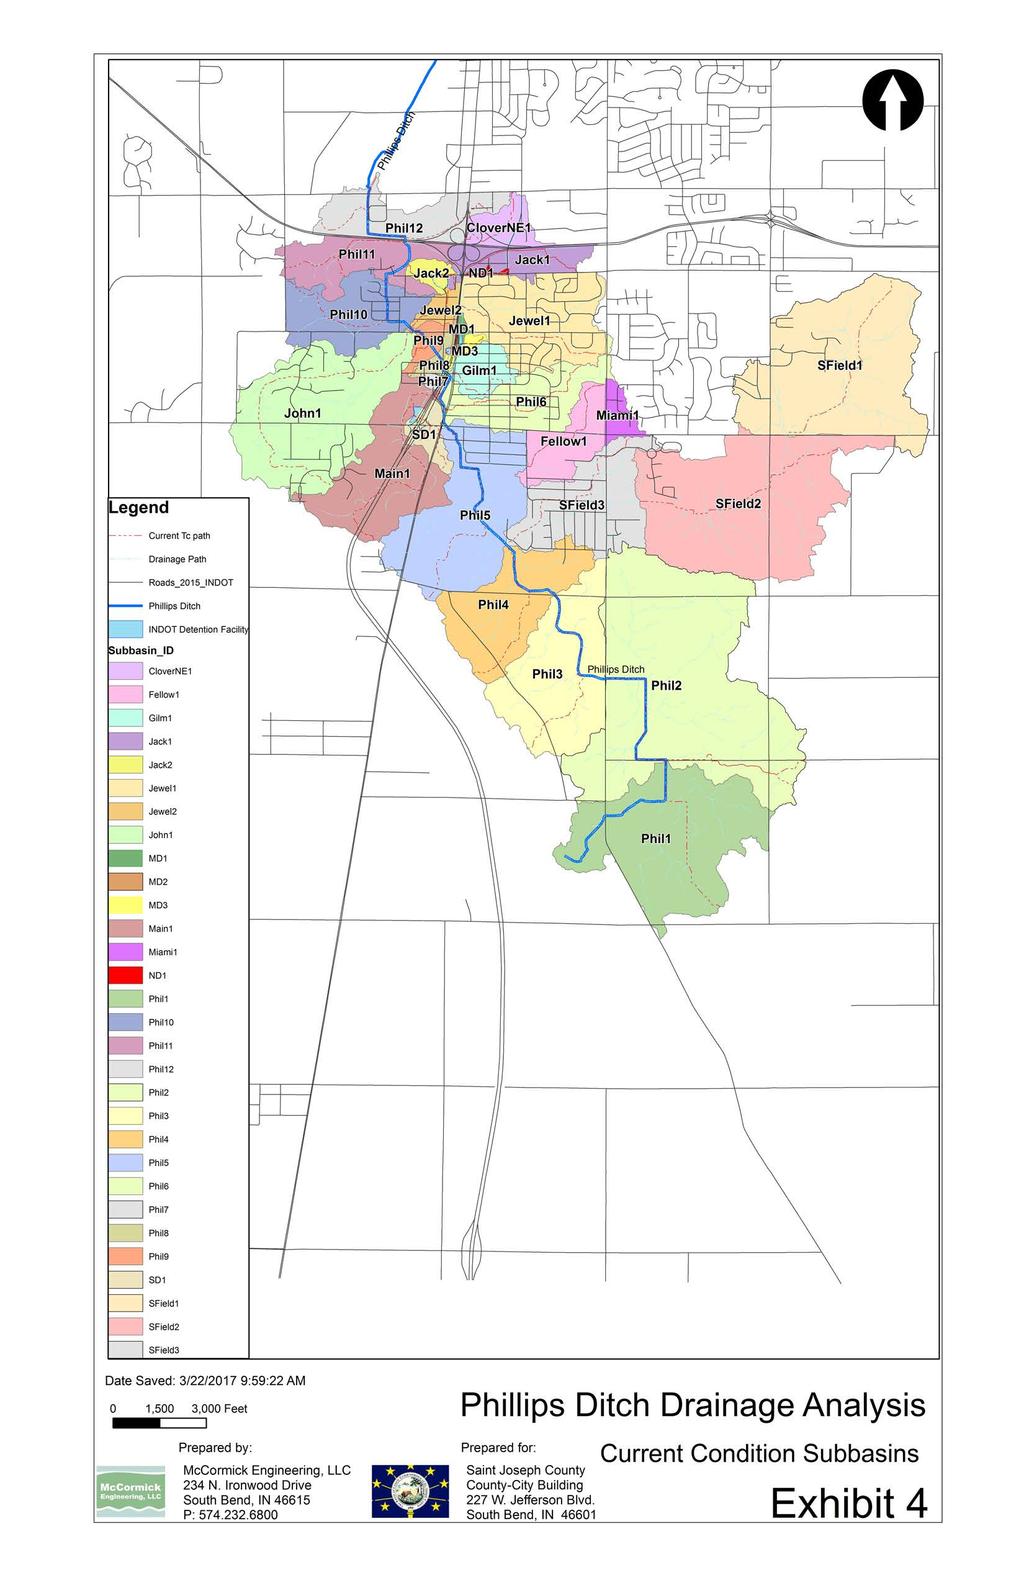
17 increase in impervious area was updated into the land use characteristics for the respective subbasin, affecting the Curve Number for that subbasin. The INDOT Plan has provisions for the construction of five localized detention basins along the relocated US 31 corridor: Near Kern Road (called Area S) North of Jackson Rd (called Area N) South of Johnson Road (in three basins called M1, M2 and M3) The effects of the INDOT detention basins are included in the existing condition hydrologic model. The locations for these five detention basins were field surveyed. The detention subbasin boundaries were generally accepted, with the exception of a slight revision to the drainage area to basin M3 for consistency with the historic model drainage patterns. The current condition hydrologic model subbasins are shown in Exhibit 4. The following subbasins were modified in the analysis of existing conditions to reflect changes to the watershed since the historic condition hydrologic model: Main1 a portion of this subbasin has been attributed to new subbasin SD1 to reflect the INDOT detention basin S1. Land use (and CN) affected by additional impervious surface. Fellow1 - This basin was subdivided to reflect the redirection of Miami Road discharges to the south as part of the Miami Road widening project. Areas along the original flow path continue to be designated as Fellow1, with the change in drainage patterns reflected in the new subbasin Miami1. CN for Fellow1 and Miami1 was recalculated based upon the subdivision of the original subbasin. Subbasin Miami1 was directed to pass through subbasin SField3 as reflection of the newly installed curb and gutter along the Miami Road widening project. Phil7 This basin was subdivided to reflect the relocation of the Phillips Ditch channel in the vicinity. Areas east of the relocated Phillips Ditch are now designated as Phil6, with the remnant drainage west of the relocated US 31 as subbasin Phil7. Land use (and CN) in both Phil6 and Phil7 affected by additional impervious surface. Gilm1 The outfall location for this basin was adjusted slightly to reflect the location of the new culvert under the relocated US 31. Boundary affected slightly by the inclusion of subbasin MD3. Land use (and CN) affected by additional impervious surface. Phil8 - a portion of this subbasin has been attributed to new subbasins MD1, MD2 and MD3 to reflect the INDOT detention basins M1, M2 and M3. Land use (and CN) affected by additional impervious surface. Phil9 - Land use (and CN) affected by additional impervious surface. Boundary between Phil9 and Jewel2 affected by new roadside ditch on west side of relocated US 31 and work near Jackson Rd. Jewel1 Delineation affected by roadside ditch on east side of relocated US 31. Land use (and CN) affected by additional impervious surface
18 Jewel2 - Land use (and CN) affected by additional impervious surface. Boundary between Phil9 and Jewel2 affected by new roadside ditch on west side of relocated US 31. Jack1 a portion of this subbasin has been attributed to new subbasin ND1 to reflect the INDOT detention basin N1. Delineation also affected by US 31 relocation work near Jackson Rd Bridge, as well as ditch work on both sides of relocated US 31 south of Jackson Rd. Land use (and CN) affected by additional impervious surface. Jack2 - Land use (and CN) affected by additional impervious surface. Delineation affected by US 31 relocation work near Jackson Rd Bridge. CloverNE1 - Land use (and CN) affected by additional impervious surface. New subbasin ND1 added to reflect the INDOT basin N1. Area, rounded CN, and lag taken directly from INDOT inputs for then proposed area N. New subbasin MD1 added to reflect the INDOT basin M1. Area, rounded CN, and lag taken directly from INDOT inputs for then proposed area M1. New subbasin MD2 added to reflect the INDOT basin M2. Area, rounded CN, and lag taken directly from INDOT inputs for then proposed area M2. New subbasin MD3 added to reflect the INDOT basin M3. Rounded CN, and lag taken directly from INDOT inputs for then proposed area M3. Area adjusted slightly from INDOT calculations to reflect additional tributary to east, based on historic subbasin boundary estimations. New subbasin SD1 added to reflect the INDOT basin S. Area, rounded CN, and lag taken directly from INDOT inputs for then proposed area S. Area adjusted significantly from INDOT calculations to reflect additional tributary to east, based on historic subbasin boundary estimations. An updated Digital Elevation Model (DEM) reflecting the elevation changes to the watershed as a result of the elevated roadway profile feature associated with the relocated US 31 is not available at this time. For the watershed divide impacts to individual subbasins, the relocated US 31 alignment was generally used as a subbasin boundary, with the exception of subbasin Main1, where the subbasin was not further subdivided due to an interconnecting pipe installed as part of the US 31 relocation project. The INDOT drainage pattern exhibit associated with the drainage calculations was used to digitize the new ditches and flow paths associated with the relocation project. The roadway subbasins from the relocation project were used in conjunction with the new flow paths to estimate the current drainage subbasins. Travel times associated with reach routing were updated based on the new drainage patterns. Elevation-Area relationships for the INDOT ponds were digitized from the INDOT Plans. Elevation-Discharge curves were established based upon the orifice sizes on the Plans for
19 these facilities. Significant differences in the elevation-discharge relationships were found from the calculations provided by the INDOT consultant. For example, at the peak elevations tabulated by the INDOT Consultant for the detention facilities: Pond N1 INDOT tabulated maximum discharge 0.9 cfs at a water depth of 3.82 ft. Calculated discharge was for a 9 Hx3 W orifice at water surface elevation (3.82 feet above pond bottom). A standard orifice calculation at the noted size, and inverts and head yield a discharge of 1.68 cfs. Pond M1 INDOT tabulated maximum discharge 1.1 cfs at a water depth of 2.54 ft. Calculated discharge was for a 12 Hx4 W orifice at water surface elevation (2.54 feet above pond bottom). A standard orifice calculation at the noted size, and inverts and head yield a discharge of 3.33 cfs. Pond M2 INDOT tabulated maximum discharge 2.6 cfs at a water depth of 3.36 ft. Calculated discharge was for a 15 Hx5 W orifice at water surface elevation (3.36 feet above pond bottom). A standard orifice calculation at the noted size, and inverts and head yield a discharge of 4.15 cfs. Pond M3 INDOT tabulated maximum discharge 5.7 cfs at a water depth of 4.72 ft. Calculated discharge was for an 18 Hx6 W orifice at water surface elevation (4.72 feet above pond bottom). A standard orifice calculation at the noted size, and inverts and head yield a discharge of 7.20 cfs. Pond S1 INDOT tabulated maximum discharge 8.4 cfs at a water depth of 3.93 ft. Calculated discharge was for a 27 Hx5 W orifice at water surface elevation (3.93 feet above pond bottom). A standard orifice calculation at the noted size, and inverts and head yield a discharge of 8.56 cfs. Pond M2 calculations for the elevationarea relationship do not correspond to the Plans. The submitted calculations are based upon a low pond elevation of 792.2, whereas the Plans appear to indicate a low pond elevation of Pond S1 calculations for the elevation-area relationship do not correspond to the Plans. The submitted calculations are based upon a low pond elevation of , whereas the Plans appear to indicate a low pond elevation of The pond contours appear to have been raised one foot from the calculations. In comparison to the historic condition hydrologic model, Curve Numbers and Time of Concentrations were adjusted using available data for the amount of additional hard surface added by the various projects, as well as the INDOT calculations for detained basins MD1, MD2, MD3, ND1 and SD1). Channel routing between subbasins continue to be incorporated using a lag technique, with adjustments to channel lengths based on channel relocations
20 Subbasin boundaries were merged between the historic condition model and the INDOT calculations for detained locations. The resulting boundaries for ponds MD3 and S1 include more contributing area than assumed in the INDOT pond sizing calculations. Basic subbasin parameters are shown in Table 2 below. TABLE 2 Current Condition Hydrologic Parameters Note: Parameters changed from historic conditions model shown in bold. Calib. Subbasin Area SCS Tc est. Lag Time ID Mi2 CN Minutes Minutes CloverNE Fellow Gilm Jack Jack Jewel Jewel John Main MD MD MD Miami ND Phil Phil Phil Phil Phil Phil Phil Phil Phil Phil Calib. Subbasin Area SCS Tc est. Lag Time ID Mi2 CN Minutes Minutes Phil Phil SD SField SField SField As-Built Conditions The as-built/as-constructed conditions for the detention facilities N1. M1, M2, M3 and S1 associated with the relocated US 31 construction were field surveyed to verify compliance of outfall structure configurations and designed storage with the official INDOT Plans for the facilities. Pond N1 Designed pond bottom was elevation Surveyed bottom invert is Plans call for a 9 x3 orifice plate, while it appears that the Contractor substituted a 6 CPP as an equivalent. An example of the changes to the elevation-area relationship for this facility is a planned inundation area of 1.13 acres at elevation 825.0, with an asbuilt inundation of 0.96 acres at the same elevation. Pond M1 Designed pond orifice invert was elevation , with pond bottom at Surveyed pond bottom invert is Plans call for a 12 x4 orifice plate, which appears to have been installed. An example of the changes to the elevation-area relationship for this facility is a planned inundation area of 0.86 acres at elevation 817.0, with an as-built inundation of 0.83 acres at the same elevation
21 Pond M2 Designed pond orifice invert was elevation with pond bottom at same. Surveyed pond bottom invert is Plans call for a 15 x5 orifice plate, while it appears that the Contractor substituted a 10 HDPE as an equivalent. An example of the changes to the elevation-area relationship for this facility is a planned inundation area of 0.42 acres at elevation 799.0, with an as-built inundation of 0.41 acres at the same elevation. Pond M3 Designed pond orifice invert was elevation with pond bottom at same. Surveyed pond bottom invert is Plans call for an 18 x6 orifice plate, which appears to have been installed. An example of the changes to the elevation-area relationship for this facility is a planned inundation area of 0.30 acres at elevation 795.0, with an as-built inundation of 0.34 acres at the same elevation. Pond S1 Designed pond orifice invert was elevation with pond bottom at same. Surveyed pond bottom invert is Plans call for a single 27 x5 orifice to the north, which appears to have been installed. In addition, the plans show a temporary 27 x5 orifice to the west. This temporary orifice connection does not appear to have been removed by the Contractor, resulting in an unplanned permanent discharge to the west under current conditions. An example of the changes to the elevation-area relationship for this facility is a planned inundation area of 2.20 acres at elevation 798.0, with an as-built inundation of 2.20 acres at the same elevation. The elevation-storage and elevation-discharge relationships for the facilities were updated from design conditions to reflect the current storage relationships and outfall configurations for the INDOT storage facilities. The As-Built hydrologic model matches the input of the as-designed hydrologic model with the exception of the elevation-storage-discharge relationships for the INDOT detention facilities. The subbasins for asconstructed conditions remain those provided in Exhibit 4 previously referenced in association with as-designed conditions COMPARISON OF HYDROLOGIC MODEL PEAK DISCHARGES A comparison of the peak discharges for the 1% AEP (100-year, 12-hour event) and August 2016 storm estimation are shown in Tables 3-5. As can be seen in Tables 3, there is minimal impact to peak discharges during the 100-year, 12-hr design event at the noted locations due to changes in the watershed from historic conditions to design conditions. Table 4 indicates the impacts of proposed unplanned construction changes to the INDOT detention facilities. The primary impact of these changes is an increase in discharge on the order of 3-5 cfs in downstream reaches as a primary result of the continued operation of the temporary orifice from pond SD1. As can be seen in Table 5, there are some impacts to peak discharges during the August 2016 simulation at the noted locations due to changes in the watershed from historic conditions. The majority of adverse impacts are on the order of 1%. The most significant impact is along a short reach of tributary downstream of INDOT detention facility SD1 from flow originating from the Main Street
22 underpass, where the impact is significant. The Main Street underpass appears to act as a relief valve for the primary culvert under the relocated US 31 for events more extreme than the 1% AEP event, such as was experienced in August of This flow diversion was added to the existing condition hydrologic model. In the absence of this unplanned overflow path along the Main Street underpass, flooding upstream of the relocated US 31 is anticipated to have been more extensive. The discharge diverted through the Main Street underpass appears to quickly rejoin with the main Phillips Ditch near the outlet of the culvert through the relocated US 31. Hydraulic studies along the main tributaries to Phillips Ditch were not performed as part of this study
23 Table Year, 12-hour Event Simulation Result Comparison (Historic vs As-Designed Conditions) Model Historic Design Location Ref. Area Condition Condition Node mi2 cfs cfs cfs Ireland Road Culvert S US 20 Bypass Crossing J Johnson Rd J Calibration Point J Main Street Tributary R Kern Road J Roosevelt Rd J Table Year, 12-hour Event Simulation Result Comparison (As-Designed vs As-Built) Model Design As-Built Location Ref. Area Condition Condition Node mi2 Cfs cfs Cfs Ireland Road Culvert S US 20 Bypass Crossing J Johnson Rd J Calibration Point J Main Street Tributary R Kern Road J Roosevelt Rd J Table 5 August 2016 Event Simulation Result Comparison (Historic vs As-Built) Model Historic As-Built Location Ref. Area Condition Condition Node mi2 cfs cfs cfs Ireland Road Culvert S US 20 Bypass Crossing J Johnson Rd J Calibration Point J Main Street Tributary R Kern Road J Roosevelt Rd J
24 By comparing the peak discharge results of the August 2016 simulation to that produced from other design events in the model, an order of magnitude for the August 2016 event can be derived. The asbuilt peak discharges for the calibration point (node J-7) are shown below for the August 2016 event, as well as for other design precipitation events (for the previously determined 12-hour critical duration): 1% AEP (100-yr): cfs 0.5% AEP (200-yr): cfs 0.2% AEP (500-yr): cfs 0.1% AEP (1000-yr): cfs August 2016: cfs Each precipitation event is unique, and there are other durations of events that could be reported above. However, these results do mean that the August 2016 storm event is predicted to have exceeded the peak discharges from the design 12- hour, 1000-yr precipitation event, which is the most infrequent precipitation period reported in NOAA Atlas 14. In addition, it can be seen that this extreme event produced peak discharges more than double the 1% AEP (100-year event) discharges STORAGE EFFECTS OF INDOT FACILITIES The discharge reduction effects for the 100-year 12- hour duration storm at the four storage locations considered for inclusion in the hydrologic modeling are shown in Figures 5-9. Flow (CFS) Figure 5. Facility N1 Flow (CFS) Figure 6. Facility M1 Flow (CFS) Time (Hours) As Designed Inflow As Built Inflow As Designed Outflow As Built Outflow Model Storage Effects of INDOT Time (Hours) As Designed Inflow As Built Inflow As Designed Outflow As Built Outflow Model Storage Effects of INDOT Time (Hours) As Designed Inflow As Built Inflow As Designed Outflow As Built Outflow Figure 7. Facility M2 Model Storage Effects of INDOT
25 Flow (CFS) 14 As Designed 12 Inflow 10 As Built Inflow 8 As Designed 6 Outflow 4 As Built Outflow Figure 8. Facility M3 Flow (CFS) Time (Hours) Model Storage Effects of INDOT As Designed Inflow As Built Inflow As Designed Outflow As Built Outflow The as-built detention effects for basin S1 discharges reflect outflow from two orifices rather than the designed condition of a single orifice, as can be seen in Figure 9. The Pond S1 at the southern portion of the US 31 relocation as it relates to Phillips Ditch is modeled with a slightly different drainage area for the current condition hydrologic model than that considered by the INDOT consultant. This expanded area comes from the southeast, based on the LiDAR topography conditions. As it is unclear how the INDOT consultant determined the drainage boundaries to this basin based on available data provided, the best available data would indicate that the expanded historic condition boundary should remain tributary to this basin, thus providing more inflow volume to the basin than considered by the INDOT consultant Time (Hours) Figure 9. Facility S1 Model Storage Effects of INDOT From Figures 5 through 9 above, it can be seen that INDOT basin M3 exhibits a slight spike in the 1% AEP (100-year) outflow discharge that is typically seen in an overtopped facility. This spike is observed for the as-designed conditions outlet works for basin M3. Due to the slight modifications to the interconnected M1, M2 and M3 detention facilities, this overtopping spike is not seen in the as-built modeling for the basin
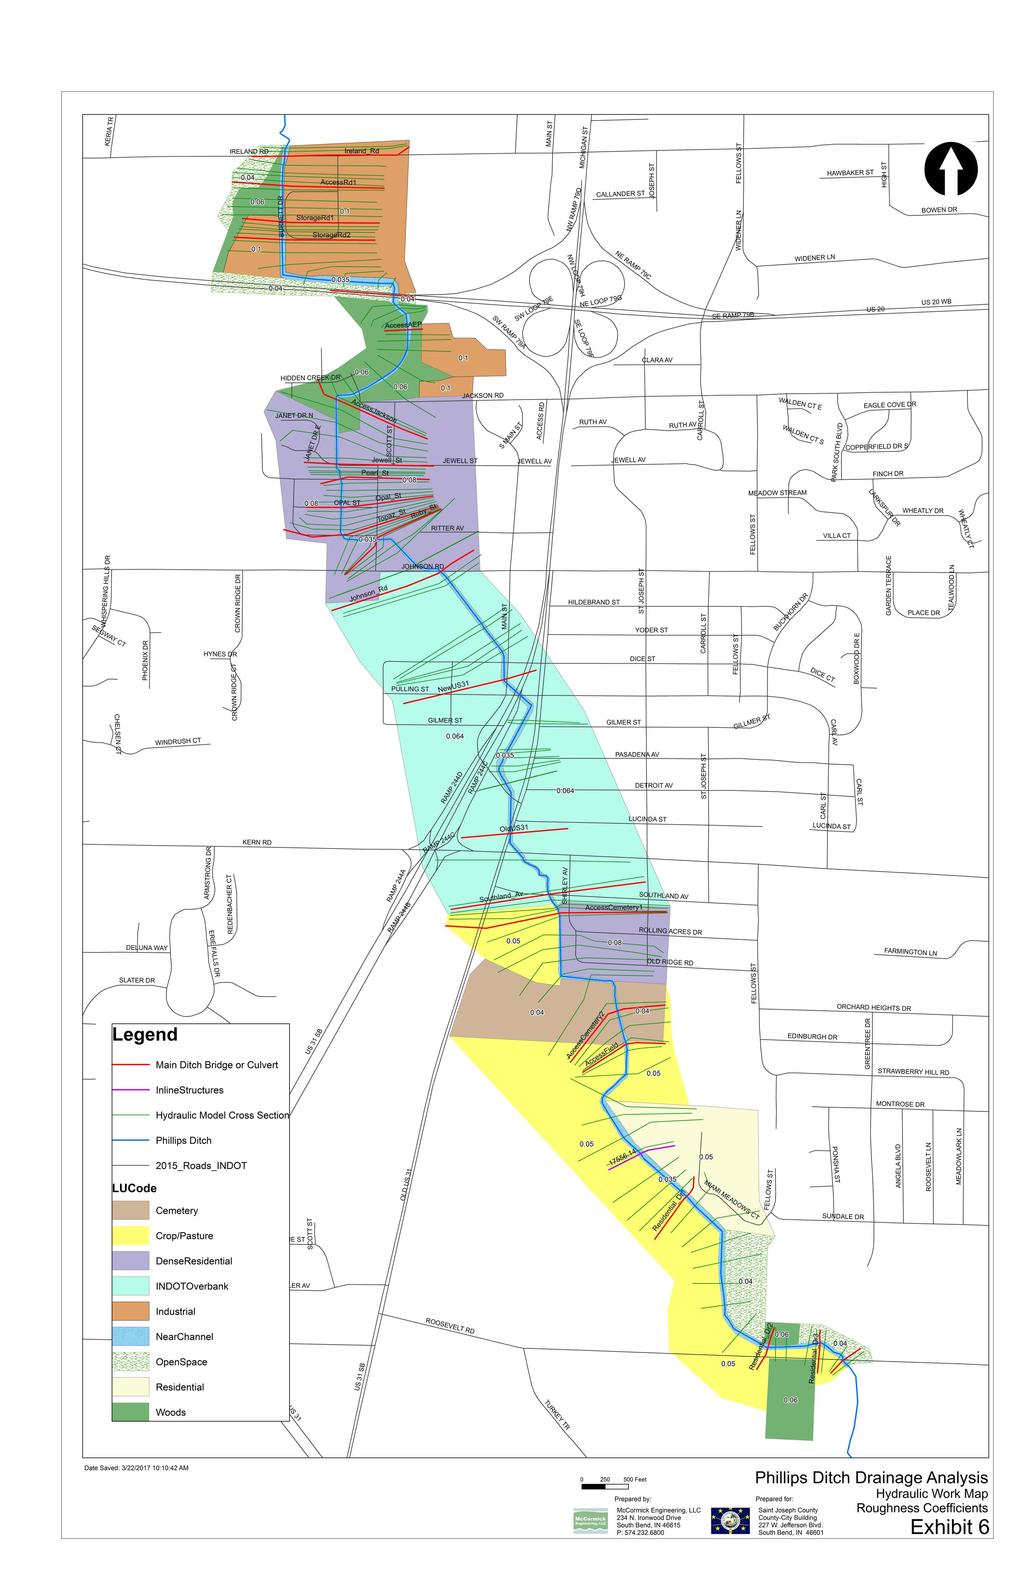
26 4. HYDRAULIC MODELING The INDOT Consultant created a hydraulic model for a portion of Phillips Ditch from approximately Johnson Road to Kern Road in order to assess potential hydraulic impacts of the proposed US 31 relocation project. This model was obtained from the IDNR and extended both downstream to the Ireland Road crossing and upstream to Roosevelt Road crossing. A work map of representative cross-section locations is provided in Exhibit 5. The cross-sections from the INDOT model appear to be relative in location rather than associated with a known datum. The GIS work performed with this project is based upon the NAD 1983 State Plane Indiana East FIPS 1301 coordinate system. In order to relate the INDOT cross-sections to the remainder of the study cross sections, the cut line coordinates for the INDOT sections were shifted based on an approximate best-fit of coordinates. A factor of was added to the easting (Xposition) and a factor of was added to northing (Y-position) to superimpose the INDOT cross-sections onto the current coordinate system. The INDOT naming convention was based upon river mileage (in miles) from an unknown location. The most downstream cross-section in the INDOT analysis was noted at RM This same section is feet (2.41 miles) above the apparent location of the confluence with Bowman Creek, which is a 1.06 mile difference in naming convention. Because of this significant apparent difference in river mileage, the INDOT sections were renamed in the current analysis. The INDOT design and analysis includes provisions for culverts with significant changes in alignment. This is an unusual design feature, but support documentation is provided in the INDOT calculations as to the hydraulic impacts of these bends. The energy losses associated with the bends are included in the current analysis as proposed by the INDOT consultant. Roughness conditions along Phillips Ditch were estimated from aerial photography of the area, as well as previous field reconnaissance of the ditch in prior years. A work map of the roughness coefficients used in the analysis in Exhibit 6. There is significant development adjacent to the Phillips Ditch watercourse. Buildings/structures thought to have potential for inundation or to represent a potential obstruction to flow were digitized from aerial photography as shown in Exhibit 7. At the noted cross-section locations in Exhibit 5, the station-elevation relationship was established based on the LiDAR Digital Elevation Model (DEM). Because LiDAR often does not capture the fine detail of a watercourse itself, the LiDAR data was supplemented with field survey sections within the local vicinity of the channel. This field data was incorporated into the cross-sections as detailed within the hydraulic model itself. The energy slope method was used to establish a boundary condition for the hydraulic model. Between model sections at the downstream and at the upstream there is approximately 48 feet of fall over feet. This corresponds to ft./ft. energy slope. A model boundary condition of ft./ft. energy slope was
27 used to be slightly conservative, but could be easily adjusted or refined if additional information downstream of Ireland Road supported a different boundary condition. The hydrologic results indicate peak discharges that are very consistent between historic conditions and as-built conditions. The discharges shown in Table 6 were used in the hydraulic analysis of the 1% AEP (100-year) event. Table 6 HEC-RAS Analysis Discharges Reference Rounded Upstream Node Q100 used in XSEC for Flow hydraulic application analysis (CFS) J J-4A J J J J J S For historic conditions, the cross-section locations and orientations differ slightly from that shown in Exhibit 5 for the INDOT portion of the analysis (Section to Section ). The location and orientation for historic conditions are, however, documented in the cut line information of the hydraulic model, as well as the original INDOT submittal to IDNR for a Construction in a Floodway (CIF) permit for the US 31 relocation project. The cross-section correlation table between the original INDOT analysis and the current analysis is provided in Tables 7 and 8. Table 7 Cross-Section Naming Correlation Historic INDOT Cross Section ID Current Report XSEC ID Culvert Culvert Culvert Culvert Culvert Culvert Culvert Culvert Culvert
28 Table 8 Cross-Section Naming Correlation Current Condition Modeling INDOT Section Current Current Report Section ID Culvert Culvert Culvert Culvert Culvert Culvert Culvert Culvert HYDRAULIC ANALYSIS RESULTS The 1% AEP (100-year) modeling results predicted by the HEC-RAS analysis are provided in Table 9 and visually in Figure 10 below. It can be seen in Table 9 that within the portion of Phillips Ditch impacted by the US 31 relocation ( to ), the changes to Phillips Ditch as a result of the project can be seen to reduce flood inundation profiles in the vicinity of the US 31 relocation project. Inclusion of the Main Street underpass relief path was incorporated into the hydrologic modeling by preparing a steady state rating curve based upon the current condition hydraulic model combined with an estimation of diverted discharges based upon a simple weir calculation for the Main Street underpass. The Main Street underpass is not predicted to engage for the 1% AEP event, but would impact predicted profiles for more extreme events. From an observation of the profile graph in Figure 10, it can be seen that the culvert under the US 20 Bypass has the most significant head loss of current structures. It can also be seen that the channel invert upstream and downstream of this structure is above the invert of the ten-foot diameter US 20 culvert, based upon field survey of inverts and channel conditions. This is assumed to be at least partially due to sediment deposition from the August 2016 event
29 XSEC ID Table 9 Summary of Hydraulic Model Profiles and Impacts for 1% AEP Event (ft) Ireland Road Access Road Commercial Entrance Commercial Entrance JVV Parkway (US 20 Bypass) American Electric XSEC ID Historic W.S. Elev (ft- NAVD) Current W.S. Elev (ft- NAVD) Historic W.S. Elev (ft- NAVD) Current W.S. Elev (ft- NAVD) (ft) Power Access Access Road Jewell Street Pearl Street Opal Street Topaz Street Ruby Street
30 XSEC ID Historic W.S. Elev (ft- NAVD) Current W.S. Elev (ft- NAVD) (ft) Johnson Road Private Drive Relocated US Private Drive Private Drive Private Drive Old US Southfield Ave Access Road XSEC ID Historic W.S. Elev (ft- NAVD) Current W.S. Elev (ft- NAVD) (ft) Access Road Access Road Inline Weir Structure Residential Drive Residential Drive Residential Drive Roosevelt Road
31 Phillips Ditch Drainage Study
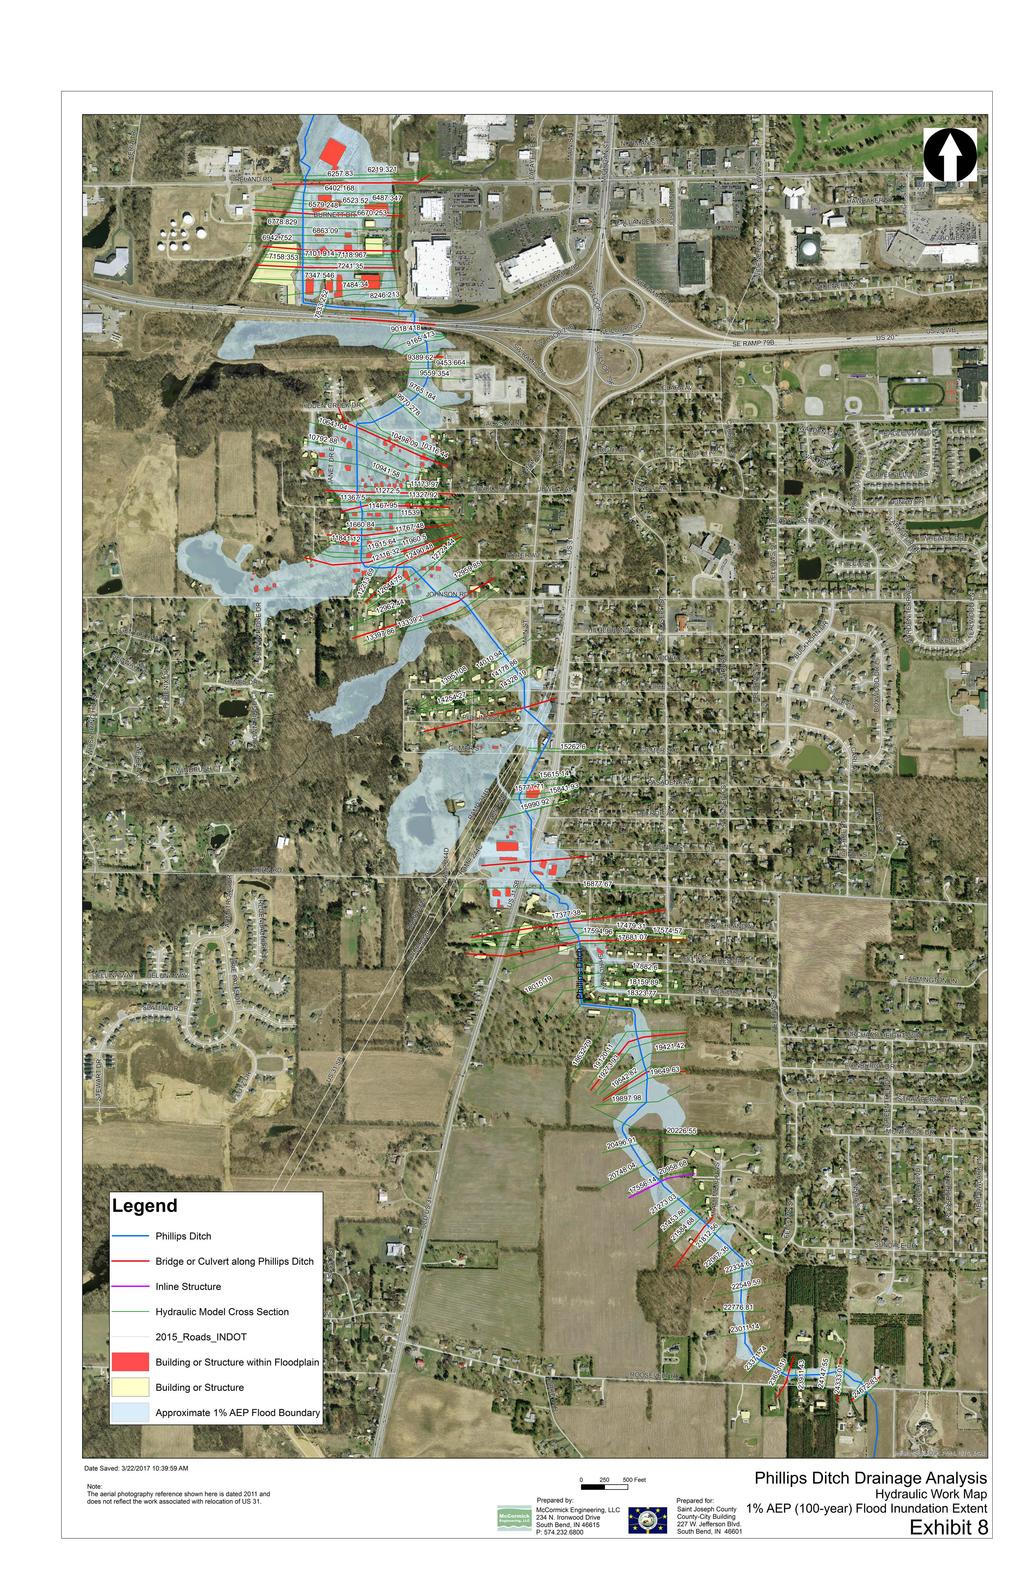
32 The HEC-RAS hydraulic results were overlaid against the 2011 LiDAR topographic data to produce a 1% AEP (100-year) inundation map in Exhibit 8. This map is not an accurate assessment of the flooding extent in the immediate vicinity of the relocated US 31 embankment as this topographic source does not reflect those changes to the landscape. It can be seen in Exhibit 8 that there are a significant number of existing building structures within the 1% AEP (100-year) flood inundation zone, both industrial north of the US 31 Bypass and residential south of the US 31 Bypass. In Exhibit 8, it can be seen that the 100-year flood extent includes a section connecting the east and west halves of the relocated US 31 via the new underpass associated with Main Street. This underpass acts as an overflow for certain extreme events. When test input discharges for the August 2016 hydrologic analysis were used in conjunction with the current condition hydraulic model (without accounting for the Main Street underpass), the results showed a profile that would nearly overtop the relocated US 31, which does not correspond to accounts of the event. Plan Sheet 29 of 222 for INDOT Contract IR shows a maximum profile grade of approximately along the underpass. Plan Sheet 19 of 65 for INDOT Bridge Pans shows a minimum width of opening of feet along the underpass. Using this width and elevation, the diversion for various flows was estimated using a simple weir calculation. The hydraulic model predicts only minor engagement of the Main Street underpass for the 1% AEP event, but this diversion effect is predicted to be more significant for the more extreme events, such as the 0.5% AEP (200-year), 0.2% AEP (500-year), 0.1% AEP (1000-year) and August 2016 events. An observation of the flood profile indicates that most culvert crossings are overtopped for the 100- year event, with the only exceptions being the US 20 Bypass and the Relocated US 31 structure. Whereas the majority of culverts have little to no impact on this flood profile because of the extent of overtopping, the US 20 Bypass structure and the relocated US 31 structure have the potential to act as rather large orifices due to their high profiles. Within the Jewell Park/Jewell Woods neighborhoods, for example, the flood profile is virtually flat between the US 20 Bypass all the way to Johnson Road due to the limitations of the US 20 Bypass structure OTHER HYDRAULIC CONSIDERATIONS The current hydraulic analysis is not intended to provide an official delineation of the 1% AEP (100- year) regulatory flood boundaries. The current analysis similarly does not address the regulatory floodway boundaries. In addition to potential minor corrections to the model, the current hydraulic modeling would need coordination of official peak 1% AEP discharges and topographic support in the INDOT modeling reach, if it was desired to update the official DHS-FEMA Flood Hazard Boundary mapping in the study reach. It is unclear as to how the new culvert under the relocated US 31 is intended to be accessed for maintenance purposes or removal of potential debris. This issue should be discussed with INDOT, along with the responsible party to maintain the noted culvert in free flowing conditions
33 5. SUMMARY OF RESULTS & RECOMMENDATION 5.1. SUMMARY OF RESULTS The US 31 relocation project included significant changes to the alignment of Phillips Ditch and to the localized landscape features as a result of the elevated embankment of the new roadway. The hydrologic analysis of these changes indicates relatively insignificant increases to the peak discharges along Phillips Ditch as a result of these changes. The results do indicate increased discharges on the order of 20 cfs for the 1% AEP (100-year, 12-hour) event and 500 cfs for the August 2016 event along an unnamed tributary within a subbasin known as Main1 due to two factors: Apparent failure of INDOT and its Contractor to eliminate a temporary orifice from what is called pond SD1 in the report exhibits. This is responsible for an increase in discharges on the order of 3-5 cfs for the 1% AEP (100-year) design event and the August 2016 historical event. Unplanned overflow discharge from the mainline of Phillips Ditch through the Main Street underpass constructed as part of the US 31 Relocation Project. This is responsible for the balance of discharge increase for the 1% AEP (100-year) design event and the August 2016 historical event. The Main Street underpass diversion appears to be a significant factor in flooding extent for storm events more severe than the 1% AEP (100-year), but is of relatively minimal impact for the 1% AEP storm. In the more severe floods, this diversion overflow would increase peak discharges in the reach of the Main1 tributary from approximately Gilmer Street to Dice Street, as shown in Tables 4 and 5. The structure under Ireland Road experiences roadway overtopping from a localized low point in the roadway profile east of the culvert crossing. The current DHS-FEMA flood hazard mapping in the area appears to recognize a portion of the roadway overtopping, but does not recognize the culvert crossing. The structure under the Saint Joseph Valley Parkway (US 20 Bypass) appears to be the controlling factor for flooding in the Jewell Woods/Jewell Park subdivisions for the 100-year and greater events, as the backwater from this structure inundates the roadway crossings from the US 20 Bypass to Johnson Road. The culverts within the Jewell Woods/Jewell Park neighborhoods convey a very small portion of the flow during extreme events as a result of roadway inundation. Therefore, increasing the size of crossings in this neighborhood would be anticipated to have a negligible effect on 100-year profiles unless the tailwater on the structures was lowered. A significant number of buildings have been constructed within the studied reach of Phillips Ditch that would appear to potentially be inundated by events less severe than the 100-year event. This includes approximately 138 buildings or structures distributed as follows: 25 building structures in the reach of Phillips Ditch between its mouth
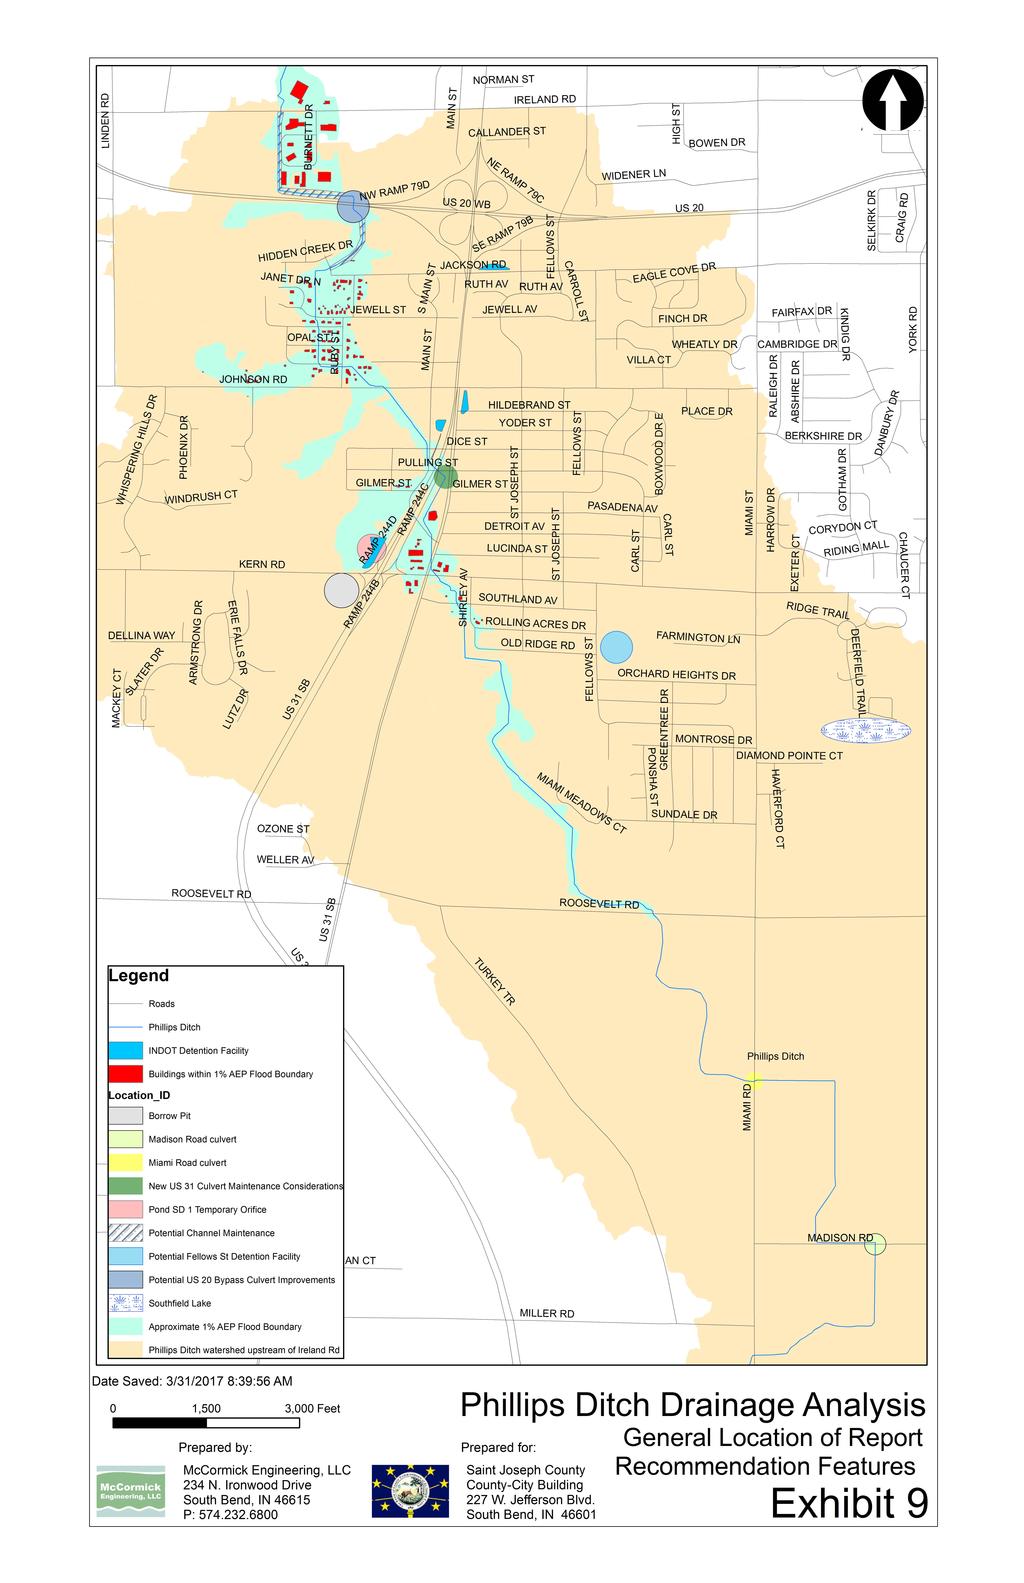
34 (downstream study extent) and the US 20 Bypass 86 building structures in the reach of Phillips Ditch between the US 20 Bypass and Johnson Road 6 building structures in the reach of Phillips Ditch between Johnson Road and the relocated US building structures in the reach of Phillips Ditch between the relocated US 31 and Old Ridge Road 0 building structures in the reach of Phillips Ditch between Old Ridge Road and Roosevelt Road (upstream study extent) The number of structures within each reach noted above is listed as approximate because in some cases multiple structures in close proximity were lumped together for the purposes of defining the obstructions along the watercourse. In addition, the building structures were largely identified on the basis of 2011 aerial photography. It is possible that certain structures identified in Exhibit 8 were removed as part of the US 31 Relocation Project. In the tributary of Phillips Ditch from the Southfield area, the facility known as Southfield Lake has virtually no detention impact in reducing peak discharges along that watercourse. The Miami Road widening project appears to have diverted a portion of the localized watershed to a different unnamed tributary to Phillips Ditch, but does not appear to have a significant effect on discharges along the main line of Phillips Ditch. With the noted exceptions related to the operation of detention facility SD1 and the potential for diversion of flow through the Main Street underpass, hydraulic impacts along the main line of Philips Ditch as a result of development appears negligible RECOMMENDATIONS Ideas for consideration to reduce flooding along Phillips Ditch include: INDOT should consider providing a secondary overflow through the US 20 bypass embankment to reduce the 100- year backwater profile upstream of this structure. This should only be done in consideration of the potential increase in downstream discharges as a result of the additional conveyance through the structure. The County should consider going through the DHS-FEMA map revision process to update the official Flood Insurance Rate Map (FIRM), similar to the 1% AEP (100- year) flood inundation extent shown in Exhibit 8. The map changes would affect the following DHS-FEMA FIRM Panels: 18141C0194D, 18141C0307D, 18141C- 0326D, and 18141C0330D, all effectively dated 1/6/2011. On a local level, the County should enforce limitations on the construction of additional buildings or structures within the inundation area shown in Figure 8 as the best available information until such time as the DHS- FEMA flood mapping is officially updated along Phillips Ditch. If the DHS-FEMA mapping is officially updated to officially reflect a more accurate depiction of the 1% AEP (100-year) flood inundation extent, this would allow for
35 Federal funding of voluntary buyouts of building structures in the Jewell Woods/Jewell Park neighborhoods that are shown in Exhibit 8 to be at or below the 100- year flood profile. More information is available in a DHS-FEMA document known as FEMA 317 (DHS-FEMA, 1998). It should be noted that revising the DHS- FEMA mapping along Phillips Ditch will likely take twelve to eighteen months from the time that the initial application and submittal documentation is submitted to DHS-FEMA. INDOT should verify whether the temporary orifice at Pond SD1 has, in fact been removed, as was called for in the construction of the particular detention facility. A borrow pit immediately south of Kern Road was constructed on behalf of the INDOT US 31 Relocation Project, but not included as part of the drainage plan calculations for the relocation of US 31. It is at least possible that the detention function of this borrow pit could be optimized to reduce discharges along the tributary of the basin Main1. This might include a potential connection to INDOT Basin SD1, in which case the temporary orifice issue might be revisited in the optimization. Southfield Lake should be revisited by the City of South Bend to determine if the detention function can be optimized to provide a more effective detention facility. No additional development should be allowed by the City which claims credit for detention at Southfield Lake until this is completed. The discharges experienced at the McCracken subdivision, which are part of subbasin Phil5, could be reduced with a detention facility east of Fellows Street. This facility could regulate discharges from the basin identified in the study as Fellow1. The culvert under the US 20 Bypass was partially full of sediment at the time of the field survey. This is likely the result of deposition from the August 2016 storm event. Channel maintenance should be considered by the County, from the section of Phillips Ditch from Hidden Creek Drive to Ireland Rd. The cleaning of the US 20 Bypass culvert should be performed, which appears to be the responsibility of INDOT. The County should maintain the current restrictive nature of the culverts at the Miami Road and Madison Road crossings to continue engagement of existing wetland storage within these areas. Increasing the capacity of these particular culvert crossings would likely result in increased discharges downstream. Maintenance access and responsibilities for the new culvert under the relocated US 31 should be discussed with INDOT. General locations of the recommendations noted above are shown in Exhibit
36 6. BIBLIOGRAPHY Indiana Geographic Information Council. (2013, November 04). Local-Resolution NHD Layers. Retrieved from IndianaMap: &z=0&sBasemap=bm9&URLLayers=H ydrology_water_bodies_lakes_localres,hydrolo gy_water_bodies_rivers_localres,hydrology_w ater_bodies_streams_localres,hydrology_water sheds_huc08_2009 Indiana Geograpic Information Office. (2016). High- Resolution Topography Data and Tools. Retrieved October 6, 2016, from OpenTopography: DEM &minX= &minY=41.559&maxX= &maxY= FEMA. (2016, May 11). About the Agency FEMA. Retrieved December 6, 2016, from FEMA: Huff, F. A., & Angel, J. R. (1992). Bulletin 71 - Rainfall Frequency Atlas of the Midwest. Champaign: Illinois State Water Survey. Indiana Administrative Code. (2014, September 22). Article 10. Flood Plain Managment. Retrieved from Indiana General Assembly - IR- Database: Indiana Administrative Code: Bonnin, G., Martin, D., Lin, B., Parzybok, T., Yekta, M., & Riley, D. (2006). NOAA Atlas 14 - Precipitation- Frequency Atlas of the United States. Silver Spring: National Oceanic and Atmospheric Administration. DHS-FEMA. (1998, October). Propoert Acquisition Handbook for Local Communities - A Summary for States. Retrieved from Federal Emergency Management Agency. (2011, January 6). Map Number 18141C0307D. Flood Insurance Rate Map. Federal Emergency Management Agency. Indiana Department of Natural Resources. (2002, December 5). General Guidelines for the Hydrologic-Hydraulic Assessment of Floodplains in Indiana. Retrieved from Indiana Department of Natural Resources:
37
38
39
40
41
42
43
44
45
INFLOW DESIGN FLOOD CONTROL SYSTEM PLAN 40 C.F.R. PART PLANT YATES ASH POND 2 (AP-2) GEORGIA POWER COMPANY
 GEORGIA POWER COMPANY") INFLOW DESIGN FLOOD CONTROL SYSTEM PLAN 40 C.F.R. PART 257.82 PLANT YATES ASH POND 2 (AP-2) GEORGIA POWER COMPANY EPA s Disposal of Coal Combustion Residuals from Electric Utilities Final Rule (40 C.F.R.
INFLOW DESIGN FLOOD CONTROL SYSTEM PLAN 40 C.F.R. PART 257.82 PLANT YATES ASH POND 2 (AP-2) GEORGIA POWER COMPANY EPA s Disposal of Coal Combustion Residuals from Electric Utilities Final Rule (40 C.F.R.
Section 4: Model Development and Application
 Section 4: Model Development and Application The hydrologic model for the Wissahickon Act 167 study was built using GIS layers of land use, hydrologic soil groups, terrain and orthophotography. Within
LOCATED IN INDIAN RIVER COUNTY PREPARED FOR S.J.R.W.M.D. AND F.W.C.D. DECEMBER, 2003 Updated 2007 Updated May 2014 PREPARED BY
 FELLSMERE WATER CONTROL DISTRICT EAST MASTER DRAINAGE PLAN AND STORMWATER HYDROLOGIC ANALYSIS OF THE GRAVITY DRAINAGE SYSTEM LOCATED BETWEEN THE EAST BOUNDARY, LATERAL U, THE MAIN CANAL, AND DITCH 24 LOCATED
LOMR SUBMITTAL LOWER NEHALEM RIVER TILLAMOOK COUNTY, OREGON
 LOMR SUBMITTAL LOWER NEHALEM RIVER TILLAMOOK COUNTY, OREGON Prepared for: TILLAMOOK COUNTY DEPARTMENT OF COMMUNITY DEVELOPMENT 1510-B THIRD STREET TILLAMOOK, OR 97141 Prepared by: 10300 SW GREENBURG ROAD,
ARTICLE 5 (PART 2) DETENTION VOLUME EXAMPLE PROBLEMS
 DETENTION VOLUME EXAMPLE PROBLEMS") ARTICLE 5 (PART 2) DETENTION VOLUME EXAMPLE PROBLEMS Example 5.7 Simple (Detention Nomograph) Example 5.8 Offsite and Unrestricted Areas (HEC-HMS) Example 5.9 Ponds in Series w/ Tailwater (HEC-HMS) Example
ARTICLE 5 (PART 2) DETENTION VOLUME EXAMPLE PROBLEMS Example 5.7 Simple (Detention Nomograph) Example 5.8 Offsite and Unrestricted Areas (HEC-HMS) Example 5.9 Ponds in Series w/ Tailwater (HEC-HMS) Example
UPPER COSUMNES RIVER FLOOD MAPPING
 UPPER COSUMNES RIVER FLOOD MAPPING DRAFT BASIC DATA NARRATIVE FLOOD INSURANCE STUDY SACRAMENTO COUTY, CALIFORNIA Community No. 060262 November 2008 Prepared By: CIVIL ENGINEERING SOLUTIONS, INC. 1325 Howe
3.11 Floodplains Existing Conditions
 Other stormwater control practices may be needed to mitigate water quality impacts. In addition to detention facilities, other practices such as vegetated basins/buffers, infiltration basins, and bioswales
LOMR SUBMITTAL LOWER NESTUCCA RIVER TILLAMOOK COUNTY, OREGON
 LOMR SUBMITTAL LOWER NESTUCCA RIVER TILLAMOOK COUNTY, OREGON Prepared for: TILLAMOOK COUNTY DEPARTMENT OF COMMUNITY DEVELOPMENT 1510-B THIRD STREET TILLAMOOK, OR 97141 Prepared by: 10300 SW GREENBURG ROAD,
YELLOWSTONE RIVER FLOOD STUDY REPORT TEXT
 YELLOWSTONE RIVER FLOOD STUDY REPORT TEXT TECHNICAL REPORT Prepared for: City of Livingston 411 East Callender Livingston, MT 59047 Prepared by: Clear Creek Hydrology, Inc. 1627 West Main Street, #294
Appendix E Guidance for Shallow Flooding Analyses and Mapping
 Appendix E Guidance for Shallow Flooding Analyses and Mapping E.1 Introduction Different types of shallow flooding commonly occur throughout the United States. Types of flows that result in shallow flooding
Base Level Engineering FEMA Region 6
 Base Level Engineering Over the past five years, has been evaluating its investment approach and data preparation work flow to establish an efficient and effective change in operation, generating an approach
Chapter 5 CALIBRATION AND VERIFICATION
 Chapter 5 CALIBRATION AND VERIFICATION This chapter contains the calibration procedure and data used for the LSC existing conditions model. The goal of the calibration effort was to develop a hydraulic
Chapter 10 - Sacramento Method Examples
 Chapter 10 Sacramento Method Examples Introduction Overview This chapter presents two example problems to demonstrate the use of the Sacramento method. These example problems use the SACPRE and HEC-1 computer
L OWER N OOKSACK R IVER P ROJECT: A LTERNATIVES A NALYSIS A PPENDIX A: H YDRAULIC M ODELING. PREPARED BY: LandC, etc, LLC
 L OWER N OOKSACK R IVER P ROJECT: A LTERNATIVES A NALYSIS A PPENDIX A: H YDRAULIC M ODELING PREPARED BY: LandC, etc, LLC TABLE OF CONTENTS 1 Introduction... 1 2 Methods... 1 2.1 Hydraulic Model... 1 2.2
INTRODUCTION TO HYDROLOGIC MODELING USING HEC-HMS
 INTRODUCTION TO HYDROLOGIC MODELING USING HEC-HMS By Thomas T. Burke, Jr., PhD, PE Luke J. Sherry, PE, CFM Christopher B. Burke Engineering, Ltd. October 8, 2014 1 SEMINAR OUTLINE Overview of hydrologic
Pompton Lakes Dam Downstream Effects of the Floodgate Facility. Joseph Ruggeri Brian Cahill Michael Mak Andy Bonner
 Pompton Lakes Dam Downstream Effects of the Joseph Ruggeri Brian Cahill Michael Mak Andy Bonner ASFPM 2013: Overview Page 2 Overview Page 3 Overview Page 4 Overview Page 5 Overview - Historical Pompton
 Red River Flooding June 2015 Caddo and Bossier Parishes Presented by: Flood Technical Committee Where the Rain Falls Matters I-30 versus I-20 I-20 Backwater and Tributary Floods (Localized) 2016 Flood
PENNSYLVANIA DEPARTMENT OF TRANSPORTATION ENGINEERING DISTRICT 3-0
 PENNSYLVANIA DEPARTMENT OF TRANSPORTATION ENGINEERING DISTRICT 3-0 LYCOMING COUNTY S.R.15, SECTION C41 FINAL HYDROLOGIC AND HYDRAULIC REPORT STEAM VALLEY RUN STREAM RELOCATION DATE: June, 2006 REVISED:
Pequabuck River Flooding Study and Flood Mitigation Plan The City of Bristol and Towns of Plainville and Plymouth, CT
 Pequabuck River Flooding Study and Flood Mitigation Plan The City of Bristol and Towns of Plainville and Plymouth, CT Raymond Rogozinski and Maged Aboelata The City of Bristol and Towns of Plainville and
North Carolina Simplified Inundation Maps For Emergency Action Plans December 2010; revised September 2014; revised April 2015
 North Carolina Simplified Inundation Maps For Emergency Action Plans December 2010; revised September 2014; revised April 2015 INTRODUCTION Emergency Action Plans (EAPs) are critical to reducing the risks
Issue 44: Phase II & III H&H Issues Date: 07/03/2006 Page 1
 Background Phase I of the NCFMP studies have primarily focused on the coastal plain and sandhills physiographic regions in of the State. Phase II and III study areas will focus on the piedmont, foothills,
THE NEED FOR AN ADDITIONAL SPILLWAY AT THE SANFORD DAM BOILING SPRING LAKES, NC. Presentation for The Brunswick County Commissioners April 20, 2015
 THE NEED FOR AN ADDITIONAL SPILLWAY AT THE SANFORD DAM BOILING SPRING LAKES, NC Presentation for The Brunswick County Commissioners April 20, 2015 The Sanford Dam Earth Dam constructed in 1961 Drainage
STREUVER FIDELCO CAPPELLI, LLC YONKERS DOWNTOWN DEVELOPMENT PHASE 1. DRAFT ENVIRONMENTAL IMPACT STATEMENT For: PALISADES POINT
 STREUVER FIDELCO CAPPELLI, LLC YONKERS DOWNTOWN DEVELOPMENT PHASE 1 DRAFT ENVIRONMENTAL IMPACT STATEMENT For: PALISADES POINT Prepared by: PAULUS, SOKOLOWSKI & SARTOR STORMWATER MANAGEMENT 1. Methodology
Rucker Pond. Background
 Rucker Pond Background The Rucker Basin consists of two subbasins (East and West) that drain to a single area known as Rucker Pond. Both subbasins have the same hydraulic parameters, but have different
Chapter 7 Mudflow Analysis
 Chapter 7 Mudflow Analysis 7.0 Introduction This chapter provides information on the potential and magnitude of mud floods and mudflows that may develop in Aspen due to rainfall events, snowmelt, or rain
Hydrology and Hydraulics Design Report. Background Summary
 To: National Park Services Montezuma Castle National Monument Richard Goepfrich, Facility Manager From: Multicultural Technical Engineers Date: Tuesday - February 13, 2018 Subject: 30% Hydrology and Hydraulics
9. PROBABLE MAXIMUM PRECIPITATION AND PROBABLE MAXIMUM FLOOD
 9. PROBABLE MAXIMUM PRECIPITATION AND PROBABLE MAXIMUM FLOOD 9.1. Introduction Due to the size of Watana Dam and the economic importance of the Project to the Railbelt, the Probable Maximum Flood (PMF)
WATER MANAGEMENT REPORT FOR PAGE ESTATES
 WATER MANAGEMENT REPORT FOR PAGE ESTATES SLB Consulting of SW Florida, LLC PO Box 2826 Bonita Springs, FL. 34133 Phone: 239-948-9566 sandra@slbconsult.com C.O.A. # 25395 September 1, 2014 Sandra L. Bottcher
APPENDIX B HYDROLOGY
 APPENDIX B HYDROLOGY TABLE OF CONTENTS 1.0 INTRODUCTION... 1 2.0 PROBABLE MAXIMUM PRECIPITATION (PMP)... 1 3.0 DESIGN FLOW CALCULATION... 1 4.0 DIVERSION CHANNEL SIZING... 2 5.0 REFERENCES... 4 LIST OF
SAN FRANCISCO DISTRICT INFORMATION REQUESTED FOR VERIFICATION OF CORPS JURISDICTION
 DEPARTMENT OF THE ARMY SAN FRANCISCO DISTRICT, U.S. ARMY CORPS OF ENGINEERS 1455 MARKET STREET SAN FRANCISCO, CALIFORNIA 94103-1398 SAN FRANCISCO DISTRICT INFORMATION REQUESTED FOR VERIFICATION OF CORPS
BRANDON LAKES AVENUE PRE AND POST CONDITIONS DRAINAGE REPORT
 BRANDON LAKES AVENUE PRE AND POST CONDITIONS DRAINAGE REPORT Hillsborough County Public Works County Center, 22nd Floor 601 E. Kennedy Blvd. Tampa, FL 33602 BRANDON LAKES AVENUE DRAINAGE IMPROVEMENTS Capital
STORMWATER REPORT FRITO LAY SUBDIVISION NO. 3
 STORMWATER REPORT FRITO LAY SUBDIVISION NO. 3 May 2018 STORMWATER REPORT I. Subdivision Data a. The parcel is adjacent to the existing Frito Lay property in Topeka; and the subject plat application encompasses
Stage Discharge Tabulation for Only Orifice Flow
 Stage Discharge Tabulation for Only Orifice Flow DEPTH STAGE DISCHARGE (meters) (feet) (meters) (feet) (m 3 /s) (ft 3 /s) 0 0.20 0.40 0.60 0.80 1.00 1.20 1.40 1.60 1.80 2.00 0.7 1.3 2.0 2.6 3.3 3.9 4.6
CITY OF CAPE CORAL STORMWATER MASTER PLAN PHASE II - PART 1 BASINS 4, 10, & 14 SUB-BASIN DRAINAGE IMPROVEMENTS HYDRAULIC ANALYSIS SUMMARY
 CITY OF CAPE CORAL STORMWATER MASTER PLAN PHASE II - PART 1 BASINS 4, 10, & 14 SUB-BASIN DRAINAGE IMPROVEMENTS HYDRAULIC ANALYSIS SUMMARY Cape Coral, FL Prepared for: The City of Cape Coral Public Works
Stormwater Capacity Analysis for Westover Branch Watershed
 Stormwater Capacity Analysis for Westover Branch Watershed Pimmit Run Little Pimmit Run, Mainstem Stohman's Run Gulf Branch Pimmit Run Tributary Little Pimmit Run, W. Branch Little Pimmit Run, E. Branch
A GIS-based Approach to Watershed Analysis in Texas Author: Allison Guettner
 Texas A&M University Zachry Department of Civil Engineering CVEN 658 Civil Engineering Applications of GIS Instructor: Dr. Francisco Olivera A GIS-based Approach to Watershed Analysis in Texas Author:
StreamStats: Delivering Streamflow Information to the Public. By Kernell Ries
 StreamStats: Delivering Streamflow Information to the Public By Kernell Ries U.S. Department of the Interior U.S. Geological Survey MD-DE-DC District 410-238-4317 kries@usgs.gov StreamStats Web Application
Chapter 7 Mudflow Analysis
 Chapter 7 Mudflow Analysis 7.0 Introduction This chapter provides information on the potential and magnitude of mud floods and mudflows that may develop in Aspen due to rainfall events, snowmelt, or rain
USGS Flood Inundation Mapping of the Suncook River in Chichester, Epsom, Pembroke and Allenstown, New Hampshire
 USGS Flood Inundation Mapping of the Suncook River in Chichester, Epsom, Pembroke and Allenstown, New Hampshire NH Water & Watershed Conference Robert Flynn, USGS NH-VT Water Science Center March 23, 2012
Ground Water Protection Council 2017 Annual Forum Boston, Massachusetts. Ben Binder (303)
") Ground Water Protection Council 2017 Annual Forum Boston, Massachusetts Protecting Groundwater Sources from Flood Borne Contamination Ben Binder (303) 860-0600 Digital Design Group, Inc. The Problem Houston
Ground Water Protection Council 2017 Annual Forum Boston, Massachusetts Protecting Groundwater Sources from Flood Borne Contamination Ben Binder (303) 860-0600 Digital Design Group, Inc. The Problem Houston
The effectiveness of the Natural Resource Conservation Service (NRCS) and Huff rainfall distribution methods for use in detention basin design
 and Huff rainfall distribution methods for use in detention basin design") Scholars' Mine Masters Theses Student Theses and Dissertations Spring 2010 The effectiveness of the Natural Resource Conservation Service (NRCS) and Huff rainfall distribution methods for use in detention
Scholars' Mine Masters Theses Student Theses and Dissertations Spring 2010 The effectiveness of the Natural Resource Conservation Service (NRCS) and Huff rainfall distribution methods for use in detention
Background on the March 13-14, 2007 Flooding in Browns Valley (Traverse County), Minnesota
, Minnesota") Background on the March 13-14, 2007 Flooding in Browns Valley (Traverse County), Minnesota Report to the Minnesota Governor s Office Prepared by: Minnesota Department of Natural Resources Waters Division
Background on the March 13-14, 2007 Flooding in Browns Valley (Traverse County), Minnesota Report to the Minnesota Governor s Office Prepared by: Minnesota Department of Natural Resources Waters Division
Stormwater Guidelines and Case Studies. CAHILL ASSOCIATES Environmental Consultants West Chester, PA (610)
") Stormwater Guidelines and Case Studies CAHILL ASSOCIATES Environmental Consultants West Chester, PA (610) 696-4150 www.thcahill.com Goals and Challenges for Manual State Stormwater Policy More Widespread
Stormwater Guidelines and Case Studies CAHILL ASSOCIATES Environmental Consultants West Chester, PA (610) 696-4150 www.thcahill.com Goals and Challenges for Manual State Stormwater Policy More Widespread
Semester Project Final Report. Logan River Flood Plain Analysis Using ArcGIS, HEC-GeoRAS, and HEC-RAS
 Semester Project Final Report Logan River Flood Plain Analysis Using ArcGIS, HEC-GeoRAS, and HEC-RAS Kedric Curtis, Josh Hogge, Jordan Jarrett, Jared Justensen May 6, 2016 CEE 6190 GIS for Civil Engineers
Sediment Trap. A temporary runoff containment area, which promotes sedimentation prior to discharge of the runoff through a stabilized spillway.
 Sediment Trap SC-15 Source: Caltrans Construction Site Best Management Practices Manual, 2003. Description A temporary runoff containment area, which promotes sedimentation prior to discharge of the runoff
Attachment B to Technical Memorandum No.2. Operations Plan of Ross Valley Detention Basins
 Attachment B to Technical Memorandum No.2 Operations Plan of Ross Valley Detention Basins Operations Plan of Ross Valley Detention Basins Stetson Engineers Inc. January 26, 2011 1.0 Introduction Achieving
The last three sections of the main body of this report consist of:
 Threatened and Endangered Species Geological Hazards Floodplains Cultural Resources Hazardous Materials A Cost Analysis section that provides comparative conceptual-level costs follows the Environmental
Preliminary Hydraulic Report
 Tarrant County, Texas Preliminary Hydraulic Report Prepared for: Texas Department of Transportation Fort Worth District Prepared by: AECOM Corporation Scott C. Williams, P.E. No. 101334, Date 2009 This
Minimum Standards for Wetland Delineations
 Minimum Standards for Wetland Delineations Jason Gipson Chief, Utah/Nevada Regulatory Branch Sacramento District Regulatory Program Workshop 16 Mar 2016 US Army Corps of Engineers Delineation Report Minimum
Objectives: After completing this assignment, you should be able to:
 Data Analysis Assignment #1 Evaluating the effects of watershed land use on storm runoff Assignment due: 21 February 2013, 5 pm Objectives: After completing this assignment, you should be able to: 1) Calculate
Hydrologic Evaluation of the Blanchard River
 Hydrologic Evaluation of the Blanchard River Hancock County Flood Risk Reduction Program Prepared for: Maumee Watershed Conservancy District 1464 Pinehurst Dr. Defiance, Ohio 43512 Prepared by: Stantec
Standards for Soil Erosion and Sediment Control in New Jersey May 2012
 STANDARD FOR SEDIMENT BASIN Definition A barrier, dam, excavated pit, or dugout constructed across a waterway or at other suitable locations to intercept and retain sediment. Basins created by construction
Continuing Education Course #101 Drainage Design with WinTR-55
 1 of 5 Continuing Education Course #101 Drainage Design with WinTR-55 1. WinTR-55 uses the Kinematic Wave method for calculating storm runoff rates and volumes. 2. According to the Velocity Method, the
INTRODUCTION TO HEC-HMS
 INTRODUCTION TO HEC-HMS Hydrologic Engineering Center- Hydrologic Modeling System US Army Corps of Engineers Hydrologic Engineering Center HEC-HMS Uses Schematics Enter properties: watershed, rivers (reaches),
MEMORANDUM. Situation. David Ford Consulting Engineers, Inc J Street, Suite 200 Sacramento, CA Ph Fx
 David Ford Consulting Engineers, Inc. 2015 J Street, Suite 200 Sacramento, CA 95811 Ph. 916.447.8779 Fx. 916.447.8780 MEMORANDUM To: Brad Moore, PE, USACE From: Nathan Pingel, PE (Lic # CA 63242), and
Pennypack Creek Watershed Act 167 Study
 Pennypack Creek Watershed Act 167 Study Progress Report December 17, 2009 Jeffrey Featherstone jeffrey.featherstone@temple.edu Mahbubur Meenar meenar@temple.edu Rick Fromuth richard.fromuth@temple.edu
Project Description. Project Options. End Analysis On... Apr 26, :00:00. Rainfall Details
 Project Description File Name... 323 - Att Pond 3 East PIPES ONLY.SPF Project Options Flow Units... Elevation Type... Hydrology Method... EPA SWMM Infiltration Method... Link Routing Method... Enable Overflow
Bushkill Creek 3 rd Street Dam Removal Analysis
 Bushkill Creek 3 rd Street Dam Removal Analysis HEC HMS Runoff and Routing Model Stephen Beavan, Melanie DeFazio, David Gold, Peter Mara and Dan Moran CE 421: Hydrology Fall 2010 December 15, 2010 Contents
REDWOOD VALLEY SUBAREA
 Independent Science Review Panel Conceptual Model of Watershed Hydrology, Surface Water and Groundwater Interactions and Stream Ecology for the Russian River Watershed Appendices A-1 APPENDIX A A-2 REDWOOD
HYDROLOGIC AND HYDRAULIC REPORT FOR SR. 0522, SECTION 5BN ALONG BLACKLOG CREEK CROMWELL TOWNSHIP HUNTINGDON COUNTY. Prepared for:
 HYDROLOGIC AND HYDRAULIC REPORT FOR SR. 0522, SECTION 5BN ALONG BLACKLOG CREEK CROMWELL TOWNSHIP Prepared for: KCI Technologies, Inc. Mechanicsburg, PA and Pennsylvania Department of Transportation Engineering
D. MATHEMATICAL MODEL AND SIMULATION
 D. MATHEMATICAL MODEL AND SIMULATION D - i TABLE OF CONTENTS D.1 Objective of Model Development... D - 1 D.2 Selection of Software... D - 1 D.3 General Steps of Simulation by MOUSE... D - 1 D.4 Cases of
PRELIMINARY DRAFT FOR DISCUSSION PURPOSES
 Memorandum To: David Thompson From: John Haapala CC: Dan McDonald Bob Montgomery Date: February 24, 2003 File #: 1003551 Re: Lake Wenatchee Historic Water Levels, Operation Model, and Flood Operation This
Community Discovery Data Questionnaire
 Region III Community Discovery Data Questionnaire Thank you for taking the time to complete this questionnaire. It will provide important information to help FEMA understand flood risk issues in the Conococheague-Opequon
Managing an Extreme Weather Event of Prolonged Duration May 22, 2013
 Managing an Extreme Weather Event of Prolonged Duration May 22, 2013 MISSOURI RIVER FLOOD OF 2011 M I C H A E L J. K E N N E R L Y P. E. D I R E C T O R O F T H E O F F I C E O F D E S I G N I O W A D
USING GIS TO MODEL AND ANALYZE HISTORICAL FLOODING OF THE GUADALUPE RIVER NEAR NEW BRAUNFELS, TEXAS
 USING GIS TO MODEL AND ANALYZE HISTORICAL FLOODING OF THE GUADALUPE RIVER NEAR NEW BRAUNFELS, TEXAS ASHLEY EVANS While the state of Texas is well-known for flooding, the Guadalupe River Basin is one of
GRAPEVINE LAKE MODELING & WATERSHED CHARACTERISTICS
 GRAPEVINE LAKE MODELING & WATERSHED CHARACTERISTICS Photo Credit: Lake Grapevine Boat Ramps Nash Mock GIS in Water Resources Fall 2016 Table of Contents Figures and Tables... 2 Introduction... 3 Objectives...
ISSN Vol.03,Issue.10 May-2014, Pages:
 www.semargroup.org, www.ijsetr.com ISSN 2319-8885 Vol.03,Issue.10 May-2014, Pages:2187-2191 YIN YIN HTWE 1, AYE AYE THANT 2 1 Dept of Civil Engineering, Mandalay Technological University, Mandalay, Myanmar,
Information for File # MMJ; Trunk Highway (TH) 7 / Louisiana Ave. Interchange Project
 7 / Louisiana Ave. Interchange Project") Information for File # 2013-00531-MMJ; Trunk Highway (TH) 7 / Louisiana Ave. Interchange Project Applicant: City of St. Louis Park Corps Contact: Melissa Jenny Address: U.S. Army Corps of Engineers Attn:
Information for File # 2013-00531-MMJ; Trunk Highway (TH) 7 / Louisiana Ave. Interchange Project Applicant: City of St. Louis Park Corps Contact: Melissa Jenny Address: U.S. Army Corps of Engineers Attn:
Las Colonias Subdivision September 2010 Flood Study
 Las Colonias Subdivision September 2010 Flood Study Curtis Beitel, P.E., CFM Scott Muchard, P.E. Project Engineer William Badini, CFM Senior Meteorologist Location Map Background Los Colonias Subdivision
Appendix C. Questionnaire Summary of Responses Geographic Information Systems
 Appendix C Questionnaire Summary of Responses Geographic Information Systems 1. Is your agency using or planning use of GIS for: a. general mapping (e.g. highway routes, political boundaries, etc.) b.
HISTORY OF CONSTRUCTION FOR EXISTING CCR SURFACE IMPOUNDMENT PLANT GASTON ASH POND 40 CFR (c)(1)(i) (xii)
(1)(i) (xii)") HISTORY OF CONSTRUCTION FOR EXISTING CCR SURFACE IMPOUNDMENT PLANT GASTON ASH POND 40 CFR 257.73(c)(1)(i) (xii) (i) Site Name and Ownership Information: Site Name: E.C. Gaston Steam Plant Site Location:
HISTORY OF CONSTRUCTION FOR EXISTING CCR SURFACE IMPOUNDMENT PLANT GASTON ASH POND 40 CFR 257.73(c)(1)(i) (xii) (i) Site Name and Ownership Information: Site Name: E.C. Gaston Steam Plant Site Location:
Dealing with Zone A Flood Zones. Topics of Discussion. What is a Zone A Floodplain?
 Dealing with Zone A Flood Zones Topics of Discussion Overview of Zone A Floodplains Permitting Development in Zone A Floodplains Estimating Flood Elevations in Zone A Flood Insurance Implications Letters
GOAL 7 AREAS SUBJECT TO NATURAL DISASTERS AND HAZARDS. To protect life and property from natural disasters and hazards.
 GOAL 7 AREAS SUBJECT TO NATURAL DISASTERS AND HAZARDS A. GOALS: To protect life and property from natural disasters and hazards. B. POLICIES: 1. Floodplains shall be maintained as natural drainage-ways.
2011 Flood: Technical Review of Lake Manitoba, Lake St. Martin and Assiniboine River Water Levels Summary
 2011 Flood: Technical Review of Lake Manitoba, Lake St. Martin and Assiniboine River Water Levels Summary October 2013 Introduction Manitoba experienced unprecedented flooding in 2011. While flooding was
Materials. Use materials meeting the following.
 208.01 Section 208. SOIL EROSION AND SEDIMENTATION CONTROL 208.01 Description. Install and maintain erosion and sedimentation controls to minimize soil erosion and to control sedimentation from affecting
Submitted to: St. Johns River Power Park New Berlin Road Jacksonville, FL 32226
 RUN-ON/RUN-OFF CONTROL SYSTEM PLAN RUN-ON AND RUN-OFF CONTROL SYSTEM PLAN St. Johns River Power Park Byproduct Storage Area B Phase I Development Submitted to: St. Johns River Power Park 11201 New Berlin
City of Thornton Attn: Tim Semones Development Engineeering 9500 Civic Center Dr. Thornton, CO 80229
 Development Engineering Land Surveying Construction Administration District Services October 20, 2017 City of Thornton Attn: Tim Semones Development Engineeering 9500 Civic Center Dr. Thornton, CO 80229
Bank Erosion and Morphology of the Kaskaskia River
 Bank Erosion and Morphology of the Kaskaskia River US Army Corps Of Engineers St. Louis District Fayette County Soil and Water Conservation District Team Partners : Carlyle Lake Ecosystem Partnership Vicinity
Discovery Data Questionnaire
 Region III Discovery Data Questionnaire Thank you for taking the time to complete this Discovery Data questionnaire. It will provide important information to help FEMA better understand flood risk issues
Indiana GIS Resources
 Indiana GIS Resources National Association of Water Companies September 21, 2017 Jim Sparks Indiana Geographic Information Officer ABOUT THE INDIANA GEOGRAPHIC INFORMATION OFFICE I.C. 4-23-7.3 Indiana
Hydrologic Forecast Centre Manitoba Infrastructure, Winnipeg, Manitoba. MARCH OUTLOOK REPORT FOR MANITOBA March 23, 2018
 Page 1 of 21 Hydrologic Forecast Centre Manitoba Infrastructure, Winnipeg, Manitoba MARCH OUTLOOK REPORT FOR MANITOBA March 23, 2018 Overview The March Outlook Report prepared by the Hydrologic Forecast
Study 16.5 Probable Maximum Flood (PMF)
") Initial Study Report Meeting Study 16.5 Probable Maximum Flood (PMF) October 22, 2014 Prepared by 10/22/2014 1 Study 16.5 Objectives Develop a site-specific PMP to be used for the derivation of the PMF
Initial Study Report Meeting Study 16.5 Probable Maximum Flood (PMF) October 22, 2014 Prepared by 10/22/2014 1 Study 16.5 Objectives Develop a site-specific PMP to be used for the derivation of the PMF
A Cloud-Based Flood Warning System For Forecasting Impacts to Transportation Infrastructure Systems
 A Cloud-Based Flood Warning System For Forecasting Impacts to Transportation Infrastructure Systems Jon Goodall Associate Professor, Civil and Environmental Engineering Associate Director, Link Lab April
JOURNAL OF ENVIRONMENTAL HYDROLOGY The Electronic Journal of the International Association for Environmental Hydrology VOLUME
 JOURNAL OF ENVIRONMENTAL HYDROLOGY The Electronic Journal of the International Association for Environmental Hydrology VOLUME 18 2010 REDUCED CHANNEL CONVEYANCE ON THE WICHITA RIVER AT WICHITA FALLS, TEXAS,
MISSOURI LiDAR Stakeholders Meeting
 MISSOURI LiDAR Stakeholders Meeting East-West Gateway June 18, 2010 Tim Haithcoat Missouri GIO Enhanced Elevation Data What s different about it? Business requirements are changing.fast New data collection
Natural and Human Influences on Flood Zones in Wake County. Georgia Ditmore
 Natural and Human Influences on Flood Zones in Wake County Georgia Ditmore Prepared for GEOG 591 December 5, 2014 2 Table of Contents Introduction.3 Objectives...5 Methods...6 Conclusion.11 References
9. Flood Routing. chapter Two
 9. Flood Routing Flow routing is a mathematical procedure for predicting the changing magnitude, speed, and shape of a flood wave as a function of time at one or more points along a watercourse (waterway
A SIMPLE GIS METHOD FOR OBTAINING FLOODED AREAS
 A SIMPLE GIS METHOD FOR OBTAINING FLOODED AREAS ROMAN P., I. 1, OROS C., R. 2 ABSTRACT. A simple GIS method for obtaining flooded areas. This paper presents a method for obtaining flooded areas near to
Emergency Action Plan (EAP) Tata Pond Dam
 Tata Pond Dam") For Official Use Only Not for Public Distribution 02/03/16 Emergency Action Plan (EAP) Tata Pond Dam State of Connecticut Dam ID: 0000 Town or City, County, Connecticut Name of Dam Owner Dam Hazard Classification
For Official Use Only Not for Public Distribution 02/03/16 Emergency Action Plan (EAP) Tata Pond Dam State of Connecticut Dam ID: 0000 Town or City, County, Connecticut Name of Dam Owner Dam Hazard Classification
6/9/2014. Software Overview. System Overview
 Future Rainfall 6/9/2014 Curtis Beitel, PE, CFM, Anthony Henry and Wayne Tschirhart, PE, CFM, PMP TFMA Spring 2014 Conference Software Overview 2 Processes Hydrometric DB Event Manager Automatic Low =
Technical Memorandum #2 Future Conditions
 Technical Memorandum #2 Future Conditions To: Dan Farnsworth Transportation Planner Fargo-Moorhead Metro Council of Governments From: Rick Gunderson, PE Josh Hinds PE, PTOE Houston Engineering, Inc. Subject:
HYDROLOGY REPORT Tentative Tract No. 5978
 ATTACHMENT 5 October 2016 HYDROLOGY REPORT Tentative Tract No. 5978 City of Simi Valley County of Ventura Prepared For: Landsea Holdings Corporation 7525 Irvine Center Drive Suite 200 Irvine, CA 92618
Red River Levee Panel
 Red River Levee Panel Mississippi River Commission Monday, August 9, 2017 Red River Levees in LA & AR NONE along TX & OK Boarder Red River Levee Issues Caddo Levee Cherokee Park Authorization Bossier Levee
Appendix C Fluvial Flood Hazards
 Appendix C Fluvial Flood Hazards Sea Level Rise Vulnerability Assessment and Adaptation Project March 2019 Contents Contents... i Figures... i Tables... i Definitions, Acronyms, & Abbreviations... ii
DRAINAGE REPORT FOR THORNTON SELF STORAGE THORNTON, COLORADO
 DRAINAGE REPORT FOR THORNTON SELF STORAGE THORNTON, COLORADO Prepared by: Bowman Consulting 603 Park Point Dr. Suite 100 Golden, CO 80401 (303)-801-2900 June 29, 2015 Revised August 14, 2015 CERTIFICATE
Pierce Cedar Creek Institute GIS Development Final Report. Grand Valley State University
 Pierce Cedar Creek Institute GIS Development Final Report Grand Valley State University Major Goals of Project The two primary goals of the project were to provide Matt VanPortfliet, GVSU student, the
FORECAST-BASED OPERATIONS AT FOLSOM DAM AND LAKE
 FORECAST-BASED OPERATIONS AT FOLSOM DAM AND LAKE 255 237 237 237 217 217 217 200 200 200 0 163 131 Bridging the Gap163Conference 255 0 132 255 0 163 122 The Dana on Mission Bay San Diego, CA January 28,
Coal Combustion Residuals Unit Inflow Design Flood Control System Plan
 Coal Combustion Residuals Unit Inflow Design Flood Control System Plan Virginia Electric and Power Company Chesterfield Power Station Upper (East) Pond Chesterfield County, Virginia GAI Project Number:
Hydrologic Forecast Centre Manitoba Infrastructure, Winnipeg, Manitoba. FEBRUARY OUTLOOK REPORT FOR MANITOBA February 23, 2018
 Page 1 of 17 Hydrologic Forecast Centre Manitoba Infrastructure, Winnipeg, Manitoba FEBRUARY OUTLOOK REPORT FOR MANITOBA February 23, 2018 Overview The February Outlook Report prepared by the Hydrologic
Workshop: Build a Basic HEC-HMS Model from Scratch
 Workshop: Build a Basic HEC-HMS Model from Scratch This workshop is designed to help new users of HEC-HMS learn how to apply the software. Not all the capabilities in HEC-HMS are demonstrated in the workshop