Christopher K. H. Guay 1, Fiona A. McLaughlin 2, and Michiyo Yamamoto-Kawai 2. Canada
|
|
|
- Alexia Atkinson
- 5 years ago
- Views:
Transcription
1 Differentiating fluvial components of upper Canada Basin waters based on measurements of dissolved barium combined with other physical and chemical tracers Christopher K. H. Guay 1, Fiona A. McLaughlin 2, and Michiyo Yamamoto-Kawai 2 1 Pacific Marine Sciences and Technology, Oakland, California, USA 2 Department of Fisheries and Oceans, Institute of Ocean Sciences, Sidney, British Columbia, Canada
2 Abstract The utility of dissolved barium (Ba) as a quasi-conservative tracer of Arctic water masses has been demonstrated previously. Here we report distributions of salinity, temperature, and Ba in the upper 200 m of the Canada Basin and adjacent areas observed during cruises conducted in as part of the Joint Western Arctic Climate Study (JWACS) and Beaufort Gyre Exploration Project (BGEP). A salinity-oxygen isotope mass balance is used to calculate the relative contributions from sea ice melt, meteoric, and saline end-members, and Ba measurements are incorporated to resolve the meteoric fraction into separate contributions from North American and Eurasian sources of runoff. Large fractions of Eurasian runoff (as high as 15.5%) were observed in the surface layer throughout the Canada Basin, but significant amounts of North American runoff in the surface layer were only observed at the southernmost station occupied in the Canada Basin in 2004, nearest to the mouth of the Mackenzie River. Smaller contributions from both Eurasian and North American runoff were evident in the summer and winter Pacific-derived water masses that comprise the underlying upper halocline layer in the Canada Basin. Significant amounts of Eurasian and North American runoff were observed throughout the water column at a station occupied in Amundsen Gulf in This suggests the export of runoff from both sources through the passages of the Canadian Arctic Archipelago. Keywords: Barium, Arctic rivers, Beaufort Gyre, Canada Basin, tracers Index terms: 4800 Oceanography: Biological and chemical (0460); 4207 Arctic and Antarctic oceanography (9310, 9315); 4808 Chemical tracers; 4283 Water masses; 0744 Rivers (0483, 1856)
3 1. Introduction The Canada Basin covers an area of approximately 1.6 x 10 6 km 2 to the north of the Chukchi and Beaufort seas, accounting for ~11% of the total area of the Arctic Ocean. Low salinity surface waters of the Canada Basin comprise the largest reservoir of fresh water in the Arctic Ocean, with an inventory of approximately 25,600 km 3 of fresh water calculated for the upper 300 m of the water column in the Canada Basin relative to a reference salinity of [Yamamoto-Kawai et al., 2008]. The large fresh water content of the Canada Basin exerts a strong influence on the sea ice cover in the region through its effect on salinity and water column stratification in areas of ice formation and its contribution to maintaining the cold halocline layer of the Arctic Ocean, which insulates sea ice from the heat contained in relatively warm, underlying waters of Atlantic origin [Shimada et al., 2005; Björk et al., 2002]. Fresh water contained in Canada Basin waters is exported via Fram Strait and the passages of the Canadian Arctic Archipelago (hereafter referred to simply as the Archipelago) to the Nordic Seas and Labrador Sea, where its contribution of positive buoyancy is one of the factors governing the extent of convective deep water formation in the North Atlantic [Aagaard and Carmack, 1989]. The fresh water cycle in the Canada Basin is therefore a significant component of the linkages between the Arctic system and global ocean circulation and climate. Sources of fresh water to the Canada Basin include the influx of relatively fresh Pacific marine waters via Bering Strait, sea ice melt, river runoff, and net precipitation-minusevaporation. These multiple sources of fresh water require other tracers in addition to salinity in order to differentiate them and determine their relative contributions to Canada Basin waters. A mass balance based on salinity and oxygen isotopes has been applied previously to determine proportions of meteoric water (i.e., river runoff and precipitation), sea ice melt, and a marine
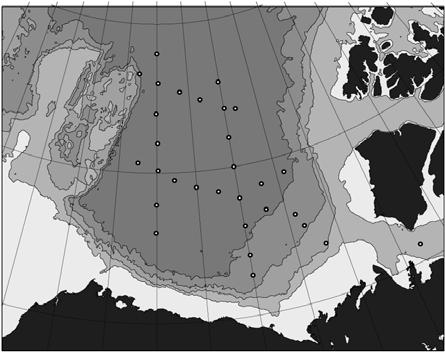
4 end-member in surface waters of the Canada Basin (Macdonald et al., 2002). Incorporating nutrient measurements (phosphate and nitrate/total inorganic nitrogen) differentiates marine waters of Atlantic and Pacific origin and allows separate Atlantic and Pacific marine endmembers to be explicitly accounted for in the mass balance. [Jones et al., 1998; Yamamoto- Kawai et al., 2008]. Measurements of total alkalinity have been used to estimate the relative proportions of runoff contributed by the Eurasian arctic rivers and the Mackenzie River [Yamamoto-Kawai et al., 2005]. The utility of dissolved barium (Ba) as a quasi-conservative tracer of Canada Basin water masses has been demonstrated previously [Guay and Falkner, 1997; Guay et al., 1999]. Of particular interest is its application to differentiating runoff from Eurasian and North American sources based on the significant enrichment of Ba in North American arctic rivers relative to Eurasian arctic rivers [Guay and Falkner, 1997; Taylor et al., 2003; Cooper et al., 2008]. Here we present distributions of temperature, salinity and dissolved Ba in upper (depth 200 m) Canada Basin waters in summer 2003 and The salinity and Ba data are combined in a mass balance with oxygen isotope data from concurrent measurements [Yamamoto-Kawai et al., 2008] to determine the relative contributions of sea ice melt, Pacific water, and runoff from Eurasian and North American rivers. 2. Sample Collection and Analysis Hydrographic stations were occupied in the Canada Basin and adjacent areas during research cruises on the CCGS Louis S. St-Laurent in summer 2003 and 2004 (Fig. 1). Water samples were collected from Niskin bottles deployed on a rosette equipped with a Sea-Bird Electronics SBE 9 CTD profiler. Bottle samples were analyzed for salinity using a Guildline Autosal salinometer referenced to IAPSO standard seawater.
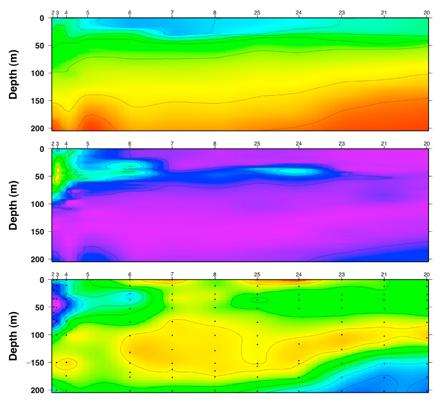
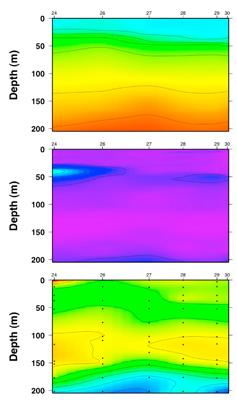
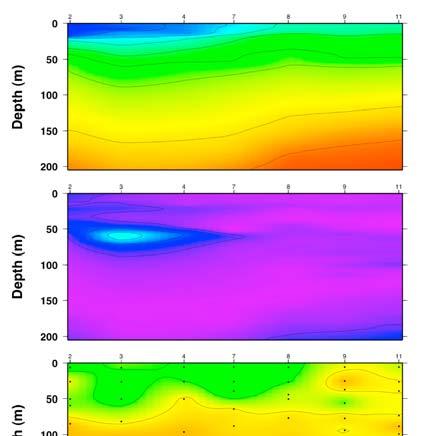
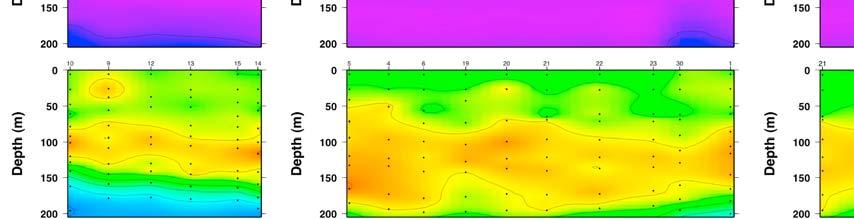
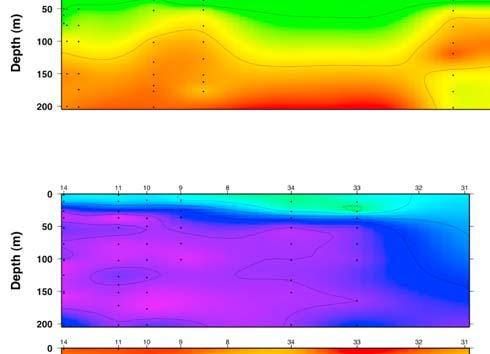
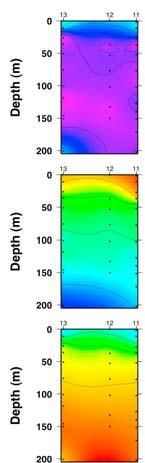
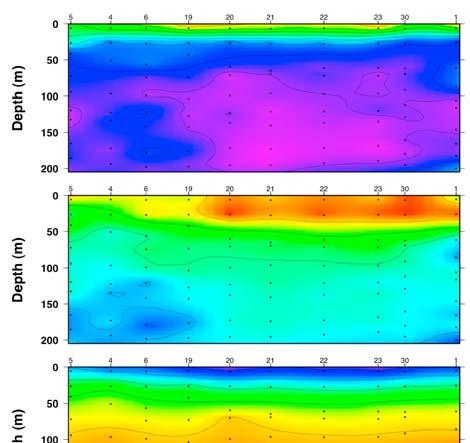
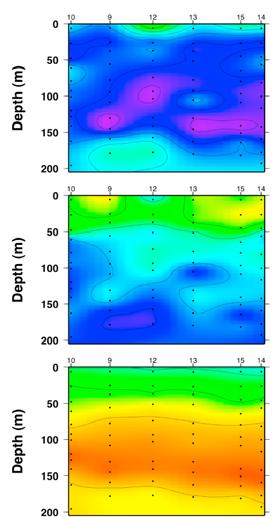
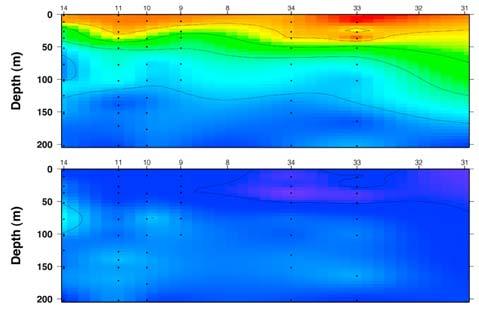
5 Samples for Ba analysis were collected into trace metal clean HDPE bottles and prevented from freezing during transit and storage. Barium concentrations in the samples were determined on a VG Elemental ExCell quadrupole inductively coupled plasma mass spectrometer (ICP-MS) at the W. M. Keck Collaboratory for Plasma Spectrometry, College of Oceanic and Atmospheric Sciences, Oregon State University. An isotope dilution method was used that is similar to one described previously in more detail [Guay, 1997]. Briefly, 250-µl aliquots of sample were spiked with an equal volume of a 135 Ba-enriched solution (Oak Ridge National Laboratories) and diluted with 10 ml of 1% HNO 3. The ICP-MS was operated in peak jump mode, and data were accumulated over three 20-s intervals for masses 135 and 138. Based on replicate analyses of samples and standardized reference materials, the precision (2-sigma) of the analytical procedure ranges from < 5% at 10 nmol Ba l -1 to < 3% at 100 nmol Ba l Results Distributions of salinity, temperature, and dissolved barium In 2003 (Fig. 2), relatively fresh (S < 31), cold (T < -1 C) waters were observed throughout the upper 50 m at the stations in the central Canada Basin. Surface salinity generally decreased moving from west to east across the basin, with lowest values (27-28) observed in the southeast (stations 36-38) and highest values observed in the northernmost region of the sampling area (stations 20-23). Dissolved Ba concentrations ranged between 60 and 79 nmol Ba l -1, with higher values generally observed in the western region of the Canada Basin (particularly high concentrations were observed at stations 7, 24 and 25). The stations over the shelf break north of Alaska (stations 2-4) were remarkable for the presence of a water mass characterized by highly elevated temperatures (up to 4.2 C) and extremely low Ba concentrations (as low as 32 nmol Ba l -1 ) at depths between 10 m and 90 m.
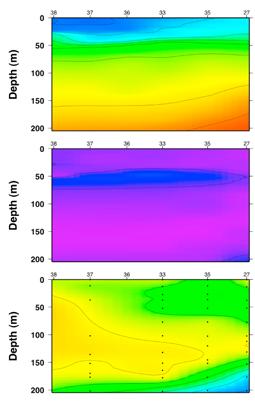
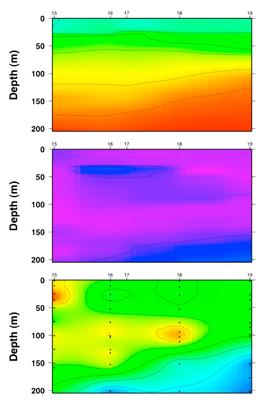
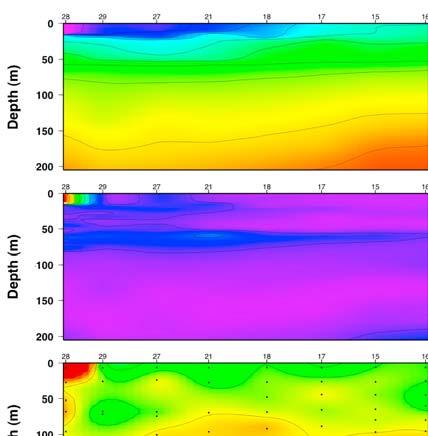
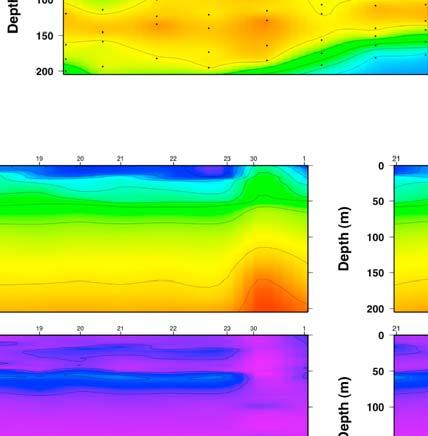
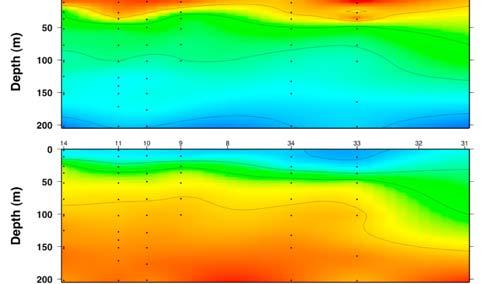
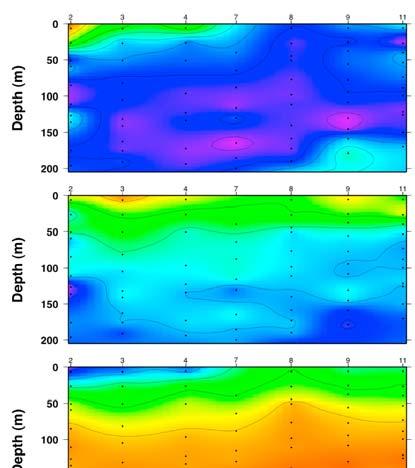
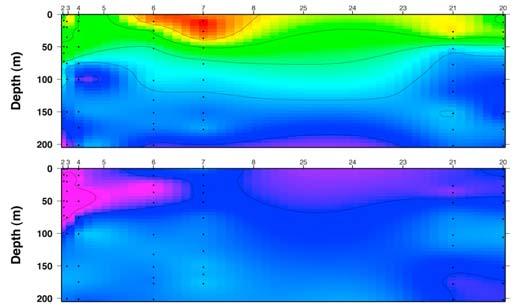
6 The core of this feature was centered at approximately 50 m and extended to stations immediately northwards from the shelf break along transect A (stations 5-6) but it was not observed at stations over the Chukchi shelf break to the west at the southern ends of transects E and F. Over the central Canada Basin, waters of intermediate salinity (S= ) with moderately warm temperatures (T > -1 C) and low Ba concentrations (<65 nmol Ba l -1 ) were observed uniformly at depths between approximately 30 m and 80 m. Beneath this layer, waters with salinity between 32.5 and 34, near-freezing temperatures, and elevated Ba concentrations (65-75 nmol Ba l -1 ) were observed at depths between 75 m and 175 m throughout the sampling area and appeared to shoal continuously to the surface at the stations near the Chukchi shelf break in the vicinity of the Chukchi Borderland (southern/western ends of transects D, E and F). At lower depths ( m) along all of the transects, the appearance of higher salinity waters (S > 34) was observed in association with temperatures elevated with respect to immediately overlying waters (T > -1 C) and low Ba concentrations (40-55 nmol Ba l -1 ). These waters were most prevalent at stations in the northern region of the sampling area and also appeared to shoal slightly at stations over the shelf break and the southern portion of the Chukchi Borderland (e.g., stations 2, 13, and 14). A similar pattern of salinity, temperature and dissolved barium distributions was observed in 2004 (Fig. 3). Surface waters over the central Canada Basin were characterized by low salinity (< 31, with values of or lower commonly observed throughout the sampling area), cold temperatures (T < -1 C), and Ba concentrations of nmol Ba l -1 in the upper 50 m of the water column. In general, upper Canada Basin waters were fresher in 2004 relative to This may be partly due to differences in the geographical distributions of sampling locations in the two years, but the overall trend is consistent with direct comparisons between individual
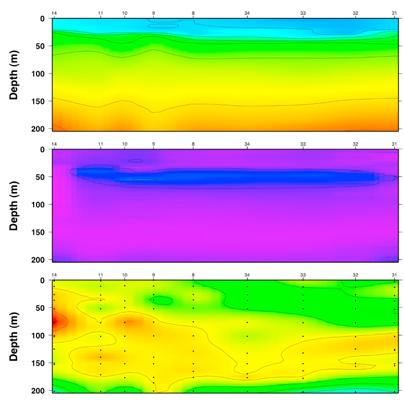
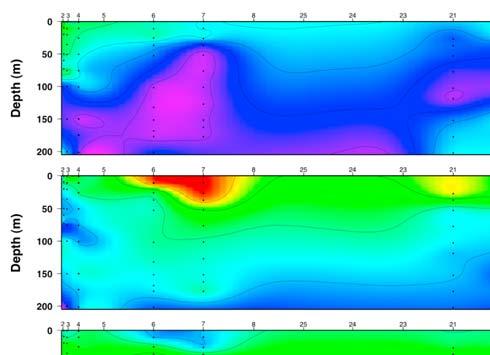
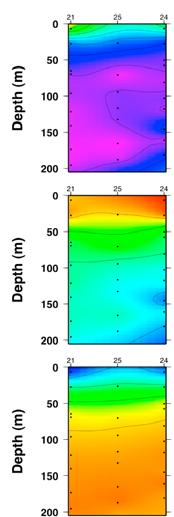
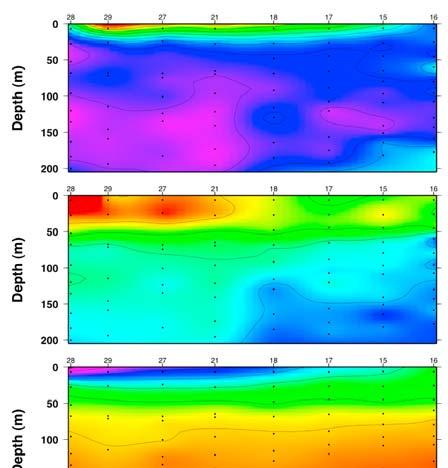
7 stations occupied in the exact same locations during the 2003 and 2004 cruises e.g., station 8 in 2003 and station 4 in 2004; station 33 in 2003 and station 18 in 2004; etc. In addition, lowsalinity surface waters were observed at two stations in the southeast Canada Basin closer to the shelf break than any of the stations occupied in the area in At station 28, extremely fresh (S = ), warm (T > 5 C) waters highly elevated in Ba (119 nmol Ba l -1 ) were observed in the upper 15 m of the water column. At station 1, the upper 15 m of the water column was also characterized by relatively low salinity values ( ), but temperature (-1.0 to 0.8 C) and Ba (66 nmol Ba l -1 ) were only slightly elevated compared to waters over a similar depth range at nearby stations. A layer of warm (T > -1 C) water with intermediate salinity ( ) was again observed throughout most of the Canada Basin at depths between 30 m and 80 m. While transect A in 2004 did not extend as far south over the shelf break and slope as it did in 2003, waters with highly elevated temperatures (> 1 C) with a core centered at ~50 m were observed at the southernmost end of the transect (stations 2-7). The concentrations of Ba associated with these waters appeared to be higher (> 65 nmol Ba l -1 ) relative to Another notable difference from the 2003 distributions is the observation at some stations (e.g., stations and 19-23) of a separate, thinner layer of warm water above the warm water mass with its core at ~50 m. Consistent with observations in 2003, waters with salinity between 32.5 and 34, nearfreezing temperatures, and relatively high Ba concentrations (65-75 nmol Ba l -1 ) were observed at depths of 75 to 175 m throughout the Canada Basin. Below this water mass, higher salinity waters (S > 34) with temperatures elevated relative to immediately overlying waters (T > -1 C) and low Ba concentrations (40-55 nmol Ba l -1 ) were present at depths of m. As observed in 2003, these waters were most prevalent at these depths at stations in the northern
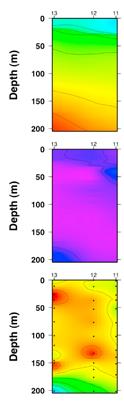
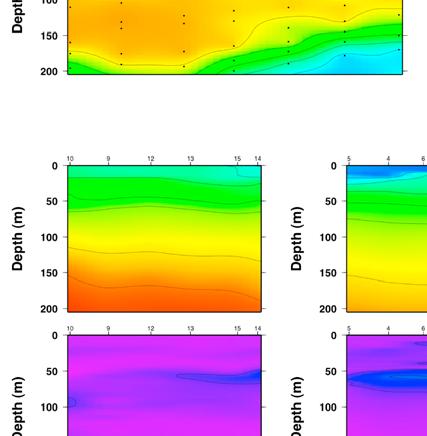
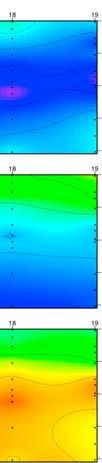
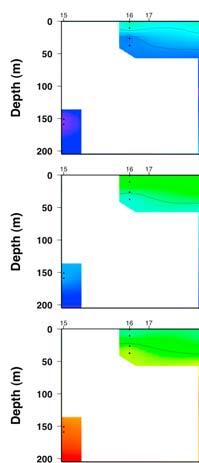
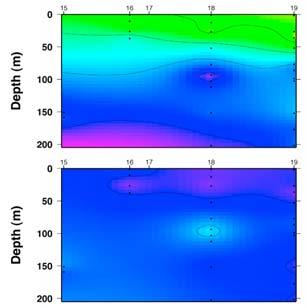
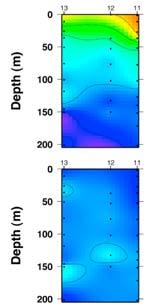
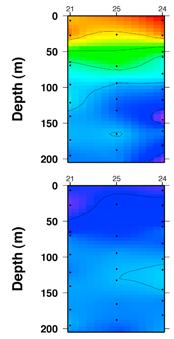
8 region of the sampling area. Waters with these characteristics were also evident at the stations nearest the shelf break in the southeast Canada Basin (stations 1, 28 and 30). In 2004, a station was also occupied in Amundsen Gulf (70 33 N, W, water depth ~650 m; labeled AG on Fig. 1), which lies to the southeast of the Canada Basin and constitutes a major entrance to the passages of the Archipelago. Surface waters (0-20 m) at this station were characterized by extremely low salinity (20-30) and warm temperatures ( C), and the Ba concentration of the single water sample collected in this depth range was 65 nmol Ba l -1 (Fig. 4). As depth decreased between 20 m and 125 m, salinity increased from 30.0 to Temperature decreased from 0.6 C to a minimum value of -1.5 C at 97 m, rising back to -1.4 C at 125 m. Elevated Ba concentrations were observed at these depths, decreasing from a value of 86 nmol Ba l -1 at 25 m to a value of 75 nmol Ba l -1 at 125 m. Between depths of 125 m and 200 m, salinity increased from 33.1 to 34.4 and temperature increased from -1.4 C to -0.2 C. Dissolved Ba concentrations in the samples from this depth range decreased from 70 nmol Ba l -1 at a depth of 145 m to 56 nmol Ba l -1 at a depth of 205 m. Composition of upper Canada Basin waters based on salinity-oxygen isotope mass balance Salinity and oxygen isotope measurements (reported in Yamamoto-Kawai et al., 2008) were used to calculate the composition of the samples collected from the upper 200 m at the hydrographic stations occupied in 2003 and 2004 (Figs. 5-7). Adopting the convention used by others in previous work (e.g., Östlund and Hut, 1984; Bauch et al., 1995; Macdonald et al., 2002; Yamamoto-Kawai et al., 2008), upper Canada Basin waters were assumed to contain a mixture of three end-members: sea ice melt, meteoric (comprising precipitation as well as runoff from Eurasian and North American rivers), and saline (a mixture of Pacific and Atlantic source waters). The values of salinity and δ 18 O assigned to sea ice melt, meteoric water, Atlantic water
9 and Pacific water are those used by Yamamoto-Kawai et al., 2008 (Table 1). For samples with salinity 33 (i.e., collected from above the nutrient maximum in the Canada Basin; Jones et al., 1991) the saline end-member was assumed to contain only Pacific water and is therefore assigned the salinity and δ 18 O values of Pacific water. For samples with salinity > 33, the saline end-member is assumed to contain a mixture of Pacific and Atlantic waters in a ratio calculated from nutrient measurements (reported in Yamamoto-Kawai et al., 2008) according to the method described in Jones et al., 1998: P Atl = (N obs ) / , (1) P Pac = (N obs ) / , (2) R mix = (P obs + P Atl ) / (P Pac + P Atl ), (3) where N obs and P obs are the nitrate and phosphate concentrations measured in the water sample, P Atl is the phosphate concentration calculated using the nitrate:phosphate relationship for Atlantic water reported in Jones et al., 1998, P Pac is the phosphate concentration calculated using the modified nitrate:phosphate relationship for Pacific water reported in Yamamoto-Kawai et al., 2008, and R mix is the ratio of Pacific water to Atlantic water in the saline end-member (the uncertainty in the calculated values of R mix is estimated to be < 0.14). The salinity and δ 18 O values for the mixed saline end-member are then calculated according to the following equations: S s = S PW * R mix + S AW * (1 R mix ) (4) δ s = δ PW * R mix + δ AW * (1 R mix ) (5) The proportion of the sea ice melt, meteoric, and saline end-members contained in each sample is determined by solving the following mass balance equations for salt and δ 18 O: f i + f m + f s = 1, (6)
10 f i S i + f m S m + f s S s = S obs, (7) f i δ i + f m δ m + f s δ s = δ obs, (8) where f, S, and d represent the fraction, salinity and δ 18 O values of the end-members (the subscripts i, m, and s correspond to sea ice melt, meteoric, and saline end-members, respectively) and S obs and δ obs are the salinity and δ 18 O values measured for each water sample. The uncertainties in the calculated values of f i, f m, and f s (due to the precision of the δ 18 O measurements (± 0.04 or lower), the uncertainties in the end-member S and δ 18 O values, and the uncertainty in the values calculated for R mix ) are estimated to be 0.03, 0.03 and 0.14, respectively. Determination of Eurasian and North American runoff contributions based on dissolved barium measurements Runoff to the Arctic Ocean from North American rivers is significantly elevated in dissolved Ba relative to runoff from Eurasian rivers (Table 2). This reflects the differences in the distributions of rock types in the watersheds of these rivers (Guay, 1997). It is therefore possible to incorporate dissolved Ba measurements with results from the salinity-oxygen isotope mass balance to resolve the meteoric fraction into contributions from Eurasian and North American river runoff (Figs. 8-10). In using this approach, it is necessary to assume that the meteoric fraction of upper Canada Basin waters is composed entirely of river runoff (i.e., no significant contribution from net precipitation) and that Ba behaves conservatively. While these assumptions may lead to inaccuracies for waters that have been altered significantly by intense seasonal biological activity and/or received large amounts of direct precipitation (e.g., coastal waters and ice-free surface waters in the Chukchi Sea during summer), it should provide reasonable results for waters in which biological drawdown is minimal and Ba behaves
11 conservatively (e.g., areas beneath the ice cover in the interior Canada Basin). The fractions of Eurasian and North American runoff are calculated from the following mass balance equations: f E + f N = f m, (9) f i [Ba] i + f s [Ba] s + f E [Ba] E + f N [Ba] N = [Ba] obs, (10) where f E and f N are the fractions of Eurasian and North American runoff, f i, f s, and f m are the fractions of the sea ice melt, saline, and meteoric end-members calculated previously from the salinity-oxygen isotope mass balance (Equations 1-8), [Ba] i, [Ba] s, [Ba] E and [Ba] N are the dissolved Ba concentrations of the sea ice melt, saline, Eurasian runoff and North American runoff end-members, and [Ba] obs is the dissolved Ba concentration measured for each water sample. A value of 5 ± 1 nmol Ba l -1 is used for the dissolved Ba concentration of the sea ice melt end-member (Guay and Falkner, 1997; Taylor et al., 2003). For samples with salinity 33, the saline end-member is assumed to contain only Pacific water and is therefore assigned the dissolved Ba concentration of Pacific water (55 ± 5 nmol Ba l -1 ; Guay and Falkner, 1997). For samples with salinity > 33, the saline end-member is assumed to contain a mixture of Pacific and Atlantic waters. The dissolved Ba concentration for the mixed saline end-member is then calculated according to the following equation: [Ba] s = [Ba] PW * R mix + [Ba] AW * (1 R mix ) (11) where [Ba] s is the dissolved Ba concentration of the mixed saline end-member, [Ba] PW is the dissolved Ba concentration of Pacific water, [Ba] AW is the dissolved Ba concentration of Atlantic water (43 ± 3 nmol Ba l -1 ; Guay and Falkner, 1997), and R mix is the mixing ratio of Pacific water to Atlantic water in the sample determined previously from nutrient measurements.
12 Choosing values of dissolved Ba concentration for the river runoff end-members is complicated by the enhancement of dissolved Ba in estuaries due to desorption of Ba 2+ from suspended fluvial particles upon encountering seawater cations at increasing salinities [Edmond et al., 1978; Carroll et al., 1993]. An effective river end-member dissolved Ba concentration can be determined by constructing a plot of [Ba] vs. salinity for samples collected throughout the estuary and extrapolating the linear portion of the Ba-salinity trend back to its intercept on the [Ba] axis at salinity = 0. This provides a more accurate assessment of the actual amount of dissolved Ba delivered to ocean waters by river discharge and typically results in an effective river end-member [Ba] value significantly higher than the dissolved Ba concentrations measured in river water samples collected above the estuary (Table 2). The Mackenzie River is the largest river entering the Arctic Ocean from North America. The effective river end-member [Ba] value determined for the Mackenzie River based on samples collected through the salinity gradient in the estuary is 520 nmol Ba l -1 [Guay and Falkner, 1998]. This is significantly higher than the flow-weighted average dissolved Ba concentration of 371 nmol Ba l -1 observed in Mackenzie River waters collected above the estuary over a multi-year sampling period [Cooper et al., 2008]. Similar dissolved Ba concentrations were measured in river water samples collected above the salinity gradient in the Yukon River (371 nmol Ba l -1 ; Cooper et al., 2008) and the Colville River (369 nmol Ba l -1 ; Rember and Trefry, 2004), which is the largest river draining into the Arctic from the north slope of Alaska. Although no data are available from the estuaries of these rivers, it is assumed that the enhancement of dissolved Ba due to the desorption of Ba 2+ ions from suspended particles is similar to that observed for the Mackenzie River. A value of 520 nmol Ba l -1 is therefore chosen as the effective dissolved Ba concentration for the North American runoff end-member.
13 Flow-weighted average dissolved Ba concentrations are significantly lower in the four largest rivers entering the Arctic Ocean from Eurasia: the Lena (104 nmol Ba l -1 ), Ob (141 nmol Ba l -1 ), Yenisey (76 nmol Ba l -1 ), and Kolyma (63 nmol Ba l -1 ) [Cooper et al., 2008]. The flowweighted average values for the Lena and Ob rivers are significantly higher than dissolved Ba concentrations reported previously for these rivers based on a more limited set of samples [Guay and Falkner, 1998]. It is therefore likely that the effective river end-member [Ba] values determined by Guay and Falkner (1998) for the Lena and Ob rivers (130 nmol Ba l -1 and 100 nmol Ba l -1, respectively) underestimate the actual dissolved Ba loads associated with runoff from these rivers. The effective river end-member [Ba] value determined by Guay and Falkner (1998) for the Yenisey River (125 nmol Ba l -1 ) appears reasonable in light of the agreement between their reported range of dissolved Ba concentrations ( nmol Ba l -1 ) and the flowweighted average dissolved Ba concentration (76 nmol Ba l -1 ) reported by Cooper, et al., Based on these data and the relative sizes of the mean annual discharges of these rivers (Table 2), a value of 130 nmol Ba l -1 is chosen as the effective dissolved Ba concentration for the Eurasian runoff end-member. To assess the sensitivity of the mass balance to the values of [Ba] chosen for the North American and Eurasian runoff end-members, the calculations were performed while varying the range of the reported values by ± 15% (i.e., nmol Ba l -1 for the North American runoff end-member and nmol Ba l -1 for the Eurasian runoff end-member). This resulted in changes of 0.02 to the calculated values of f N and f E. By comparison, varying the values of [Ba] for Pacific water, Atlantic water, and the sea ice melt end-member over their reported ranges of uncertainty resulted in changes of 0.02, 0.008, and 0.001, respectively, to the calculated values of f N and f E.
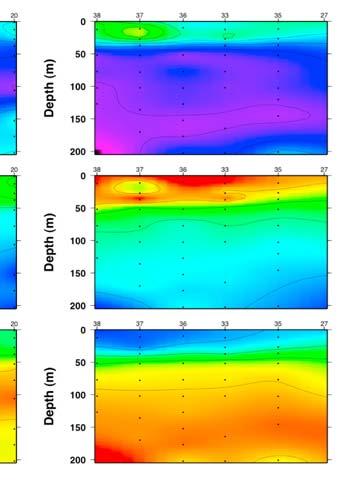
14 4. Discussion Surface mixed layer Relatively fresh (S < 31), near-freezing (T < -1 C) waters characteristic of the surface layer in the western Arctic Ocean (e.g., the Polar Surface Layer defined in Morison et al., 1996) were observed in the upper 50 m of the water column throughout the interior Canada Basin in 2003 and In general, upper Canada Basin waters were fresher in 2004 relative to This may be partly due to differences in the geographical distributions of sampling locations in the two years, but the overall trend is consistent with direct comparisons between individual stations occupied in the exact same locations during the 2003 and 2004 cruises e.g., station 8 in 2003 and station 4 in 2004; station 33 in 2003 and station 18 in 2004; etc. In addition, low-salinity surface waters were observed at two stations in the southeast Canada Basin closer to the shelf break than any of the stations occupied in the area in At station 28, extremely fresh (S = ), warm (T > 5 C) waters highly elevated in Ba (119 nmol Ba l -1 ) were observed in the upper 15 m of the water column. At station 1, the upper 15 m of the water column was also characterized by relatively low salinity values ( ), but temperature (-1.0 to 0.8 C) and Ba (66 nmol Ba l -1 ) were only slightly elevated compared to waters over a similar depth range at nearby stations. The surface layer in the central Canada Basin contained significant amounts of both meteoric water and sea ice melt, with the meteoric component generally much larger than the sea ice melt component (highest meteoric fractions were times greater than the highest sea ice melt fractions). In both 2003 and 2004, the meteoric fraction was > 9% in the upper 50 m of the water column throughout the sampling area, decreasing steadily with depth in subsurface waters (Figs. 5-6). Excluding an exceptionally high value (24%) observed for the uppermost sample (6
15 m) at the southern end of transect B (station 28) in 2004, the range of values observed for the meteoric fraction in the upper 50 m was slightly lower in 2004 (upper quartile: 12-15%) compared to 2003 (upper quartile: 13-15%). Highest values (> 12%) were also confined to a less extensive area in the southern and eastern areas of the Canada Basin in 2004 relative to In contrast, much higher sea ice melt fractions were widely observed in 2004 relative to 2003 (especially in the southern regions of the Canada Basin). In 2003, the sea ice melt fraction in the upper m of the water column over the central Canada Basin generally ranged between 0% and 2%, with exceptionally high values (2-6%) observed in the southeast region of the sampling area in the vicinity of the Beaufort Sea (stations 37-38; Fig. 5). In 2004, sea ice melt fractions > 4% were observed throughout the sampling area at similar depths, reaching values as high as 9-10% at the southern ends of transect A (station 2) and transect B (station 29; Fig. 6). This suggests that the freshening observed in surface waters in the sampling area from 2003 to 2004 was primarily due to increased sea ice melt, which is consistent with observations of accelerating rates of reduction in sea ice extent and concentration in the Canada Basin since the late 1990s [Shimada et al., 2006]. The meteoric fraction of surface waters in the sampling area was dominated by Eurasian runoff in both years. In 2003, the fraction of Eurasian runoff was greater than 12% in the upper 35 m over the southern and central regions of the Canada Basin, with highest values (14-15%) observed near the surface at stations 7, 33 and 37 (Fig. 8). In 2004, Eurasian runoff fractions greater than 12% were once again observed in the upper 35 m of the water column in the Canada Basin, but they were confined to a smaller area relative to 2003 (Fig. 9). With a few exceptions (e.g., the uppermost sample at station 3 along transect A), Eurasian runoff fractions above 12% were only observed east of 145 W longitude and south of 75 N latitude. At stations occupied in
16 the western region of the Canada Basin (transect A and the western end of transect D), the Eurasian runoff fraction observed in the upper 35 m in 2004 was lower relative to measurements made in similar locations in 2003 (e.g., the Eurasian runoff fraction was 9-12% in samples collected from depths above 25 m at station 3 in 2004, while values of 13-15% were observed in samples collected from depths above 25 m at station 7 in 2003). In both years, the Eurasian runoff fraction remained above 6% down to depths of 50 m throughout the sampling area. In 2003, none of the stations in the Canada Basin contained significant amounts of North American runoff in the upper 50 m (the fraction of North American runoff ranged between -2% and 2%, which is indistinguishable from zero within the level of uncertainty of the mass balance calculations; Fig. 8). In 2004, the presence of North American runoff in the upper 50 m was evident only in the uppermost sample (depth = 5 m) collected at the southernmost station occupied in the Canada Basin (station 28; Fig. 9). The significant North American runoff fraction in this sample (12%), coupled with extremely low salinity (24.5), high temperature (5.5 C), and high [Ba] (119 nmol l -1 ) associated with this sample, along with the geographical location of station 28, suggest the influence of discharge from the Mackenzie River. Waters with similar properties were not observed in any of the samples from greater depths ( 25 m) at station 28, nor were they observed any depths at neighboring stations along transects B and D. It therefore appears that surface waters containing discharge from the Mackenzie River were confined to the extreme south of the Canada Basin and adjacent areas over the shelf in 2003 and This is consistent with the findings of Yamamoto-Kawai et al., 2005, which indicated that a significant source of meteoric water besides North American runoff is required to account for the distribution of alkalinity observed in the southern Canada Basin. Summer Bering Strait inflow
17 Two distinct types of summertime Pacific source waters to the Canada Basin have been identified [Steele et al., 2004; Shimada et al., 2001; Coachman et al., 1975], both of which enter the basin at depths below the fresher, less dense surface layer and contribute to the upper halocline: Alaskan Coastal Water (ACW), which flows through the eastern side of Bering Strait and continues northward in a narrow coastal current, and summer Bering Sea Water (sbsw), which is a combination of Bering Shelf Water and Gulf of Anadyr Water that occupies the central Chukchi Sea and is strongly influenced by seasonal heating and freshening. During its transit through the eastern Bering and Chukchi seas, ACW is warmed due to high summertime insolation and freshened from large contributions of runoff, particularly from the Yukon River. ACW enters the Canada Basin primarily through Barrow Canyon, where a portion is diverted northwards into the interior of the basin [Weingartner et al., 1998; Coachman et al., 1975] while the rest is transported eastward in a subsurface boundary current towards the Beaufort Sea [Steele et al., 2004; Aagaard, 1984]. The relatively cooler, more saline sbsw flows primarily northward from the Chukchi Sea into the Canada Basin via Herald Canyon and the Central Channel (also referred to as Hanna Trough), although some amount is entrained into the flow of ACW through Barrow Canyon. Steele et al., 2004, report temperature and salinity ranges of 0-6 C and for ACW and 0-2 C and for sbsw. Lower salinities were observed for both types of water by Woodgate and Aagaard, 2005, in Bering Strait, with a range of in the buoyant ACW in the upper 35 m near the Alaskan coast and a range of in the rest of the waters occupying the eastern half of the strait between Alaska and the Diomede Islands. The layer of relatively warm waters observed between approximately 30 m and 80 m throughout the Canada Basin in 2003 and 2004 is associated with summertime Pacific inflow
18 through Bering Strait. In our results from 2003, ACW was evident as the mass of exceptionally warm (2.0 C < T < 4.2 C) water occupying depths of m at stations 2-4 over the shelf break east of Barrow Canyon. The highly depleted Ba concentrations measured in these waters reflect the biological uptake of Ba from surface waters in the eastern Bering and Chukchi seas during the summertime period of intense productivity [Guay and Falkner, 1998; Falkner et al., 1994]. The ACW signal was attenuated but still obvious in the temperature and Ba distributions at station 6 located ~200 km beyond the shelf break along transect A, northeast of Barrow Canyon. The presence of two distinct subsurface temperature maxima at station 6 suggests a combination of ACW overlying sbsw [Steele et al., 2004] entrained in the inflow through Barrow Canyon and/or advected from entry points further to the west along the Chukchi shelf break. In 2004, warm waters characterized by two separate subsurface temperature maxima were again observed at depths of m in offshore waters northeast of Barrow Canyon (although there was no obvious evidence of waters extremely depleted in Ba as was observed in 2003) and at stations in the southern and eastern region of the sampling area. Throughout the Canada Basin, the properties of the warm layer observed at depths of m in both years was consistent with a mixture of ACW and sbsw, with the prevalence of ACW decreasing with distance away from the transport pathway of ACW through Barrow Canyon and the eastward boundary current over the slope north of Alaska. Relatively high sea ice melt (> 2%) and significant amounts of meteoric water (up to 12%) extended from the surface to depths as great as 80 m over the shelf break at the southern end of transect A (stations 2-4), which is consistent with their formation over the Bering and Chukchi shelves during the summer. The influence of waters with these properties was evident in the warm layer present at depths of m throughout the Canada Basin in 2003 and The
19 mass balance incorporating Ba measurements suggest that most of the meteoric fraction in these waters is attributable to Eurasian runoff, while contributions from North American runoff are small or negligible. This is consistent with a large contribution to this layer by sbsw, which is formed in regions of the Chukchi Sea influenced by the eastward transport of shelf waters from the adjacent East Siberian Sea. The fraction of North American runoff may be underestimated, however, as a result of the non-conservative depletion of Ba observed in the ACW inflow, which transports the bulk of the discharge from the Yukon River. The extreme negative values (-3% to -6 %) calculated for the fraction of North American runoff at stations west of Barrow Canyon in 2003 are a result of the low Ba concentrations measured in these waters that were attributed to biological drawdown associated with high summertime productivity in the eastern Bering and Chukchi seas. The period of maximum productivity coincides with the period of highest flows in the Yukon River, when the majority of its discharge is entrained in the northward flux of ACW through Bering Strait. If large amounts of Ba are stripped from a significant portion of the ACW inflow to the Canada Basin during this period, a mass balance based on a North American runoff end-member with [Ba] = 520 nmol Ba l -1 would not sufficiently capture the contribution from the Yukon River. Winter Bering Strait inflow Winter Bering Sea Water (wbsw) constitutes a third type of Pacific source water to the Canada Basin [Steele et al., 2004; Coachman et al., 1975]. This water mass resides below ACW and sbsw in the Canada Basin halocline and is characterized by near-freezing temperatures and a nutrient maximum centered at a salinity of 33.1 [Jones and Anderson, 1986]. The properties of wbsw are conditioned by ice formation and brine rejection occurring in its source regions over the Bering and Chukchi shelves during the winter. Remineralization of sediments deposited
20 during the period of high productivity in the summer may also contribute to the relatively high nutrient levels characteristic of this water mass. In 2003 and 2004, wbsw was evident at depths of m throughout sampling area as a layer of cold (T < -1 C), Ba-enriched (65-75 nmol Ba l -1 ) waters with its core situated around the 33.1 isohaline. The fraction of sea ice melt within this layer was highly negative (-4% to -8%), indicating the influence of sea ice formation on wbsw. The prevalence of extremely low values (< -6%) at stations in the vicinity of the Chukchi shelf break are consistent with a source region over the Bering and Chukchi shelves. Similarly low values were also observed at stations in the vicinity of the Beaufort shelf break, suggesting that waters formed over the Beaufort shelf in winter may have also contributed to this layer in the Canada Basin. The absence of waters with these properties at the stations occupied over the Chukchi Borderland in 2003 (transect F) provides further evidence that this layer comprises inputs from the Bering, Chukchi, and/or Beaufort seas, as opposed to waters advected eastward from areas of formation over the Eurasian shelves. In both 2003 and 2004, the fraction of meteoric water in this layer was generally between 3% and 6% and decreased steadily with depth. The Eurasian runoff fraction ranged from 0% to 5% in both years, with comparable values (0-5%) observed for the fraction of North American runoff. With the exception of a limited number of surface samples, this is the only layer where positive North American runoff fractions (i.e., clearly distinguishable from zero given the reported level of uncertainty) were regularly observed. While this is consistent with the geographical proximity of North American rivers to the areas where wbsw is formed, it is possible that the amount of North American runoff contained in this layer was overestimated by the mass balance. The processes of ice formation/brine rejection and sediment remineralization
21 responsible for the nutrient maximum observed in wbsw could also lead to enrichment of Ba in these waters, which would result in the calculation of artificially high North American runoff fractions. Export via the Canadian Arctic Archipelago The station occupied in the Amundsen Gulf in 2004 gives an indication of the composition of waters exported from the southern Canada Basin through the passages of the Archipelago. The upper 20 m of the water column were warm and very fresh, containing a large fraction of sea ice melt and significant amounts of runoff from Eurasian and North American sources (Figs. 7, 10). For the only sample collected from this depth range (5 m), the sea ice melt fraction was 25% and the meteoric fraction was 11%, with roughly 2.5 times as much Eurasian runoff as North American runoff (8% and 3%, respectively). These properties could have resulted from a mixture of surface waters from the interior Canada Basin (dominated by Eurasian runoff), surface waters from the Beaufort Sea influenced strongly by North American runoff (particularly from the Mackenzie River), and a large pulse of meltwater from sea ice melted locally during the summer season. The temperature decreased rapidly at depths below 20 m, remaining near freezing down to ~125 m. The meteoric fraction dropped from 11% to 6% over this depth range, with the Eurasian runoff component steadily decreasing (7% to 2%) while the North American runoff fraction remained roughly constant (~4%). The prevalence of North American runoff contained in these waters indicates that they did not result simply from advection of cold surface waters from the interior Canada Basin, and the influence of net sea ice formation was evident from the highly negative values of sea ice melt fraction in all samples collected from this depth range (-7% to -9%). This suggests the presence of a winter water mass from a source region strongly
22 impacted by North American runoff i.e., formed locally or advected from the adjacent regions of the Beaufort Sea. Temperature increased steadily at depths below 125 m. In the samples collected between 145 m and 205 m, the sea ice melt fraction was negative (-1% to -4%) but not as low as values in the immediately overlying waters. The meteoric fraction in these waters was relatively low ( 2%), with negative values calculated by the mass balance for the Eurasian runoff fraction. Salinity at these depths ( ) was well above the range of summertime Pacific waters (ACW and sbsw), indicating that mixing with underlying Atlantic waters was the source of the warming observed in this layer. The areas encompassed by the profiles of Eurasian runoff fraction and North American runoff fraction in the upper 200 m at this station (Fig. 10) were similar, suggesting that roughly comparable amounts of Eurasian runoff and North American runoff were transported over all depths in the waters exported from the Canada Basin eastwards through the Amundsen Gulf. While this observation represents a one-time sampling at a single location and does not account for temporal variability in the magnitude and direction of flow through the Amundsen Gulf, it provides evidence in support of a significant transport pathway by which North American runoff exits the Arctic to the North Atlantic via the Archipelago. This is consistent with our overall results from 2003 and 2004, which indicated that North American runoff was largely confined to nearshore regions of the southern Canada Basin instead of being transported offshore and becoming incorporated in the Beaufort Gyre, where it would be available for export to the North Atlantic via Fram Strait. Relationship between atmospheric forcing and transport of fluvial discharge
23 Due to the sensitive coupling between Arctic atmospheric and oceanic circulation, it is necessary to consider the variability in atmospheric forcing when assessing the degree to which the observations in the Canada Basin are representative of long-term conditions. The basin-scale atmospheric forcing regime in the Arctic has been described by an Arctic Oscillation (AO) index based on the leading EOF of wintertime sea level pressure poleward of 20 N [Thompson and Wallace, 1998]. This pattern of sea level pressure variability can be interpreted as surface signature of modulations in the strength of the stratospheric polar vortex: Positive values of the AO index are associated with a strong polar vortex and low sea level pressure over the central Arctic, and vice versa. Starting in 1989, the AO index shifted into a period of persistent, high positive values that lasted through A complex series of interrelated responses in ocean circulation were observed in conjunction with this shift in atmospheric forcing, including the greater penetration of warm Atlantic waters into the central Arctic Ocean [Carmack et al., 1995; Carmack et al., 1997; Morison et al., 1998], movement of the axis of the Transpolar Drift from a position over the Lomonosov Ridge to a position over the Mendeleyev Ridge [Carmack et al., 1995; McLaughlin et al., 1996; Morison et al., 1998], the reduction of the area occupied by the Beaufort Gyre and the retreat of its core towards the southern Canada Basin, and the disappearance of the cold halocline layer from the Nansen, Amundsen and Makarov basins [Steele and Boyd, 1998]. The overall ocean response to atmospheric forcing embodied by positive and negative phases of the AO has been described by cyclonic and anticyclonic ocean circulation regimes, respectively, which are related to patterns of sea surface height in the Arctic Ocean [Proshutinsky and Johnson, 1997].
24 The value of the AO index became negative again in 1996 and has generally remained negative since then (although positive values were observed in 1997, 2000, 2002, and 2007). This has been accompanied by a shift to the anticyclonic mode of ocean circulation and the relaxation of conditions to pre-1990s conditions -- e.g., the retreat of Atlantic waters towards the Eurasian Basin and the return of the Transpolar Drift axis to the Lomonosov Ridge [Morison et al., 2006; Alkire et al., 2007], strengthening of the Beaufort Gyre, and a partial recovery of the cold halocline in the Nansen, Amundsen and Makarov basins [Boyd et al., 2002; Björk et al., 2002]. The transport and fate of Eurasian river runoff also varies with atmospheric forcing conditions. In a positive AO/cyclonic oceanic circulation regime, the large amount of runoff discharged to the Laptev and East Siberian seas (from the Lena River in particular) tends to be confined to nearshore waters and flow eastward along the shelf. Storage of Eurasian runoff over the Laptev and East Siberian shelves increases [Dmitrenko et al., 2008; Steele and Ermold, 2004] and the primary insertion point of Eurasian shelf waters into the central Arctic moves eastwards to the East Siberian Sea, accompanying the shift of the Transpolar Drift axis towards the Mendeleyev Ridge [Guay et al., 2001; Schlosser et al., 2002; Newton et al., 2008]. Steele and Boyd, 1998, explained the retreat of the cold halocline from the Eurasian basin observed in the early-to-mid 1990s as a result of the eastward diversion of Eurasian runoff associated with the predominantly positive AO conditions prevailing during the period. Conversely, these conditions would favor the transport of Eurasian runoff towards the Chukchi Sea and Canada Basin. In a negative AO/anticyclonic ocean circulation regime, Eurasian runoff tends to be transported directly across-shelf from the river mouths towards the interior Arctic basins
25 [Dmitrenko et al., 2008; Steele and Ermold, 2004]. The delivery of Eurasian runoff to the central Arctic increases, and the primary insertion point of Eurasian shelf waters moves westwards towards the Laptev Sea, accompanying the movement of the Transpolar Drift axis towards the Lomonosov Ridge. The increased supply of Eurasian runoff to the Eurasian Basin associated with the persistence of anticyclonic ocean conditions since 1997 has been put forth as an explanation of the partial recovery of the cold halocline in the region observed from [Boyd et al., 2002; Björk et al., 2002]. These conditions would not be favorable to the direct transport of Eurasian runoff eastwards towards the Chukchi Sea and Canada Basin. While this idealized relationship between Eurasian runoff transport and basin-scale atmospheric forcing provides a useful first-order description, it does not fully capture the complexity of the real system. The East Siberian Sea is a dynamic zone of interaction between Eurasian shelf waters and Pacific waters from a branch of the Bering inflow that enters via westward flow from the Chukchi Sea [Semiletov et al., 2005; Jones et al., 1998]. High variability has been observed in both the speed and direction of currents flowing between the Chukchi, East Siberian and Laptev seas [e.g., Weingartner et al., 1999; Munchow et al., 1999], and the importance of local wind conditions (especially during the summertime period of maximum river discharge) in determining the transport pathways of Eurasian runoff has been demonstrated [Guay et al., 2001; Dmitrenko et al., 2005]. Regardless of the state of basin-scale atmospheric forcing (positive or negative AO index) or ocean circulation regime (cyclonic or anticyclonic), significant amounts of Eurasian runoff can be transported to the Canada Basin by entrainment of Transpolar Drift waters into the adjacent Beaufort Gyre and/or direct inflow of shelf waters from the East Siberian Sea and adjacent areas of the Chukchi Sea in the region between the southern terminus of the
26 Mendeleyev Ridge and the Chukchi Borderland. This also implies that, under any conditions, Eurasian runoff will be contained in waters exported from the Arctic through Fram Strait and the Archipelago. This is consistent with our observations of large fractions of Eurasian runoff in surface waters throughout the sampling area (including the Amundsen Gulf) in in spite of the prevailing negative AO index and anticyclonic ocean circulation regime during this period. With respect to North American source of runoff to the Canada Basin, the transport pathways of contributions from the Yukon and Mackenzie rivers must be considered separately. The majority of discharge from the Yukon River (and other rivers flowing into the eastern Bering and Chukchi seas from western Alaska) is entrained in the swift, shallow, narrow flow of ACW that hugs the western Alaskan coast and enters the Canada Basin via subsurface flow through Barrow Canyon and the eastward subsurface boundary current paralleling the shelf/slope north of Alaska. Steele et al., 2004, observed that ACW was entrained in the compressed Beaufort Gyre and eastward boundary current in the southern Canada Basin during the period of strongly positive AO index in the late 1980s and early 1990s. They speculated that ACW (and therefore Yukon runoff) would be largely confined to the southern Canada Basin during periods of positive AO/cyclonic conditions, where its only available exit route to the North Atlantic would be via the Archipelago; whereas during periods of negative AO/anticyclonic conditions, ACW would be more broadly distributed throughout the Beaufort Gyre and could become incorporated in waters exiting the Arctic through Fram Strait as well as the Archipelago. Our observations in 2003 and 2004 (during negative AO conditions) show no indications of Yukon runoff in areas of the Beaufort Gyre away from the southern/eastern Canada Basin, but its presence may not have been obvious in the tracer distributions especially if biological
27 drawdown of Ba from summertime surface waters in the eastern Bering and Chukchi seas resulted in the underestimation of Yukon contributions to the North American runoff fraction. Under either atmospheric/oceanic circulation regime, Yukon runoff is largely incorporated into the upper halocline layer and does not contribute significantly to the surface layer in the Canada Basin. Runoff from the Mackenzie River (and, to a lesser extent, from rivers draining the north slope of Alaska) will tend to be steered eastwards after leaving the river mouth and accumulate over the Beaufort Shelf and adjacent areas of the southeastern Canada Basin, where its only available export pathway to the North Atlantic will be via the Archipelago. This mechanism is consistent with results from a transect across Fram Strait in 1998, during which significant amounts of Eurasian runoff but no detectable North American runoff were observed in waters exiting the Arctic in the upper East Greenland Current [Taylor et al., 2003]. During periods when local winds favorable to offshore transport persist over the Beaufort Sea in summer/fall (i.e., when the runoff content of shelf waters is highest), Mackenzie runoff can be transported offshore into the Canada Basin. This was observed during the Surface Heat Budget of the Arctic Ocean (SHEBA) experiment in 1997, when a low-salinity anomaly formed in the southern Beaufort Gyre [Macdonald et al., 1999; McPhee et al., 1998]. Measurements of salinity, oxygen isotopes, and dissolved Ba demonstrated that the source of the excess freshwater was primarily runoff from the Mackenzie River [Macdonald et al., 1999; Macdonald et al., 2002]. Subsequent modeling studies confirmed that wind-driven northwestward advection of water from the Mackenzie Delta in created the freshwater anomaly, which persisted until 2002 [Steele et al., 2006]. The model results also indicated that over roughly the past three
28 decades ( ), wind-driven northwest transport offshore from the Mackenzie Delta in summer/fall was an anomalous condition (observed in , 1990, 1995, and ). The transport of Mackenzie runoff to the Beaufort Gyre associated with the formation and maintenance of the freshwater anomaly occurred after the shift from positive AO to negative AO that occurred in The Mackenzie runoff would have therefore been entrained into a strong, expanded Beaufort Gyre, with the possibility of exiting the Arctic via Fram Strait as well as being exported through the Archipelago (note that since the low-salinity anomaly first appeared in the southern Beaufort Gyre in 1997, any associated Mackenzie runoff signal would not have had sufficient time to reach Fram Strait by the time that the transect described by Taylor et al., 2003, was occupied in late summer/fall of 1998). It must be remembered, however, that the occurrence of negative AO/anticyclonic ocean circulation conditions do not necessarily imply that Mackenzie runoff will be entrained in Beaufort Gyre waters and subsequently exported through Fram Strait. If the anomalous winds driving offshore transport from the Beaufort Sea are not also present, Mackenzie runoff will remain in nearshore waters over the shelf and flow eastward into the Archipelago. This situation is characterized by our 2003 and 2004 observations, which showed no signs of Mackenzie runoff beyond nearshore waters in the vicinity of the Beaufort Sea and Amundsen Gulf in spite of the anticyclonic ocean circulation regime prevalent at the time. Alternatively, during periods when cyclonic ocean conditions prevail, Mackenzie runoff can still be transported to the Beaufort Gyre if local winds favorable to offshore transport persist over the Beaufort Sea. But the Beaufort Gyre will be compressed and pushed back towards the southern Canada Basin, making its waters (along with any entrained Mackenzie runoff) more
29 likely to be exported through the Archipelago instead of exiting the Arctic with Transpolar Drift waters via Fram Strait. 5. Conclusions These results further demonstrate the utility of dissolved Ba, in combination with other physical and geochemical tracers, for investigating Arctic Ocean circulation. Of particular value is the ability of dissolved Ba to differentiate runoff from North American and Eurasian sources. Our observations indicate that Eurasian runoff dominated the fraction of meteoric water contained in the surface layer in the Canada Basin in 2003 and Runoff from the Yukon River was incorporated into Alaskan Coastal Water, a summer Pacific water mass that flows in a shallow, buoyant current in the eastern Bering and Chukchi seas and enters the Canada Basin below the surface layer via flow through Barrow Canyon and an eastward boundary current that parallels the slope north of Alaska. The non-conservative drawdown of Ba from surface waters in the eastern Bering and Chukchi seas associated with intense summertime productivity in these areas makes it difficult to explicitly account for Yukon runoff in the fraction of North American runoff determined by incorporating dissolved Ba measurements with results from a salinityoxygen isotope mass balance. Based on the signature of Alaskan Coastal Water in the salinity and temperature distributions, it was inferred that the majority of Yukon runoff becomes entrained in upper halocline waters and does not contribute significantly to the surface layer in the Canada Basin. Runoff from the Mackenzie River was confined to the Beaufort Sea and adjacent areas of the southeastern Canada Basin in 2003 and 2004, flowing eastward through the Canadian Arctic Archipelago to ultimately be exported to the North Atlantic in the vicinity of the Labrador Sea. This is presumed to be the prevalent pathway for Mackenzie runoff, but the transport of waters northwestward from the Mackenzie Delta to the Beaufort Gyre can occur
30 when anomalous wind conditions drive offshore transport from the Beaufort Sea. It is evident that the pathways by which runoff from different sources enters the circulation of the Canada Basin and ultimately becomes exported to the North Atlantic depends strongly on both regional wind conditions in summer/fall and the prevalent basin-scale atmospheric forcing and ocean circulation regimes. Ongoing analyses of additional samples collected in will establish a multi-year time series and provide further insight into the transport and fate of fluvial discharge within the Canada Basin. Acknowledgments Thanks to Sarah Zimmermann (Fisheries and Oceans Canada, Institute of Ocean Sciences) and the crew of the CCGS Louis S. St-Laurent for collecting the water samples and CTD data described in this study. Andy Ungerer and Robert Collier (College of Oceanic and Atmospheric Sciences, Oregon State University) provided facilities and assistance with the ICP-MS analyses. Comments from two anonymous reviewers led to significant improvements in the manuscript. Support for this research was provided by the National Science Foundation, Office of Polar Programs (OPP ).
31 References Aagaard, K., and E.C. Carmack (1989), The role of sea ice and other fresh water in the Arctic circulation, J. Geophys. Res., 94, 14,485 14,498. Aagaard, K. (1984), The Beaufort Undercurrent, in The Alaskan Beaufort Sea, edited by P.W. Barnes et al., pp , Academic Press, Inc., Orlando, Fla. Alkire, M.B., K.K. Falkner, I. Rigor, M. Steele, and J. Morison (2007), The return of Pacific waters to the upper layers of the central Arctic Ocean, Deep Sea Res. Part I, 54, Bauch, D., P. Schlosser, and R. Fairbanks (1995), Freshwater balance and sources of deep and bottom water in the Arctic Ocean inferred from the distribution of H 2 18 O, Progr. Oceanogr., 35, G. Björk, J. Söderkvist, P. Winsor, A. Nikolopoulos, and M. Steele, Return of the cold halocline layer to the Amundsen Basin of the Arctic Ocean: Implications for the sea ice mass balance, Geophys. Res. Lett., 29(11), 1513, /2001GL Boyd, T.J., M. Steele, R.D. Muench, and J.T. Gunn (2002), Partial recovery of the Arctic Ocean halocline, Geophys. Res. Lett., 29(14), 1657, /2001GL Carmack, E.C., R.W. Macdonald, R.G. Perkin, F.A. McLaughlin, and R.J. Pearson (1995), Evidence for warming of Atlantic water in the southern Canadian Basin of the Arctic Ocean: Results from the Larsen-93 expedition, Geophys. Res. Lett., 22, Carmack, E.C., K. Aagaard, J.H. Swift, R.W. Macdonald, F.A. McLaughlin, E.P. Jones, R.G. Perkin, J.N. Smith, K.M. Ellis, and L. Kilius (1997), Changes in temperature and tracer distributions within the Arctic Ocean: results from the 1994 Arctic Ocean section, Deep Sea Res. Part II, 44, Carroll, J., K.K. Falkner, E.T. Brown, and W.S. Moore (1993), The role of sediments in maintaining high dissolved 226 Ra and a in the Ganges-Brahmaputra mixing zone, Geochim. Cosmochim. Acta, 57, Coachman, L.K., K. Aagaard, and R.B. Tripp (1975), Bering Strait: The Regional Physical Oceanography, Univ. of Wash. Press, Seattle. Cooper, L.W., R. Benner, J.W. McClelland, B.J. Peterson, R.M. Holmes, P.A. Raymond, D.A. Hansell, J.M. Grebmeier, and L.A. Codispoti (2005), Linkages among runoff, dissolved organic carbon, and the stable oxygen isotope composition of seawater and other water mass indicators in the Arctic Ocean, J. Geophys. Res., 110, G02013, doi: /2005jg Cooper, L.W., J.W. McClelland, R.M. Holmes, P.A. Raymond, J.J. Gibson, C.K. Guay, and B.J. Peterson (2008), Flow-weighted Tracer Content (δ 18 O, DOC, Ba, Alkalinity) of the Six Largest Arctic Rivers, Geophys. Res. Lett., in press.
32 Dmitrenko, I.A., S.A. Kirillov, and L.B. Tremblay, The long-term and interannual variability of summer fresh water storage over the eastern Siberian shelf: Implication for climatic change, J. Geophys. Res., 113, C03007, doi: /2007jc Dmitrenko, I., S. Kirillov, H. Eicken, and N. Markova (2005), Wind-driven summer surface hydrography of the eastern Siberian shelf, Geophys. Res. Lett., 32, L14613, doi: /2005gl Edmond, J.M, E.D. Boyle, D. Drummond, B. Grant, and T. Mislick (1978), Desorption of barium in the plume of the Zaire (Congo) River, Neth. J. Sea Res., 12, Eicken, H., H.R. Krouse, D. Kadko, and D.K. Perovich (2002), Tracer studies of pathways and rates of meltwater transport through Arctic summer sea ice, J. Geophys. Res., 107(C10), 8046, doi: /2000jc Ekwurzel, B., P. Schlosser, R. Mortlock, R. Fairbanks, and J. Swift (2001), River runoff, sea ice meltwater, and Pacific water distribution and mean residence times in the Arctic Ocean, J. Geophys. Res., 106, Falkner, K.K., R.W. Macdonald, E.C. Carmack, and T. Weingartner (1994), The potential of barium as a tracer of Arctic water masses, in The Polar Oceans and Their Role in Shaping the Global Environment, Geophys. Monogr. Ser., vol. 85, edited by O.M. Johannessen et al., pp , AGU, Washington, D.C. Guay, C.K., G.P. Klinkhammer, K.K. Falkner, R. Benner, P.G. Coble, T.E. Whitledge, B. Black, F.J. Bussel, and T.A. Wagner (1999), High-resolution measurements of dissolved organic carbon in the Arctic Ocean by in situ fiber-optic spectrometry, Geophys. Res. Lett., 26(8), Guay, C.K.H. (1997), Barium as a tracer of Arctic halocline and river waters, M.S. thesis, Oregon State Univ., Corvallis, Guay, C.K., and K.K. Falkner (1997), Barium as a tracer of Arctic halocline and river waters, Deep Sea Res. Part II, 44, Guay, C.K., and K.K. Falkner (1998), A survey of dissolved barium in the estuaries of major Arctic rivers and adjacent seas, Cont. Shelf Res., 18(8), Guay, C.K.H., K.K. Falkner, R.D. Muench, M. Mensch, M. Frank, and R. Bayer (2001), Winddriven transport pathways for Eurasian Arctic river discharge, J. Geophys. Res., 106(C6), 11,469 11,480. Jones, E.P., L.G. Anderson, and J.H. Swift (1998), Distribution of Atlantic and Pacific waters in the upper Arctic Ocean: Implications for circulation, Geophys. Res., Lett., 25, Jones, E.P. and L.G. Anderson (1986), On the origin of the chemical properties of the
33 Arctic Ocean halocline. J. Geophys. Res., 91, Jones, E.P., Anderson, L.G., and Wallace, D.W.R. (1991), Tracers of near-surface, halocline and deep waters in the Arctic Ocean: Implications for circulation. J. Mar. Syst., 2, Macdonald, R.W., F.A. McLaughlin, and E.C. Carmack (2002), Fresh water and its sources during the SHEBA drift in the Canada Basin of the Arctic Ocean, Deep Sea Res. Part I, 49, Macdonald, R.W., E.C. Carmack, FA. McLaughlin, K.K. Falkner, and J.H. Swift, (1999), Connections among ice, runoff, and atmospheric forcing in the Beaufort Gyre, Geophys. Res. Lett., 26(15), McLaughlin, F.A., E.C. Carmack, R.W. Macdonald, and J.K.B. Bishop (1996), Physical and geochemical properties across the Atlantic/Pacific water mass front in the southern Canada Basin, J. Geophys. Res., 101, McPhee, M.G., T.P. Stanton, J.H. Morison, and D.G. Martinson (1998), Freshening of the upper ocean in the Arctic: Is perennial sea ice disappearing?, Geophys. Res. Lett., 25, Morison, J., M. Steele, and R. Andersen (1998), Hydrography of the upper Arctic Ocean measured from the nuclear submarine USS Pargo, Deep Sea Res. Part I, 45, Morison, J., M. Steele, T. Kikuchi, K. Falkner, and W. Smethie (2006), Relaxation of central Arctic Ocean hydrography to pre-1990s climatology, Geophys. Res. Lett., 33, L17604, doi: /2006gl Munchow, A., T.J. Weingartner, and L.W. Cooper (1999), The summer hydrography and surface circulation of the East Siberian shelf sea, J. Phys. Oceanogr., 29, Newton, R., P. Schlosser, D. G. Martinson, and W. Maslowski (2008), Freshwater distribution in the Arctic Ocean: Simulation with a high-resolution model and model-data comparison, J. Geophys. Res., 113, C05024, doi: /2007jc Östlund, H. G. and G. Hut (1984), Arctic Ocean water mass balance from isotope data, J. Geophys. Res., 89, Pfirman, S., W. Haxby, H. Eicken, and M. Jeffries (2004), Drifting Arctic sea ice archives changes in ocean surface conditions, Geophys. Res. Lett., 31, L19401, doi: /2004gl Proshutinsky, A. Y. and M. A. Johnson (1997), Two circulation regimes of the wind-driven Arctic Ocean, J. Geophys. Res., 102(C6), 12,493 12,514.
34 Rember, R.D. and J.H. Trefry (2004), Increased concentrations of dissolved trace metals and organic carbon during snowmelt in rivers of the Alaskan Arctic, Geochim. Cosmochim. Acta, 68, Schlosser, P., R. Newton, B. Ekwurzel, S. Khatiwala, R. Mortlock, and R. Fairbanks (2002), Decrease of river runoff in the upper waters of the Eurasian Basin, Arctic Ocean, between 1991 and 1996: Evidence from δ 18 O data, Geophys. Res. Lett., 29(9), 1289, doi: /2001gl Semiletov, I., O. Dudarev, V. Luchin, A. Charkin, K.H. Shin, and N. Tanaka (2005), The East Siberian Sea as a transition zone between Pacific-derived waters and Arctic shelf waters, Geophys. Res. Lett., 32, L10614, doi: /2005gl Shimada, K., E. Carmack, K. Hatakeyama, and T. Takizawa (2001), Varieties of shallow temperature maximum waters in the Western Canadian Basin of the Arctic Ocean, Geophys. Res. Lett., 28, Shimada, K., M. Itoh, S. Nishino, F. McLaughlin, E. Carmack, and A. Proshutinsky (2005), Halocline structure in the Canada Basin of the Arctic Ocean, Geophys. Res. Lett., 32, L03605, doi: /2004gl Shimada, K., T. Kamoshida, M. Itoh, S. Nishino, E. Carmack, F. McLaughlin, S. Zimmermann, and A. Proshutinsky (2006), Pacific Ocean inflow: Influence on catastrophic reduction of sea ice cover in the Arctic Ocean, Geophys. Res. Lett., 33, L08605, doi: /2005gl Steele, M., J. Morison, W. Ermold, I. Rigor, M. Ortmeyer, and K. Shimada (2004). Circulation of summer Pacific halocline water in the Arctic Ocean, J. Geophys. Res., 109, C02027, doi: /2003jc Steele, M., and W. Ermold (2004), Salinity trends on the Siberian shelves, Geophys. Res. Lett., 31, L24308, doi: /2004gl Steele, M., A. Porcelli, and J. Zhang (2006), Origins of the SHEBA freshwater anomaly in the Mackenzie River Delta, Geophys. Res. Lett., 33, L09601, doi: /2005gl Steele, M., and T. Boyd (1998), Retreat of the cold halocline layer in the Arctic Ocean, J. Geophys. Res., 103(C5), 10,419 10,435. Taylor, J.R., K.K. Falkner, U. Schauer, and M. Meredith (2003), Quantitative considerations of dissolved barium as a tracer in the Arctic Ocean, J. Geophys. Res., 108(C12), 3374, doi: /2002jc Thompson, D.W.J. and J.M. Wallace (1998), The Arctic Oscillation signature in the wintertime geopotential height and temperature fields, Geophys. Res. Lett., 25,
35 Weingartner, T.J., S. Danielson, Y. Sasaki, V. Pavlov, and M. Kulakov (1999), The Siberian Coastal Current: a wind and buoyancy-forced arctic coastal current. J. Geophysical Research, 104, 29,697 29,713. Weingartner, T.J., D.J. Cavalieri, K. Aagaard, and Y. Sasaki (1998), Circulation, dense water formation and outflow on the northeast Chukchi Sea shelf, J. Geophysical Research, 103, Woodgate, R.A., and K. Aagaard (2005), Revising the Bering Strait freshwater flux into the Arctic Ocean, Geophys. Res. Lett., 32, L02602, doi: /2004gl Woodgate, R.A., K. Aagaard, and T.J. Weingartner (2005), Monthly temperature, salinity and transport variability of the Bering Strait throughflow, Geophys. Res. Lett., 32, L04601, doi: /2004gl Yamamoto-Kawai, M., N. Tanaka, and S. Pivovarov (2005), Freshwater and brine behaviors in the Arctic Ocean deduced from historical data of δ18o and alkalinity ( A. D.), J. Geophys. Res., 110, C10003, doi: /2004jc Yamamoto-Kawai, M., F.A. McLaughlin, E.C. Carmack, S. Nishino, and K. Shimada (2008), Freshwater budget of the Canada Basin, Arctic Ocean, from salinity, δ 18 O, and nutrients, J. Geophys. Res., 113, C01007, doi: /2006jc
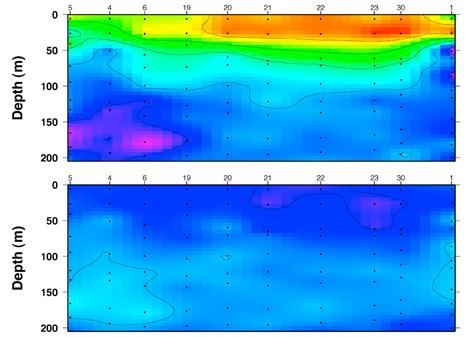
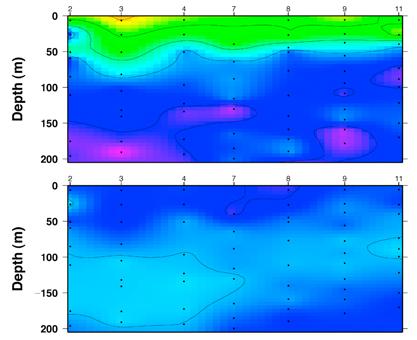
36 Figure Captions Figure 1. Map of sampling area and locations of hydrographic stations occupied in the Canada Basin and adjacent areas in 2003 and Capital letters indicate transects referred to in the text and subsequent figures. Figure 2. Distributions of salinity, temperature, and dissolved Ba in the upper 200 m of the water column at stations occupied in White areas indicate locations at which dissolved Ba samples were not collected. Figure 3. Distributions of salinity, temperature, and dissolved Ba in the upper 200 m of the water column at stations occupied in Figure 4. Profiles of salinity, temperature and dissolved Ba at station AG occupied in the Amundsen Gulf in Figure 5. Fractions of sea ice melt, meteoric, and saline end-members determined by salinityoxygen isotope mass balance for samples collected in White areas indicate locations at which oxygen isotope samples were not collected. Figure 6. Fractions of sea ice melt, meteoric, and saline end-members determined by salinityoxygen isotope mass balance for samples collected in Figure 7. Fractions of sea ice melt, meteoric, and saline end-members determined by salinityoxygen isotope mass balance for samples collected at station AG occupied in the Amundsen Gulf in Figure 8. Fractions of runoff from Eurasian and North American rivers determined from dissolved Ba and salinity-oxygen isotope mass balance for samples collected in White areas indicate locations at which samples for oxygen isotopes and/or dissolved Ba were not collected. Figure 9. Fractions of runoff from Eurasian and North American rivers determined from dissolved Ba and salinity-oxygen isotope mass balance for samples collected in Figure 10. Fractions of runoff from Eurasian and North American rivers determined from dissolved Ba and salinity-oxygen isotope mass balance at station AG occupied in the Amundsen Gulf in 2004.
37 Table 1: Salinity and oxygen isotope ratio of source waters to the upper Canada Basin. Source Salinity (PSS) δ 18 O ( ) Sea ice melt 4 ± 1 a -2 ± 1.0 b Meteoric water 0-20 ± 2 c Pacific water 32.5 ± 0.2 d -0.8 ± 0.1 e Atlantic water ± 0.03 f 0.24 ± 0.05 f a Ekwurzel et al., b Eicken et al., 2002; Pfirman et al., c Cooper et al., d Woodgate et al., e Yamamoto-Kawai, et al., f Yamamoto-Kawai, et al., 2005.
38 Table 2: Dissolved barium concentrations in runoff from arctic rivers. River Discharge (km 3 yr -1 ) River water dissolved Ba (nmol Ba l -1 ) Effective river end-member dissolved Ba (nmol Ba l -1 ) e Eurasia Lena 566 a 74 e 104 f Ob 373 a e 141 f Yenisey 656 a e 76 f Kolyma 114 a 63 f -- North America Mackenzie 322 b e 371 f 520 Yukon 214 c 369 f -- Colville 9.4 d 376 ± 24 g -- Kuparuk 1.4 d 171 ± 16 g -- Sagavinirktok 1.3 d 234 ± 14 g -- a Data from Russian Federal Service of Hydrometeorology and Environment Monitoring (reported in Cooper et al., 2008). b Data from Water Survey of Canada (reported in Cooper et al., 2008). c Data from U.S. Geological Survey (reported in Cooper et al., 2008). d Surface Water data for Alaska: USGS Surface-Water Annual Statistics, National Water Information System, U.S. Geological Survey, 2008 ( e Guay and Falkner, f Flow-weighted averages [Cooper et al., 2008]. g Rember and Trefry, 2004.
39
40
41
42
43
44
45
46
47
GEOCHEMICAL TRACERS OF ARCTIC OCEAN CIRCULATION
 GEOCHEMICAL TRACERS OF ARCTIC OCEAN CIRCULATION Earth Sciences Division Lawrence Berkeley National Laboratory Fresh Water Cycle Maintains Stratification of Upper Arctic Ocean Stably stratified surface
Halocline structure in the Canada Basin of the Arctic Ocean
 GEOPHYSICAL RESEARCH LETTERS, VOL. 32, L03605, doi:10.1029/2004gl021358, 2005 Halocline structure in the Canada Basin of the Arctic Ocean Koji Shimada, Motoyo Itoh, and Shigeto Nishino Institute of Observational
How to form halocline water?
 How to form halocline water? Atlantic water - cannot form Halocline water simply by mixing (Aagaard, 1981) Surface Water Adapted from Steele and Boyd, 1998 ADVECTIVE HC Temp Fresh Salty Aagaard et al,
Typical Arctic profiles. How to form halocline water? 2012 Changing Arctic Ocean 506E/497E - Lecture 7 - Woodgate
 Schematic Surface and Atlantic Circulation Typical Arctic profiles MIXED LAYER Usually thin (no wind stirring) PACIFIC WATER High nutrients Shallow (
Freshwater and brine behaviors in the Arctic Ocean deduced from historical data of D 18 O and alkalinity ( A.D.)
") JOURNAL OF GEOPHYSICAL RESEARCH, VOL. 110,, doi:10.1029/2004jc002793, 2005 Freshwater and brine behaviors in the Arctic Ocean deduced from historical data of D 18 O and alkalinity (1929 2002 A.D.) Michiyo
JOURNAL OF GEOPHYSICAL RESEARCH, VOL. 110,, doi:10.1029/2004jc002793, 2005 Freshwater and brine behaviors in the Arctic Ocean deduced from historical data of D 18 O and alkalinity (1929 2002 A.D.) Michiyo
Barium as a tracer of Arctic halocline and river waters
 Pergamon PII: SO967-0645(97)0006ti Deep-Sea Research II. Vol. 44, No. 8, pp. 1543%1569,1997 0 1998 Elsevier Science Ltd All rights reserved. Printed in Great Britain 0967-0645/98 $19.00+0.00 Barium as
The Arctic Crossroads
 The Arctic Crossroads The Influence of the Mendeleev Ridge and the Chukchi Borderland on the Large-scale Circulation of the Arctic Ocean Rebecca Woodgate and Knut Aagaard, University of Washington Jim
Atlantic sources of the Arctic Ocean surface and halocline waters
 Polar Research ISSN: (Print) 1751-8369 (Online) Journal homepage: https://www.tandfonline.com/loi/zpor20 Atlantic sources of the Arctic Ocean surface and halocline waters Bert Rudels, E. Peter Jones, Ursula
f r o m a H i g h - R e s o l u t i o n I c e - O c e a n M o d e l
 Circulation and Variability in the Western Arctic Ocean f r o m a H i g h - R e s o l u t i o n I c e - O c e a n M o d e l Jeffrey S. Dixon 1, Wieslaw Maslowski 1, Jaclyn Clement 1, Waldemar Walczowski
The Canada Basin, : Upstream events and far-field effects of the Barents Sea
 JOURNAL OF GEOPHYSICAL RESEARCH, VOL. 107, NO. C7, 3082, 10.1029/2001JC000904, 2002 The Canada Basin, 1989 1995: Upstream events and far-field effects of the Barents Sea Fiona McLaughlin, Eddy Carmack,
Comparison of the Siberian shelf seas in the Arctic Ocean
 Comparison of the Siberian shelf seas in the Arctic Ocean by Audun Scheide & Marit Muren SIO 210 - Introduction to Physical Oceanography November 2014 Acknowledgements Special thanks to James Swift for
Arctic oceanography; the path of North Atlantic Deep Water
 Chapter 7 Arctic oceanography; the path of North Atlantic Deep Water The importance of the Southern Ocean for the formation of the water masses of the world ocean poses the question whether similar conditions
Keywords: Arctic Ocean halocline; Surface circulation; Transpolar Drift; Freshwater; Polynyas; Oxygen isotopes
 Title page Title: Origin of freshwater and polynya water in the Arctic Ocean halocline in summer 2007 Authors: Dorothea Bauch 1, Michiel Rutgers van der Loeff 2, Nils Andersen 3, Sinhue Torres- Valdes
The Arctic Ocean Climate a balance between local radiation, advected heat and freshwater
 The Arctic Ocean Climate a balance between local radiation, advected heat and freshwater Bert Rudels Finnish Meteorological Institute, Helsinki, Finland French Arctic Initiative, Collège de France, Paris,
Freshwater budget of the Canada Basin, Arctic Ocean, from salinity, d 18 O, and nutrients
 JOURNAL OF GEOPHYSICAL RESEARCH, VOL. 113,, doi:10.1029/2006jc003858, 2008 Freshwater budget of the Canada Basin, Arctic Ocean, from salinity, d 18 O, and nutrients M. Yamamoto-Kawai, 1 F. A. McLaughlin,
REVISING THE BERING STRAIT FRESHWATER FLUX INTO THE ARCTIC OCEAN
 REVISING THE BERING STRAIT FRESHWATER FLUX INTO THE ARCTIC OCEAN Rebecca A. Woodgate and Knut Aagaard, Polar Science Center, Applied Physics Laboratory, University of Washington, Corresponding Author:
Origins of the SHEBA freshwater anomaly in the Mackenzie River delta
 GEOPHYSICAL RESEARCH LETTERS, VOL. 33, L09601, doi:10.1029/2005gl024813, 2006 Origins of the SHEBA freshwater anomaly in the Mackenzie River delta M. Steele, 1 A. Porcelli, 1 and J. Zhang 1 Received 29
Pacific ventilation of the Arctic Ocean s lower halocline by upwelling and diapycnal mixing over the continental margin
 GEOPHYSICAL RESEARCH LETTERS, VOL. 32, L18609, doi:10.1029/2005gl023999, 2005 Pacific ventilation of the Arctic Ocean s lower halocline by upwelling and diapycnal mixing over the continental margin Rebecca
General AW Circulation Schemes
 General AW Circulation Schemes Aagaard, 1989 - topographically steered boundary current along slopes and ridges - interior flow weak, dominated by eddies (based on current meters) Rudels et al, 1994 -
Distributions of dissolved inorganic carbon and total alkalinity in the Western Arctic Ocean
 Article Advances in Polar Science doi:10.3724/sp.j.1085.2011.00246 December 2011 Vol.22 No.4 246 252 Distributions of dissolved inorganic carbon and total alkalinity in the Western Arctic Ocean SUN Heng
Relaxation of central Arctic Ocean hydrography to pre-1990s climatology
 Click Here for Full Article GEOPHYSICAL RESEARCH LETTERS, VOL. 33,, doi:10.1029/2006gl026826, 2006 Relaxation of central Arctic Ocean hydrography to pre-1990s climatology J. Morison, 1 M. Steele, 1 T.
A Synthesis of Results from the Norwegian ESSAS (N-ESSAS) Project
 Project") A Synthesis of Results from the Norwegian ESSAS (N-ESSAS) Project Ken Drinkwater Institute of Marine Research Bergen, Norway ken.drinkwater@imr.no ESSAS has several formally recognized national research
A Synthesis of Results from the Norwegian ESSAS (N-ESSAS) Project Ken Drinkwater Institute of Marine Research Bergen, Norway ken.drinkwater@imr.no ESSAS has several formally recognized national research
A Synthesis of Oceanic Time Series from the Chukchi and Beaufort Seas and the Arctic Ocean, with Application to Shelf-Basin Exchange
 A Synthesis of Oceanic Time Series from the Chukchi and Beaufort Seas and the Arctic Ocean, with Application to Shelf-Basin Exchange Thomas Weingartner Institute of Marine Science School of Fisheries and
On the Circulation of Atlantic Water in the Arctic Ocean
 2352 J O U R N A L O F P H Y S I C A L O C E A N O G R A P H Y VOLUME 43 On the Circulation of Atlantic Water in the Arctic Ocean MICHAEL A. SPALL Woods Hole Oceanographic Institution, Woods Hole, Massachusetts
On the world-wide circulation of the deep water from the North Atlantic Ocean
 Journal of Marine Research, 63, 187 201, 2005 On the world-wide circulation of the deep water from the North Atlantic Ocean by Joseph L. Reid 1 ABSTRACT Above the deeper waters of the North Atlantic that
The Bering Sea/Bering Strait Relationship. Bering Strait and the Chukchi Sea
 The Bering Sea/ Relationship ANSF= Aleutian North Slope Current BSC = Bering Slope Current Anadyr (colder, saltier, nutrient-rich) Bering Shelf Waters (in between!) Exit route! From Stabeno, Schumacher
Advancements and Limitations in Understanding and Predicting Arctic Climate Change
 Advancements and Limitations in Understanding and Predicting Arctic Climate Change Wieslaw Maslowski Naval Postgraduate School Collaborators: Jaclyn Clement Kinney, Rose Tseng, Timothy McGeehan - NPS Jaromir
Don't let your PBL scheme be rejected by brine: Parameterization of salt plumes under sea ice in climate models
 Don't let your PBL scheme be rejected by brine: Parameterization of salt plumes under sea ice in climate models Dimitris Menemenlis California Institute of Technology, Jet Propulsion Laboratory Frontiers
S12. The Arctic Ocean and Nordic Seas: Supplementary Materials
 C H A P T E R S12 The Arctic Ocean and Nordic Seas: Supplementary Materials FIGURE S12.1 Principal currents of the Nordic Seas. Shaded currents show upper ocean circulation; thin black arrows show deep
A tracer study of the Arctic Ocean s liquid freshwater export variability
 JOURNAL OF GEOPHYSICAL RESEARCH, VOL.???, XXXX, DOI:10.1029/, Alexandra Jahn 1, 2, L. Bruno Tremblay 1, 3, Robert Newton 3, Marika M. Holland 4, Lawrence A. Mysak 1, Igor A. Dmitrenko 5 A tracer study
What makes the Arctic hot?
 1/3 total USA UN Environ Prog What makes the Arctic hot? Local communities subsistence Arctic Shipping Routes? Decreasing Ice cover Sept 2007 -ice extent (Pink=1979-2000 mean min) Source: NSIDC Oil/Gas
Answer to reviewers The answers to the reviewers comments are indicated in italics
 Answer to reviewers The answers to the reviewers comments are indicated in italics Reviewer 1: General comments The manuscript by Bourgain et al. reports on several cruises from the Canada Basin from the
MONTHLY TEMPERATURE, SALINITY AND TRANSPORT VARIABILITY OF THE BERING STRAIT THROUGHFLOW
 MONTHLY TEMPERATURE, SALINITY AND TRANSPORT VARIABILITY OF THE BERING STRAIT THROUGHFLOW Rebecca A. Woodgate, Knut Aagaard, Polar Science Center, Applied Physics Laboratory, University of Washington, Seattle,
Homework 5: Background Ocean Water Properties & Stratification
 14 August 2008 MAR 110 HW5: Ocean Properties 1 Homework 5: Background Ocean Water Properties & Stratification The ocean is a heterogeneous mixture of water types - each with its own temperature, salinity,
Ocean Mixing and Climate Change
 Ocean Mixing and Climate Change Factors inducing seawater mixing Different densities Wind stirring Internal waves breaking Tidal Bottom topography Biogenic Mixing (??) In general, any motion favoring turbulent
Global Atmospheric Circulation
 Global Atmospheric Circulation Polar Climatology & Climate Variability Lecture 11 Nov. 22, 2010 Global Atmospheric Circulation Global Atmospheric Circulation Global Atmospheric Circulation The Polar Vortex
Arctic Ocean simulation in the CCSM4
 Arctic Ocean simulation in the CCSM4 Alexandra Jahn National Center for Atmospheric Sciences, Boulder, USA Collaborators: K. Sterling, M.M. Holland, J. Kay, J.A. Maslanik, C.M. Bitz, D.A. Bailey, J. Stroeve,
Modeling the Formation and Offshore Transport of Dense Water from High-Latitude Coastal Polynyas
 Modeling the Formation and Offshore Transport of Dense Water from High-Latitude Coastal Polynyas David C. Chapman Woods Hole Oceanographic Institution Woods Hole, MA 02543 phone: (508) 289-2792 fax: (508)
OCB Summer Workshop WHOI, July 16-19,
 Transformation and fluxes of carbon in a changing Arctic Ocean and it s impact on ocean acidification, the Atlantic view Leif G. Anderson Department t of Chemistry and Molecular l Biology University of
Freshwater distribution in the Arctic Ocean: Simulation with a highresolution model and model-data comparison
 JOURNAL OF GEOPHYSICAL RESEARCH, VOL. 113,, doi:10.1029/2007jc004111, 2008 Freshwater distribution in the Arctic Ocean: Simulation with a highresolution model and model-data comparison Robert Newton, 1
1. Introduction 2. Ocean circulation a) Temperature, salinity, density b) Thermohaline circulation c) Wind-driven surface currents d) Circulation and
 Temperature, salinity, density b) Thermohaline circulation c) Wind-driven surface currents d) Circulation and") 1. Introduction 2. Ocean circulation a) Temperature, salinity, density b) Thermohaline circulation c) Wind-driven surface currents d) Circulation and climate change e) Oceanic water residence times 3.
1. Introduction 2. Ocean circulation a) Temperature, salinity, density b) Thermohaline circulation c) Wind-driven surface currents d) Circulation and climate change e) Oceanic water residence times 3.
Physical Oceanography of the Northeastern Chukchi Sea: A Preliminary Synthesis
 Physical Oceanography of the Northeastern Chukchi Sea: A Preliminary Synthesis I. Hanna Shoal Meltback Variability (causes?) II. Hydrography: Interannual Variability III. Aspects of Hanna Shoal Hydrographic
The distribution of neodymium isotopes in Arctic Ocean basins
 Available online at www.sciencedirect.com Geochimica et Cosmochimica Acta 73 (2009) 2645 2659 www.elsevier.com/locate/gca The distribution of neodymium isotopes in Arctic Ocean basins Don Porcelli a, *,
The North Atlantic Oscillation: Climatic Significance and Environmental Impact
 1 The North Atlantic Oscillation: Climatic Significance and Environmental Impact James W. Hurrell National Center for Atmospheric Research Climate and Global Dynamics Division, Climate Analysis Section
North Pacific Climate Overview N. Bond (UW/JISAO), J. Overland (NOAA/PMEL) Contact: Last updated: August 2009
, J. Overland (NOAA/PMEL) Contact: Last updated: August 2009") North Pacific Climate Overview N. Bond (UW/JISAO), J. Overland (NOAA/PMEL) Contact: Nicholas.Bond@noaa.gov Last updated: August 2009 Summary. The North Pacific atmosphere-ocean system from fall 2008 through
North Pacific Climate Overview N. Bond (UW/JISAO), J. Overland (NOAA/PMEL) Contact: Nicholas.Bond@noaa.gov Last updated: August 2009 Summary. The North Pacific atmosphere-ocean system from fall 2008 through
Arctic Sea Ice and Freshwater Changes Driven by the Atmospheric Leading Mode in a Coupled Sea Ice Ocean Model
 2159 Arctic Sea Ice and Freshwater Changes Driven by the Atmospheric Leading Mode in a Coupled Sea Ice Ocean Model XIANGDONG ZHANG Frontier Research System for Global Change, International Arctic Research
Upper Ocean Circulation
 Upper Ocean Circulation C. Chen General Physical Oceanography MAR 555 School for Marine Sciences and Technology Umass-Dartmouth 1 MAR555 Lecture 4: The Upper Oceanic Circulation The Oceanic Circulation
On the Role of AdvecJon on the InteracJon between ArcJc and SubarcJc Seas: Comparing the Atlantic and Pacific Sectors
 Wakefield Symposium Anchorage, Alaska 25-29 March 2013 On the Role of AdvecJon on the InteracJon between ArcJc and SubarcJc Seas: Comparing the Atlantic and Pacific Sectors Ken Drinkwater IMR, Bergen AdvecJon
Freshwater composition of the waters off southeast Greenland and their link to the Arctic Ocean
 Click Here for Full Article JOURNAL OF GEOPHYSICAL RESEARCH, VOL. 114,, doi:10.1029/2008jc004808, 2009 Freshwater composition of the waters off southeast Greenland and their link to the Arctic Ocean David
Getting around in the Arctic
 Getting around in the Arctic what we do (and don t) know about boundary currents Arctic Bathymetry 605ft 184m 70N ~1000ft ~ 330m Rebecca Woodgate University of Washington 150ft 50m BBC Photo by Sullivan
Freshwater composition of the waters off southeast Greenland and their link to the Arctic Ocean
 1 2 3 4 5 6 7 8 9 10 11 12 13 14 15 16 17 18 19 20 21 22 23 24 25 26 27 28 29 30 31 32 33 34 35 36 37 38 39 40 41 42 43 Freshwater composition of the waters off southeast Greenland and their link to the
Distribution of Convective Lower Halocline Water. In the Eastern Arctic Ocean
 Distribution of Convective Lower Halocline Water In the Eastern Arctic Ocean Takashi Kikuchi, Kiyoshi Hatakeyama, Japan Marine Science and Technology Center 2-15, Natsushima-cho, Yokosuka, 237-0061, JAPAN
APPENDIX B PHYSICAL BASELINE STUDY: NORTHEAST BAFFIN BAY 1
 APPENDIX B PHYSICAL BASELINE STUDY: NORTHEAST BAFFIN BAY 1 1 By David B. Fissel, Mar Martínez de Saavedra Álvarez, and Randy C. Kerr, ASL Environmental Sciences Inc. (Feb. 2012) West Greenland Seismic
Coastal Oceanography. Coastal Oceanography. Coastal Waters
 Coastal Oceanography Coastal Oceanography 95% of ocean life is in coastal waters (320 km from shore) Estuaries and wetlands are among most productive ecosystems on Earth Major shipping routes, oil and
Observations of water masses and circulation with focus on the Eurasian Basin of the Arctic Ocean from the 1990s to the late 2000s
 https://helda.helsinki.fi Observations of water masses and circulation with focus on the Eurasian Basin of the Arctic Ocean from the 1990s to the late 2000s Rudels, B. 2013 Rudels, B, Schauer, U, Bjork,
ATOC 5051 INTRODUCTION TO PHYSICAL OCEANOGRAPHY. Lecture 2
 ATOC 5051 INTRODUCTION TO PHYSICAL OCEANOGRAPHY Lecture 2 Ocean basins and relation to climate Learning objectives: (1)What are the similarities and differences among different ocean basins? (2) How does
Circulation and water mass transformation in a model of the Chukchi Sea
 JOURNAL OF GEOPHYSICAL RESEARCH, VOL. 112,, doi:10.1029/2005jc003364, 2007 Circulation and water mass transformation in a model of the Chukchi Sea Michael A. Spall 1 Received 24 October 2005; revised 11
Ocean Dynamics. The Great Wave off Kanagawa Hokusai
 Ocean Dynamics The Great Wave off Kanagawa Hokusai LO: integrate relevant oceanographic processes with factors influencing survival and growth of fish larvae Physics Determining Ocean Dynamics 1. Conservation
SIO 210 Final examination Answer Key for all questions except Daisyworld. Wednesday, December 10, PM Name:
 SIO 210 Final examination Answer Key for all questions except Daisyworld. Wednesday, December 10, 2008 3-6 PM Name: This is a closed book exam. You may use a calculator. There are two parts: Talley (weighted
Climate/Ocean dynamics
 Interannual variations of the East-Kamchatka and East-Sakhalin Currents volume transports and their impact on the temperature and chemical parameters in the Okhotsk Sea Andrey G. Andreev V.I. Il ichev
Where is all the water?
 Where is all the water? The distribution of water at the Earth's surface % of total Oceans 97.25 Ice caps and glaciers 2.05 Groundwater 0.68 Lakes 0.01 Soils 0.005 Atmosphere (as vapour) 0.001 Rivers 0.0001
Arctic decadal and interdecadal variability
 Arctic decadal and interdecadal variability Igor V. Polyakov International Arctic Research Center, University of Alaska Fairbanks Mark A. Johnson Institute of Marine Science, University of Alaska Fairbanks
North Pacific Climate Overview N. Bond (UW/JISAO), J. Overland (NOAA/PMEL) Contact: Last updated: September 2008
, J. Overland (NOAA/PMEL) Contact: Last updated: September 2008") North Pacific Climate Overview N. Bond (UW/JISAO), J. Overland (NOAA/PMEL) Contact: Nicholas.Bond@noaa.gov Last updated: September 2008 Summary. The North Pacific atmosphere-ocean system from fall 2007
North Pacific Climate Overview N. Bond (UW/JISAO), J. Overland (NOAA/PMEL) Contact: Nicholas.Bond@noaa.gov Last updated: September 2008 Summary. The North Pacific atmosphere-ocean system from fall 2007
The western Arctic boundary current at 152ºW: Structure, variability, and transport
 The western Arctic boundary current at 152ºW: Structure, variability, and transport Anna Nikolopoulos a,*, Robert S. Pickart a, Paula S. Fratantoni a, Koji Shimada b, Daniel J. Torres a, E. Peter Jones
Tracing Pacific water in the North Atlantic Ocean
 JOURNAL OF GEOPHYSICAL RESEARCH, VOL. 108, NO. C4, 3116, doi:10.1029/2001jc001141, 2003 Tracing Pacific water in the North Atlantic Ocean E. P. Jones, 1 J. H. Swift, 2 L. G. Anderson, 3 M. Lipizer, 4 G.
Increase in acidifying water in the western Arctic Ocean
 In the format provided by the authors and unedited. SUPPLEMENTARY INFORMATION DOI: 1.138/NCLIMATE3228 Increase in acidifying water in the western Arctic Ocean Di Qi 1,2, Liqi Chen 1 *, Baoshan Chen 3,4,
New perspectives of climate change impacts on marine anthropogenic radioactivity in Arctic regions
 New perspectives of climate change impacts on marine anthropogenic radioactivity in Arctic regions M. Karcher 1,3, I. Harms 2, R. Gerdes 3, W.J.F. Standring 4, M. Dowdall 4, P. Strand 4 1 O.A.Sys Ocean
Seasonal variability of water mass distribution in the southeastern Beaufort Sea determined by total alkalinity and d 18 O
 JOURNAL OF GEOPHYSICAL RESEARCH, VOL. 117,, doi:10.1029/2011jc007299, 2012 Seasonal variability of water mass distribution in the southeastern Beaufort Sea determined by total alkalinity and d 18 O Bruno
AN ABSTRACT OF THE DISSERTATION OF
 AN ABSTRACT OF THE DISSERTATION OF Matthew Buckley Alkire for the degree of Doctor of Philosophy in Oceanography presented on March 19, 2010 Title: Differentiating Freshwater Contributions and their Variability
Retreat of the cold halocline layer in the Arctic Ocean
 JOURNAL OF GEOPHYSICAL RESEARCH, VOL. 103, NO. C5, PAGES 10,419-10,435, MAY 15, 1998 Retreat of the cold halocline layer in the Arctic Ocean Michael Steele Polar Science Center, Applied Physics Laboratory,
Deep Ocean Circulation & implications for Earth s climate
 Deep Ocean Circulation & implications for Earth s climate I. Ocean Layers and circulation types 1) Ocean Layers Ocean is strongly Stratified Consists of distinct LAYERS controlled by density takes huge
Canadian Ice Service
 Canadian Ice Service Key Points and Details concerning the 2009 Arctic Minimum Summer Sea Ice Extent October 1 st, 2009 http://ice-glaces.ec.gc.ca 1 Key Points of Interest Arctic-wide The Arctic-wide minimum
River runoff, sea ice meltwater, and Pacific water distribution
 JOURNAL OF GEOPHYSICAL RESEARCH, VOL. 106, NO. C5, PAGES 9075-9092, MAY 15, 2001 River runoff, sea ice meltwater, and Pacific water distribution and mean residence times in the Arctic Ocean Brenda Ekwurzel,
Changes in the properties and distribution of the intermediate and deep waters in the Fram Strait
 Changes in the properties and distribution of the intermediate and deep waters in the Fram Strait Helene R. Langehaug 1,2 and Eva Falck 3 1 Nansen Environmental and Remote Sensing Center, Bergen, Norway.
On Modeling the Oceanic Heat Fluxes from the North Pacific / Atlantic into the Arctic Ocean
 On Modeling the Oceanic Heat Fluxes from the North Pacific / Atlantic into the Arctic Ocean Wieslaw Maslowski Naval Postgraduate School Collaborators: Jaclyn Clement Kinney Terry McNamara, John Whelan
isopycnal outcrop w < 0 (downwelling), v < 0 L.I. V. P.
, v < 0 L.I. V. P.") Ocean 423 Vertical circulation 1 When we are thinking about how the density, temperature and salinity structure is set in the ocean, there are different processes at work depending on where in the water
Ocean 423 Vertical circulation 1 When we are thinking about how the density, temperature and salinity structure is set in the ocean, there are different processes at work depending on where in the water
Continental Shelf Research
 Continental Shelf Research 31 (211) 86 816 Contents lists available at ScienceDirect Continental Shelf Research journal homepage: www.elsevier.com/locate/csr Research papers Export of Pacific carbon through
Directed Reading. Section: Ocean Currents. a(n). FACTORS THAT AFFECT SURFACE CURRENTS
. FACTORS THAT AFFECT SURFACE CURRENTS") Skills Worksheet Directed Reading Section: Ocean Currents 1 A horizontal movement of water in a well-defined pattern is called a(n) 2 What are two ways that oceanographers identify ocean currents? 3 What
Skills Worksheet Directed Reading Section: Ocean Currents 1 A horizontal movement of water in a well-defined pattern is called a(n) 2 What are two ways that oceanographers identify ocean currents? 3 What
Surface Circulation Ocean current Surface Currents:
 All Write Round Robin G1. What makes up the ocean water? G2. What is the source of the salt found in ocean water? G3. How does the water temperature affect the density of ocean water? G4. How does the
Land Bridge for migration of mammals and people? Arctic Change Woodgate Paleo role of Bering Strait
 Paleo role of Bering Strait Stabilizer for World Climate? (DeBoer & Nof, 2004) - if Bering Strait is open, excess freshwater in the Atlantic (from, for example, ice sheet collapse) can vent through the
Mesoscale Distribution of Springtime Waters and Nutrients near the Continental Shelf Break, Beaufort Sea, Alaska
 The Open Oceanography Journal, 2010, 4, 115-136 115 Open Access Mesoscale Distribution of Springtime Waters and Nutrients near the Continental Shelf Break, Beaufort Sea, Alaska John P. Christensen *,1
A. S. Dyke Terrain Sciences Division, Geological Survey of Canada, Ottawa, Ontario, Canada. Short title: ARCTIC CLIMATE VARIABILITY DURING HOLOCENE
 1 Evidence from driftwood records for century-to-millennial scale variations of the Arctic and northern North Atlantic atmospheric circulation during the Holocene L.-B. Tremblay and L. A. Mysak Department
Barrow Canyon volume, heat, and freshwater fluxes revealed by long-term mooring observations between 2000 and 2008
 JOURNAL OF GEOPHYSICAL RESEARCH: OCEANS, VOL. 118, 4363 4379, doi:10.1002/jgrc.20290, 2013 Barrow Canyon volume, heat, and freshwater fluxes revealed by long-term mooring observations between 2000 and
The fieldwork during the Polarstern cruise ANT XVI/2 as a contribution to the study of bottom water formation and sea ice transport in the Weddell Sea
 The fieldwork during the Polarstern cruise ANT XVI/2 as a contribution to the study of bottom water formation and sea ice transport in the Weddell Sea Fahrbach, E 1, S. Harms 2, H. Hellmer 1, A. Jenkins
Ice and Ocean Mooring Data Statistics from Barrow Strait, the Central Section of the NW Passage in the Canadian Arctic Archipelago
 Ice and Ocean Mooring Data Statistics from Barrow Strait, the Central Section of the NW Passage in the Canadian Arctic Archipelago Simon Prinsenberg and Roger Pettipas Bedford Institute of Oceanography,
Storm-driven mixing and potential impact on the Arctic Ocean
 JOURNAL OF GEOPHYSICAL RESEARCH, VOL. 109,, doi:10.1029/2001jc001248, 2004 Storm-driven mixing and potential impact on the Arctic Ocean Jiayan Yang, 1 Josefino Comiso, 2 David Walsh, 3 Richard Krishfield,
Modeling the Columbia River Plume on the Oregon Shelf during Summer Upwelling. 2 Model
 Modeling the Columbia River Plume on the Oregon Shelf during Summer Upwelling D. P. Fulton August 15, 2007 Abstract The effects of the Columbia River plume on circulation on the Oregon shelf are analyzed
Effect of the large-scale atmospheric circulation on the variability of the Arctic Ocean freshwater export
 Climate Dynamics - Preprint The original publication is available at www.springerlink.com doi:1.17/s382-9-558-z Effect of the large-scale atmospheric circulation on the variability of the Arctic Ocean
The Variable Outflow from the Chukchi Shelf to the Arctic Ocean
 The Variable Outflow from the Chukchi Shelf to the Arctic Ocean Knut Aagaard Applied Physics Laboratory 1013 N.E. 40th Seattle, WA 98105-6698 phone: (206) 543-8942 fax: (206) 616-3142 e-mail: aagaard@apl.washington.edu
Formation of Cold Airmasses Cold Air Outbreak
 Chapter 14: Cold Waves Formation of Cold Airmasses Cold Air Outbreak 1 Cold Wave A cold wave is an influx of unusually cold air into middle or lower latitudes. Cold waves affect much larger areas than
The Planetary Circulation System
 12 The Planetary Circulation System Learning Goals After studying this chapter, students should be able to: 1. describe and account for the global patterns of pressure, wind patterns and ocean currents
Freshwater content variability in the Arctic Ocean
 JOURNAL OF GEOPHYSICAL RESEARCH, VOL. 109,, doi:10.1029/2003jc001940, 2004 Freshwater content variability in the Arctic Ocean S. Häkkinen NASA Goddard Space Flight Center, Greenbelt, Maryland, USA A. Proshutinsky
Catastrophic reduction of seaice in the Arctic Ocean - its impact on the marine ecosystems in the polar region-
 1/12 Catastrophic reduction of seaice in the Arctic Ocean - its impact on the marine ecosystems in the polar region- KAKENHI No.22221003 Naomi Harada (JAMSTEC) J. Onodera, E. Watanabe, K. Matsuno, K. Kimoto,
Lecture 1. Amplitude of the seasonal cycle in temperature
 Lecture 6 Lecture 1 Ocean circulation Forcing and large-scale features Amplitude of the seasonal cycle in temperature 1 Atmosphere and ocean heat transport Trenberth and Caron (2001) False-colour satellite
Seawater Chemistry and Chemical Oceanography. The Universal Solvent. Sphere of Hydration
 Seawater Chemistry and Chemical Oceanography The Universal Solvent Polarity of molecule makes water very effective at hydrating even weakly charged ions Sphere of Hydration Polarity of water molecules
Deep-Water Flow over the Lomonosov Ridge in the Arctic Ocean
 AUGUST 2005 N O T E S A N D C O R R E S P O N D E N C E 1489 Deep-Water Flow over the Lomonosov Ridge in the Arctic Ocean M.-L. TIMMERMANS, P. WINSOR, AND J. A. WHITEHEAD Woods Hole Oceanographic Institution,
Joint effects of boundary currents and thermohaline intrusions on the warming of Atlantic water in the Canada Basin,
 JOURNAL OF GEOPHYSICAL RESEARCH, VOL. 114,, doi:10.1029/2008jc005001, 2009 Joint effects of boundary currents and thermohaline intrusions on the warming of Atlantic water in the Canada Basin, 1993 2007
Spectral Albedos. a: dry snow. b: wet new snow. c: melting old snow. a: cold MY ice. b: melting MY ice. d: frozen pond. c: melting FY white ice
 Spectral Albedos a: dry snow b: wet new snow a: cold MY ice c: melting old snow b: melting MY ice d: frozen pond c: melting FY white ice d: melting FY blue ice e: early MY pond e: ageing ponds Extinction
SIO 210 Final Exam December 10, :30 2:30 NTV 330 No books, no notes. Calculators can be used.
 SIO 210 Final Exam December 10, 2003 11:30 2:30 NTV 330 No books, no notes. Calculators can be used. There are three sections to the exam: multiple choice, short answer, and long problems. Points are given
Anticipated changes in the Nordic Seas marine climate: Scenarios for 2020, 2050, and 2080.
 Anticipated changes in the Nordic Seas marine climate: Scenarios for 2020, 2050, and 2080. By Tore Furevik 1, Helge Drange 2, and Asgeir Sorteberg 1,3 1 Geophysical Institute, University of Bergen 2 Nansen