Climate Sensitivity, Feedbacks, Tipping Points, Irreversible Effects & The Point of No Return
|
|
|
- Madeline Sparks
- 5 years ago
- Views:
Transcription
1 Climate Sensitivity, Feedbacks, Tipping Points, Irreversible Effects & The Point of No Return James Hansen 4 November 2013 Geneva, Switzerland
2 Climate Sensitivity, Feedbacks, Tipping Points, Irreversible Effects & The Point of No Return Climate sensitivity, sea level and atmospheric carbon dioxide, Hansen, Sato, Russell, Kharecha, Phil. Trans. Roy. Soc. A 371 Paleoclimate data 1. Equilibrium response: climate system very sensitive 2. Response time uncertain; ocean response important
3 Global Warming Status 1. Knowledge Gap Between - What is Understood (scientists) - What is Known (public) 2. Planetary Emergency - Climate Inertia Warming in Pipeline - Tipping Points Could Lose Control 3. Limit on Fossil Fuel Emissions - Already Approaching the Limit - Governments Feign Ignorance of Crisis
4 Climate Impacts 1. Ice Sheet Disintegration & Sea Level - Ocean Warming Ice Shelves Melt Ice Streams Surge Disintegration 2. Species Extermination - Shifting Climate Zones, Multiple Stresses, Species Interdependencies 3. Climate Extremes - Heat Waves, Drought, Fires - Heavier Rain, Floods, Stronger Storms
5 Global deep ocean δ 18 O from Zachos et al. and estimated deep ocean temperature.
 and independent data (c).")
6 Sea level inferred from δ 18 O, compared with ice sheet models (b) and independent data (c).
7 Surface temperature estimate for Cenozoic era; red curve has 500 kyr resolution.
8 (a) CO 2 and CH 4 from ice cores; (b) sea level from δ 18 O; (c) resulting climate forcings.
9 Calculated surface temperature for climate sensitivity 4 C for 2 CO 2. Observed temperature (red curve) scaled to 4.5 C cooling at Last Glacial Maximum.
10 However, ice sheet area and CO 2 (partially) are slow feedbacks.
11 Paleoclimate Guidance Eemian sea level +5-9 meters - Eemian temperature +2 C* Pliocene sea level meters - Pliocene temperature +3-4 C* Ice sheet response time uncertain, but it is shorter than the lifetime of fossil fuel carbon and resulting global warming *relative to pre-industrial times
12 Accelerating rate of sea level rise during the past century.
13 Total Melt Area (10 6 km 2 ) Year Area on Greenland with snowmelt. Graph credit: Konrad Steffen, Univ. Colorado

14 Surface Melt on Greenland Melt descending into a moulin, a vertical shaft carrying water to ice sheet base. Source: Roger Braithwaite, University of Manchester (UK)

15 Jakobshavn Ice Stream in Greenland Discharge from major Greenland ice streams is accelerating markedly. Source: Prof. Konrad Steffen, Univ. of Colorado
16 Gravity Satellite Ice Sheet Mass Measurements Greenland Ice Sheet Antarctic Ice Sheet Source: Velicogna, I. Geophys. Res. Lett., 36, L19503, doi: /2009gl040222, 2009.
17
18 Threat of Mass Exterminations Multiple Human-Made Stresses Overharvesting, Land use changes, Nitrogen fertilization, Introducing exotic species, etc. in Combination with Rapid Shifting of Climate Zones

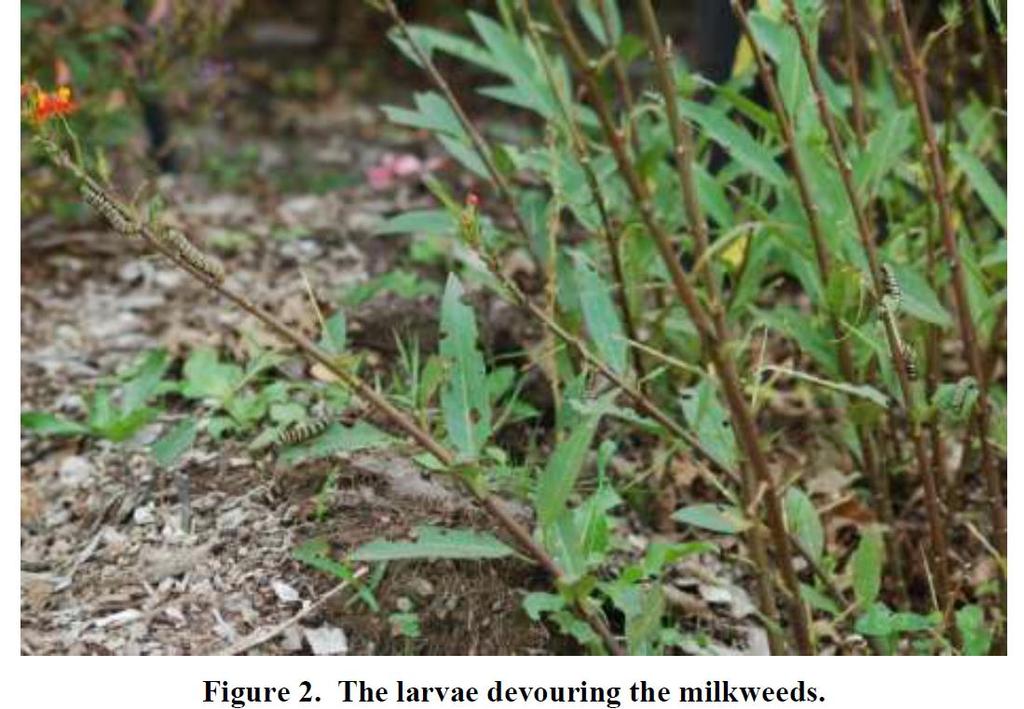
19 Figure 1. The broken-wing female Monarch on our butterfly bush.
20

21 Newly emergent Monarchs, each beside its popped chrysalis, waiting for its wings to dry.

22

23

24 June 2011: Record 7.6% of U.S. in Exceptional drought category, simultaneous with record flooding on Mississippi River.

25

26

27

28 Whooping cranes in flight in wildlife refuge near Rockport, Texas. (AP Photo/LM Otero)

29

30 Stresses on Coral Reefs Coral Reef off Fiji (Photo: Kevin Roland)
 annual and 5-year running means through 2012, and (b) 60-month and 132- month running means through March 2013.")
31 Global temperature fluctuates, but the world is getting warmer Figure 1. Global surface temperature anomalies relative to average for (a) annual and 5-year running means through 2012, and (b) 60-month and 132- month running means through March Green bars are 2-σ error estimates. (Hansen, J., Ruedy, R., Sato, M., and Lo, K., 2010: Global surface temperature change, Rev. Geophys. 48, RG4004.)
32 12-month running mean Annual calendar year mean

33 Earth s energy imbalance: more energy coming in than going out ARGO floats have allowed accurate measurement of ocean heat gain since Earth is gaining energy at a rate 0.6 W/m 2, which is 20 times greater than the rate of human energy use. That energy is equivalent to exploding 400,000 Hiroshima atomic bombs per day, 365 days per year.
34 Heat storage in upper 2000 meters of ocean during based on ARGO data. Knowledge of Earth s energy imbalance is improving rapidly as ARGO data lengthens. Data must be averaged over a decade because of El Nino/La Nina and solar variability. Energy imbalance is smoking gun for human-made increasing greenhouse effect. Data source: von Schuckmann et al. J. Geophys. Res. 114, C09007, 2009, doi: /2008jc


35 Solar energy reaching Earth; energy absorbed per m 2 of Earth s surface is ~240 W, so 0.1% solar variability is a climate forcing of almost 0.25 W/m 2. (Update of Fig. 17 of Hansen et al., Atmos. Chem. Phys., 11, , Data through 2 Feb is from Frohlich and Lean; more recent data from Univ. Colorado, SORCE experiment.)

36
37 Fossil Fuel Emissions/Targets 370 GtC = Emissions through GtC from deforestation but must bookkeep separately 500 GtC Target for Fossil Fuel Emissions & store 100 GtC in forests and soil via improved practices Result: energy balance at about 1 C above pre-industrial Stays close to Holocene range; slow feedbacks minimized 1000 GtC Target for Fossil Fuel Emissions Slow feedbacks (ice sheet melting, forest movement, GHG release) surely come into play warming > 2 C
38 Annual change of global atmospheric methane amount.
 = 1 billion tons of carbon or ~3.")
39 Fossil fuel emissions; purple are emissions through GtC (gigaton carbon) = 1 billion tons of carbon or ~3.7 GtCO 2 ; 1 ppm CO 2 ~2.12 GtC
Chapter 2. Changes in Sea Level Melting Cryosphere Atmospheric Changes Summary IPCC (2013)
") IPCC (2013) Ice is melting faster (sea ice, glaciers, ice sheets, snow) Sea level is rising More ocean heat content More intense rainfall More severe drought Fewer frosts More heat waves Spring is arriving
IPCC (2013) Ice is melting faster (sea ice, glaciers, ice sheets, snow) Sea level is rising More ocean heat content More intense rainfall More severe drought Fewer frosts More heat waves Spring is arriving
Activity 2.2: Recognizing Change (Observation vs. Inference)
") Activity 2.2: Recognizing Change (Observation vs. Inference) Teacher Notes: Evidence for Climate Change PowerPoint Slide 1 Slide 2 Introduction Image 1 (Namib Desert, Namibia) The sun is on the horizon
Activity 2.2: Recognizing Change (Observation vs. Inference) Teacher Notes: Evidence for Climate Change PowerPoint Slide 1 Slide 2 Introduction Image 1 (Namib Desert, Namibia) The sun is on the horizon
What is Climate? Climate Change Evidence & Causes. Is the Climate Changing? Is the Climate Changing? Is the Climate Changing? Is the Climate Changing?
 What is Climate? 1 Climate Change Evidence & Causes Refers to the average environmental conditions (i.e. temperature, precipitation, extreme events) in a given location over many years Climate is what
Future Climate Change
 Future Climate Change How do you know whether to trust a prediction about the future? All predictions are based on global circulation models (GCMs, AOGCMs) - model accuracy is verified by its ability to
Atmospheric CO2 and mass extinctions: implications for global warming
 17 March 2013 Atmospheric CO2 and mass extinctions: implications for global warming The Paleocene-Eocene thermal maxium http://www.uta.edu/faculty/awinguth/petm_research/petm_home.html Throughout the Phanerozoic
Today we will discuss global climate: how it has changed in the past, and how the current status and possible future look.
 Global Climate Change Today we will discuss global climate: how it has changed in the past, and how the current status and possible future look. If you live in an area such as the Mississippi delta (pictured)
2010 Tied as warmest year 1.34 o F (0.8 o C) total warming
 total warming") 2010 Tied as warmest year 1.34 o F (0.8 o C) total warming 2010, tied for warmest year Chip Fletcher, University of Hawaii at Manoa School of Ocean and Earth Science and Technology, Global Surface Temperature
2010 Tied as warmest year 1.34 o F (0.8 o C) total warming 2010, tied for warmest year Chip Fletcher, University of Hawaii at Manoa School of Ocean and Earth Science and Technology, Global Surface Temperature
Welcome to ATMS 111 Global Warming.
 Welcome to ATMS 111 Global Warming http://www.atmos.washington.edu/2010q1/111 Isotopic Evidence 16 O isotopes "light 18 O isotopes "heavy" Evaporation favors light Rain favors heavy Cloud above ice is
Climate change: How do we know?
 Climate change: How do we know? This graph, based on the comparison of atmospheric samples contained in ice cores and more recent direct measurements, provides evidence that atmospheric CO2 has increased
Current and future climate of the Cook Islands. Pacific-Australia Climate Change Science and Adaptation Planning Program
 Pacific-Australia Climate Change Science and Adaptation Planning Program Penrhyn Pukapuka Nassau Suwarrow Rakahanga Manihiki N o r t h e r n C o o k I s l a nds S o u t h e Palmerston r n C o o k I s l
Global climate change
 Global climate change What is climate change? This winter was really cold! Temp difference ( C): Jan 2004 vs. Jan 2002-2003 Make your own maps at: http://www.giss.nasa.gov/data/update/gistemp/maps/ 1 What
Global Warming and Changing Sea Level. Name: Part 1: Am I part of the problem?!
 Part 1: Am I part of the problem?! Name: The consumption of energy in the form of fossil fuel combustion is the largest single contributor to anthropogenic greenhouse gas emissions in the U.S. and the
Climate Change 2007: The Physical Science Basis
 Climate Change 2007: The Physical Science Basis Working Group I Contribution to the IPCC Fourth Assessment Report Presented by R.K. Pachauri, IPCC Chair and Bubu Jallow, WG 1 Vice Chair Nairobi, 6 February
Climate Changes due to Natural Processes
 Climate Changes due to Natural Processes 2.6.2a Summarize natural processes that can and have affected global climate (particularly El Niño/La Niña, volcanic eruptions, sunspots, shifts in Earth's orbit,
Atmosphere Weather and Climate
 Atmosphere Weather and Climate Weather and Climate Weather Atmospheric conditions at a particular time and place Climate Long-term average of weather conditions Often over decades or centuries Coastal
Extreme Weather and Climate Change: the big picture Alan K. Betts Atmospheric Research Pittsford, VT NESC, Saratoga, NY
 Extreme Weather and Climate Change: the big picture Alan K. Betts Atmospheric Research Pittsford, VT http://alanbetts.com NESC, Saratoga, NY March 10, 2018 Increases in Extreme Weather Last decade: lack
The science and impact of climate change.
 The science and impact of climate change. University of Puerto Rico-Mayaguez The National Science foundation sponsored: "Coastal Area Climate Change Education (CACCE) Partnership". Mayaguez, Puerto Rico
Activity 3 Arctic Heat Wave?
 Activity 3 Arctic Heat Wave? Forces of Change >> Arctic >> Activity 3 >> Page 1 ACTIVITY 3 ARCTIC HEAT WAVE? THE RATE OF CLIMATE CHANGE Are Ice Caps Melting Faster? From 1979 to 2002, seasonal melting
Ice Sheets and Sea Level -- Concerns at the Coast (Teachers Guide)
") Ice Sheets and Sea Level -- Concerns at the Coast (Teachers Guide) Roughly 153 million Americans (~53% of the US population) live in coastal counties. World wide some 3 billion people live within 200 km
Ice Sheets and Sea Level -- Concerns at the Coast (Teachers Guide) Roughly 153 million Americans (~53% of the US population) live in coastal counties. World wide some 3 billion people live within 200 km
Why I Am a Climate Realist. by Dr. Willem de Lange
 Why I Am a Climate Realist by Dr. Willem de Lange SPPI Commentary & Essay Series! May 27, 2009 Why I Am a Climate Realist by Dr. Willem de Lange May 23, 2009 In 1996 the United Nations Intergovernmental
Paleoclimate: What can the past tell us about the present and future? Global Warming Science February 14, 2012 David McGee
 Paleoclimate: What can the past tell us about the present and future? 12.340 Global Warming Science February 14, 2012 David McGee 1 Recent observed trends: Greenhouse gases Image courtesy of NOAA. 2 Recent
Day 1 of Global Warming. Copyright 2008 Pearson Education, Inc., publishing as Pearson Benjamin Cummings
 Day 1 of Global Warming Copyright 2008 Pearson Education, Inc., publishing as Pearson Benjamin Cummings The Atmosphere Atmosphere = the thin layer (1/100 th of Earth s diameter) of gases that surrounds
Extremes of Weather and the Latest Climate Change Science. Prof. Richard Allan, Department of Meteorology University of Reading
 Extremes of Weather and the Latest Climate Change Science Prof. Richard Allan, Department of Meteorology University of Reading Extreme weather climate change Recent extreme weather focusses debate on climate
Global Temperature. James Hansen, Makiko Sato, Reto Ruedy, Ken Lo
 Global Temperature James Hansen, Makiko Sato, Reto Ruedy, Ken Lo November 3, 2005 This note responds to recent inquiries about 2005 global temperature, the inquiries stimulated by a 13 October Washington
Monitoring Climate Change from Space
 Monitoring Climate Change from Space Richard Allan (email: r.p.allan@reading.ac.uk twitter: @rpallanuk) Department of Meteorology, University of Reading Why Monitor Earth s Climate from Space? Global Spectrum
Outline 24: The Holocene Record
 Outline 24: The Holocene Record Climate Change in the Late Cenozoic New York Harbor in an ice-free world (= Eocene sea level) Kenneth Miller, Rutgers University An Ice-Free World: eastern U.S. shoreline
Sea level change recent past, present, future
 Sea level change recent past, present, future Anny Cazenave LEGOS-CNES Toulouse, France CCI_Colocation meeting, ESA/ESRIN Global mean sea level rise during the 20 th century (red : tide gauges; blue :
Introduction to Global Warming
 Introduction to Global Warming Cryosphere (including sea level) and its modelling Ralf GREVE Institute of Low Temperature Science Hokkaido University Sapporo, 2010.09.14 http://wwwice.lowtem.hokudai.ac.jp/~greve/
Climate Change: Past and Future
 Climate Change: Past and Future Dr James Renwick School of Geography, Environment and Earth Sciences Victoria University of Wellington james.renwick@vuw.ac.nz Origins of climate research Late 1700s, moraines
CLIMATE READY BOSTON. Climate Projections Consensus ADAPTED FROM THE BOSTON RESEARCH ADVISORY GROUP REPORT MAY 2016
 CLIMATE READY BOSTON Sasaki Steering Committee Meeting, March 28 nd, 2016 Climate Projections Consensus ADAPTED FROM THE BOSTON RESEARCH ADVISORY GROUP REPORT MAY 2016 WHAT S IN STORE FOR BOSTON S CLIMATE?
Climate Variability Natural and Anthropogenic
 Climate Variability Natural and Anthropogenic Jim Renwick NIWA Climate Research j.renwick@niwa.co.nz Climate equilibrium and climate forcings Natural forcings Anthropogenic forcings Feedbacks Natural variability
Current Climate Science and Climate Scenarios for Florida
 Current Climate Science and Climate Scenarios for Florida Daniel Bader and Vivien Gornitz Water Utilities and Climate Change Workshop Palm Beach County Water Utilities/ Water Research Foundation June 10,
Ice Sheets and Glaciers
 Ice Sheets and Glaciers Technical University of Denmark Kees van der Veen Department of Geography University of Kansas Why are glaciers and ice sheets important? Large volume of fresh water stored in ice
8.5 GREENHOUSE EFFECT 8.6 GLOBAL WARMING HW/Study Packet
 8.5 GREENHOUSE EFFECT 8.6 GLOBAL WARMING HW/Study Packet Required: READ Tsokos, pp 434-450 Hamper pp 294-307 SL/HL Supplemental: none REMEMBER TO. Work through all of the example problems in the texts
Global Warming: The known, the unknown, and the unknowable
 Global Warming: The known, the unknown, and the unknowable Barry A. Klinger Jagadish Shukla George Mason University (GMU) Institute of Global Environment and Society (IGES) January, 2008, George Mason
THE GREENHOUSE EFFECT
 ASTRONOMY READER THE GREENHOUSE EFFECT 35.1 THE GREENHOUSE EFFECT Overview Planets are heated by light from the Sun. Planets cool off by giving off an invisible kind of light, longwave infrared light.
Standard 3: Students will understand the atmospheric processes that support life and cause weather and climate.
 Course: 9 th Grade Earth Systems Science Standard 3: Students will understand the atmospheric processes that support life and cause weather and climate. Instructions: In the space provided, write the letter
ATOC OUR CHANGING ENVIRONMENT Class 19 (Chp 6) Objectives of Today s Class: The Cryosphere [1] Components, time scales; [2] Seasonal snow
![ATOC OUR CHANGING ENVIRONMENT Class 19 (Chp 6) Objectives of Today s Class: The Cryosphere [1] Components, time scales; [2] Seasonal snow](/thumbs/95/126309683.jpg "ATOC OUR CHANGING ENVIRONMENT Class 19 (Chp 6) Objectives of Today s Class: The Cryosphere [1] Components, time scales; [2] Seasonal snow") ATOC 1060-002 OUR CHANGING ENVIRONMENT Class 19 (Chp 6) Objectives of Today s Class: The Cryosphere [1] Components, time scales; [2] Seasonal snow cover, permafrost, river and lake ice, ; [3]Glaciers and
ATOC 1060-002 OUR CHANGING ENVIRONMENT Class 19 (Chp 6) Objectives of Today s Class: The Cryosphere [1] Components, time scales; [2] Seasonal snow cover, permafrost, river and lake ice, ; [3]Glaciers and
Land Surface Sea Ice Land Ice. (from Our Changing Planet)
") Lecture 5: Land Surface and Cryosphere (Outline) Land Surface Sea Ice Land Ice (from Our Changing Planet) Earth s s Climate System Solar forcing Atmosphere Ocean Land Solid Earth Energy, Water, and Biochemistry
Lecture 5: Land Surface and Cryosphere (Outline) Land Surface Sea Ice Land Ice (from Our Changing Planet) Earth s s Climate System Solar forcing Atmosphere Ocean Land Solid Earth Energy, Water, and Biochemistry
Earth s Climate System. Surface Albedo. Climate Roles of Land Surface. Lecture 5: Land Surface and Cryosphere (Outline) Land Surface Sea Ice Land Ice
 Land Surface Sea Ice Land Ice") Lecture 5: Land Surface and Cryosphere (Outline) Earth s Climate System Solar forcing Land Surface Sea Ice Land Ice Atmosphere Ocean Land Solid Earth Energy, Water, and Biochemistry Cycles (from Our Changing
Lecture 5: Land Surface and Cryosphere (Outline) Earth s Climate System Solar forcing Land Surface Sea Ice Land Ice Atmosphere Ocean Land Solid Earth Energy, Water, and Biochemistry Cycles (from Our Changing
Multiple Choice Identify the choice that best completes the statement or answers the question.
 CH.15 practice TEST Multiple Choice Identify the choice that best completes the statement or answers the question. 1) The short-term state of the atmosphere is called a) climate. c) water cycle. b) weather.
Exploring The Polar Connection to Sea Level Rise NGSS Disciplinary Core Ideas Science & Engineering Crosscutting Concepts
 Exploring The Polar Connection to Sea Level Rise NGSS Disciplinary Core Ideas Science & Engineering Crosscutting Concepts Practices MS - ESS: Earth & Space Science 1. Ask questions 2. Developing and using
STATE OF THE CLIMATE IN 2017
 STATE OF THE CLIMATE IN 2017 Today s Presenters Jeff Rosenfeld Editor-In-Chief, Bulletin of the American Meteorological Society Boston, MA Deke Arndt Chief, Monitoring Branch, NOAA s National Centers for
Current and future climate of Vanuatu. Pacific-Australia Climate Change Science and Adaptation Planning Program
 Pacific-Australia Climate Change Science and Adaptation Planning Program Hiu Torres Islands Vanua Lava Gaua Banks Islands Espiritu Santo Malekula Ambae Épi Maéwo Pentecost Ambrym Shepherd Islands Éfate
Climate and Environment
 Climate and Environment Oxygen Isotope Fractionation and Measuring Ancient Temperatures Oxygen Isotope Ratio Cycles Oxygen isotope ratio cycles are cyclical variations in the ratio of the mass of oxygen
Climate 1: The Climate System
 Climate 1: The Climate System Prof. Franco Prodi Institute of Atmospheric Sciences and Climate National Research Council Via P. Gobetti, 101 40129 BOLOGNA SIF, School of Energy, Varenna, July 2014 CLIMATE
Atmosphere - Part 2. High and Low Pressure Systems
 Atmosphere - Part 2 High and Low Pressure Systems High Pressure vs. Low Pressure H regions : cool air sinks, increasing the air density, thus resulting in an area of high pressure L regions: warm air rises,
Environmental Science Chapter 13 Atmosphere and Climate Change Review
 Environmental Science Chapter 13 Atmosphere and Climate Change Review Multiple Choice Identify the choice that best completes the statement or answers the question. 1. Climate in a region is a. the long-term,
Sunspot Cycle Worksheet
 Sunspot Cycle Worksheet Read the Explore information and answer the Explain questions in your own words. Explore: Global warming and climate change are international concerns and the focus of much controversy.
Unit 2 Meteorology Test **Please do not write on this test** 5. El Nino & La Nina 6. Photosynthesis 7. Coriolis Effect 8.
 Matching (2 points each) 1. weather 2. climate 3. Greenhouse Effect 4. Convection Unit 2 Meteorology Test **Please do not write on this test** 5. El Nino & La Nina 6. Photosynthesis 7. Coriolis Effect
Features of Global Warming Review. GEOG/ENST 2331 Lecture 23 Ahrens: Chapter 16
 Features of Global Warming Review GEOG/ENST 2331 Lecture 23 Ahrens: Chapter 16 The Greenhouse Effect 255 K 288 K Ahrens, Fig. 2.12 What can change the global energy balance? Incoming energy Solar strength
Earth Science and Climate Change
 Earth Science and Climate Change Dr. Mary L. Cleave February 7, 2007 YOU ARE HERE 3 Land Use Changes Over Time Lingering Doubts on Temperature Trends Have Been Resolved 1st CCSP Synthesis & Assessment
becoming more reliable in climate change
 El Niño Occurs when air pressure increases in the western Pacific and decreases in the eastern Pacific Weakening the equatorial winds Water flows eastward, suppressing up-wellings, shu
IMPACTS OF A WARMING ARCTIC
 The Earth s Greenhouse Effect Most of the heat energy emitted from the surface is absorbed by greenhouse gases which radiate heat back down to warm the lower atmosphere and the surface. Increasing the
Weather Vs. Climate. Weather Vs. Climate. Chapter 14
 Weather Vs. Climate Chapter 14 Weather: Conditions of the atmosphere at a particular time and place, for short periods of time (days). Climate: Long-term averages of weather (Averaged over 30 yrs). Weather
Chapter outline. Reference 12/13/2016
 Chapter 2. observation CC EST 5103 Climate Change Science Rezaul Karim Environmental Science & Technology Jessore University of science & Technology Chapter outline Temperature in the instrumental record
Chapter 14: The Changing Climate
 Chapter 14: The Changing Climate Detecting Climate Change Natural Causes of Climate Change Anthropogenic Causes of Climate Change Possible Consequences of Global Warming Climate Change? -Paleo studies
Aspects of a climate observing system: energy and water. Kevin E Trenberth NCAR
 Aspects of a climate observing system: energy and water Kevin E Trenberth NCAR Tracking Earth s Global Energy Where has global warming from increased GHGs gone? Kevin E Trenberth NCAR Where did the heat
History. Late 18 th /early 19 th century Europeans observed that erratic boulders dispersed due to the retention of glaciers caused by climate chance
 Ice ages What is an ice age? Geological period of long-term reduction in the temperature of the Earth's surface and atmosphere which results in the formation and expansion of continental ice sheets, polar
Climate Change Lecture Notes
 Climate Change Lecture Notes (Topic 12A) page 1 Climate Change Lecture Notes Learning Outcomes for the Climate Change Unit 1. Students can list observations which suggest that the world is warming, and
Global Warming: Is There Still Time to Avoid Disastrous Human -Made Climate Change? i.e. Have We Passed a Tipping Point?
 Global Warming: Is There Still Time to Avoid Disastrous Human -Made Climate Change? i.e. Have We Passed a Tipping Point? Discussion on 23 April 2006 by Jim Hansen National Academy of Sciences, Washington,
Summary. The Ice Ages and Global Climate
 The Ice Ages and Global Climate Summary Earth s climate system involves the atmosphere, hydrosphere, lithosphere, and biosphere. Changes affecting it operate on time scales ranging from decades to millions
Weather and Climate Change
 Weather and Climate Change What if the environmental lapse rate falls between the moist and dry adiabatic lapse rates? The atmosphere is unstable for saturated air parcels but stable for unsaturated air
A Tutorial on Climate Change Science: The. 4 th National Climate Assessment CLIMATE SCIENCE. Don Wuebbles
 CLIMATE SCIENCE S P E C I A L R E P O R T A Tutorial on Climate Change Science: The Fourth National Climate Assessment Volume I 4 th National Climate Assessment Don Wuebbles Department of Atmospheric Sciences
After losing huge amount, Greenland ice is melting faster than ever
 After losing huge amount, Greenland ice is melting faster than ever By Washington Post, adapted by Newsela staff on 01.05.16 Word Count 861 A melting iceberg floats along a fjord leading away from the
FINAL EXAM PRACTICE #3: Meteorology, Climate, and Ecology
 FINAL EXAM PRACTICE #3: Meteorology, Climate, and Ecology 1. Clay is watching the weather to prepare for a trip to the beach tomorrow. The forecast predicts that a low-pressure system will move in overnight.
Future risk of tipping points
 Future risk of tipping points Tim Lenton (t.m.lenton@exeter.ac.uk) Thanks to Chris Boulton, Valerie Livina, Vasilis Dakos, Marten Scheffer, John Schellnhuber Outline Tipping points Early warning Taster
Climate Roles of Land Surface
 Lecture 5: Land Surface and Cryosphere (Outline) Climate Roles Surface Energy Balance Surface Water Balance Sea Ice Land Ice (from Our Changing Planet) Surface Albedo Climate Roles of Land Surface greenhouse
Current and future climate of the Solomon Islands. Pacific-Australia Climate Change Science and Adaptation Planning Program
 Pacific-Australia Climate Change Science and Adaptation Planning Program Ontong Java Atoll Shortland Islands Choiseul South Pacific Ocean Vella Lavella Ranongga New Georgia Islands Rendova Kolombangara
Terrestrial Climate Change Variables
 Terrestrial Climate Change Variables Content Terrestrial Climate Change Variables Surface Air Temperature Land Surface Temperature Sea Level Ice Level Aerosol Particles (acid rain) Terrestrial Climate
Climate Threat to the Planet:* Implications for Energy Policy and Intergenerational Justice
 Climate Threat to the Planet:* Implications for Energy Policy and Intergenerational Justice Jim Hansen December 17, 2008 Bjerknes Lecture, American Geophysical Union San Francisco, California *Any Policy-Related
Global warming and Extremes of Weather. Prof. Richard Allan, Department of Meteorology University of Reading
 Global warming and Extremes of Weather Prof. Richard Allan, Department of Meteorology University of Reading Extreme weather climate change Recent extreme weather focusses debate on climate change Can we
What is the IPCC? Intergovernmental Panel on Climate Change
 IPCC WG1 FAQ What is the IPCC? Intergovernmental Panel on Climate Change The IPCC is a scientific intergovernmental body set up by the World Meteorological Organization (WMO) and by the United Nations
Recent Climate History - The Instrumental Era.
 2002 Recent Climate History - The Instrumental Era. Figure 1. Reconstructed surface temperature record. Strong warming in the first and late part of the century. El Ninos and major volcanic eruptions are
Forum on Climate Change Noosa, July 2015 Exposing the myths of climate change
 Forum on Climate Change Noosa, July 2015 Exposing the myths of climate change Des Moore My thesis today is that there is minimal risk that temperatures will become dangerously high if there is continued
Climate Change. April 21, 2009
 Climate Change Chapter 16 April 21, 2009 Reconstructing Past Climates Techniques Glacial landscapes (fossils) CLIMAP (ocean sediment) Ice cores (layering of precipitation) p Otoliths (CaCO 3 in fish sensory
POLAR EXPLORER EXPLORING SEA LEVEL RISE
 POLAR EXPLORER EXPLORING SEA i LEVEL RISE Developed by: Margie Turrin, mkt@ldeo.columbia.edu As a polar explorer you and your team will be collec@ng evidence of changes occurring throughout the world that
Chapter 10 Planetary Atmospheres Earth and the Other Terrestrial Worlds. What is an atmosphere? Planetary Atmospheres
 Chapter 10 Planetary Atmospheres Earth and the Other Terrestrial Worlds What is an atmosphere? Planetary Atmospheres Pressure Composition Greenhouse effect Atmospheric structure Color of the sky 1 Atmospheres
GEOL/ENVS 3520 Spring 2009 Hour Exam #2
 GEOL/ENVS 3520 Spring 2009 Hour Exam #2 Enter your name, the date, your ID number, and a made-up 4-digit code (for later recall and identification of your test results) on the separate test sheet. Carefully
( 1 d 2 ) (Inverse Square law);
 (Inverse Square law);") ATMO 336 -- Exam 3 120 total points including take-home essay Name The following equations and relationships may prove useful. F d1 =F d2 d 2 2 ( 1 d 2 ) (Inverse Square law);! MAX = 0.29 " 104 µmk (Wien's
ATMO 336 -- Exam 3 120 total points including take-home essay Name The following equations and relationships may prove useful. F d1 =F d2 d 2 2 ( 1 d 2 ) (Inverse Square law);! MAX = 0.29 " 104 µmk (Wien's
Effects of Sea Level Rise in Florida
 Abstract International Research Journal of Earth Sciences ISSN 2321 2527 Int. Res.J. Earth Sci. Effects of Sea Level Rise in Florida Praveen Khanna, Udaya Kumar and Riyaz Ahamed Osankhan Department of
Climate and the Atmosphere
 Climate and Biomes Climate Objectives: Understand how weather is affected by: 1. Variations in the amount of incoming solar radiation 2. The earth s annual path around the sun 3. The earth s daily rotation
RR#5 - Free Response
 Base your answers to questions 1 through 3 on the data table below and on your knowledge of Earth Science. The table shows the area, in million square kilometers, of the Arctic Ocean covered by ice from
Will a warmer world change Queensland s rainfall?
 Will a warmer world change Queensland s rainfall? Nicholas P. Klingaman National Centre for Atmospheric Science-Climate Walker Institute for Climate System Research University of Reading The Walker-QCCCE
Guided Notes: Atmosphere Layers of the Atmosphere
 Guided Notes: Atmosphere Layers of the Atmosphere Atmosphere: Absorbs solar radiation, Burns up meteors, transports and recycles water, and other chemicals, and moderates climate Main Components: o Meteorology
Ice core-based climate research in Denmark
 June 16, 2009 Ice core-based climate research in Denmark Sune Olander Rasmussen Center coordinator and postdoc Centre for Ice and Climate Niels Bohr Institute University of Copenhagen Temperature and CO
Where is Earth s Water?
 PASSAGE 1 Where is Earth s Water? Our planet contains a limited amount of water that is always in motion. The water that comes out of your faucet moved through the atmosphere, flowed across Earth s surface,
How Will Melting Ice Sheets Affect Us?
 PASSAGE 4 How Will Melting Ice Sheets Affect Us? Variation is normal. During the last ice age, for example, ice sheets also covered much of North America and Scandinavia. Why is what s happening now different
Sea Level Rise in Connecticut A Risk-Informed Approach
 GZA GeoEnvironmental, Inc. CAFM Conference October 25, 2017 Proactive By Design. Our Company Commitment Proactive By Design. Our Company Commitment Sea Level Rise in Connecticut A Risk-Informed Approach
Weather Review. Use this graph to answer the next questions. A B C D
 Weather Review 1. Which of the following lists elements of the weather? a. Radiation, Wind Speed, Precipitation b. Soil type, Plate type, Water type c. Temperature, Precipitation, Air Pressure d. Ocean
Assessment of the Earth s Energy and Sea Level Changes
 Assessment of the Earth s Energy and Sea Level Changes John A. Church1, Ma0hew D. Palmer2 and Susan Wijffels1 1CSIRO Oceans and Atmosphere, Hobart, Australia 2Met Office Hadley Centre, Exeter, United Kingdom
Update on Climate Science. Professor Richard Betts, Met Office
 Update on Climate Science Professor Richard Betts, Met Office The science of climate change Crown copyright Met Office Prof Richard Betts Head of Climate Impacts Research Crown copyright Met Office Observing
Climate changes in Finland, but how? Jouni Räisänen Department of Physics, University of Helsinki
 Climate changes in Finland, but how? Jouni Räisänen Department of Physics, University of Helsinki 19.9.2012 Outline Some basic questions and answers about climate change How are projections of climate
Shepard Glacier-2005 Glacier National Park, Montana
 To help protect your privacy, PowerPoint prevented this external picture from being automatically downloaded. To download and display this picture, click Options in the Message Bar, and then click Enable
Changing Climate and Increased Volatility What it Means for the Energy Sector in the Future April 3, 2014 Jeff Johnson, Chief Science Officer
 Changing Climate and Increased Volatility What it Means for the Energy Sector in the Future April 3, 2014 Jeff Johnson, Chief Science Officer There is no doubt that the climate has changed, and it will
Hydrologic System. What is a Natural System? Hydrologic System
 31 The Changing Face of the Earth Before After Flooding of Mississippi & Illinois Rivers 1993 According to plate tectonic theory, which of these should have the most violent earthquakes, on average? 1.
Prof. Dr. Anders Levermann Junior Professor for climate modelling on long timescales, Potsdam Institute for Climate Impact Research, Potsdam, Germany
 Prof. Dr. Anders Levermann Junior Professor for climate modelling on long timescales, Potsdam Institute for Climate Impact Research, Potsdam, Germany Points for discussion: The state of global climate;
Website Lecture 3 The Physical Environment Part 1
 Website http://websites.rcc.edu/halama Lecture 3 The Physical Environment Part 1 1 Lectures 3 & 4 1. Biogeochemical Cycling 2. Solar Radiation 3. The Atmosphere 4. The Global Ocean 5. Weather and Climate
When Did the Anthropocene Begin? Observations and Climate Model Simulations
 When Did the Anthropocene Begin? Observations and Climate Model Simulations by John Kutzbach University of Wisconsin-Madison March 31, 2011 Colleagues: W. Ruddiman, S. Vavrus, G. Philippon-Berrthier Main
Current and future climate of the Marshall Islands. Pacific-Australia Climate Change Science and Adaptation Planning Program
 Pacific-Australia Climate Change Science and Adaptation Planning Program North Pacific Ocean Bikini Enewetak Ailinginae Rongelap Rongrik Utrik Taka R a Bikar t a Ujelang R a l i k Wotto Ujae C h a Lae