A global classification and characterization of earthquake clusters
|
|
|
- Betty Warner
- 5 years ago
- Views:
Transcription

1 A global classification and characterization of earthquake clusters Journal: Manuscript ID GJI--0 Manuscript Type: Research Paper Date Submitted by the Author: -Mar- Complete List of Authors: Zaliapin, Ilya; University of Nevada Reno, Mathematics and Statistics Ben-Zion, Yehuda; University of Southern California, Keywords: Earthquake dynamics < SEISMOLOGY, Earthquake interaction, forecasting, and prediction < SEISMOLOGY, Statistical seismology < SEISMOLOGY
2 Page of 0 0 A global classification and characterization of earthquake clusters Ilya Zaliapin,* and Yehuda Ben-Zion Department of Mathematics and Statistics, University of Nevada, Reno Department of Earth Sciences, University of Southern California, Los Angeles * Correspondence to: zal@unr.edu, ---0 Geophys. J. Int. in review, Short title: Global analysis of earthquake clusters
3 Page of 0 0 Summary We document space-dependent clustering properties of earthquakes with m in the - worldwide seismic catalog of the Northern California Earthquake Data Center. Earthquake clusters are identified using a nearest-neighbor distance in timespace-magnitude domain. Multiple cluster characteristics are compared with the heat flow level and type of deformation defined by parameters of the strain rate tensor. The analysis suggests that the dominant type of seismicity clusters in a region depends strongly on the heat flow, while the deformation style and intensity play a secondary role. The results show that there are two dominant types of global clustering: burst-like clusters that represent brittle fracture in cold lithosphere (e.g., shallow events in subduction zones) and swarm-like clusters that represent brittle-ductile deformation in hot lithosphere (e.g., mid-oceanic ridges). The global analysis results are consistent with theoretical expectations and previous analyses of earthquake clustering in southern California that used higher quality catalogs. The observed region-specific deviations from average universal description of seismicity provide important constraints on the physics governing earthquakes and can be used to improve local seismic hazard assessments. Key words: Earthquake dynamics, Earthquake interaction, forecasting, and prediction, Statistical seismology. Introduction Seismicity is often discussed as a prime natural example of universal self-similar behavior (Sornette & Sornette, ; Bak & Tang, ; Keilis-Borok, 0; Rundle et al., 0; Corall, 0; Turcotte & Malamud, 0). The term universality implies
4 Page of 0 0 validity of the same statistical laws in diverse geographic, geological, tectonic, and physical settings; while self-similarity refers to the abundance of earthquake characteristics described by power laws. A related term to self-similarity is scaleinvariance. We recall that the only function that is invariant with respect to changes of measurement units and/or scale of analysis is a power law. Table in Ben-Zion (0) lists various examples of power low distributions of earthquake and fault quantities. The most established of those are the power law distribution of seismic moments (Kagan, ), which is an alternative form of the exponential distribution of earthquake magnitudes in the Gutenberg-Richter law (Gutenberg & Richter, ), and the power decay rate of events following a large earthquake referred to as the Omori-Utsu law (Omori, ; Utsu et al., ). These laws were claimed to be universal on a global scale, at least at geologically long time intervals (e.g., Kagan, ). In this view the documented discrepancies in observed forms and parameters of earthquake statistics are attributed to statistical fluctuations and artifacts of catalog uncertainties (e.g., Kagan,, p.). An alternative approach discussed by Ben-Zion (0, Sects. -) considers the universal statistical descriptions to result in part from averaging data of large spatial domains having different event populations. If correct, clarifying the existence of different event populations in relation to physical properties of fault zones and the crust can increase the ability to extract detailed (region-specific) information from observed data and improve the understanding of earthquake physics. With these goals in mind, Bailey et al. (0, 0) analyzed patterns of earthquake focal mechanisms in southern California and found persisting differences in relation to
5 Page of 0 0 geometrical properties of the major fault zones. Zaliapin & Ben-Zion () analyzed along-strike symmetry properties of aftershocks in catalogs of fault zones in California, and established relations between deviations from generic symmetric distribution and contrasts of seismic velocities across the faults. See also Rubin & Gillard (00) and Rubin (0). The results are consistent with theoretical expectations on differences between ruptures on faults that do or do not separate different elastic solids (e.g., Weertman, 0; Ben-Zion, 0; Ampuero & Ben-Zion, 0). Yang & Ben-Zion (0) and Enescu et al. (0) showed that parameters of the Omori-Utsu aftershock decay law in southern California are correlated with the heat flow. Zaliapin & Ben-Zion (a, b) took this further by showing that there are distinctly different types of seismicity clusters in southern California with locations correlated with the heat flow. These results are consistent with theoretical expectations on properties of earthquake sequences in regions with different effective viscosity (Ben-Zion & Lyakhovsky, 0). In the present paper we generalize the results of Zaliapin & Ben-Zion (a,b) to the global scale. Our analysis focuses on earthquake clustering partitioning of seismicity into groups closer in space and time than expected in random distributions. Such groups reflect diverse triggering processes and prominently include traditional aftershock series, but also swarms and other types of clustering (Zaliapin & Ben-Zion, a; Vidale & Shearer, 0; Vidale at al., 0; Zhang & Shearer, ). Facilitated by high-quality catalog and problem-specific statistical techniques, we demonstrated in an earlier study that the cluster style of seismicity in southern California is closely related to physical properties of the crust and is changing at the scale of tens of kilometers (Zaliapin & Ben-
6 Page of 0 0 Zion, b). In particular, it was shown that there are two dominant types of clusters: (i) Burst-like clusters with a prominently large mainshock, small number of foreshocks and dominance of first-generation offspring. Such clusters reflect highly brittle rapid failure process in areas with cold crystalline rocks, decreased fluid content, and low heat flow production (decreased effective viscosity). Burst-like cluster areas in southern California include the San Jacinto fault zone, Mojave, Ventura and San Gabriel regions. (ii) Swarmlike clusters that lack a prominent mainshock, have increased foreshock activity, and abundance of secondary, tertiary, etc. offspring. Such clusters reflect mixed brittle-ductile failure in areas with increased fluids and heat flow and/or soft sediments (increased effective viscosity). Swarm-like cluster areas in southern California include the Salton Sea and Coso geothermal regions. The quality of data in southern California allowed us to validate the region-specific character of earthquake clustering by statistical differences in thirteen complementary cluster characteristics, including aftershock/foreshock intensity, magnitude difference between mainshock and the largest aftershock/foreshocks, b-value, cluster area, duration, etc., all of which related to the effective viscosity of a region and hence to the cluster type (Zaliapin & Ben-Zion, b, Table and Auxiliary Section C). The above results from southern California demonstrate the existence of regionspecific features that provide important information on earthquake dynamics and can contribute to improving seismic hazard assessments. However, extending the results to the global scale faces the problem of data quality. This is because higher magnitudes of completeness/reporting and earthquake location uncertainties impact cluster identification and lead to multiple artifacts (Zaliapin & Ben-Zion, ). In particular, low catalog
7 Page of 0 0 quality blurs the underlying fine structure of earthquake clusters, artificially making them more swarm-like, and moves some cluster events to the background mode. Accordingly, working with low-quality catalogs requires developing statistics tools that are robust to the catalog uncertainties. In the following sections we develop such a toolbox, and use it to reveal strong spatial dependence of global earthquake clustering that is mainly controlled by the local heat flow production. We confirm the existence of the two primary types of earthquake clusters burst-like and swarm-like and show that burst-like clusters are associated with cold regions (mainly shallow seismicity of subduction zones), while swarm-like clustering is typical for hot regions (mainly mid-oceanic ridges). The type of plateboundary deformation is also examined and shown to play a secondary role in determining the cluster style of seismicity. The global results presented in this study are consistent with our previous regional findings in southern California based on higherquality data. The analysis of possible sources of artifacts for each examined statistics provide results designed to be robust to the known catalog uncertainties and deficiencies.. Data and methods. Earthquakes We work with the global catalog produced by the Northern California Earthquake Data Center (NCEDC, ). The examined catalog covers the period // to // and contains, events. The minimal magnitude used in the analysis is m min =. This magnitude is higher than the completeness magnitude in many examined regions, in particular during the earlier times. We demonstrated (Zaliapin & Ben-Zion,
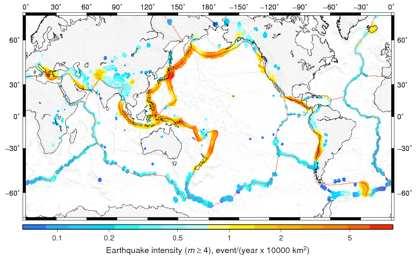
8 Page of 0 0 a, Auxiliary Sections D,E) that the cluster structure estimated by our technique (Sect. ) is insensitive to the catalog incompleteness as well as to the minimal reported magnitude. Accordingly, some cluster statistics, like the total number of clusters and partition of events into mainshocks, foreshocks, and aftershocks (see Sect.. for definitions) are fairly robust with respect to the magnitude incompleteness. The incompleteness however does affect the cluster size distribution, as discussed in Sect... We only consider events with depth less than z c = 0km. The depth reporting in NCEDC catalog is highly irresolute:, events (.%) are assigned a depth of km and, events (.%) are assigned a depth of 0 km. Other popular (default) depth values are km (, events,.%), km (, events,.%), and km (, events,.0%). In addition, there is a tendency, especially during earlier times, to assign depths divisible by km (, 0,, etc.). Our analysis is based on earthquake epicenters and is not affected by the depth uncertainties. Figure a shows the spatial intensity Λ(x) of events in the ANSS catalog, in events with magnitude m per year per 0,000 km. Appendix B describes the process of producing smooth spatial maps of different seismic and physical characteristics used in this study. The intensity varies over several orders of magnitude, from 0.0 to., with the highest values associated with contracting subduction zones and lowest values associated with mid-oceanic spreading ridges. The global spatial distribution of the maximal observed earthquake magnitude m max of the examined seismicity is illustrated in Fig. b. Naturally, the fluctuations of the maximal observed magnitude are closely related to the seismic intensity fluctuations. The distribution of hypocentral depth of the
9 Page of 0 0 examined earthquakes is shown in Appendix A, Fig. Aa. Its spatial variations resemble those for the earthquake intensity and maximal magnitude. Figure c presents the spatial variability of the magnitude completeness of the examined catalog. It shows the proportion p of earthquakes with magnitude m, which serves as a proxy to completeness quality. Specifically, if the number N(m) of events with magnitude above m is given by the Gutenberg-Richter law log 0 N(m) = a bm, m m c () with b = and m c =, then p = 0.. Deficiency of events in small magnitude range results in lower values of p. Mild fluctuations of the b-value also affect this completeness proxy albeit to a lesser degree. For instance, if we assume validity of Eq. () with m c =, then variation of b-values in the range [0.,.] results in p in the range [0., 0.], with lower b-values corresponding to lower p values. Hence, the main fluctuations of p (that goes as low as 0.) observed in Fig. c are due to incompleteness. The analysis suggests that catalog quality is deteriorated for oceanic seismicity, relatively far from seismic networks, which mainly occur in the southern hemisphere. Figure illustrates and summarizes the diversity of seismic regimes and parameters as well as variations in catalog quality involved in a global study. The statistics used in our analysis are designed to be robust with respect to these obstacles and yet still reflect the essential characteristics of the regional cluster style.. Heat flow
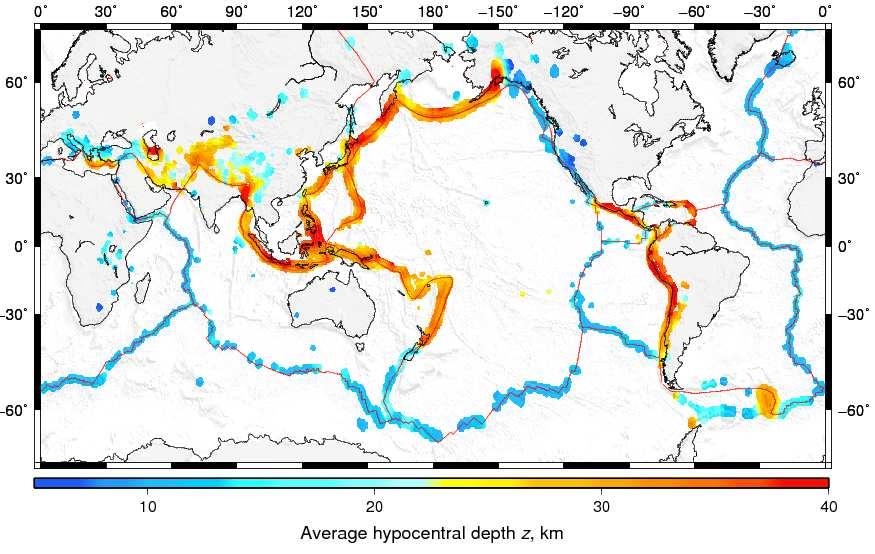
10 Page of 0 0 The employed surface heat flow data is taken from Bird et al. (0). The heat flow within the seismically active areas is mapped in Fig.. The distribution of the heat flow over the entire Earth surface is shown in Appendix A, Fig. A. The heat flow production is prominently high along the oceanic spreading ridges, reaching 0. W/m.. Strain rate tensor We use the global strain rate field modeled by Kreemer et al. (). Specifically, we consider the second invariant I of the strain rate tensor &ε : I = and the tensor style S defined by Kreemer et al. () as: ( &ε ϕϕ ) + ( &ε θθ ) + ( &ε ϕθ ) () e S = + e max e, e ( ). () Here e i are the eigenvalues of the strain rate tensor. The strain rate tensor style S can be used to roughly quantify the type of displacement into contraction (S < 0.), strike-slip (0. < S < 0.), and extension (S > 0.). The maps of strain rate tensor second invariant and style are shown in Appendix A, Fig. A.. -analysis Any cluster analysis of earthquakes is affected by the existence of the catalog lower cutoff magnitude m min (which may be smaller than the completeness magnitude m c ). For instance, if we analyze earthquakes with m m min =, then an earthquake of m = cannot have recorded aftershocks of a smaller magnitude, while an m = event may have aftershocks with magnitudes m. To equalize the magnitude ranges for potential
11 Page 0 of 0 0 fore/aftershocks of mainshocks with different magnitudes, we sometimes perform - analysis that (i) only considers mainshocks with magnitude m m min + and (ii) only considers fore/aftershocks with magnitude within units below that of a mainshock. The fore/aftershocks detected by this analysis are called -fore/aftershocks. The conventional analysis that considers all events is referred to as regular analysis.. Earthquake clusters. Generalized earthquake distance Consider a catalog where each event i is characterized by its occurrence time t i, hypocenter (φ, ι λ i, d i ), and magnitude m i. We define the proximity η ij of earthquake j to earthquake i following Baiesi and Paczuski (0) as: t ij (r ij ) d 0 bm i η ij =, t ij > 0; (), t ij 0. Here, t ij = t j t i is the event intercurrence time, which is positive if event j occurred after event i; r ij 0 is the spatial distance between the earthquake hypocenters; d is the (possibly fractal) dimension of the hypocenters or epicenters, and b is the parameter of the Gutenberg-Richter law (). The motivation for and properties of this proximity measure are discussed in Zaliapin and Ben-Zion (a,, ).. Parent-offspring identification For each event i we identify its unique nearest neighbor (parent) j with respect to the distance given by Eq. (), and denote for simplicity the nearest-neighbor distance by the same symbol η ij. The event i is called an offspring of j. According to this definition, each 0
12 Page of 0 0 event (except the first one in the catalog) has a unique parent, and also might have multiple offspring.. Bimodal distribution of the nearest-neighbor distance Consider the space and time distances between event i and its parent j normalized by the magnitude of the parent event (Zaliapin et al., 0): T ij = t ij 0 qbm i ; R ij = (r ij ) d 0 pbm i ; q + p =. () This is convenient because now log η = log T + log R ij Zaliapin and Ben-Zion (a) demonstrated that a time-stationary space-inhomogeneous Poisson flow of events with Gutenberg-Richter magnitudes corresponds to a unimodal distribution of (log T, log R) that is concentrated along a line log 0 T + log 0 R = const. Observed seismicity, however, shows a bimodal joint distribution of (log 0 T, log 0 R), as has been documented in multiple studies of various regions (e.g., Zaliapin et al., 0; Zaliapin & Ben-Zion,, a, b,, ; Gu et al., ; Davidsen et al., ; Schoenball et al., ; Reverso et al., ). One of the modes is similar to that observed in a Poisson process and corresponds to background events, while the other consists of clustered events located considerably closer in time and space to their parents than expected in a Poisson process (see Fig. ). The bimodality allows using a suitably chosen nearest-neighbor threshold η 0 to formally attribute each event to either the background (if η ij > η 0 ) or cluster (if η ij < η 0 ) mode. The threshold selection can be done according to a Gaussian mixture model with two modes, as described in the next section.. Separating the background and cluster modes: A Gaussian mixture model approach ij ij. Zaliapin et al. (0) and
13 Page of 0 0 A two-mode Gaussian mixture model assumes that sample x i R m, i =,,n comes from the distribution F(x) = pn ( x;µ,σ ) + ( p)n ( x;µ,σ ), () where p is the mixture weight of the first mode and N(x;µ,Σ) denotes the Gaussian (Normal) distribution, with mean µ that is a vector with m components and variance Σ that is a positive-definite m m matrix. The estimation of such model can be done using the Expectation-Maximization algorithm (Dempster et al., ). In our setting, we can either apply a -D Gaussian mixture model to the log-distance log 0 η or a -D Gaussian mixture model to the logarithmic components (log 0 T, log 0 R). Both approaches give very close results. The details of numerical implementation are discussed in Hicks (). A model assigns to each event the probabilities p and ( p) of being attributed to one or the other mode. We make the final mode assignment according to the maximal probability q = max(p, p). This corresponds to choosing the mode separation threshold η 0 that equalizes the densities of the two estimated Gaussian modes: N(η 0 ;µ,σ ) = N(η 0 ;µ,σ ). () The background (cluster) events now can be equivalently defined by the condition η ij > η 0 (η ij η 0 ). In -D case, the position η bg of the background is defined as the mean value of the estimated rightmost Gaussian mode: η bg = max(µ, µ ). In -D case we define η bg = max(µ []+µ [], µ []+µ []), where the notation [i] refers to the i-th component of a vector. Alternatively, one can define η bg as (a) the mean generalized earthquake distance η ij of the background events, or (b) the mean generalized distance of events that happened at large spatial distance from their parent (say, R >, ). The last approach is
14 Page of 0 0 motivated by the observation that the majority of events at large spatial distances from their parent belong to the background mode (see Fig. ). These alternate approaches give results (not shown) that are very close to those obtained with our main method. The regional mode separation quality Q is defined as the average value of the mode assignment probability q = max(p,-p) over all events in a region. According to this definition, the quality is constrained by 0. Q, where Q = corresponds to a perfect separation (each event is attributed to one of the modes with probability ) and Q = 0. corresponds to an indeterminate separation (each event is attributed to either mode with the same probability of 0.).. Cluster identification Connecting each earthquake in the catalog to its nearest neighbor (parent) according to the nearest-neighbor distance η of Eq. () produces a single cluster (spanning network) that contains all examined events. From a graph-theoretical perspective, this cluster is a tree graph, which means that it does not have loops (Baiesi & Paczuski, 0; Zaliapin & Ben-Zion, a). Removing all links that correspond to large parent-offspring distances, defined by the condition η η 0, creates a spanning forest a collection of trees each representing a separate earthquake cluster. The forest contains many single-event trees, which we call singles. The other clusters contain multiple events and are called families.. Event classification
15 Page of 0 0 In each family, the earthquake with the largest magnitude is called mainshock. If there are several earthquakes with same largest magnitude within a family, the first one is considered to be the mainshock, so each family has a single mainshock. All events in a family that occurred after the mainshock are called aftershocks. All events that occurred prior to the mainshock are called foreshocks. Each single is also considered to be a mainshock (that has no foreshocks and aftershocks).. Parameters In this study we use event epicenters rather than hypocenters because the depth coordinates are often less accurate than those of the epicenters, and location errors lead to various analysis artifacts as discussed in detail by Zaliapin & Ben-Zion (). In addition, we fix b =, d =., and p = 0.. Zaliapin & Ben-Zion (a) showed that the estimated cluster structure is fairly robust with respect to the values of these parameters. Accordingly, the main conclusions of this study are not sensitive to the precise parameter values. We refer to Zaliapin & Ben-Zion (a) for further details on and examples of performance of our cluster technique, as well as detailed analysis on its stability. The statistical artifacts of catalog uncertainties that affect cluster analysis based on parentoffspring identification are examined in Zaliapin & Ben-Zion ().. Results
16 Page of 0 0. Basic characteristics of seismicity For the purpose of this study, a point on the Earth surface is denoted seismically active if there are or more events with magnitude m within 00 km of this point according to the NCEDC catalog during -. The total Earth surface area is. 0 km ; about % of this area, or. 0 km, is seismically active. Figure shows basic characteristics of seismicity in the active areas: (panel a) Intensity, in event/(year 0,000 km ), of earthquakes with magnitude m, (b) maximal observed magnitude, and (c) proportion of events with magnitude m which serves as a proxy for catalog completeness (see discussion in Sect..). Next we relate the three characteristics illustrated in Figure to the type of lithospheric deformation. Figure a displays the partitioning of seismically active area with respect to values of the strain rate tensor style S and second invariant I. The analysis is done within cells that tile the Earth surface. About half of the active area corresponds to lowest values of the second invariant I < 00 attributed to subduction zones and other contraction environments. The largest 0% of the values of the second invariant (I >,000) are associated with mid-ocean ridges and other extension environments. The partition of seismic area into different tensor styles is fairly independent of the values of I approximately 0% in contraction, % in strike-slip, and % in extension. Figure b shows the average value of seismic intensity for events with m in the same coordinates (S, I ). The highest average intensity of Λ events per year per 0,000 km is exclusively observed within contracting environments: S < 0., I > 00. The lowest average intensity, 0. < Λ <, is observed within extending
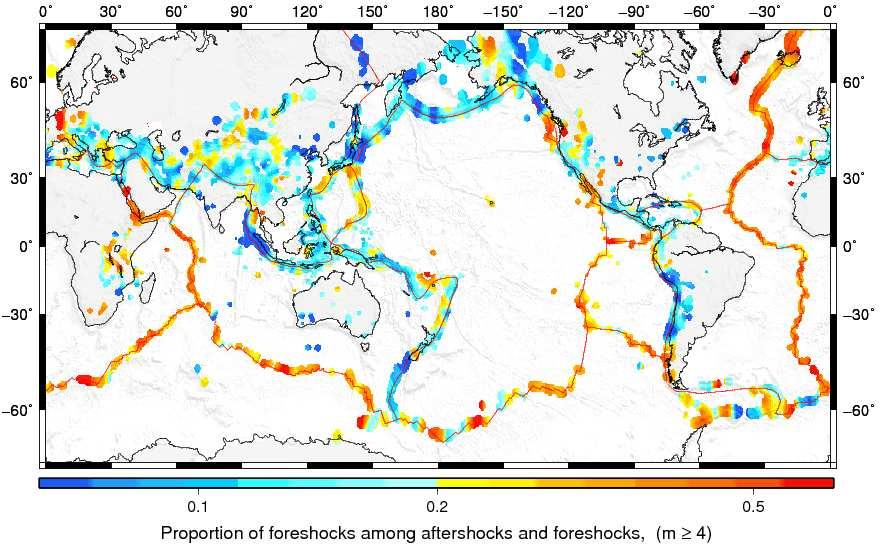
17 Page of 0 0 environments. The intensity in strike-slip zones is intermediate around and slightly below Λ =. The highest seismic activity typically occurred in subduction zones, which explain a close resemblance in the patterns of seismic intensity (Fig. b) and that of the average hypocentral depth (Fig. Aa, Appendix A). The average heat flow has the highest values (H > 0.) exclusively within extension environments along the mid-oceanic spreading ridges (Fig. c). The results in Figs b,c emphasize that the spatial distribution of seismic intensity is inversely related to that of the heat flow. As shown below, the heat flow production also governs the space-dependent style of earthquake clustering. Figure presents the distribution of the generalized earthquake distance η of Eq. () and the joint distribution of its normalized space and time components (R,T) of Eq. () for the earthquakes from areas with low (H < 0.) and high (H > 0.) heat flow value. The background and cluster modes are seen clearly in both cases. However, there exist several notable differences in the cluster style of earthquakes in high vs. low heat flow regions: (i) The typical position η bg of the background mode in low heat flow regions (log 0 η bg -.) is lower than that in high heat flow regions (log 0 η bg -.0). This reflects higher earthquake intensity in low heat flow regions that have predominantly contracting and transform deformation style, and corroborates our earlier observations in Figs. b,c. (ii) The proportion of background events in low heat flow regions is lower than that in high heat flow regions. Accordingly, the proportion of clustered events is higher in low heat flow regions. (iii) The time decay of cluster events is faster in high heat flow regions, leading to stronger time separation between the background and cluster modes. This can be seen by comparing how the cluster mode is blending with the background mode in panels (a) and (c) of Fig.. The offspring duration is longer in low heat flow
18 Page of 0 0 regions, which is reflected by a horizontally elongated shape of the cluster mode in Fig. a, as opposed to a more confined location of the cluster mode in high heat flow regions in Fig. c. (v) Proportion of repeaters events that happen at short spatial and large temporal distances from the parent and hence occupy the lower right corner of the (T,R) plots in Figs. a,c is larger in high heat flow regions. This observation is further illustrated in Fig. that shows the distribution of rescaled time to parent T for offspring within two parent rupture lengths to the parent. In cold regions (panel a) the cluster and background modes are largely overlapping at these short distances to parent. The background mode is centered at about log 0 T = - and has lower intensity and spread compared to that of the clustered mode. The latter is centered at log 0 T = - and has much larger spread, interpreted as slow decay of intensity of offspring earthquakes. In hot regions (panel b), on the contrary, the two modes are well separated. The background mode is centered at about log 0 T = - (lower intensity of background events compared to those in cold regions), and has notably higher intensity than the cluster mode. The cluster mode is centered at about log 0 T = -. and has smaller spread than that of the cluster mode in cold regions, suggesting faster decay of intensity of offspring earthquakes.. Cluster and background modes The results of Figs. - demonstrate that earthquake clustering style is spacedependent and related to the heat flow production. We now complement these analyses by additional statistics involving the earthquake nearest-neighbor distances. Specifically, we apply a -D Gaussian mixture model (Sect..) to the nearest-neighbor distances log 0 η of events within circles of radius r = 0 km centered at the epicenters of all
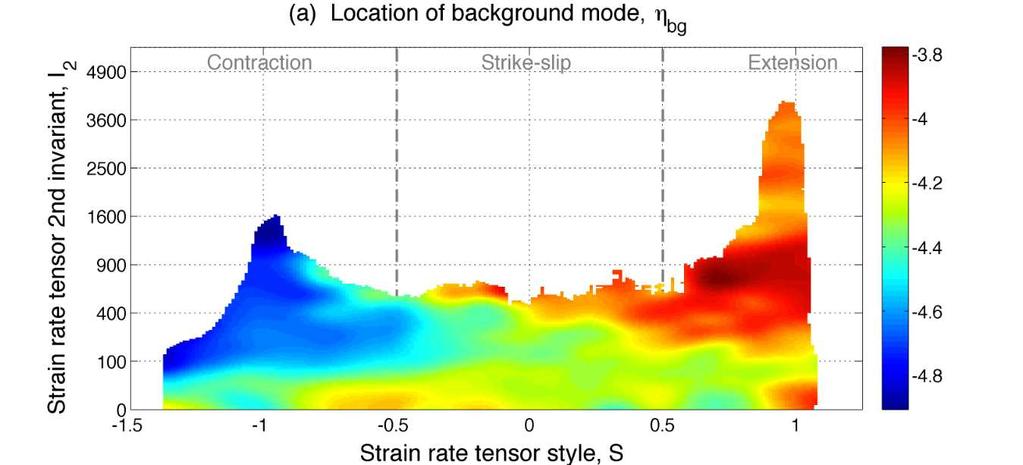
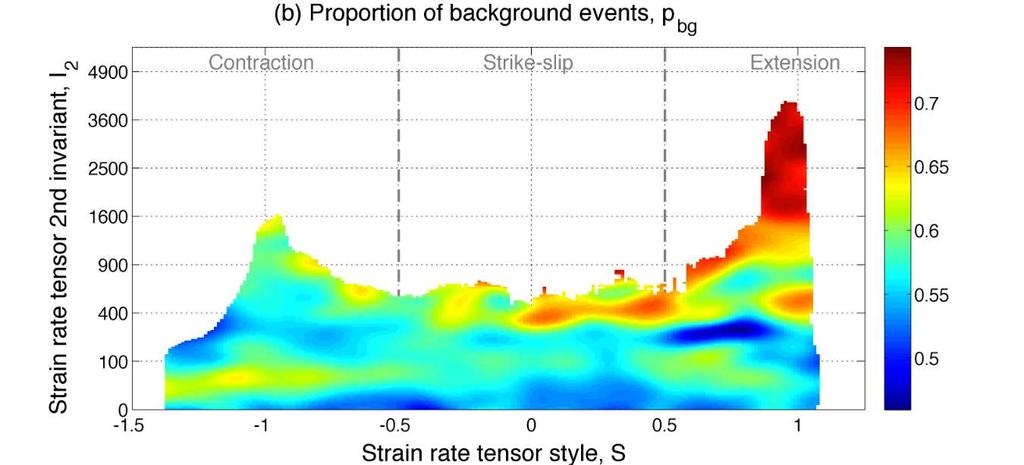
19 Page of 0 0 examined earthquakes. The model is used to estimate the space-dependent threshold η 0 that separates the cluster and background modes, partition the events into cluster and background populations, estimate the characteristic position η bg of the background mode, and assess the quality Q of mode separation. Figure shows the spatial maps of the position η bg of the background mode (panel a) and the proportion of events in the background mode (panel b). The map of the quality Q of the mode separation is shown in Appendix A, Fig. Ac. The location of the background mode is primarily controlled by the absolute intensity of the background events (Zaliapin et al., 0; Zaliapin & Ben-Zion, a). This explains the inverse relation between the background location (Fig. a) and earthquake intensity (Fig. a). Furthermore, the values of η bg follow a three-modal distribution, clearly outlining the major tectonic environments in agreement with Fig. b. The highest earthquake intensity and lowest values of η bg < -. are observed within convergent environments. The lowest earthquake intensity and largest values of η bg > -. are observed along divergent boundaries. Intermediate values of earthquake intensity and background position -. < η bg < -. are observed along transform boundaries. Appendix A, Fig. Ab shows the worldwide spatial distribution of a related feature the threshold η 0 that separates the background and cluster mode, according to a Gaussian mixture model. The other examined cluster characteristics exhibit similar spatial variations. In particular, divergent environments have uniformly increased background proportions p bg > 0. (Fig. b) and high mode separation quality Q 0. (Appendix A, Fig. Ac). Convergent environments exhibit much larger spatial variability and intermittence in the
20 Page of 0 0 values of background proportions p bg and separation quality Q. For instance, Fig. b shows that in the Northwestern part of the Pacific plate, along the Kuril-Kamchatka and Japan trenches, the background proportion varies widely in the range 0. to 0. over a scale of hundreds of kilometers that coincides with the spatial resolution of our analysis. Another example of highly intermittent spatial behavior is the Persia-Tibet-Burma orogeny in the Eurasian plate. Overall, however, the average proportion of the background events in transform and convergent environments is lower than in divergent environments, as illustrated in Fig. b. Similarly, the mode separation quality Q shows high intermittency within transform and convergent boundaries. It changes in the range between 0. and 0. with rather sharp spatial gradients (Appendix A, Fig. Ac), and has overall lower values compared to divergent zones (Fig. c). The observed clear spatial variations in the cluster parameters are not spurious but governed by local tectonic and physical settings. This was shown in a local study for southern California (Zaliapin & Ben-Zion b); a detailed demonstration of such correlations in the global setting is outside the resolution of this study. Figure compares the three examined parameters of seismic clustering as functions of strain rate tensor s style S and second invariant I. This analysis further emphasizes the coupling between the examined characteristics and their correlation with the heat flow (cf. Fig. c).. Properties of Earthquake clusters The, events of the examined catalog have been partitioned into, clusters according to the procedure of Sect.. Of those clusters,, (.%) are singles and, (.%) are families with sizes ranging from to,. Tables,
21 Page of 0 0 summarize the individual event classification (into singles, mainshocks, foreshocks, and aftershocks) in the regular and -analysis, respectively. Figure a shows the distribution of cluster size N for clusters in areas with high (H > 0.) and low (H < 0.) heat flow levels. The distribution tail in both cases can be approximated by a power law S(N) = Prob[cluster size > N] N α () with power index α in hot areas and α in cold areas. The value of α was previously reported for the cluster size distribution in southern California (Zaliapin and Ben-Zion, a]. The observed difference in the cluster size distributions implies that (i) cold areas have much larger clusters indeed, the maximal cluster size in cold areas is max(n H < 0.) =, while the maximal cluster size in hot areas is times smaller, max(n H 0.) = ; and (ii) the proportion of clusters with size N > 0 is larger in cold areas. Recall that the cluster size statistically increases with the maximal observed magnitude, since larger events have more offspring (e.g., Utsu, 0; Ogata et al., ); it also increases as the magnitude of completeness decreases. Accordingly, the dominance of large clusters in cold regions observed in Fig. a is explained by statistically higher maximal magnitude (see Fig. b) and better quality of catalogs (see Fig. c) in cold regions compared to hot ones. To eliminate effects related to differences in largest regional magnitude, we compare the cluster size distributions in hot and cold areas using -analysis with = (Fig. b). This approach equalizes the cluster sizes with mainshocks of different magnitudes (Zaliapin & Ben-Zion, a), and hence should eliminate the discrepancy caused by different levels of seismic activity in cold and hot regions. This analysis also indicates
22 Page of 0 0 that the cluster size is statistically larger in cold areas. Finally, we compare the cluster size distribution for clusters with intermediate-magnitude mainshocks. As shown in Fig. c, the size of clusters with mainshock magnitude m < is consistently larger in hot regions. This is reflected by the observation that the survival function of cluster size distribution in hot regions (solid red line) is above that of cold regions (dashed blue line) for the examined cluster sizes N. Similarly, the cluster size is statistically higher in hot regions for clusters in all magnitude ranges below m = (not shown). In addition, the number of foreshocks and aftershocks per cluster with mainshock magnitude m < is significantly higher in hot regions (not shown). In summary, statistically larger cluster size in cold regions is exclusively related to the presence of large-magnitude clusters with mainshock magnitude m >. At the same time, the size of intermediate-magnitude clusters (with mainshock magnitude m < ) is statistically larger in hot regions. These two observations are consistent with the finding of Zaliapin & Ben-Zion (b) in southern California, who also pointed out the difference in clustering styles of the largest regional events and the rest of earthquakes, and reported larger cluster size of intermediate-magnitude clusters in hot regions. As a particular case of small-cluster size analysis, we notice that the proportion p S of smallest clusters singles is higher in cold areas: p S (H < 0.) = 0. vs. p S (H 0.) = 0.0. The observed difference in proportions is highly significant, with p-value being essentially zero (p < 0 - ) according to the Fisher test (Agresti, 0). This effect is noteworthy, since the higher maximal magnitude, better quality of catalogs, and lower completeness magnitude in cold regions should decrease the number of singles (e.g., Zaliapin & Ben-Zion, ). On the other hand, the probability of being a single is higher
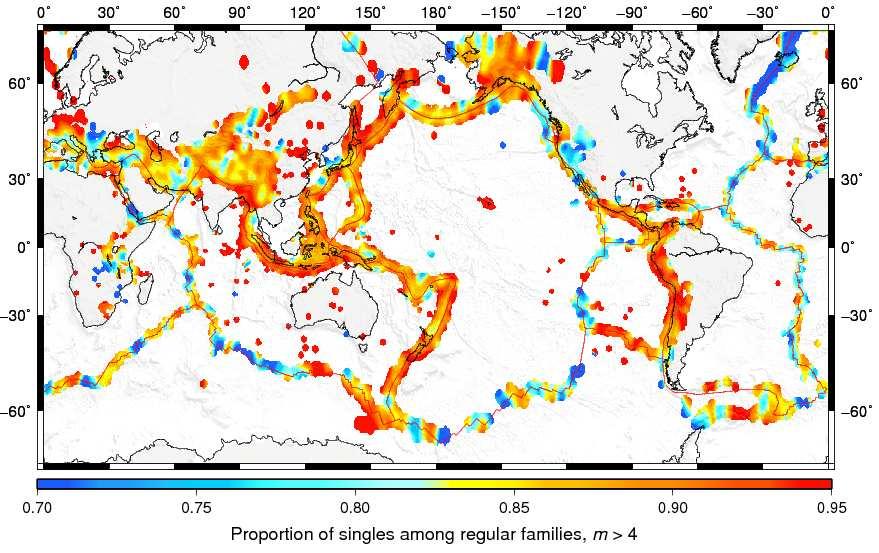
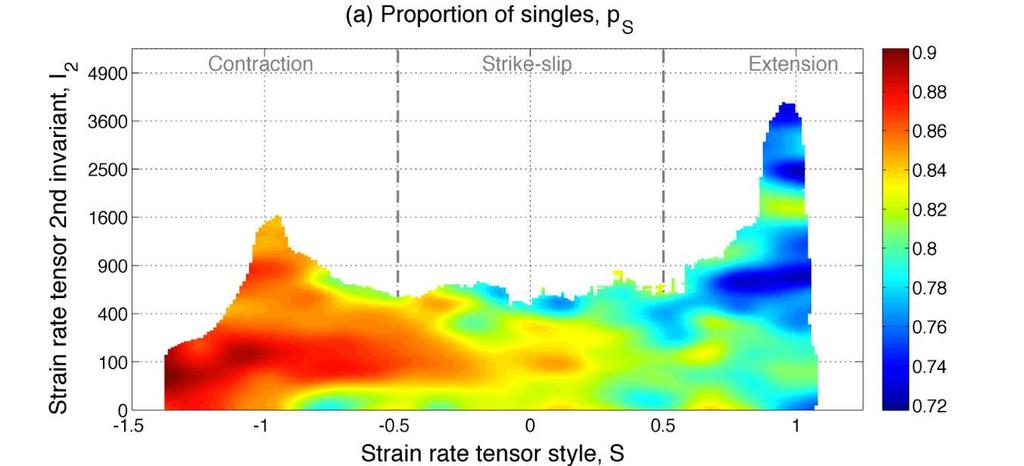
23 Page of 0 0 for small-magnitude events (e.g., it is more probable for m = event to have no offspring than for m = ). Accordingly, an increased detected proportion of small-magnitude events in cold regions (see Fig. c) might inflate the proportion of singles. We demonstrate that this effect is not ultimately responsible for an increased proportion of singles in cold regions by repeating the analysis within each magnitude interval of length 0.: [.0,.), [.,.), etc. The proportion of singles is higher in cold regions (not shown) for each magnitude interval from [.0,.), to [.,.). Table summarizes the results of a formal statistical testing that uses magnitude intervals of length 0. and confirms the statistical significance of the observed differences for events with magnitudes from.0 to.. This analysis also demonstrates that events with m >. in cold regions become singles less often than those in hot regions (not shown). It is difficult to conclude with the existing data whether this effect is related to the inferior catalog quality in hot regions or is a real physical property. Figure a shows the proportion p S of singles among families in different regions. The proportion varies between 0. and 0.. The highest values (p S > 0.) are typically observed within cold regions, while lowest values (p S < 0.) almost exclusively belong to hot areas. A closer examination reveals that the proportion of singles exhibits abrupt spatial fluctuations in some areas (e.g., mid-ocean ridges) over hundreds of kilometers. These fluctuations are caused by local tectonic and physical settings, such as transition from transform to extension faulting, but are not the focus of this study. The relation between the proportion of singles and heat flow is further illustrated in Fig. 0a that shows p S as a function of strain tensor parameters (S, I ). The large-scale averaging used in this analysis clearly demonstrates an increased proportion of singles within cold areas.
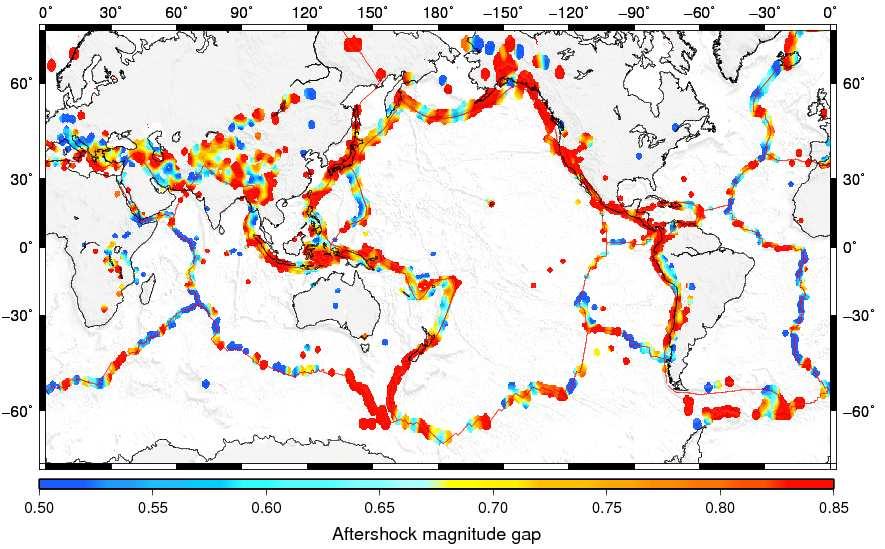
24 Page of 0 0. Foreshocks and aftershocks The global spatial distribution of the proportion p F of foreshocks among foreshocks and aftershocks is shown in Fig. b. The proportion is visibly higher in areas with high heat flow, with typical values p F > 0., while in areas with low heat flow the typical proportion is very small, p F < 0.. The increased production of foreshocks in hot regions is confirmed by the analysis of Fig. 0b that shows the value of p F averaged for different combinations of strain rate tensor s style S and second invariant I. This result corroborates the earlier regional finding of Zaliapin & Ben-Zion (b) that the number and proportion of foreshocks increases with the heat flow in southern California, and the observation of McGuire et al. (0) on large proportion of foreshocks within the swarms along the Pacific Rise Transform fault. Spatial patterns similar to those reported in Fig. a,b are also seen for other examined cluster characteristics. For instance, Fig. Ad shows a worldwide map of the aftershock magnitude gap A defined for families with aftershocks as the difference between the magnitudes of the mainshock and the largest aftershock. This analysis is done for all families with mainshock magnitude m. The gap is generally larger within cold regions, with typical value of A 0., while in hot regions it is typically smaller, A 0.. This observation is corroborated in Fig. 0c that shows the aftershock magnitude gap as a function of strain rate tensor parameters (S, I ); the domain of low gap values is similar of that of high heat flow shown in Fig. c. We note that the values of the aftershock magnitude gap reported here are lower than the value A suggested by the Båth law (Båth, ; Shcherbakov & Turcotte, 0).
25 Page of 0 0 This deflation is artificial and is due to the fact that we consider families with mainshock magnitude m, which is only one unit above the magnitude cut-off m min = selected for this study. Notably, the difference in the magnitude gap A between hot and cold areas is only seen for intermediate-magnitude clusters with m < ; the difference disappears for large-magnitude clusters with m > (results not shown). The magnitude gap is affected by the catalog completeness magnitude, since a higher completeness magnitude leads to smaller observed values of A (while clusters with larger magnitude gap may artificially become singles). Hence, the reported difference in magnitude gap might be influenced to some extent by inferior catalog quality in hot areas. However, Zaliapin & Ben-Zion (b) reported lower magnitude gap in hot regions in a local study in southern California, where the quality of catalogs is comparable in both cold and hot regions. We therefore believe that the magnitude gap difference between hot and cold areas is a real phenomenon that will be confirmed in future studies with better catalog quality.. Structure of earthquake families Consider a tree T that represents an earthquake family as described in Sect.. The tree consists of a collection of vertices V={v i }, i =,,N each of which represents an earthquake, and edges E={e i }, i =,,N such that edge e i connects earthquake i to its parent that also belongs to the tree T. Here we index the family earthquakes in the order of their occurrence time: i < j if and only if t i < t j. By construction (see Sect. ), the parent of the first event in the family does not belong to the same family, and hence the first event does not have an associated edge within T. All other events have a single parent
26 Page of 0 0 from the same family. Hence each tree consists of N vertices and N- edges. We refer to the first event in the family as the root. Denote by C(i) the number of children of vertex i within T, and by N p = #{i: C(i) > 0} the number of parental vertices within T. We consider two statistics of a time-oriented rooted tree that represent an earthquake family: the average family branching B and the average leaf depth d (Zaliapin & Ben-Zion, b). The average family branching B is the average number of offspring per parental vertex of the tree T: B = C(i). () N p i The average leaf depth d is the average number of edges between a leaf and the tree root. Namely, if d i denotes the number of edges between vertex i and the tree root, then d = N N p. (0) d i i:c(i)=0 It is natural to expect the leaf depth and family branching to be negatively correlated. An intuitive justification for such reciprocal relation comes from the observation that for a tree with constant branching and leaf depth, that is with C(i) = C given that C(i) > 0 and d i = D given that C(i)=0, we have N N p = C D. Zaliapin & Ben-Zion (b) showed that the values of B and d are strongly coupled with the heat flow in southern California. Specifically, the average leaf depth increases while the average branching decreases as the heat flow increases. The same general trend is observed on the global scale. Figure shows the values of d and B averaged for different family sizes N in hot and cold regions. It is seen that the average leaf depth d is significantly larger, and the family branching B is significantly smaller, in hot areas compared to cold areas. We also notice that (i) the difference between hot and cold
27 Page of 0 0 regions (difference between red and blue lines) is increasing with the family size and (ii) the values of both statistics increase with the cluster size. Next we focus on the spatial distribution of the average leaf depth d and family branching B. The values of both statistics depend on the family size (see Fig. ), which can contaminate spatial analysis as the family size N significantly varies from region to region, as documented in Fig.. A least-square regression analysis suggests that the examined statistics have the following relation to the family size N in the intermediate size range N : log 0 d = 0. log 0 N + d N, log 0 B = 0. log 0 N + B N, () where d N and B N are respective (non-gaussian) regression errors with zero mean. Figure confirms that the average values of d N and B N are fairly independent of the family size in the range N. By regression construction, the error variables d N and B N describe variability of the initial statistics d and B, respectively, not explained by the family size N. Figure c show the global spatial distribution of d N for families with sizes N. This analysis confirms our earlier observation: despite some geographic fluctuations cold regions have a typical value log 0 d N -0.0 that is consistently smaller than a typical value of the hot regions, log 0 d N 0.. The spatial distribution of B N (Fig. Ae) has an inverted pattern: despite some geographic fluctuations cold regions have a typical value log 0 B N 0 that is consistently larger than a typical value of hot regions, log 0 B N -0.. Figures 0d and Ab show the average values of d N and B N, respectively, as functions of strain rate tensor parameters S and I. The results confirm that heat flow exerts the primary control on the values of these two statistics.
28 Page of 0 0. Discussion Clarifying whether earthquake dynamics follows universal laws or exhibits different forms related to physical properties of the lithosphere is among the main problems of statistical seismology. The present study supports earlier results mentioned in the introduction on the existence of non-universal region-specific behavior of seismicity. This is done by extending the analysis of Zaliapin & Ben-Zion (a,b) of earthquake clusters in southern California to the global scale using data from the NCEDC worldwide catalog for the period -. One general difficulty in demonstrating robust differences in properties of earthquakes in different regions is varied quality of seismic catalogs in different areas. This problem may be overcome by applying techniques and parameters not sensitive to variable location errors and completeness magnitudes (Zaliapin & Ben-Zion, ). We return to this issue below. We use the nearest-neighbor approach (Baiesi & Paczuski, 0; Zaliapin et al., 0; Zaliapin & Ben-Zion, a) to partition the earthquakes reported in the NCEDC global catalog into individual clusters. We then compare the worldwide space distribution of various cluster statistics with global heat flow production (Bird et al., 0) and style of lithospheric deformation indicated by an estimated strain rate tensor (Kreemer, 0). Our comparison is based on (i) spatial maps of selected characteristics in seismically active regions and (ii) averaged values of the examined characteristics as a function of the strain rate tensor style S of Eq. () and second invariant I of Eq. (). We demonstrate that multiple statistics of earthquakes and seismicity clusters have spatially-dependent distribution, tightly correlated with the global heat flow production: () Earthquake intensity Λ (Figs. a, b); () Average nearest-neighbor earthquake
29 Page of 0 0 distance η bg within the background mode (Figs., a, a), () Proportion p B of background events (Figs., b, b), () Quality Q of background/cluster mode separation (Figs., Ac, c); () Threshold η 0 that separates the background and cluster modes (Figs., Ab); () Rate of temporal decay of offspring events (Figs., ); () Intensity of repeaters (Fig. ); () Cluster size of intermediate magnitude (m < ) mainshocks (Fig. ); () Proportion p S of singles among regular families (Figs. a, 0a); (0) Proportion p F of foreshocks among foreshocks and aftershocks (Figs. b, 0b); () Average leaf depth corrected for the family size, d N (Figs. c, 0d, a, a); () Average family branching corrected for the family size, B N (Figs. Ae, Ab, b, b); and () Aftershock magnitude gap A (Fig. Ad, 0c). The results are summarized in Table. The cluster structure and statistics estimated by our technique are subject to artifacts related to catalog uncertainties (Zaliapin & Ben-Zion, ). We address potential effects of catalog incompleteness, varying earthquake intensity, and maximal magnitude on each of the examined statistics and design the analysis to minimize the possible artifacts. Notably, some of our observations (e.g., increased size of small clusters in Fig. c and decreased proportion of singles in Figs. a, 0a) demonstrate a trend that goes against possible artifacts of catalog uncertainties. Furthermore, the results of this study are consistent with those of a local analysis of southern California (Zaliapin & Ben-Zion, a,b) obtained with a high quality catalog (median location error of 0m) by Hauksson et al. () and much lower minimal magnitude of analysis, m min =. The combination of our global results and those obtained in the detailed regional study of Zaliapin & Ben-Zion, (a,b) indicate clear dependency of seismic clustering on the heat flow in the region. The results are consistent with those obtained by Yang & Ben-
30 Page of 0 0 Zion (0) and Enescu et al. (0) by different statistical analyses, and with theoretical expectations based on a viscoelastic damage rheology model (Ben-Zion & Lyakhovsky 0). The overall picture emerging from these studies indicate that there exist two primary types of earthquake clustering. (i) Brittle fracture in cold regions results in burst-like clusters characterized by a prominently large mainshock that happens in the very beginning of the sequence and triggers multiple offspring of smaller magnitude occurring in a small number of generations and decaying until merging with the background seismicity. Heterogeneity of stress/strength field (which might create fracture barriers) and generally larger failure threshold in cold regions reduce the triggering potential, which particularly affects small-to-intermediate magnitude events and results in lower overall offspring production, smaller cluster size, and increased proportion of singles. At the same time, large events (m > ) have sufficient potential not only for overcoming the failure threshold but also for significantly disturbing the neighboring stress/strength field and generating long slow decaying aftershock sequences. (ii) Brittle-ductile failure mechanisms in hot regions result in swarm-like clusters that lack a single prominent mainshock. Instead, they gradually develop, event-by-event, by triggering earthquakes of comparable magnitudes. The offspring span generally multiple generations in such clusters, but decay overall much faster creating a notable temporal gap between offspring activity in a fading cluster and future background events. The stress/strength field in hot areas is more homogeneous, and the failure threshold is generally lower than in cold regions, which facilitate triggering potential and allows small-to-medium magnitude
31 Page of 0 0 events to have offspring. This leads to increased size of clusters (for small-tointermediate mainshocks) and decreased proportion of singles. Our findings on preferential occurrence of swarm-like clusters in hot regions, (prominently including the transform areas) and their general statistical properties, are consistent with previous large-scale analyses of oceanic swarms (e.g., McGuire et al., 0; Roland & McGuire, 0). We propose the effective viscosity of the lithosphere to be the main control of the style of earthquake clustering. This is consistent with interpretations that swarms reflect migration of fluids or slow slip events (e.g., Hill, ; Hainzl, 0; Hainzl & Ogata, 0; Vidale & Shearer, 0; Chen et al., ), as increasing heat flow and fluid content will reduce the effective viscosity and lead to brittle-ductile deformation that may include slow slip events. However, the explanations based on fluid flow and slow slip events appeal to specific detailed micro mechanisms involving in general many parameters (and expected to have additional consequences beyond swarm generation). In contrast, the simpler term effective viscosity involves a continuum-based macroscopic description of the behavior in a region (Ben-Zion & Lyakhovsky 0), not committing to any micro mechanism. There is no sharp transition between the clusters of the two primary types, and global seismicity exhibits a wide variety of clustering forms. Nevertheless, the cold and hot environments are clearly distinguishable by the average values of multiple cluster characteristics. Our analysis also suggests that the type and intensity of lithospheric transformation, as measured by the strain rate tensor, play a secondary role in determining the earthquake cluster style. Examining multiple complementary statistics not sensitive to artifacts produced by common catalog deficiencies (Zaliapin & Ben-Zion,
32 Page of 0 0 ) allows us to have confidence that our main findings will remain valid in future analyses with improved catalog quality and alternative cluster identification techniques (e.g., Roland & McGuire, 0; Zhang & Shearer, ). Additional analyses of seismicity accounting for non-universal space-dependent properties, combined with geodetic data on aseismic deformation and modeling, can improve further the understanding of earthquake dynamics and provide refined information for seismic hazard assessments. Acknowledgement We are grateful to Peter Bird for making the heat flow data publicly available. This research was supported by the Southern California Earthquake Center (Contribution No. XXX). SCEC is funded by NSF Cooperative Agreement EAR-0 & USGS Cooperative Agreement GAC0.
33 Page of 0 0 References: Agresti, A. (0) An introduction to categorical data analysis. New York: Wiley, 0pp. Ampuero, J. P., & Ben-Zion, Y. (0). Cracks, pulses and macroscopic asymmetry of dynamic rupture on a bimaterial interface with velocity-weakening friction. Geophys. J. Intl., (), -. Bailey, I. W., Becker, T. W., & Ben-Zion, Y. (0). Patterns of co-seismic strain computed from southern California focal mechanisms. Geophys. J. Intl., (), 0-0. Bailey, I. W., Ben-Zion, Y., Becker, T. W., & Holschneider, M. (0). Quantifying focal mechanism heterogeneity for fault zones in central and southern California. Geophys. J. Intl., (), -. Bak, P., & Tang, C. (). Earthquakes as a self-organized critical phenomenon. J. Geophys. Res, (), -. Båth, M. () Lateral inhomogeneities of the upper mantle. Tectonophysics : -. Baiesi, M. & M. Paczuski (0). Scale-free networks of earthquakes and aftershocks. Phys. Rev. E 00. Ben-Zion, Y. (0). Dynamic ruptures in recent models of earthquake faults. Journal of the Mechanics and Physics of Solids, (), 0-. Ben-Zion, Y. (0). Collective behavior of earthquakes and faults: Continuum-discrete transitions, progressive evolutionary changes, and different dynamic regimes. Reviews of Geophysics, (), RG0, doi:0.0/0rg0000. Ben-Zion, Y., & Lyakhovsky, V. (0). Analysis of aftershocks in a lithospheric model
34 Page of 0 0 with seismogenic zone governed by damage rheology. Geophys. J. Intl., (), -. Bird, P., Z. Liu, and W. K. Rucker (0), Stresses that drive the plates from below: Definitions, computational path, model optimization, and error analysis, J. Geophys. Res.,, B, doi:0.0/0jb000. Chen, X., Shearer, P. M., & Abercrombie, R. E. (). Spatial migration of earthquakes within seismic clusters in Southern California: Evidence for fluid diffusion. J. Geophys. Res.: Solid Earth, (B), B0, doi:0.0/jb00. Corral, A. (0). Long-term clustering, scaling, and universality in the temporal occurrence of earthquakes. Phys. Rev. Lett., (0), 0. Davidsen, J., Gu, C., & Baiesi, M. (). Generalized Omori Utsu law for aftershock sequences in southern California., (), -. Dempster, A. P., Laird, N. M., & Rubin, D. B. (). Maximum likelihood from incomplete data via the EM algorithm. Journal of the royal statistical society. Series B (methodological), -. Enescu, B., Hainzl, S., & Ben-Zion, Y. (0). Correlations of seismicity patterns in Southern California with surface heat flow data. Bull. Seismol. Soc. Am., (), -. Gu, C., Schumann, A. Y., Baiesi, M., & Davidsen, J. (). Triggering cascades and statistical properties of aftershocks. Journal of Geophysical Research: Solid Earth, (), -. Gutenberg, B., & Richter, C. F. (). Frequency of earthquakes in California. Bulletin
35 Page of 0 0 of the Seismological Society of America, (), -. Hainzl, S. (0). Seismicity patterns of earthquake swarms due to fluid intrusion and stress triggering. Geophys. J. Intl., (), Hainzl, S., & Ogata, Y. (0). Detecting fluid signals in seismicity data through statistical earthquake modeling. J. Geophys. Res.: Solid Earth, 0(B), B0S0, doi:0.0/0jb00. Hauksson, E., W. Yang, and P.M. Shearer (). Waveform Relocated Earthquake Catalog for Southern California ( to June ); Bull. Seismol. Soc. Am., 0() -, doi: 0./000. Hicks, A. (). Clustering in multidimensional spaces with applications to statistical analysis of earthquake clustering, MSc Thesis, Department of Mathematics and Statistics, University of Nevada, Reno, August,. Hill, D. P. (). A model for earthquake swarms. J. Geophys. Res., (), -. Kagan, Y. Y. (). Universality of the seismic moment-frequency relation. In Seismicity Patterns, their Statistical Significance and Physical Meaning (pp. - ). Birkhäuser Basel. Keilis-Borok, V. I. (0). The lithosphere of the Earth as a nonlinear system with implications for earthquake prediction. Reviews of Geophysics, (), -. Kreemer, C., Blewitt, G., & Klein, E. C. (). A geodetic plate motion and Global Strain Rate Model. Geochemistry, Geophysics, Geosystems, (0), -. McGuire, J. J., Boettcher, M. S., & Jordan, T. H. (0). Foreshock sequences and shortterm earthquake predictability on East Pacific Rise transform faults. Nature, (0), -.
36 Page of 0 0 NCEDC (), Northern California Earthquake Data Center. UC Berkeley Seismological Laboratory. Dataset. doi:0./ncedc Omori, F., On after-shocks of earthquakes, J. Coll. Sci. Imp. Univ. Tokyo,, -0, b. Powers, P. M., & Jordan, T. H. (0). Distribution of seismicity across strike-slip faults in California. Journal of Geophysical Research: Solid Earth, (B). B0, doi:0.0/0jb00. Reverso, T., Marsan, D., & Helmstetter, A. (). Detection and characterization of transient forcing episodes affecting earthquake activity in the Aleutian Arc system. Earth and Planetary Science Letters,, -. Roland, E., & McGuire, J. J. (0). Earthquake swarms on transform faults. Geophys. J. Intl., (), -0. Rubin, A. M. (0). Aftershocks of microearthquakes as probes of the mechanics of rupture. J. Geophys. Res.: Solid Earth, 0(B), doi:0.0/0jb000. Rubin, A. M., & Gillard, D. (00). Aftershock asymmetry/rupture directivity among central San Andreas fault microearthquakes. J. Geophys. Res.: Solid Earth, 0(B), 0-0. Rundle, J. B., Turcotte, D. L., Shcherbakov, R., Klein, W., & Sammis, C. (0). Statistical physics approach to understanding the multiscale dynamics of earthquake fault systems. Reviews of Geophysics, (). Shcherbakov, R., Turcotte, D.L. (0) A modified form of Bath s law. Bulletin of the Seismological Society of America : -. doi: 0./00 Schoenball, M., N. C. Davatzes, and J. M. G. Glen (), Differentiating induced and
37 Page of 0 0 natural seismicity using space-time-magnitude statistics applied to the Coso Geothermal field, Geophys. Res. Lett.,, doi:0.00/gl0. Sornette, A., & Sornette, D. (). Self-organized criticality and earthquakes. EPL (Europhysics Letters), (),. Turcotte, D. L., & Malamud, B. D. (0). Landslides, forest fires, and earthquakes: examples of self-organized critical behavior. Physica A: Statistical Mechanics and its Applications, 0(), 0-. Utsu, T., Aftershocks and earthquake statistics (II)-Further investigation of aftershocks and other earthquake sequences based on a new classification of earthquake sequences, J. Fac. Sci. Hokkaido Univ., Ser. VII,, -, 0. Utsu, T., Ogata, Y., and Matsuura, R. (). The centenary of the Omori formula for a decay law of aftershock activity. Journal of Physics of the Earth, (), -. Vidale, J. E., & Shearer, P. M. (0). A survey of earthquake bursts across southern California: Exploring the role of pore fluid pressure fluctuations and aseismic slip as drivers. J. Geophys. Res.: Solid Earth, (B). Vidale, J. E., Boyle, K. L., & Shearer, P. M. (0). Crustal earthquake bursts in California and Japan: Their patterns and relation to volcanoes. Geophys. Res. Lett., (). Weertman, J. (0). Unstable slippage across a fault that separates elastic media of different elastic constants. J. Geophys. Res.: Solid Earth, (B), -. Yang, W., & Ben-Zion, Y. (0). Observational analysis of correlations between aftershock productivities and regional conditions in the context of a damage rheology model. Geophys. J. Intl., (), -0.
38 Page of 0 0 Zaliapin, I., A. Gabrielov, V. Keilis-Borok, and H. Wong, H. (0). Clustering analysis of seismicity and aftershock identification. Phys. Rev. Lett. 0 0, doi: 0.0/PhysRevLett.0.0 Zaliapin, I., and Y. Ben-Zion (). Asymmetric distribution of aftershocks on large faults in California. Geophys. J. Int. () -. Zaliapin, I., and Y. Ben-Zion (a). Earthquake clusters in southern California I: Identification and stability. J. Geophys. Res.: Solid Earth () -. Zaliapin, I., and Y. Ben-Zion (b). Earthquake clusters in southern California II: Classification and relation to physical properties of the crust. J. Geophys. Res.: Solid Earth () -. Zaliapin, I. and Y. Ben-Zion (). Artifacts of earthquake location errors and shortterm incompleteness on seismicity clusters in southern California, Geophys. J. Int., doi:0.0/gji/ggv. Zaliapin, I. and Y. Ben-Zion (). Discriminating characteristics of tectonic and human-induced seismicity. Bull. Seism. Soc. Am., in press. Zhang, Q., & Shearer, P. M. (). A new method to identify earthquake swarms applied to seismicity near the San Jacinto Fault, California. Geophys. J. Intl., doi: 0.0/gji/ggw0
39 Page of 0 0 Table : Statistics of singles, mainshocks, aftershocks and foreshocks in the cluster analysis of events with m in the ANSS catalog during - Families Singles Mainshocks Magnitude range Aftershocks Foreshocks (= no. of families) No. % No. % No. % No. % All events: m,.,. 0,0.,.0 m <,.,0.,.,. m <,.,.,.,. m < 0.,0... m < m Table : Statistics of singles, mainshocks, aftershocks and foreshocks in the cluster -analysis of events with m in the ANSS catalog during - Families Singles Mainshocks Magnitude range Aftershocks Foreshocks (= no. of families) No. % No. % No. % No. % All events: m., 0.,., 0. m < ,0.,. m < ,0.. m < 0., 0... m <.... m
40 Page of 0 0 Table : Testing the hypothesis H 0 : Proportion of singles among the clusters is the same in cold and hot regions Cold regions, H < 0. Hot regions, H 0. Fisher Decision Magnitude No. singles/clusters Prop. singles No. singles/clusters Prop. singles test p-value at 0.0 level.0 m <.,0/,0 0.,/, Reject H 0. m <.0,/, 0.,/ Reject H 0.0 m <.,/, 0.,/, Reject H 0
41 Page of 0 0 Table : Summary of examined earthquake and cluster statistics Average value * in Statistic cold regions (H<0.) hot regions (H>0.) Section Figures Earthquake intensity, Λ. 0..,. a, b Background nearest-neighbor distance, log 0 (η bg )..., a, a Proportion of background events, p bg , b, b Quality of mode separation, Q , Ac, c Threshold between background and cluster modes, log0(η 0 )..0., Ab Rate of temporal decay of offspring high low., Intensity of repeaters low high. Cluster size, N (for mainshocks m<)... Proportion of singles, p S a, 0a Proportion of foreshocks, p F b, 0b Aftershock magnitude gap, A c, Ad Size-corrected leaf depth, d N c, 0d, a, a Size-corrected branching, B N b, b, Ae, Ab * The average values are given here to illustrate the trend of changes between cold and hot zones. All reported differences are highly significant according to ANOVA test (not shown). The average differences reported here are typically lower than those observed for individual hot/cold regions in the worldwide maps and maps in the strain rate tensor coordinates (S, I ).
42 Page of 0 0
43 Page of 0 0 Figure : Spatial distribution of selected statistical characteristics of earthquakes with magnitude m according to the global NCEDC catalog during -. A point is included in this graph if the circle of radius 00km centered at the point contains or more earthquakes of magnitude m. Red lines depict major tectonic faults. Shades correspond to bathymetry and topography. Continents are depicted by gray color. (a) Earthquake intensity Λ in events year - 0,000km - (b) Maximal observed magnitude m max. (c) Proportion of events with m.
44

 Seismogenic area A [km ] (the values are reported")
 Seismic intensity Λ [event/year/0,000 km ] (the")
45 Page of 0 0 Figure : Average values of selected statistics as a function of strain rate tensor style S and second invariant I. (a) Seismogenic area A [km ] (the values are reported on a logarithmic scale). (b) Seismic intensity Λ [event/year/0,000 km ] (the values are reported on a logarithmic scale). (c) Heat flow H [W/m ].
 and its normalized space and time components (T, R) of Eq.")
 Earthquakes in regions with low heat flow, H < 0.")
 Join distribution of the rescaled components (T,R) of the")
 Distribution of the values of the nearestneighbor distance η.")
46 Page of 0 0 Figure : Generalized earthquake distance η of Eq. () and its normalized space and time components (T, R) of Eq. () in regions with different level of heat flow H. (a,b) Earthquakes in regions with low heat flow, H < 0.. (c,d) Earthquake in regions with high heat flow, H > 0.. (a,c) Join distribution of the rescaled components (T,R) of the earthquake nearest-neighbor distance. (b,d) Distribution of the values of the nearestneighbor distance η. Black diagonal lines in panels (a,c) depict levels of constant distance η (from top to bottom): -log 0 η =,,,,.


47 Page of 0 0 Figure : Distribution of the rescaled time to parent T of Eq. () for offspring that occurred within two parent rupture distances from the parent. (a) Cold regions, H < 0.. (b) Hot regions, H > 0..


48 Page of 0 0 Figure : Global maps of selected parameters of seismic clustering. (a) Average nearestneighbor distance log 0 η bg in the background mode. (b) Proportion of events in the background mode.
49 Page of 0 0
50 Page of 0 0 Figure : Statistics of background and cluster modes as functions of strain rate tensor s style S and second invariant I. (a) Average nearest-neighbor distance log 0 η bg in the background mode. (b) Proportion of background events p B. (c) Quality Q of background/cluster mode separation.
51 Page of 0 0 Figure : Distribution of cluster size N in regions with high (H > 0., red solid line) and low (H < 0., blue dashed line) values of heat flow. For families, the heat flow value is estimated at the mainshock epicenter. The y-axis shows the survival function S(N) = Prob.[cluster size > N]. The lines that correspond to power laws S(N) N α with indices α = and α = are shown for visual convenience. (a) Regular analysis, all clusters. (b) Delta analysis with =. (c) Regular analysis, clusters with mainshock magnitude m <.
52 Page of 0 0
 Proportion p F of foreshocks among foreshocks and aftershocks.")
53 Page of 0 0 Figure : Global spatial distribution of selected earthquake cluster statistics. (a) Proportion p S of singles among regular clusters. (b) Proportion p F of foreshocks among foreshocks and aftershocks. (c) Average leaf depth corrected for cluster size, d N, for families with size N.
54 Page of 0 0
55 Page of 0 0 Figure 0: Average values of selected cluster statistics as a function of strain rate tensor s style S and second invariant I. (a) Proportion p S of singles among clusters. (b) Proportion p F of foreshocks among foreshocks and aftershocks. (c) Aftershock magnitude gap A. (d) Average leaf depth corrected for cluster size, d N, for families with size N.
56 Page of 0 0 Figure : Average leaf depth d (panel a) and family branching B (panel b) as a function of family size N for regions with high (H> 0., red solid line and circles) and low (H<0., blue dashed line and squares) values of the heat flow H. Notice positive trend in both examined characteristics with family size N.
57 Page of 0 0 Figure : Average leaf depth d N corrected for cluster size (panel a) and family branching B N corrected for cluster size (panel b) as a function of family size N for regions with high (H>0., red solid line and circles) and low (H<0., blue dashed line and squares) values of the heat flow H. Notice the absence of N-dependent trend in both examined characteristics with family size for the intermediate range N.

58 Page of 0 0 Appendix A: Selected characteristics of lithosphere and seismicity Figure A: Global heat flow distribution, after [Bird et al., 0]. The map is clipped at H = 0.W/m, while the maximal reported value if H = 0.W/m.

 Strain rate tensor second invariant I of")
59 Page of 0 0 Figure A: Characteristics of the strain rate tensor [Kreemer et al., ]. (a) Strain rate tensor style S of Eq. (). (b) Strain rate tensor second invariant I of Eq. ().
60 Page of 0 0

61 0 Page 0 of 0 0
 Threshold η 0 that separates the background and cluster modes. (c) Quality Q of separation between the background and cluster modes. (d) Aftershock magnitude gap A.")
62 Page of 0 0 Figure A: Worldwide spatial distributions of selected earthquake and cluster statistics. (a) Average hypocentral depth, z. (b) Threshold η 0 that separates the background and cluster modes. (c) Quality Q of separation between the background and cluster modes. (d) Aftershock magnitude gap A. (e) Average family branching B N corrected for cluster size, for families with size N.

 Average family branching B N corrected for cluster size, for")
63 Page of 0 0 Figure A: Average values of selected cluster statistics as a function of strain rate tensor s style S and second invariant I. (a) Average hypocentral depth, z. (b) Average family branching B N corrected for cluster size, for families with size N.
Geophysical Journal International
 Geophysical Journal International Geophys. J. Int. (2015) 202, 1949 1968 GJI Seismology doi: 10.1093/gji/ggv259 Artefacts of earthquake location errors and short-term incompleteness on seismicity clusters
Earthquake clusters in southern California I: Identification and stability
 JOURNAL OF GEOPHYSICAL RESEARCH: SOLID EARTH, VOL. 118, 2847 2864, doi:10.1002/jgrb.50179, 2013 Earthquake clusters in southern California I: Identification and stability Ilya Zaliapin 1 and Yehuda Ben-Zion
Asymmetric distribution of early aftershocks on large faults in California
 Asymmetric distribution of early aftershocks on large faults in California Ilya Zaliapin 1 and Yehuda Ben-Zion 2 1 Department of Mathematics and Statistics, University of Nevada, Reno, 89557 (zal@unr.edu)
arxiv:physics/ v2 [physics.geo-ph] 18 Aug 2003
![arxiv:physics/ v2 [physics.geo-ph] 18 Aug 2003](/thumbs/90/101580441.jpg "arxiv:physics/ v2 [physics.geo-ph] 18 Aug 2003") Is Earthquake Triggering Driven by Small Earthquakes? arxiv:physics/0210056v2 [physics.geo-ph] 18 Aug 2003 Agnès Helmstetter Laboratoire de Géophysique Interne et Tectonophysique, Observatoire de Grenoble,
Is Earthquake Triggering Driven by Small Earthquakes? arxiv:physics/0210056v2 [physics.geo-ph] 18 Aug 2003 Agnès Helmstetter Laboratoire de Géophysique Interne et Tectonophysique, Observatoire de Grenoble,
Limitations of Earthquake Triggering Models*
 Limitations of Earthquake Triggering Models* Peter Shearer IGPP/SIO/U.C. San Diego September 16, 2009 Earthquake Research Institute * in Southern California Why do earthquakes cluster in time and space?
arxiv:physics/ v1 6 Aug 2006
 The application of the modified form of Båth s law to the North Anatolian Fault Zone arxiv:physics/0608064 v1 6 Aug 2006 1. INTRODUCTION S E Yalcin, M L Kurnaz Department of Physics, Bogazici University,
Simulated and Observed Scaling in Earthquakes Kasey Schultz Physics 219B Final Project December 6, 2013
 Simulated and Observed Scaling in Earthquakes Kasey Schultz Physics 219B Final Project December 6, 2013 Abstract Earthquakes do not fit into the class of models we discussed in Physics 219B. Earthquakes
Earthquakes and Earthquake Hazards Earth - Chapter 11 Stan Hatfield Southwestern Illinois College
 Earthquakes and Earthquake Hazards Earth - Chapter 11 Stan Hatfield Southwestern Illinois College What Is an Earthquake? An earthquake is the vibration of Earth, produced by the rapid release of energy.
UNIVERSITY OF CALGARY. Nontrivial Decay of Aftershock Density With Distance in Southern California. Javad Moradpour Taleshi A THESIS
 UNIVERSITY OF CALGARY Nontrivial Decay of Aftershock Density With Distance in Southern California by Javad Moradpour Taleshi A THESIS SUBMITTED TO THE FACULTY OF GRADUATE STUDIES IN PARTIAL FULFILLMENT
Earthquakes Chapter 19
 Earthquakes Chapter 19 Does not contain complete lecture notes. What is an earthquake An earthquake is the vibration of Earth produced by the rapid release of energy Energy released radiates in all directions
Earthquakes. Building Earth s Surface, Part 2. Science 330 Summer What is an earthquake?
 Earthquakes Building Earth s Surface, Part 2 Science 330 Summer 2005 What is an earthquake? An earthquake is the vibration of Earth produced by the rapid release of energy Energy released radiates in all
Earthquakes Earth, 9th edition, Chapter 11 Key Concepts What is an earthquake? Earthquake focus and epicenter What is an earthquake?
 1 2 3 4 5 6 7 8 9 10 Earthquakes Earth, 9 th edition, Chapter 11 Key Concepts Earthquake basics. "" and locating earthquakes.. Destruction resulting from earthquakes. Predicting earthquakes. Earthquakes
Observational analysis of correlations between aftershock productivities and regional conditions in the context of a damage rheology model
 Geophys. J. Int. (2009) 177, 481 490 doi: 10.1111/j.1365-246X.2009.04145.x FAST TRACK PAPER Observational analysis of correlations between aftershock productivities and regional conditions in the context
A TESTABLE FIVE-YEAR FORECAST OF MODERATE AND LARGE EARTHQUAKES. Yan Y. Kagan 1,David D. Jackson 1, and Yufang Rong 2
 Printed: September 1, 2005 A TESTABLE FIVE-YEAR FORECAST OF MODERATE AND LARGE EARTHQUAKES IN SOUTHERN CALIFORNIA BASED ON SMOOTHED SEISMICITY Yan Y. Kagan 1,David D. Jackson 1, and Yufang Rong 2 1 Department
Appendix O: Gridded Seismicity Sources
 Appendix O: Gridded Seismicity Sources Peter M. Powers U.S. Geological Survey Introduction The Uniform California Earthquake Rupture Forecast, Version 3 (UCERF3) is a forecast of earthquakes that fall
Physics and Chemistry of the Earth and Terrestrial Planets
 MIT OpenCourseWare http://ocw.mit.edu 12.002 Physics and Chemistry of the Earth and Terrestrial Planets Fall 2008 For information about citing these materials or our Terms of Use, visit: http://ocw.mit.edu/terms.
CHAPTER 1 BASIC SEISMOLOGY AND EARTHQUAKE TERMINOLGY. Earth Formation Plate Tectonics Sources of Earthquakes...
 CHAPTER 1 BASIC SEISMOLOGY AND EARTHQUAKE TERMINOLGY Earth Formation... 1-2 Plate Tectonics... 1-2 Sources of Earthquakes... 1-3 Earth Faults... 1-4 Fault Creep... 1-5 California Faults... 1-6 Earthquake
A GLOBAL MODEL FOR AFTERSHOCK BEHAVIOUR
 A GLOBAL MODEL FOR AFTERSHOCK BEHAVIOUR Annemarie CHRISTOPHERSEN 1 And Euan G C SMITH 2 SUMMARY This paper considers the distribution of aftershocks in space, abundance, magnitude and time. Investigations
Space-time clustering of seismicity in California and the distance dependence of earthquake triggering
 JOURNAL OF GEOPHYSICAL RESEARCH, VOL. 117,, doi:10.1029/2012jb009471, 2012 Space-time clustering of seismicity in California and the distance dependence of earthquake triggering P. M. Shearer 1 Received
The Role of Asperities in Aftershocks
 The Role of Asperities in Aftershocks James B. Silva Boston University April 7, 2016 Collaborators: William Klein, Harvey Gould Kang Liu, Nick Lubbers, Rashi Verma, Tyler Xuan Gu OUTLINE Introduction The
Aftershock From Wikipedia, the free encyclopedia
 Page 1 of 5 Aftershock From Wikipedia, the free encyclopedia An aftershock is a smaller earthquake that occurs after a previous large earthquake, in the same area of the main shock. If an aftershock is
Earthquakes. Earthquake Magnitudes 10/1/2013. Environmental Geology Chapter 8 Earthquakes and Related Phenomena
 Environmental Geology Chapter 8 Earthquakes and Related Phenomena Fall 2013 Northridge 1994 Kobe 1995 Mexico City 1985 China 2008 Earthquakes Earthquake Magnitudes Earthquake Magnitudes Richter Magnitude
Rotation of the Principal Stress Directions Due to Earthquake Faulting and Its Seismological Implications
 Bulletin of the Seismological Society of America, Vol. 85, No. 5, pp. 1513-1517, October 1995 Rotation of the Principal Stress Directions Due to Earthquake Faulting and Its Seismological Implications by
Section Forces Within Earth. 8 th Grade Earth & Space Science - Class Notes
 Section 19.1 - Forces Within Earth 8 th Grade Earth & Space Science - Class Notes Stress and Strain Stress - is the total force acting on crustal rocks per unit of area (cause) Strain deformation of materials
UNIT - 7 EARTHQUAKES
 UNIT - 7 EARTHQUAKES WHAT IS AN EARTHQUAKE An earthquake is a sudden motion or trembling of the Earth caused by the abrupt release of energy that is stored in rocks. Modern geologists know that most earthquakes
Mechanical origin of aftershocks: Supplementary Information
 Mechanical origin of aftershocks: Supplementary Information E. Lippiello Department of Mathematics and Physics, Second University of Naples, Via Vivaldi 43, 81100 Caserta, Italy & Kavli Institute for Theoretical
RELOCATION OF THE MACHAZE AND LACERDA EARTHQUAKES IN MOZAMBIQUE AND THE RUPTURE PROCESS OF THE 2006 Mw7.0 MACHAZE EARTHQUAKE
 RELOCATION OF THE MACHAZE AND LACERDA EARTHQUAKES IN MOZAMBIQUE AND THE RUPTURE PROCESS OF THE 2006 Mw7.0 MACHAZE EARTHQUAKE Paulino C. FEITIO* Supervisors: Nobuo HURUKAWA** MEE07165 Toshiaki YOKOI** ABSTRACT
Gutenberg-Richter Relationship: Magnitude vs. frequency of occurrence
 Quakes per year. Major = 7-7.9; Great = 8 or larger. Year Major quakes Great quakes 1969 15 1 1970 20 0 1971 19 1 1972 15 0 1973 13 0 1974 14 0 1975 14 1 1976 15 2 1977 11 2 1978 16 1 1979 13 0 1980 13
The Earthquake Cycle Chapter :: n/a
 The Earthquake Cycle Chapter :: n/a A German seismogram of the 1906 SF EQ Image courtesy of San Francisco Public Library Stages of the Earthquake Cycle The Earthquake cycle is split into several distinct
Short-Term Earthquake Forecasting Using Early Aftershock Statistics
 Bulletin of the Seismological Society of America, Vol. 101, No. 1, pp. 297 312, February 2011, doi: 10.1785/0120100119 Short-Term Earthquake Forecasting Using Early Aftershock Statistics by Peter Shebalin,
Earthquake. What is it? Can we predict it?
 Earthquake What is it? Can we predict it? What is an earthquake? Earthquake is the vibration (shaking) and/or displacement of the ground produced by the sudden release of energy. Rocks under stress accumulate
Theory of earthquake recurrence times
 Theory of earthquake recurrence times Alex SAICHEV1,2 and Didier SORNETTE1,3 1ETH Zurich, Switzerland 2Mathematical Department, Nizhny Novgorod State University, Russia. 3Institute of Geophysics and Planetary
Does Aftershock Duration Scale With Mainshock Size?
 GEOPHYSICAL RESEARCH LETTERS, VOL.???, NO., PAGES 1 16, Does Aftershock Duration Scale With Mainshock Size? A. Ziv A. Ziv, Ben-Gurion University of the Negev, Beer-Sheva, 84105, Israel. (e-mail: zival@bgu.ac.il)
On May 4, 2001, central Arkansas experienced an M=4.4 earthquake followed by a
 1. Introduction On May 4, 2001, central Arkansas experienced an M=4.4 earthquake followed by a surprisingly large number of small earthquakes. We recorded about 2500 above the ambient noise level on a
UGRC 144 Science and Technology in Our Lives/Geohazards
 UGRC 144 Science and Technology in Our Lives/Geohazards Session 3 Understanding Earthquakes and Earthquake Hazards Lecturer: Dr. Patrick Asamoah Sakyi Department of Earth Science, UG Contact Information:
Gravity Tectonics Volcanism Atmosphere Water Winds Chemistry. Planetary Surfaces
 Gravity Tectonics Volcanism Atmosphere Water Winds Chemistry Planetary Surfaces Gravity & Rotation Polar flattening caused by rotation is the largest deviation from a sphere for a planet sized object (as
Science Starter. Describe in your own words what an Earthquake is and what causes it. Answer The MSL
 Science Starter Describe in your own words what an Earthquake is and what causes it. Answer The MSL WHAT IS AN EARTHQUAKE AND HOW DO WE MEASURE THEM? Chapter 8, Section 8.1 & 8.2 Looking Back Deserts Wind-shaped
Kinematics of the Southern California Fault System Constrained by GPS Measurements
 Title Page Kinematics of the Southern California Fault System Constrained by GPS Measurements Brendan Meade and Bradford Hager Three basic questions Large historical earthquakes One basic question How
Southern California ground motion envelopes over ranges of magnitudes, distances, and site conditions
 55 Chapter 3 Average properties of Southern California ground motion envelopes over ranges of magnitudes, distances, and site conditions In this chapter, I use the envelope attenuation relationships derived
Section 19.1: Forces Within Earth Section 19.2: Seismic Waves and Earth s Interior Section 19.3: Measuring and Locating.
 CH Earthquakes Section 19.1: Forces Within Earth Section 19.2: Seismic Waves and Earth s Interior Section 19.3: Measuring and Locating Earthquakes Section 19.4: Earthquakes and Society Section 19.1 Forces
Adaptive Kernel Estimation and Continuous Probability Representation of Historical Earthquake Catalogs
 Bulletin of the Seismological Society of America, Vol. 92, No. 3, pp. 904 912, April 2002 Adaptive Kernel Estimation and Continuous Probability Representation of Historical Earthquake Catalogs by Christian
MAR110 Lecture #5 Plate Tectonics-Earthquakes
 1 MAR110 Lecture #5 Plate Tectonics-Earthquakes Figure 5.0 Plate Formation & Subduction Destruction The formation of the ocean crust from magma that is upwelled into a pair of spreading centers. Pairs
Short-Term Properties of Earthquake Catalogs and Models of Earthquake Source
 Bulletin of the Seismological Society of America, Vol. 94, No. 4, pp. 1207 1228, August 2004 Short-Term Properties of Earthquake Catalogs and Models of Earthquake Source by Yan Y. Kagan Abstract I review
Introduction The major accomplishment of this project is the development of a new method to identify earthquake sequences. This method differs from
 28 June 212 Final Report on Project 8/TVH564: Physical and statistical models for the seismological properties and a temporal evolution of earthquake sequences (swarms) in the Central Volcanic Region,
Accuracy of modern global earthquake catalogs
 Physics of the Earth and Planetary Interiors 135 (2003) 173 209 Accuracy of modern global earthquake catalogs Yan Y. Kagan Department of Earth and Space Sciences, University of California, Los Angeles,
Aspects of risk assessment in power-law distributed natural hazards
 Natural Hazards and Earth System Sciences (2004) 4: 309 313 SRef-ID: 1684-9981/nhess/2004-4-309 European Geosciences Union 2004 Natural Hazards and Earth System Sciences Aspects of risk assessment in power-law
Geophysical Journal International
 Geophysical Journal International Geophys. J. Int. (21) 183, 433 45 doi: 1.1111/j.1365-246X.21.4745.x Quantifying focal mechanism heterogeneity for fault zones in central and southern California Iain W.
What We Know (and don t know)
") What We Know (and don t know) about the M5.1 La Habra Earthquake Dr. Robert Graves U.S. Geological Survey In collaboration with: Dr. Egill Hauksson and Dr. Thomas Göbel Caltech Dr. Elizabeth Cochran U.S.
What We Know (and don t know) about the M5.1 La Habra Earthquake Dr. Robert Graves U.S. Geological Survey In collaboration with: Dr. Egill Hauksson and Dr. Thomas Göbel Caltech Dr. Elizabeth Cochran U.S.
Sendai Earthquake NE Japan March 11, Some explanatory slides Bob Stern, Dave Scholl, others updated March
 Sendai Earthquake NE Japan March 11, 2011 Some explanatory slides Bob Stern, Dave Scholl, others updated March 14 2011 Earth has 11 large plates and many more smaller ones. Plates are 100-200 km thick
Comparison of Short-Term and Time-Independent Earthquake Forecast Models for Southern California
 Bulletin of the Seismological Society of America, Vol. 96, No. 1, pp. 90 106, February 2006, doi: 10.1785/0120050067 Comparison of Short-Term and Time-Independent Earthquake Forecast Models for Southern
Small-world structure of earthquake network
 Small-world structure of earthquake network Sumiyoshi Abe 1 and Norikazu Suzuki 2 1 Institute of Physics, University of Tsukuba, Ibaraki 305-8571, Japan 2 College of Science and Technology, Nihon University,
Seismic moment distribution revisited: II. Moment conservation principle
 Geophys. J. Int. (2002) 149, 731 754 Seismic moment distribution revisited: II. Moment conservation principle Yan Y. Kagan Department of Earth and Space Sciences, University of California, Los Angeles,
Rheology III. Ideal materials Laboratory tests Power-law creep The strength of the lithosphere The role of micromechanical defects in power-law creep
 Rheology III Ideal materials Laboratory tests Power-law creep The strength of the lithosphere The role of micromechanical defects in power-law creep Ideal materials fall into one of the following categories:
Seismic Activity near the Sunda and Andaman Trenches in the Sumatra Subduction Zone
 IJMS 2017 vol. 4 (2): 49-54 International Journal of Multidisciplinary Studies (IJMS) Volume 4, Issue 2, 2017 DOI: http://doi.org/10.4038/ijms.v4i2.22 Seismic Activity near the Sunda and Andaman Trenches
SUPPLEMENTARY INFORMATION
 SUPPLEMENTARY INFORMATION DOI: 1.138/NGEO177 The Long Precursory Phase of Most Large Interplate Earthquakes Supplementary Information Supplementary Methods 1. Data and Classification We select the earthquakes
Earthquakes.
 Earthquakes http://quake.usgs.gov/recenteqs/latestfault.htm An earthquake is a sudden motion or shaking of the Earth's crust, caused by the abrupt release of stored energy in the rocks beneath the surface.
Earthquakes and How to Measure Them
 Earthquakes and How to Measure Them Earth Systems Georgia Performance Standards: SES2c. Relate certain geologic hazards to plate tectonic settings. Created by: Christy Dion Paulding County High School
Anomalous early aftershock decay rate of the 2004 Mw6.0 Parkfield, California, earthquake
 GEOPHYSICAL RESEARCH LETTERS, VOL. 33,, doi:10.1029/2006gl026744, 2006 Anomalous early aftershock decay rate of the 2004 Mw6.0 Parkfield, California, earthquake Zhigang Peng, 1,2 John E. Vidale, 1 and
Earthquakes and Earth s Interior
 - What are Earthquakes? Earthquakes and Earth s Interior - The shaking or trembling caused by the sudden release of energy - Usually associated with faulting or breaking of rocks - Continuing adjustment
Geo736: Seismicity along mid-ocean ridges
 Geo736: Seismicity along mid-ocean ridges Course Notes: S. G. Wesnousky Spring 2018 Bathymetric maps show the ocean basins of the world are characteristically divided by a bathymetric ridge. The bathymetric
Earthquakes and How to Measure Them
 Earthquakes and How to Measure Them Earth Systems Georgia Performance Standards: SES2c. Relate certain geologic hazards to plate tectonic settings. Created by: Christy Dion Paulding County High School
Earth and Space Science Semester 2 Exam Review. Part 1. - Convection currents circulate in the Asthenosphere located in the Upper Mantle.
 Earth and Space Science 2015 Semester 2 Exam Review Part 1 Convection -A form of heat transfer. - Convection currents circulate in the Asthenosphere located in the Upper Mantle. - Source of heat is from
Earthquakes. Forces Within Eartth. Faults form when the forces acting on rock exceed the rock s strength.
 Earthquakes Vocabulary: Stress Strain Elastic Deformation Plastic Deformation Fault Seismic Wave Primary Wave Secondary Wave Focus Epicenter Define stress and strain as they apply to rocks. Distinguish
Prentice Hall EARTH SCIENCE
 Prentice Hall EARTH SCIENCE Tarbuck Lutgens Chapter 8 Earthquakes and Earth s Interior 8.1 What Is an Earthquake? Earthquakes An earthquake is the vibration of Earth produced by the rapid release of energy
Earthquakes. Pt Reyes Station 1906
 Earthquakes Pt Reyes Station 1906 Earthquakes Ground shaking caused by the sudden release of accumulated strain by an abrupt shift of rock along a fracture in the earth. You Live in Earthquake Country
I. Locations of Earthquakes. Announcements. Earthquakes Ch. 5. video Northridge, California earthquake, lecture on Chapter 5 Earthquakes!
 51-100-21 Environmental Geology Summer 2006 Tuesday & Thursday 6-9:20 p.m. Dr. Beyer Earthquakes Ch. 5 I. Locations of Earthquakes II. Earthquake Processes III. Effects of Earthquakes IV. Earthquake Risk
Crustal Deformation. Earth Systems 3209
 Crustal Deformation Earth Systems 3209 Crustal Deformation pg. 415 Refers to all changes in the original form and/or size of a rock body. May also produce changes in the location and orientation of rocks.
High-resolution Time-independent Grid-based Forecast for M >= 5 Earthquakes in California
 High-resolution Time-independent Grid-based Forecast for M >= 5 Earthquakes in California A. Helmstetter, Yan Kagan, David Jackson To cite this version: A. Helmstetter, Yan Kagan, David Jackson. High-resolution
Scale-free network of earthquakes
 Scale-free network of earthquakes Sumiyoshi Abe 1 and Norikazu Suzuki 2 1 Institute of Physics, University of Tsukuba, Ibaraki 305-8571, Japan 2 College of Science and Technology, Nihon University, Chiba
What allows seismic events to grow big?: Insights from fault roughness and b-value analysis in stick-slip experiments
 What allows seismic events to grow big?: Insights from fault roughness and b-value analysis in stick-slip experiments T. H. W. Goebel 1, G. Kwiatek 2, T. W. Becker 3, G. Dresen 2, E.E. Brodsky 1 1 UC Santa
Distribution of volcanic earthquake recurrence intervals
 JOURNAL OF GEOPHYSICAL RESEARCH, VOL. 114,, doi:10.1029/2008jb005942, 2009 Distribution of volcanic earthquake recurrence intervals M. Bottiglieri, 1 C. Godano, 1 and L. D Auria 2 Received 21 July 2008;
INTRODUCTION TO EARTHQUAKES
 INTRODUCTION TO EARTHQUAKES Seismology = Study of earthquakes Seismologists = Scientists who study earthquakes Earthquake = Trembling or shaking of the earth s surface, usually as a result of the movement
Earthquakes How and Where Earthquakes Occur
 Earthquakes How and Where Earthquakes Occur PPT Modified from Troy HS Is there such thing as earthquake weather? Absolutely NOT!!! Geologists believe that there is no connection between weather and earthquakes.
Southern California Earthquake Center Collaboratory for the Study of Earthquake Predictability (CSEP) Thomas H. Jordan
 Thomas H. Jordan") Southern California Earthquake Center Collaboratory for the Study of Earthquake Predictability (CSEP) Thomas H. Jordan SCEC Director & Professor, University of Southern California 5th Joint Meeting of
Southern California Earthquake Center Collaboratory for the Study of Earthquake Predictability (CSEP) Thomas H. Jordan SCEC Director & Professor, University of Southern California 5th Joint Meeting of
Earthquakes. Chapter Test A. Multiple Choice. Write the letter of the correct answer on the line at the left.
 Earthquakes Chapter Test A Multiple Choice Write the letter of the correct answer on the line at the left. 1. Stress that pushes a mass of rock in two opposite directions is called a. shearing. b. tension.
Effect of an outer-rise earthquake on seismic cycle of large interplate earthquakes estimated from an instability model based on friction mechanics
 Effect of an outer-rise earthquake on seismic cycle of large interplate earthquakes estimated from an instability model based on friction mechanics Naoyuki Kato (1) and Tomowo Hirasawa (2) (1) Geological
Lab 6: Earthquake Focal Mechanisms (35 points)
") Lab 6: Earthquake Focal Mechanisms (35 points) Group Exercise 1. Drawing Nodal Planes (8 pts) The outline map below labeled Figure 4.60a shows the positions of two earthquakes recorded on the Mid-Atlantic
Lab 6: Earthquake Focal Mechanisms (35 points) Group Exercise 1. Drawing Nodal Planes (8 pts) The outline map below labeled Figure 4.60a shows the positions of two earthquakes recorded on the Mid-Atlantic
Aspects of the Seismic Response to Shaft Pillar Mining - Case Studies in the Welkom Gold Field
 Aspects of the Seismic Response to Shaft Pillar Mining - Case Studies in the Welkom Gold Field DR G VAN ASWEGEN Welkom Gold Mine INTRODUCTION Several shaft pillars have lately been mined out in the Welkom
An entire branch of Earth science, called, is devoted to the study of earthquakes.
 Lesson One Essential Question Where do earthquakes take place? What causes earthquakes? What are three different types of faults that occur at plate boundaries? How does energy from earthquakes travels
of other regional earthquakes (e.g. Zoback and Zoback, 1980). I also want to find out
. I also want to find out") 4. Focal Mechanism Solutions A way to investigate source properties of the 2001 sequence is to attempt finding well-constrained focal mechanism solutions to determine if they are consistent with those
4. Focal Mechanism Solutions A way to investigate source properties of the 2001 sequence is to attempt finding well-constrained focal mechanism solutions to determine if they are consistent with those
Supplementary Materials for
 advances.sciencemag.org/cgi/content/full/4/3/eaao4915/dc1 Supplementary Materials for Global variations of large megathrust earthquake rupture characteristics This PDF file includes: Lingling Ye, Hiroo
San Andreas Movie Can It Happen?
 San Andreas Movie Can It Happen? Learning Objectives (LO) Lecture 14: Faults and Quakes Read: Chapter 10 and 11 Homework #12 due Thursday 12pm What we ll learn today:! 1. Compare strike-slip to dip-slip
The Mechanics of Earthquakes and Faulting
 The Mechanics of Earthquakes and Faulting Christopher H. Scholz Lamont-Doherty Geological Observatory and Department of Earth and Environmental Sciences, Columbia University 2nd edition CAMBRIDGE UNIVERSITY
Accelerating energy release prior to large events in simulated earthquake cycles: implications for earthquake forecasting
 Accelerating energy release prior to large events in simulated earthquake cycles: implications for earthquake forecasting Peter Mora and David Place QUAKES, Department of Earth Sciences, The University
PostScript file created: June 11, 2011; time 985 minutes RANDOM STRESS AND OMORI S LAW. Yan Y. Kagan
 PostScript file created: June 11, 2011; time 985 minutes RANDOM STRESS AND OMORI S LAW Yan Y. Kagan Department of Earth and Space Sciences, University of California, Los Angeles, California 90095-1567,
Earth as a planet: Interior and Surface layers
 Earth as a planet: Interior and Surface layers Bibliographic material: Langmuir & Broecker (2012) How to build a habitable planet Internal structure of the Earth: Observational techniques Seismology Analysis
GEOLOGY MEDIA SUITE Chapter 13
 UNDERSTANDING EARTH, SIXTH EDITION GROTZINGER JORDAN GEOLOGY MEDIA SUITE Chapter 13 Earthquakes 2010 W.H. Freeman and Company Three different types of seismic waves are recorded by seismographs Key Figure
Uncertainties in a probabilistic model for seismic hazard analysis in Japan
 Uncertainties in a probabilistic model for seismic hazard analysis in Japan T. Annaka* and H. Yashiro* * Tokyo Electric Power Services Co., Ltd., Japan ** The Tokio Marine and Fire Insurance Co., Ltd.,
UCERF3 Task R2- Evaluate Magnitude-Scaling Relationships and Depth of Rupture: Proposed Solutions
 UCERF3 Task R2- Evaluate Magnitude-Scaling Relationships and Depth of Rupture: Proposed Solutions Bruce E. Shaw Lamont Doherty Earth Observatory, Columbia University Statement of the Problem In UCERF2
Exploring aftershock properties with depth
 Exploring aftershock properties with depth Peter Shebalin 1,2, Clément Narteau 2, Matthias Holschneider 3 1 International Institute of Earthquake Prediction Theory and Mathematical Geophysics, Moscow,
Internal Layers of the Earth
 Lecture #4 notes Geology 3950, Spring 2006; CR Stern Seismic waves, earthquake magnitudes and location, and internal earth structure (pages 28-95 in the 4 th edition and 28-32 and 50-106 in the 5 th edition)
20.1 Earthquakes. Chapter 20 EARTHQUAKES AND VOLCANOES. Earthquakes and plate boundaries 500 UNIT 6 EARTH S STRUCTURE
 Chapter 20 EARTHQUAKES AND VOLCANOES 20.1 Earthquakes In Chapter 19, you read about the San Andreas Fault, which lies along the California coast (Figure 20.1). This fault passes right through San Francisco
Multifractal Analysis of Seismicity of Kutch Region (Gujarat)
") P-382 Multifractal Analysis of Seismicity of Kutch Region (Gujarat) Priyanka Midha *, IIT Roorkee Summary The geographical distribution of past earthquakes is not uniform over the globe. Also, in one region
P-382 Multifractal Analysis of Seismicity of Kutch Region (Gujarat) Priyanka Midha *, IIT Roorkee Summary The geographical distribution of past earthquakes is not uniform over the globe. Also, in one region
Earthquakes and Earth s Chapter. Interior
 Earthquakes and Earth s Chapter Interior 8.1 What Is an Earthquake? An earthquake is the vibration of Earth produced by the rapid release of energy Focus and Epicenter Focus is the point within Earth
5. What is an earthquake 6. Indicate the approximate radius of the earth, inner core, and outer core.
 Tutorial Problems 1. Where Do Earthquakes Happen? 2. Where do over 90% of earthquakes occur? 3. Why Do Earthquakes Happen? 4. What are the formulae for P and S velocity 5. What is an earthquake 6. Indicate
Part 2 - Engineering Characterization of Earthquakes and Seismic Hazard. Earthquake Environment
 Part 2 - Engineering Characterization of Earthquakes and Seismic Hazard Ultimately what we want is a seismic intensity measure that will allow us to quantify effect of an earthquake on a structure. S a
to: Interseismic strain accumulation and the earthquake potential on the southern San
 Supplementary material to: Interseismic strain accumulation and the earthquake potential on the southern San Andreas fault system by Yuri Fialko Methods The San Bernardino-Coachella Valley segment of the
A magnitude 7.8 earthquake has occurred km (63.3 mi) ESE of Suva, Fiji at a depth of km (378 miles).
 ESE of Suva, Fiji at a depth of km (378 miles).") A magnitude 7.8 earthquake has occurred 101.8 km (63.3 mi) ESE of Suva, Fiji at a depth of 608.6 km (378 miles). There is no risk of a tsunami from an earthquake at this depth. Images courtesy of Google
A magnitude 7.8 earthquake has occurred 101.8 km (63.3 mi) ESE of Suva, Fiji at a depth of 608.6 km (378 miles). There is no risk of a tsunami from an earthquake at this depth. Images courtesy of Google
Magnitude 8.3 SEA OF OKHOTSK
 A powerful earthquake in Russia's Far East was felt as far away as Moscow, about 7,000 kilometers (4,400 miles) west of the epicenter, but no casualties or damage were reported. The epicenter was in the
EARTHQUAKES. Similar to sound, seismic waves can be generated by natural and artificial movements.
 EARTHQUAKES In general terms, an earthquake occurs usually when mechanical energy transmitted from the earth s core by the mantle is released and it reaches the solid cold crust, and tends to propagate