HYDRAULIC FRACTURE EXPERIMENTS IN A FRICTIONAL MATERIAL AND APPROXIMATIONS FOR MAXIMUM ALLOWABLE MUD PRESSURE
|
|
|
- Rolf Warner
- 6 years ago
- Views:
Transcription
1 HYDRAULIC FRACTURE EXPERIMENTS IN A FRICTIONAL MATERIAL AND APPROXIMATIONS FOR MAXIMUM ALLOWABLE MUD PRESSURE by David E. Y. Elwood A thesis submitted to the Department of Civil Engineering In conformity with the requirements for the degree of Master of Science (Engineering) Queen s University Kingston, Ontario, Canada (July, 2008) Copyright David E. Y. Elwood, 2008
2 Abstract Directional drilling has become a popular construction method used by municipalities, contractors and engineers alike for the construction of new subsurface pipelines while minimizing impact on the surrounding community. Pressurized drilling fluid is used during the advancement of the borehole through granular materials to maintain borehole stability throughout the drill path. It is believed that failure of the soil surrounding the borehole is controlled by the shear strength of this frictional ground and this influences the maximum allowable mud pressure that may be applied to the borehole. While there have been a number of theoretical studies, there have been few if any experimental investigations to examine the efficacy of the proposed design equations. The basis of this research considers a horizontal directionally drilled borehole and compares the analytical findings with those obtained from a series of smaller and larger-scale laboratory experiments for a uniformly graded sand and layered sand - sand and gravel case. The analytical solutions are considered reasonable for hydrofracture during pullback, but may not be directly applicable to blowout during pilot borehole drilling such as the model researched in the experiments. During the experiments the downhole mud pressures were continuously monitored and observations of composite drilling fluid and sand material were made. Smaller-scale experiments were carried out to determine the response of the horizontal stresses resulting from internal pressurization acting on the sidewalls of the test cell. During the larger-scale experiments, the surface displacements were measured to better understand the influence of an increase in the soil volume with surface displacement. ii
3 Through the course of the research, physical information has been collected regarding the changes that a clean sand undergoes when in contact with a drilling fluid, the ability of a borehole to resist internal loading, and the effectiveness of the various analytical models currently used to estimate the peak allowable internal fluid pressures. In addition, physical data has been collected regarding the displacement of a surrounding material during the introduction of drilling fluid into a horizontally drilled borehole iii
4 Acknowledgements First and foremost, I would like to thank my wife Barb for her support, care and most importantly patience throughout this whole process. I also have to extend my thanks to her for the endless hours proofreading this paper and for providing her input. Next, I would like to express my sincere gratitude and appreciation to my supervisor, I.D. Moore, and A. Take for their guidance, encouragement and input throughout the duration of this research project. I also would like to thank all of the technical staff for their tireless input regarding the development, instrumentation and implementation of these experiments. I would also like to extend my warmest thanks and gratitude to Hongwei Xia for his endless help throwing a shovel at all hours of the day during the course of the experiments and for his uncanny ability to spot errors in AFENA code. Finally, I would like to thank my family and friends, for their patience and encouragement during this process especially Alan Smithee for his direction and guidance and also to all of my coworkers who unwearyingly allowed me to come and go on short notice. iv
5 Table of Contents Abstract...ii Acknowledgements...iv Table of Contents...v List of Figures...ix List of Tables...xiii CHAPTER 1 INTRODUCTION INTRODUCTION HDD INSTALLATION METHODS LITERATURE REVIEW RESEARCH OBJECTIVES LABORATORY EXPERIMENTS PROPOSED LABORATORY INVESTIGATION FILTERCAKE INVESTIGATION LATERAL EARTH PRESSURE INVESTIGATION SURFACE DISPLACEMENT MONITORING LAYERED MATERIALS CONCLUSIONS...12 REFERENCES CHAPTER 2 LITERATURE REVIEW INTRODUCTION BACKGROUND CURRENT ESTIMATION PRACTICES DELFT EQUATION...23 v
6 2.5 CARTER, BOOKER AND YEUNG SOLUTION FOR CYLINDRICAL CAVITY EXPANSION YU AND HOULSBY SOLUTION FOR CYLINDRICAL CAVITY EXPANSION CONCLUSIONS...32 REFERENCES CHAPTER 3 NUMERICAL ANALYSIS INTRODUCTION NUMERICAL MODEL SOIL PROPERTIES AFENA METHODOLOGY RESULTS SINGLE LAYER VARIABLE FILTERCAKE THICKNESS NUMERICAL MODEL OF LARGE SCALE EXPERIMENTS CONCLUSIONS...53 REFERENCES CHAPTER 4 SMALLER-SCALE EXPERIMENTS INTRODUCTION TEST APPARATUS BIAXIAL CELL FRAME COHESIONLESS TEST MATERIAL HYDROSAND APPLICATION OF SIMULATED OVERBURDEN PRESSURE BOREHOLE EXCAVATION EXTENSION OF THE TEST CELL...72 vi
7 4.2.6 DOWNHOLE PRESSURE TRANSDUCER MEASUREMENT OF LATERAL EARTH PRESSURE SURFACE HEAVE MONITORING PACKER AND DISPLACEMENT PUMP DRILL FLUID EXPERIMENTAL RESULTS INTRODUCTION MUD PRESSURE TIME HISTORIES PEAK FLUID PRESSURE AS A FUNCTION OF OVERBURDEN PRESSURE HORIZONTAL EARTH PRESSURE MONITORING CONCLUSIONS REFERENCES CHAPTER 5 LARGER-SCALE HYDROFRACTURE TESTS LARGER-SCALE EXPERIMENTS INTRODUCTION LARGER-SCALE EXPERIMENT OBJECTIVES LARGER-SCALE EXPERIMENTAL APPARATUS AND TESTING REGIME EXPERIMENTAL METHODOLOGY TEST PIT PREPARATION SURFACE DISPLACEMENT MONITORING DATA ACQUISITION SYSTEM EXPERIMENTAL RESULTS INTERNAL FLUID PRESSURES - SAND INTERNAL FLUID PRESSURES - LAYERED MATERIALS vii
8 5.3.3 SURFACE DISPLACEMENT CONCLUSIONS REFERENCES CHAPTER 6 SUMMARY, CONCLUSIONS AND RECOMMENDATIONS FOR FUTURE RESEARCH INTRODUCTION NUMERICAL MODELLING DOWNHOLE PRESSURES FILTERCAKE FORMATION AND CHARACTERISTICS GROUND DISPLACEMENTS RECOMMENDATIONS FOR FUTURE RESEARCH REFERENCES APPENDIX A UNSUCCESSFUL SMALL SCALE EXPERIMENTS viii
9 List of Figures Chapter 2 Figure 2.1 Various cutting tools used in HDD projects...18 Figure 2.2 Illustration of the various theories of cavity expansion...28 Chapter 3 Figure 3.1 Figure 3.2 Normalized plastic radius vs normalized internal mud pressure...44 Layered mesh used during laboratory experiment numerical analyses...48 Figure 3.3 Plastic radius at 20 kpa...50 Figure 3.4 Plastic radius at 40 kpa...50 Figure 3.5 Plastic radius at 60 kpa...50 Figure 3.6 Plastic radius at 80 kpa...50 Figure 3.7 Plastic radius at 95 kpa...51 Figure 3.8 Plastic radius at 25 kpa...52 Figure 3.9 Plastic radius at 50 kpa...52 Figure 3.10 Plastic radius at 75 kpa...52 Figure 3.11 Plastic radius at 100 kpa...52 Figure 3.12 Plastic radius at 130 kpa...53 ix
10 Chapter 4 Figure 4.1 Schematic of the biaxial cell construction...61 Figure 4.2 Figure 4.3 Figure 4.4 Test apparatus configuration...62 Grain size distributions of test soil and filtercake...64 Hand tamper for manual compaction...69 Figure 4.5 Configuration of the test cell extension...73 Figure 4.6 Downhole resistance pressure transducer...75 Figure 4.7 Figure 4.8 Figure 4.9 Figure 4.10 Larger-diameter horizontal pressure transducer...78 Smaller-diameter horizontal pressure transducer...79 Displacement pump and gas engine...81 Traces of applied mud pressure with respect to time for different values of overburden pressure...86 Figure 4.11 Peak internal fluid pressures as a function of overburden pressure...87 Figure 4.12 Comparison traces of smaller-scale experiments carried out at similar overburden pressures...91 Figure 4.13 Sketch of typical transverse crack...93 Figure 4.14 Typical transverse crack across test cell...94 Figure 4.15 Transverse crack near the crown of the borehole (approximately 250 mm depth) 94 Figure 4.16 Sketch of typical flow tube (not to scale or actual crack location)...96 Figure 4.17 Typical hydrofracture flow tube at the surface of the sand...97 Figure 4.18 Typical hydrofracture flow tube and saturated zone above the borehole obvert...97 x
11 Figure 4.19 Figure 4.20 Figure 4.21 Figure 4.22 Lateral earth pressure development with vertical stress accumulation (PTN13).101 Lateral earth pressure development with vertical stress accumulation (PTN8) Record of horizontal stress with respect to time (PTN13) Record of horizontal stress with respect to time (PTN8) Chapter 5 Figure 5.1 Figure 5.2 Biaxial pit configuration used in larger-scale experiments Biaxial pit used in larger-scale experiments seen from above Figure 5.3 Configuration of GeoPIV cameras and targets Figure 5.4 Large scale hand auger and borehole opening Figure 5.5 Figure 5.6 Figure 5.7 High-pressure packer used in larger-scale experiments Position of the high-pressure packer in the borehole Large scale tests: internal drilling fluid pressures Figure 5.8 LS1 sand only Figure 5.9 LS2 sand only Figure 5.10 LS3 sand only Figure 5.11 LS4 sand and Granular A' layered materials Figure 5.12 LS5 sand and Granular A' layered materials Figure 5.13a Resultant quiver diagram LS1 - Sand only Figure 5.13b Partial resultant quiver diagram LS1 - Sand only xi
12 Figure 5.14a Resultant contour diagram LS1 Sand only Figure 5.14b Partial resultant contour diagram LS1 Sand only Figure 5.15 Resultant quiver diagram LS2 - Sand only Figure 5.16 Resultant contour diagram LS2 - Sand only Figure 5.17 Resultant quiver diagram LS3 - Sand only Figure 5.18 Resultant contour diagram LS3 - Sand only Figure 5.19 Figure 5.20 Figure 5.21 Resultant quiver diagram LS4 - Sand and gravel layered Resultant contour diagram LS4 - Sand and gravel Resultant quiver diagram LS5 - Sand and gravel layered Figure 5.22 Resultant contour diagram LS5 - Sand and gravel) Appendix A Figure A1 Figure A2 Failure of hydrofracture test through unexpected mudloss Internal pressure results of the extended cell experiments xii
13 List of Tables Chapter 3 Table 3.1 Soil parameters used in preliminary numerical analyses...42 Table 3.2 Material parameters for the laboratory experiments numerical analyses...49 Chapter 4 Table 4.1 Summary of experimental results and general comment...84 Chapter 5 Table 5.1 Results of larger-scale experiments and various analytical solutions xiii
14 CHAPTER 1 INTRODUCTION 1.1 INTRODUCTION In the past, pipeline installations have utilised conventional construction means commonly referred to as cut and cover methods. Installations using cut and cover methods involve the placement of the pipeline into a trench excavated to the desired depth, which is then backfilled with excavated or imported materials. In areas of heavy urbanisation, this requires the closure of roadways and causes disturbance to the general population that are generally undesirable to designers, engineers, contractors and municipalities. If the pipeline is to be installed though an environmentally sensitive area such as a wetland, under a watercourse, or under earthen flood control structures, conventional methods may not be permitted. Since the 1970 s a trenchless method to install pipelines utilizing horizontal directional drilling (HDD) techniques was acquired from the oil and gas industry and the method has steadily developed since then to achieve worldwide acceptance. HDD can be used to install pipelines composed of a variety of materials ranging from steel to high-density polyethylene, which can be installed through an even wider variety of subsurface conditions. 1.2 HDD INSTALLATION METHODS In general terms, the installation of a pipeline into a directionally drilled borehole is completed in three stages: The first stage consists of the pilot bore where a small diameter drill head is advanced along the selected alignment to the desired exit point. The pilot bore can be either started from the ground surface or from the directional drill rig lowered into a launching shaft if the initial path is too steep to start from the ground surface. Typical entry angles are 1
15 between 8 and 16 degrees, though they can be as steep as 20 degrees (Ariaratnam et al. 2004). By using an angled head, the borehole can be steered from the drill rig by either: a. using rotation to advance the borehole in a straight line, or b. stopping the auger head rotation and pushing the drill string to change course as a result of the pivoting and/or angled auger head. To ensure that the auger head is being steered to the exit point accurately, the head transmits a signal either to the operator at the rig through a wired system fed through the drill string, or to a portable wireless unit somewhere overhead (at the exit point if a short drill path is used, or directly above the drill head if the bore is longer than 550m and no deeper than 45m, (Vermeer, 2007). Following completion of the pilot bore, the second step in the directional drilling process is to ream the borehole. During this step, a larger drill head or a reamer is attached to the drill string and pulled back through the pilot hole. The purpose of reaming is to gradually increase the diameter of the borehole until it has reached at least 1.5 times that of the product pipe to be pulled into place. There is no limit to the number of passes by the reamer; the borehole can be back-reamed as often is necessary to achieve the desired borehole diameter. Once the reaming of the borehole is complete and the desired diameter has been achieved, the product pipe is then pulled into place. During the pull-back of the pipe there are several factors that can be monitored. Most importantly, the force exerted on the product pipe may be monitored during pull-back. If the tensile force exceeds the tensile strength of the product pipe, the pipe will fail resulting in the loss of the pipe down the borehole, or it will be damaged and its long term service life may be degraded. Resistance to the pipe pull-back arises from the frictional forces acting along the length of the product pipe from the sidewalls of the borehole and any frictional forces that may act on the pipe as it is pulled around various alignment changes. Several studies have 2
16 During the first two stages of pipeline installation into directionally drilled boreholes, a viscous bentonite clay (montmorillonite) based drilling fluid, often referred to as drilling mud, is added to the borehole for several key reasons. The first is that the drilling fluid helps cool the cutting head during borehole advance. The second reason is that the bentonite slurry helps transport the borehole cuttings away from the head of the borehole and back towards the entry point. The final, and perhaps the most important reason for using the drilling fluid is to help maintain borehole stability through the length of the borehole (Conroy et al. 2002a,b, 2003; Staheli et al. 1998). The drilling fluid is mixed at the rig and is pumped through the drill string so that it exits from the auger or reaming head. A positive pressure is needed to ensure a constant flow of the drilling fluid and cuttings away from the drill head and to maintain borehole stability throughout the length of the bore. Over the length of the drill alignment, it is common that the height of the column of drilling fluid extending from the drill rig to the end of the borehole will generate mud pressure in addition to the pressure provided by the pump at the rig. Over-pressurization of the borehole can lead to the failure of the surrounding soil, and ultimately to a loss of mud pressure which results in reduced circulation of cuttings and borehole stability. In the worst case scenarios, the escaping mud will migrate towards and often breach the ground surface resulting in a total loss in downhole pressure. In areas with a high environmental sensitivity, the loss of drilling fluid could result in excessive cleanup costs, or even civil or criminal prosecution. 3
17 Because the bentonite slurry is pressurized, it infiltrates into the surrounding native material to an extent, resulting in a composite material commonly referred to as filtercake. The nature and the depth of penetration of the filtercake material are based on the physical characteristics of the surrounding soil. Finer grained materials such as clays and silts are not as prone to the formation of filtercake, while mud is more likely to penetrate into sands and coarser grained soils. Because the physical characteristics of native soil materials can vary significantly, the methods used for drilling must also be adapted to the site conditions. Mixtures of bentonite are not commonly used for cohesive and fine grained soils; rather a synthetic polymer is typically added to water to help emulsify hydrophobic materials like clays. Coarser-grained soils like sands and gravels are generally unstable when excavated below the groundwater table and as such require additional stabilization to prevent the intrusion of groundwater into the borehole. The addition of a bentonite slurry helps to reduce the hydraulic conductivity around the borehole and minimize the infiltration of groundwater into the excavation. Depending on the typical grain size of the soil that the borehole is advanced through, the density of the drilling slurry can be varied to maximize the cost-effectiveness of the slurry. Coarser-grained soils like gravels required an increased density compared to finer grained sands and silt. An increased fluid density within gravelly soils helps form a thicker filtercake around the annulus of the borehole and subsequently seals the borehole minimizing the inflow of pore fluid from the formation. The increased density also helps remove cuttings from the head of the auger by keeping larger grains in suspension within the slurry that would otherwise settle to the base of the borehole as caved material. 1.3 LITERATURE REVIEW Recently there has been a series of analytical approaches attempting to aid design engineers in minimizing the occurrence of hydrofracture during horizontal directional drilling through various soils. Kennedy et al. (2004a,b; 2006), Keulen (2001) and Lugar and Hergarden (1988) have 4
18 recently carried out two-dimensional finite element analyses of the hydrofracture problem in a frictional material in an attempt to provide a reasonable means of estimating the maximum allowable downhole drill fluid pressure. Each considered a different mode of failure: a. Kennedy et al. (2004a,b; 2006) examined borehole failure as a result of tensile failure of the soil around the borehole due to the increase of radial stresses acting on the borehole walls. b. Keulen (2001), Arends (2003), Van Brussel et al. (1997), Lugar and Hergarden (1988), Moore (2005), Xia and Moore (2006), and Wang and Sterling (2004) hypothesised that failure may result from shear failure of the surrounding soils as a result of cavity expansion. The analytical models were based on the current state-ofthe-art practice for estimating the maximum allowable downhole mud pressure initially developed by Vesić, (1972). None of the previous investigations utilized any physical data in the development of their theories; it is felt that to evaluate the effectiveness of the existing models, it is essential that physical data be collected. c. Wang and Sterling (2006) examined the potential for liquefaction as a result of the soil-drilling slurry interaction on the effective stress immediately surrounding the borehole. Their analyses indicated that the effective pressures will quickly decrease to zero even at a low drilling fluid pressure because of the rapid drainage of the drilling fluids into the loose sands if an efficient filtercake is not formed in loose sands. Some researchers have explicitly considered the formation of the filtercake and its potential impact on the borehole s ability to resist failure due to internal radial pressure (Kennedy et al. 2004a,b; 2006; Wang and Sterling, 2006) Others have also made initial assumptions regarding the impact of the lateral earth pressure on the strength of the borehole in both cohesive and 5
19 frictional materials (Kennedy et al. 004a,b; 2006; Xia and Moore 2006) while others have not considered it to be an issue at all (Keulen 2001; Arends 2003; Van Brussel 1997; Lugar and Hergarden 1988). The lateral earth pressure, K 0, in cohesive materials has been shown to influence the maximum internal fluid pressure and the growth of the plastic radius (Xia and Moore, 2006), as well as the orientation of tensile cracks should they form (Kennedy et al. 2004a; 2006). However in granular materials the effect of K 0 remains unclear and further investigation is still required. Each of these models is based on assumptions that have had little to no assessment relative to physical data. The variety in analytical approaches that have been developed generates a series of questions that can only be answered using hydrofracture experiments undertaken in the laboratory or in the field, where the physical processes associated with hydrofracture during horizontal directional drilling in native soils can be established. 1.4 RESEARCH OBJECTIVES The objective of this study is to investigate the nature of borehole failure as a result of overpressurization leading to mud loss, commonly referred to as hydrofracture within cohesionless materials. To date there has been a dearth of information in the specific field of hydrofracture and borehole fluid loss during horizontal directional drilling projects. Very little is known regarding the physical characteristics of the filtercake material and the impact that the intrusion of the drilling slurry into the soil immediately surrounding the borehole (host soil) has on the physical characteristics of the host soil and its ability to resist shear failure (blowout). As such, laboratory experiments were designed to create hydrofracture blowout 6
20 failures in a poorly graded medium sand under controlled, repeatable conditions. To better refine the parameters used in the numerical models, representative samples of the filtercake material should be recovered and investigated to compare the changes in the gradation, moisture content, optimal compaction and hydraulic conductivity of the filtercake. The refined parameters should then be used as input in the existing models in order to further improve upon the current models. Another goal of this research is to help understand why a certain numerical model (tensile or shear failure) may better represent the actual stress field as observed during the laboratory experiments. 1.5 LABORATORY EXPERIMENTS PROPOSED LABORATORY INVESTIGATION The experiments are designed to allow for an evolution of the testing methods with experience at first by utilizing a smaller apparatus that is easy to fill, test and empty with an end goal to move onto a larger-scale test cell or true-scale field experiments following the development of the test methodology. The smaller-scale experiments are considered essential so that if any errors associated with the testing methodology are encountered, they can easily be addressed and corrected as necessary. Once a consistent testing method is developed, the apparatus should be changed to either larger-scale models or field investigations to minimize any boundary conditions that may be present in the smaller-scale experiments. Monitoring of the experiments should consider not only the downhole pressures that occur during the application of the drilling fluid but should also consider the surface displacements and the horizontal stresses within the host soil throughout the experiments. There are inherent difficulties with monitoring the surface displacements in real time as any displacement monitoring points 7
21 must either be placed onto the surface of the soil or within the soil mass itself. Should the surface displacements be monitored using linear potentiometers, they would be subject to displacement of the base plate as they must be placed directly on the soil mass itself. If heave plates are installed within the soil mass, they pose the potential to create a shortened flow path to the ground surface. There are no documented cases of surface displacement data being provided for HDD projects and all estimates used to evaluate the surface displacements associated with hydrofracture are based on previously reported closed-form solutions provided by Yu and Houlsby (1991). Yu and Houlsby developed the displacement analysis as part of a study of surface displacements resulting from the expansion of an existing cavity during pipe bursting applications FILTERCAKE INVESTIGATION The previous numerical models discussed by Kennedy et al. (2004b; 2006) and Wang and Sterling (2004) each attempt to model the impact of the filtercake material on the overall ability of the borehole to resist hydrofracture. It is felt that the parameters chosen to represent the filtercake material are not conservative and an investigation into the physical characteristics of the filtercake is needed. It is assumed that the previous assumptions by Wang and Sterling (2004) and by Kennedy et al. (2004b; 2006) regarding the physical nature of the filtercake material overestimate the cohesion of the filtercake material. The current practice assumed a cohesion based on the lateral earth pressure K o and the insitu vertical stress σ v. Kennedy et al. (2004b; 2006) assumed that the cohesion of the filtercake should be estimated by the expression c u = ½ σ v (1+K 0 ) sinφ, which if greater than the apparent cohesion of the sand, is likely overestimated. In an attempt to accumulate physical data, representative samples of the host and filtercake materials should be recovered from several of the experiments to conduct analyses of the 8
22 materials respective physical characteristics. The samples should be subjected to a gradation analyses to determine the typical changes in gradation that occur to the host material following impact by the drilling fluid. The samples should also be subjected to compaction tests to determine a representative standard Proctor maximum dry density (SPMDD) and the optimum moisture content to assess the compactive effort achieved during the placement of the soil to be tested. Finally, each sample should be subjected to a falling head test to determine the affect of the bentonite slurry on the hydraulic permeability of the filtercake material. Shear strength testing should also be carried out so that the shear strength parameters of the host and filtercake materials can be input into the numerical models to provide further refinement. Strength tests, however, are beyond the scope of this research and were not carried out during the course of this laboratory investigation LATERAL EARTH PRESSURE INVESTIGATION It is also desired that the laboratory experiments provide information regarding the nature of the lateral earth pressure (K o ) applied during soil deposition as well as during the actual experiments. This is necessary in order to help quantify the lateral earth pressure so that an effective value could be used in place of a range of estimates. Previous numerical models have assumed a variety of K o values and have hypothesized using numerical analyses what kind of role K o really plays in the failure of horizontally drilled boreholes in cohesionless deposits. The current state-of-the-art practice for estimating the limiting internal mud pressure assumes that the material possesses a coefficient of lateral earth pressure equal to 1. Ideally, the experimental apparatus would be able to monitor the horizontal stresses exerted on the sidewalls of the cell by the sand in order to determine K o prior to testing, and to indicate the changes to K o throughout the duration of each 9
23 experiment. Kennedy et al. (2004a,b; 2006) suggested that K o could have a significant influence on how a borehole failed. They hypothesised that as K o shifted from less than 1 to greater than 1, failure would shift from the crown of the borehole to the springlines. It is the goal of this part of the research to help provide refinement to the existing models resulting in a better understanding of the actual K o values, how they develop and change during the course of radial loading, and what impact they may have on the overall ability of the borehole to resist hydrofracture SURFACE DISPLACEMENT MONITORING To accurately monitor the ground displacements in real time during the experiments, a noninvasive method of monitoring displacements is required. Any instruments placed within the soil would create a shorter path to the ground surface and hydrofracture might be promoted by any displacement devices in the ground. Linear potentiometers (LPs) placed on the surface of the compacted material would be vulnerable to overturning and the displacement of the base along with the LP. What is needed is a method to monitor ground displacements in real time over a large area that is completely independent of the material datum. To overcome these issues mentioned above, it is suggested that the use of a recently developed photo imagery monitoring system be utilized. White et al. (2003) have shown that by using high resolution digital cameras programmed to take photographs of targets placed on or within the experimental apparatus at regular intervals, the displacements of chosen points may be calculated using Particle Image Velocimetry (PIV). PIV was initially developed for experimental fluid mechanics, but was modified to help provide small strain measurements for geotechnical experiments. White and Take have developed a MatLab script designed to allow the user to choose individual pixels of targets placed on the surface within a digital image and a known search area for each point. During the analysis, each image is scanned for the selected pixels within the designated search area and the displacement between the current and the pre-selected value may then be calculated. 10
24 Using this technology, an arbitrary datum can be selected without influencing the flow path of the drill fluid. By placing wooden targets with black marks painted on the face of the blocks onto the ground surface at known grid locations, the surface displacements can be monitored independently of the hydrofracture experiments LAYERED MATERIALS The last objective of this study is to investigate the response of layered cohesionless soils during hydrofracture. This area is of particular interest in the HDD industry as directional drilling projects commonly involve the crossing of highways and/or various road structures where layered granular subgrades are commonly employed. As populations in urban areas expand, additional subsurface infrastructure is needed and it is essential to maintain the flow of traffic on roads and highways to minimize the impact on citizens. It is therefore valuable to investigate the nature of hydrofracture in layered granular subgrade systems. This work would also benefit from the proposal to investigate the ground displacements that occur as hydrofracture propagates and eventually breaches the ground surface. Based on these criteria, additional larger-scale experiments should be designed specifically to investigate, and attempt to provide some clarification to these questions. To represent the granular material typically used as a roadway subgrade it is recommended that a well graded easily compacted, granular material be used. Using the GeoPIV system (White et al. 2003), the ground displacements should also be monitored throughout the experiments to help evaluate a numerical model with similar characteristics. Though no asphaltic concrete or concrete cement 11
25 are to be used as a top course, these experiments should provide a useful starting point for future investigations into the impact of hydrofracture/blowout in road structures. 1.6 CONCLUSIONS Based on this review of previous research on hydrofracture and shear failure associated with HDD, it is clear that: Physical data regarding the maximum downhole fluid pressures are required; Refinement of the soil parameters is necessary to evaluate the accuracy of the existing numerical models; Physical data are needed to establish how material characteristics change as a result of drilling fluid used during horizontal directional drilling; Data are needed to improve our understanding of the influence of the lateral earth pressure K o on hydrofracture and shear failure in frictional materials; Investigations are needed to examine the nature of hydrofracture and blowout in layered granular/sand systems similar to granular road subgrades. To achieve these goals, a comprehensive laboratory investigation has been undertaken which is described in the chapters that follow. As part of this research the following material will be presented: o Chapter 2 contains a detailed review of the literature and previous research in the area of hydrofracture of directionally drilled boreholes; this includes a review of various theoretical solutions currently used to estimate the maximum fluid pressures in the borehole; 12
26 o Based on the literature review, the third chapter provides a discussion presenting additional numerical modelling that is designed with the goal of evaluating and refining the existing models. The additional numerical models are also used to investigate the impact of the composite bentonite-sand material on the overall ability of a directionally drilled borehole to resist failure due to hydrofracture; o The fourth chapter presents the development and methodology used in a series of smaller-scale hydrofracture tests as well as the findings from physical property tests carried out on the native sand and the filtercake materials. In addition to the laboratory testing, the instrumentation methods used during the course of the experiments is also presented. This discussion includes comments on both the successes and limitations associated with the various monitoring techniques and testing methods; o Following the completion of the smaller-scale tests, the fifth chapter discusses the findings of several larger-scale experiments. These experiments utilize all of the information obtained from the smaller-scale tests to investigate the problem of hydrofracture for both single and multiple layered systems. The purpose of these experiments is to minimize and assess the influence of boundary conditions present in the smaller-scale experiments; o The final chapter summarizes the findings of the previous chapters and discusses their limitations. Suggestions for future research in the area of hydrofracture associated with directionally drilled boreholes are provided. REFERENCES Arends, G. (2003). Need and possibilities for a quality push within the technique of horizontal directional drilling HDD. Proc., 2003 North American No-Dig Conf., Las Vegas, Paper No
27 Ariaratnam, S.T., Bennett, D., and Como, Casey. (2004). HDD good practice guidelines. The Horizontal Directional Drilling Consortium, Arlington, Virginia. Chapter 6: Beamert, M.E., Allouche, E.N., Moore, I.D. (2005). Drilling Fluid Considerations in Design of Engineered Horizontal Directional Drilling Installations. ASCE International Journal of Geomechanics. Vol.5(4): Conroy, P. J., Latorre, C. A., and Wakeley, L. D. (2002a). Installation of fiber-optic cables under flood-protection structures using horizontal directional drilling techniques. ERDC/GSL TR-02-8, Geotechnical Structures Laboratory, Vicksburg, MS.USACE. Conroy, P. J., Latorre, C. A., and Wakeley, L. D. (2002b). Guidelines for installation of utilities beneath Corps of Engineers levees using horizontal directional drilling. ERDC/GSL TR-02-9, Geotechnical Structures Laboratory, Vicksburg, MS. USACE. Conroy, P. J. (2003). Directional drilling under levees, St. Louis Corps of Engineers experience. Proc., 2004 North American No-Dig Conf., New Orleans, Paper No. B Kennedy, M. J., Skinner, G. D., and Moore, I. D. (2004a). Elastic calculations of limiting mud pressure to control hydrofracturing during HDD. Proc., No-Dig 2004, New Orleans, Paper No. E Kennedy, M. J., Skinner, G. D., and Moore, I. D. (2004b). Limiting drilling slurry pressures to control hydrofracturing during HDD through purely cohesive soil. Proc., 2004 Canadian Geotechnical Society Conf., Quebec City, Paper No. 4E:
28 Kennedy, M. J., Skinner, G. D., and Moore, I. D. (2006). Development of tensile hoop stress during horizontal directional drilling though sand. ASCE International Journal of Geomechanics, Vol. 6(5): Keulen, B., Arends, G., Mastbergen, D.R. (2001). Maximum allowable pressures during directional drillings focused on sand. Delft Geotechnics Thesis Paper: 23-32, Appendices Lugar H.J., Hergarden H.J.A.M. (1988). Directional drilling in soft soil; influence of mud pressures, Proc., ISTT-No Dig, 1998, Washington D.C., Paper 6B: 1-7. Moore, I.D. (2005). Analysis of ground fracture due to excessive mud pressure. Proc., 2005 North American No-Dig Conf., Orlando, Paper No. C Staheli, K., Bennett, D., Hurley, T., O Donnell, H.W. (1998). Installation of pipelines beneath levees using horizontal directional drilling. Pipeline Research Council International, Inc., Paper CPAR-GL Van Brussel, G.G., Hergarden, H.J.A.M. (1997). Research (CPAR) program: Installation of pipelines beneath levees using horizontal directional drilling. SO /2. Department of Foundations and Underground Engineering, Delft Geotechnics, Vermeer Corporation. (2007). website, Vesić, A.S. (1972). Expansion of cavities in infinite soil mass. ASCE Journal of the Soil Mechanics and Foundations Division, Vol. 98:
29 Wang, J. X., and Sterling, R. L. (2004). Stability analysis of a borehole wall in horizontal directional drilling. Proc., 2004 North American No-Dig Conf., New Orleans, Paper No. E Wang, X., Sterling, R.L. (2006). Finite element analysis of the instability of borehole wall during horizontal directional drilling, 2006 ISTT No Dig Conf., Brisbane, Australia, 49: White D. J., Take W.A., Bolton, M.D. (2003). Soil deformation measurement using particle image velocimetry (PIV) and photogrammetry. Geotechnique, Vol. 53(7): Xia, H. and Moore, I.D. (2006). Estimation of maximum mud pressure in purely cohesive material during directional drilling, Geomechanics and Geoengineering: An International Journal, Vol. 1 (1): Yu, H.S., Houlsby, G.T. (1991). Finite cavity expansion in dilatant soils: loading analysis, Geotechnique, Vol. 41(2):
30 CHAPTER 2 LITERATURE REVIEW 2.1 INTRODUCTION In recent years, the need to construct new, or rehabilitate aging infrastructure within either a densely populated urban setting or in environmentally sensitive areas has developed with population growth. Given the need to accommodate development while minimizing disturbance to the surrounding areas, horizontal directional drilling (HDD) is proving to be a viable solution for pipeline installation under and/or around existing infrastructure, or under areas that are deemed to be sensitive to conventional construction methods. Though commonly called horizontal directional drilling, very few boreholes are actually horizontal. One of qualities of directional drilling is that depending on the nature of the soil encountered along the drill path, the borehole can be steered above, below, or around existing subsurface obstacles such as foundations or previously installed infrastructure. Other benefits associated with directional drilling are that most difficulties encountered during pipeline installation are easily addressed, though are sometimes costly in terms of budget and lost productivity. The methods used for installation are readily applied to most situations and if successful, present a relatively unobtrusive, cost-effective solution to many pipeline installation problems. The process consists of drilling a guided pilot bore, generally using a drill pipe and a slightly larger-diameter cutting tool with an angled flat head powered by drilling mud. A conventional tri-cone bit or jetting tool is shown in Figure 2.1. Drilling mud is pumped through the drill rods or the drill string from the drilling rig to the cutting tool at high-pressure for a number of reasons. If a mud motor and drill bit are used, the drilling mud causes the mud motor to rotate which, in 17
. Figure 2.")
31 turn, rotates the drill bit and cuts the hole. If a jetting tool is used, the drilling mud exits the orifices in the jetting tool and erodes the hole in front of the jetting tool (Conroy et al. 2002a,b). Figure 2.1 Various cutting tools used in HDD projects In some soil conditions it is desirable for the drilling mud to flow back to the surface in the annular space between the drill string and the wall of the pilot hole. In this case, the return flow removes the cuttings from the drilling head and flushes them back to the surface. Circulation of the drilling mud is employed in materials that are fairly stable such as weathered bedrock or stiff to hard clays, where the shear strength is high and groundwater infiltration is relatively low. In other, lower strength materials, no return flow is desired. In this case, just enough drilling fluid is mixed with the cuttings to create slurry that remains in the hole, thereby stabilizing it. (Conroy et al. 2002a,b) This method would typically be employed in relatively cohesionless materials such as sands and silts, providing not only borehole stability but also attenuation of groundwater infiltration which would otherwise lead to the complete collapse of the borehole. The laboratory experiments carried out as part of this research involved pumping drilling fluid into a pre-augered and clean borehole. This method was used due to the stability of the model soil (simulating conditions above the groundwater level), and also due to the difficulty of advancing a borehole using jetting methods in a laboratory setting without prematurely causing hydrofracture. 18
32 2.2 BACKGROUND The problem of drilling fluid loss du to hydrofracture during horizontal directional drilling projects has been well known for some time to be a source of financial cost due to lost materials and productivity. Hydrofracture also potentially poses a threat to the environment if it occurs in areas identified as environmentally sensitive such as in the middle of watercourses or wetlands. Lugar and Hergarden (1988) discussed the formation of an HDD blowout failure below a canal in the Netherlands during the pullback of the product pipe through a very soft, purely cohesive clay and peat. Though the failure was not of any significance in terms of environmental or social impact, it was shown that by using a form of the cavity expansion of a cohesive material that assumes that the material to be drilled through is comprised of an elastic-perfectly plastic solid, the maximum internal drill mud pressure could be reasonably estimated. Conroy et al. (2002a,b) presented a study investigating the potential failure of earthen dykes during flood conditions. Previous studies have shown that earthen structures designed to retain flood waters around urban environments could be undermined by the formation of flow paths through the attenuation layer on the landward side of the dykes. Conroy et al. reported that the advancement of a directionally drilled borehole under these dykes would generally pierce one to two holes (entrance and exit of the drill path) through the overlying aquitard, increasing the net hydraulic conductivity, reducing the length of the required flow path and subsequently increasing the seepage velocity. The failure of the dyke would then occur as the increased velocity of the flow through the ground would lead to piping or boiling of the founding soil material on the landward side of the dyke. Conroy et al. (2002a,b) suggested that the aquitard could be compromised either by improperly backfilling/sealing the borehole or more importantly through 19
33 the occurrence of hydrofracture of the aquitard. It was shown how the low paths of lost drilling mud through the aquitard led to the eventual and potentially catastrophic failure of the dyke. Duyvestyn (2006) reported on an HDD project advanced through a stiff to very stiff silty clay material which was overlain by an environmentally sensitive slough and marshland. Apart from issues of access through a dense forest and difficulties in achieving the necessary entrance angle to start the drill path, strict rules regarding drill fluid losses were set out prior to the commencement of the project. Once the project was underway, several fractures occurred immediately adjacent to the sensitive marshland and required the clean up of the lost drilling fluids. Since the environmental constraints limited the access of vehicles into the marshland, fluid pumps had to be used to recycle the drill fluid from the hydrofracture to the rig. However, due to the nature of the subsurface materials, conventional pumping methods could not be employed, leading to further difficulties advancing of the borehole. The installation of a relief well did not mitigate the issues and only led to further costs and additional delays to productivity. With this paper, Duyvestyn showed how critical it is to minimize any fluid losses during HDD projects within environmentally sensitive areas as it may not always be possible to reasonably reestablish fluid circulation using conventional methods. The paper also discussed the potential difficulties posed by remediation of the drilling fluid in undesirable areas, where the access for vehicles such as vacuum excavators may be limited or forbidden. In all of the above case studies, a directional drilling project was required through a sensitive area or an area where access was restricted by regulatory bodies. In all cases but the one presented by Lugar and Hergarden (1988), it was necessary to ensure that fluid losses from hydrofracture were controlled. In the papers presented by Conroy et al. (2002a,b) and Duyvestyn (2006), the maximum allowable downhole fluid pressure was determined with marginal success using the Delft solution developed by Lugar and Hergarden (1988) based on a two-dimensional finite 20
34 element analysis. Another characteristic common to these cases was the material into which the pipeline was to be installed. In all of the above cases, the materials that were drilled through were considered to be purely cohesive soils, with little emphasis on the potential for blowout or hydrofracture failures within granular, frictional materials. Clearly there is a need to evaluate the effectiveness of the existing state-of-the-art practices and compare their results with controlled experiments, within frictional cohesive soils. This chapter now presents the cavity expansion theories commonly used for interpretation of the expansion of holes when tested with either a pressuremeter or static cone tests so that the results may be compared with the findings of a series of laboratory experiments to be presented in subsequent chapters. 2.3 CURRENT ESTIMATION PRACTICES The current state of practice is based on the belief that most cases of Hydrofracture or Frac-out, occur as the downhole fluid pressures acting radially on the borehole walls increase stresses in and exceed the shear strength of the surrounding soil. It is thought that the existing cavity expands causing a rupture in the soil mass, at which time the drilling fluid migrates to the surface along the zone of failed material (Keulen, 2001). Arends (2003) showed that in cohesive materials, this hypothesis is likely to be the case as the drilling fluid is contained within the expanding cavity, though it can also migrate to the surface through tensile cracks as described by Kennedy (2004b; 2006). It is unclear whether the same applies in cohesionless materials, in view of the formation of the filtercake around the walls of a borehole in such materials. Recently, it has been suggested by Kennedy et al. (2004a; 2006) that perhaps the increasing radial stresses act to reduce the confining hoop stress in the soil around the borehole. Once the hoop stress around the boring changes from compressive to tensile, cracks form at either the invert, or the springlines, depending on the state of the in situ stresses. It is assumed that for a granular 21
35 (non-cohesive) material the tensile strength is very close to or equal to zero (Kennedy, 2004a,b; 2006). Consideration of cavity expansion has also been incorporated into several design codes, most notably by the US Army Corps of Engineers (USACE) (Conway et al. 2002a,b). The USACE suggests that a solution developed at Delft University of Technology (Delft) based on the expansion of a cavity in an elastic-plastic continuous medium may be used to estimate the maximum allowable mud pressures within a borehole. The use of this method will be discussed in more detail in subsequent sections. Other forms of the cavity expansion theory are also explored, notably the closed-form solutions of an existing cylindrical cavity provided by Carter et al. (1986), as well as the work of Yu and Houlsby (1991). These researchers developed different approaches to the problem of cavity expansion during investigations of methods of interpretation pressuremeter tests and attempted to better estimate the end bearing capacity of driven piles. The problem defined for each of the three solutions provided in this chapter is best described by Yu and Houlsby, (1991): An unbounded, three dimensional medium of dilatant soil [in the method described by Lugar and Hergarden, this soil mass is not dilatant] contains a single cylindrical (or spherical) cavity. Initially the radius of the cavity is a o and a hydrostatic pressure p o, acts throughout the soil, which is assumed to be homogeneous. The pressure inside the cavity is then increased to p sufficiently slowly for dynamic effects to be negligible The soil is modelled as an isotropic, dilatant [again Ψ = 0 in the Delft 22
36 solution] elastic perfectly plastic material. It behaves elastically and obeys Hooke s law until the onset of yield which is determined by the Mohr-Coulomb criterion. Initially the problem of a cylindrical or spherical cavity within a frictionless material (purely cohesive) was solved as part of an investigation into the nature of indentations of metals. There have been other studies involving the investigation of cavity expansion (either spherical or cylindrical) within a purely cohesive material for various applications such as bearing capacity calculations for deep foundations, as well as the interpretation of pressuremeter or statically driven electric cone penetration tests. Only the later studies considered the possibility of a frictional material and the associated changes of volume with expansion of the plastic radius. 2.4 DELFT EQUATION The Delft solution was initially derived from the closed-form solutions for both pre-existing cylindrical and spherical cavities for the determination of the end bearing capacity of driven piles in an ideal soil as derived by Vesić (1972). Later Lugar and Hergarden (1988) advanced the work of Vesić by developing a numerical model based on the expansion of a pre-existing cylindrical cavity within an infinite medium. Lugar and Hergarden presented their derivation and an example of the relative effectiveness of their solution in conference proceedings of the 1988 No- Dig conference in Washington D.C. In a manner similar to Vesić (1972), Lugar and Hergarden (1988) assumed the following in the derivation of what is now called the Delft equation: Static equilibrium; Hooke s law for increments of elastic deformation; Mohr-Coulomb failure criterion; and 23
37 The absence of isotropic deformations within the plastic zone (zero dilation) Lugar and Hergarden (1988) described a full scale experiment in the Netherlands designed to assess the effectiveness of their numerical model. The test was carried out in a purely cohesive soil deposit with good results assuming the theory of a limiting pressure of 90% of the calculated maximum internal pressure. The downhole drilling fluid pressures were monitored with four pressure transducers installed on the surface of the head of the drill string during pullback operations. The maximum internal pressure was estimated using Equation 2.1 below and assuming a maximum plastic radius equal to the depth of soil cover. It was later suggested by Van Brussel et al. (1997) that the limiting pressure of 90% of the maximum estimated internal borehole pressure should be reduced further to account for inconsistencies in the soil deposits and estimates into the strength of the native soil throughout the length of the drill path. Van Brussel et al. (1997) suggested that the limiting pressures be restricted to a plastic radius (radial extent of the zone of shear failure surrounding the borehole) of one half of the depth to the ground surface above the crown of the borehole in purely cohesive materials and to two thirds the depth in frictional materials. This suggestion was accepted by Pipeline Research Council International (Staheli et al. 1998) and later by the USACE (Conroy et al. 2002a,b). Van Brussel et al. (1997) suggested that the depth of cover should be selected based on an appropriate factor of safety. Van Brussel et al. (1997) stated that in clay and peat, the factor of safety should be considered to be equal to 2 while in sand the factor of safety may be taken as 1.5. The lower factor of safety within sands is applied because the probability of the maximum value being attained is less than in cohesive soils and applies regardless of whether soil is to be removed or remain within the borehole. Keulen (2001) furthered the work by Lugar and Hergarden by conducting laboratory experiments designed to determine the effectiveness of their assumptions. Keulen determined that at great 24
38 depths, indeed some form of cavity expansion or ballooning of the borehole similar to the theories derived by Vesić did occur where the flow was blocked in a compacted soil (Keulen 2001). However, both Lugar and Hergarden and Keulen reported that at shallower depths of overburden, these theories do not always hold true and some form of hydrofracture or tensile cracking occurred. In their 1988 paper, Lugar and Hergarden described how at any given internal radial pressure the corresponding plastic radius R p defined as the distance from the origin (centre of the borehole) to the limit of the plastic envelope, could be calculated. The material at all other points with a radius greater than R p was considered to be in an elastic state and was defined as linearly deformable, homogeneous and isotropic. To simplify the model, the geostatic stresses applied were considered to act uniformly throughout the material (they were not treated as variable with depth). Within the plastic region or at points with a radius less than R p, the material was assumed to be a homogeneous, isotropic, compressible plastic solid. Strength parameters were defined by typical Mohr-Coulomb criteria, the angle of internal friction (φ) and cohesion (c). Because the soil in the case studied was purely cohesive and undrained, the angle of internal friction (φ) and the volume changes associated with shear failure (angle of dilation, Ψ) were assumed to be equal to zero. Based on the above assumptions, the Delft solution as it is commonly used today may be calculated assuming the Equation 2.1: 25
39 [2.1] where; ; p max is the maximum internal pressure; p f is the effective mud pressure defined as [σ o (1+sinφ) + (c cosφ)] u; R o is the initial borehole radius; R pmax is the maximum plastic radius; G is the shear modulus of the material; σ o is the initial vertical overburden pressure; and c is the cohesion of the soil. A reproduction of the derivation of the equations is not provided in this report. For a complete description of the derivation of the Delft solution in its current form, it is suggested that the reports published by either Lugar and Hergarden (1988) or Keulen (2001) be consulted. 2.5 CARTER, BOOKER AND YEUNG SOLUTION FOR CYLINDRICAL CAVITY EXPANSION Carter et al. (1986) described the derivation of a closed-form solution to explain the expansion of both cylindrical and spherical cavities within an ideal frictional-cohesive soil for the purposes of estimating the end bearing capacity of driven piles. Carter et al. (1986) assumed an elasticperfectly plastic frictional cohesive soil and used a non-associated flow rule with the onset of yield defined by the Mohr-Coulomb failure criterion. The solution explained the explicit expression for the pressure-expansion relation for small strain deformation. In this paper they did not consider the entire pressure-expansion curve, as they did not use the previously developed numerical methods derived by Carter and Yeung (1985) to calculate the limiting value for very 26
40 large strains. Instead, they calculated the large strains explicitly by making an assumption regarding the size of the plastic region compared to the size of the expanded cavity. This assumption will be explained in more detail below. In order to formulate the solution, Carter et al. (1986) assumed that the initial internal stresses were identical (σ 1 = σ 2 = σ 3 = p o ) where σ 1, σ 2 and σ 3 are the principal stresses within the soil mass. They also assumed that the depth of the cavity was such that any variation in the geostatic stresses could be neglected. To further simplify the problem, they assumed that by considering the above hydrostatic state, the theory of plane strain axial symmetry applied for the cylindrical case. During large strains, it is difficult to track the radial coordinates of a given particle as its position can change significantly with radial expansion of the cavity. Also, because the problem incorporates both geometric and material non-linearities, it was convenient to assign a rate formulation to the problem. They assumed that prior to loading, the initial pressure was equal to p o (or the initial geostatic stress), and that the initial radius was equal to a o (Carter et al. 1986). Following loading and the subsequent expansion of the cavity (t > 0), the radius of the cavity was equal to a. By assuming the above, it stood to reason that at any initial point r o within the mass of the soil, following loading that point would move to point r. As the internal pressure increases, at any element positioned at point r within the plastic zone defined by R p is assumed to be in a state of plastic deformation while all other points outside the plastic radius (R p ) are still considered to be in an elastic state as shown in Figure 2.2. Unlike previous methods of analysis of cavity expansion, Carter et al. (1986) also considered the small strains associated with elastic deformations in addition to the large strains associated with the plastic deformations calculated within the plastic region. Finally, it was assumed that the principal stress during loading would 27
41 be the radially applied stress (σ r ) while the hoop stress (σ θ ) would be the minor principal stress. The calculation of the radial displacements is governed by a differential equation derived by Carter et al. (1986). r o r Figure 2.2 Illustration of the various theories of cavity expansion To explicitly express the large strains without the use of numerical techniques previously described by others, Carter et al. (1986) assumed that at some limiting pressure a pseudo steady state configuration will be approached. The pseudo steady state occurs when the ratio of R p /a or rather the plastic radius to the current cavity size will approach a constant value (Carter et al. 1986). For a pre-existing cavity, (a o > 0), it is required that the cavity become infinitely large or rather that both R p and a approach infinity for this constant value to be achieved. This statement by Carter et al. is considered to be the defining point of their solution and could also be a source of potential error through unjustified assumptions (Yu and Houlsby, 1991). 28
42 The constitutive characteristics of the soil medium were assumed to be similar in nature to that of the closed-form solution provided by Vesić (1972) and later by the numerical method developed by Lugar and Hergarden (1988) which considered the following: Equilibrium; Hooke s law for increments of elastic deformation; Mohr-Coulomb failure criterion; and Deformations within the plastic zone as defined by a variable flow rule (ψ varies). Like the Delft solution, the derivation of the solution provided by Carter et al. (1986) is not provided in this report. 2.6 YU AND HOULSBY SOLUTION FOR CYLINDRICAL CAVITY EXPANSION In this section, the solution describing the expansion of a pre-existing cylindrical cavity within a frictional-cohesive material as reported by Yu and Houlsby (1991) is briefly presented. For a complete description of the derivation of the closed-form solution it is suggested that the referenced material is consulted. Yu and Houlsby (1991) described a closed-form solution for the stresses and displacement fields of a frictional-cohesive material subjected to the internal radial loading of a pre-existing cavity. The constitutive characteristics of the material used for the solution assume that the material behaves as an elastic-perfectly plastic material that uses a non-associated flow rule with the onset of yield defined by the Mohr-Coulomb failure criterion. As in the other two subsections described above, the following was assumed by Yu and Houlsby: 29
43 Equilibrium; Hooke s law for increments of elastic deformation; Mohr-Coulomb failure criterion; and Deformations within the plastic zone defined using a variable flow rule (dilation angle ψ varies). Also similar to the Delft solution and the closed-form solution provided by Carter et al. (1986) and Yu and Houlsby assumed that the problem may be simplified by assuming plane strain parallel to the axis of the borehole in the cylindrical case. Finally, Yu and Houlsby describe the complete analysis of the large strains through the introduction of dilatancy where only approximate solutions for describing the large strains were used before. As in the solution provided by Carter et al. Yu and Houlsby consider a soil mass with an initial radius a o and an initial homogeneous hydrostatic soil pressure acting on the annulus of the cavity defined as p o. Following the application of an internal pressure, p which acts radially on the walls of the cavity (t > 0), the radius of the cavity becomes equal to a. Any point at radius, r o within the soil medium, moves from radius r o to r following the application of the internal pressure p as shown in Figure 2.2. Because of the strong inequality of the onset of yield compared to the modulus of elasticity, for both the total stress, undrained analysis and the effective stress drained analysis, the use of small strain theory for the initial phase of elastic deformation is justified, provided that the initial geostatic stress (p o ) is considerably less than the modulus of elasticity because the strain to the initiation of plasticity is then small (Yu and Houlsby, 1991). As a result, all soil elements located at point r which have exhibited the onset of yield are within the radius of the plastic zone as 30
44 defined by a radius b (previously R p ) and are subject to both elastic and plastic strains. All soil elements outside the radius b are considered to be elastic and are subject to elastic strains only. By considering the stresses within the elastic and plastic regions separately, it is possible to calculate the stress field in terms of the ratio of the cavity pressure (p) and the current cavity radius a. By doing so, the only unknown left to calculate is the radius of the plastic zone (b) which can then be obtained from the displacement analysis. As stated before, the determination of the plastic deformations within radius b considers both the plastic deformations as dictated by the plastic flow rule (the flow rule defines the relative magnitude of the plastic strains, (Yu and Houlsby, 1991) and the elastic deformations as dictated by Hooke s law. In order to simplify the problem, following shear failure the soil is assumed to dilate plastically at a constant rate with a fixed angle of dilation (Ψ) and a fixed angle of internal friction (φ) as opposed to being defined as functions of the density and pressure (Yu and Houlsby, 1991). To account for the effects of the large displacements within the plastic zone, the strains are calculated in terms of a logarithmic function. By integrating the logarithmic strains between r o = a o and r = a, and using an infinite series expansion, an explicit expression for the cavity expansion relationship of a cylindrical cavity can be obtained (Yu and Houlsby, 1991). Simple manipulation of the calculations provided by Yu and Houlsby are not generally possible and are more suitably solved using a computer algorithm designed to calculate the necessary iterations in an infinite series until convergence is achieved. 31
45 Once the calculation of the radius of the plastic zone (b) has been completed, a complete picture of the stress-strain field associated with the expansion of a cylindrical cavity within an infinite homogeneous, dilatant cohesive frictional material can be defined. 2.7 CONCLUSIONS The case studies presented at the beginning of this chapter illustrated the need for the formulation of an accurate estimation method designed to help designers of HDD projects minimize the failure of boreholes resulting in drilling fluid loss at the ground surface. Currently, the simplest method is provided by Lugar and Hergarden (1988) and was later adapted by Delft University, (Van Brussel et al. 1997) and the US Corps of Army Engineers (Conroy et al. 2002a,b). This socalled Delft solution is considered to be the state-of-the-art method for designing the maximum allowable downhole drilling fluid pressure during either the pilot bore or the reaming/product pullback of HDD projects. The Delft solution has been used by many consultants and contractors with limited success in a variety of soil deposits (Duyvestyn, 2006). Based on the described methods used for estimation of a cylindrical cavity within an infinite medium it is expected that there will be a wide variety of solutions for a single problem. It is expected that the closed-form solutions which consider a more detailed picture of the soil characteristics should result in a better estimation of the maximum allowable internal pressure for a pre-existing borehole within an infinite, homogeneous, isotropic, cohesive-frictional material subjected to a radially applied internal pressure. All cases consider an infinite unbounded elastic-perfectly plastic soil medium that assumes the material to be in a state of equilibrium, obeys Hooke s law of increments for displacements 32
46 within the elastic region, and the onset of yield as defined by the Mohr-Coulomb failure criterion. Two of the three methods consider some form of dilation angle to define the volumetric change of the material within the plastic zone following the onset of yield. In all cases, a radius R p (b), defining the extent of the plastic radius which is assumed to be larger than the initial radius of the cavity (a o ) can be calculated. All elements located at some radius r, within the plastic radius b, (a o < r < b) are assumed to be in a state of plastic deformation and subject to volumetric change as defined by the angle of dilation (Ψ). All other elements located at points greater than the plastic radius R p (b), (r > R p ) are considered to be in an elastic state and all deformations within this region are of an elastic nature. Later chapters will present numerical as well as laboratory data and discuss the effectiveness of all of the described estimation methods as they compare to the findings of the numerical analysis and laboratory experiments designed to replicate hydrofracture in a frictional-cohesive material. REFERENCES Arends, G. (2003). Need and possibilities for a quality push within the technique of horizontal directional drilling HDD. Proc., 2003 North American No-Dig Conf., Las Vegas, Paper No. 36. Carter, J.P., Yeung, K.S. (1985). Analysis of cylindrical cavity expansion in a strain weakening material. Computers and Geotechnics, Vol. 1: Carter, J.P., Booker, J.R. and Yeung, K.S. (1986). Cavity expansion in cohesive frictional soils. Geotechnique, Vol. 36(3):
47 Conroy, P. J., Latorre, C. A., and Wakeley, L. D. (2002a). Installation of fiber-optic cables under flood-protection structures using horizontal directional drilling techniques. ERDC/GSL TR-02-8, Geotechnical Structures Laboratory, Vicksburg, MS.USACE. Conroy, P. J., Latorre, C. A., and Wakeley, L. D. (2002b). Guidelines for installation of utilities beneath Corps of Engineers levees using horizontal directional drilling. ERDC/GSL TR-02-9, Geotechnical Structures Laboratory, Vicksburg, MS. USACE. Duyvestyn, G. (2006). Challenging ground conditions and site constraints, not a problem for HDD. Proc., 2006 North American No-Dig Conf., Nashville, Paper No. A Kennedy, M. J., Skinner, G. D., and Moore, I. D. (2006). Development of tensile hoop stress during horizontal directional drilling though sand. ASCE International Journal of Geomechanics, Vol. 6(5): Keulen, B., Arends, G., Mastbergen, D.R. (2001). Maximum allowable pressures during directional drillings focused on sand. Delft Geotechnics Thesis Paper: 23-32, Appendices Lugar H.J., Hergarden H.J.A.M. (1988). Directional drilling in soft soil; influence of mud pressures, Proc., ISTT-No Dig, 1998, Washington D.C., Paper 6B: 1-7. Staheli, K., Bennett, D., Hurley, T., O Donnell, H.W. (1998). Installation of pipelines beneath levees using horizontal directional drilling. Pipeline Research Council International, Inc., Paper CPAR-GL
48 Van Brussel, G.G., Hergarden, H.J.A.M. (1997). Research (CPAR) program: Installation of pipelines beneath levees using horizontal directional drilling. SO /2. Department of Foundations and Underground Engineering, Delft Geotechnics, Vesić, A.S. (1972). Expansion of cavities in infinite soil mass. ASCE Journal of the Soil Mechanics and Foundations Division, Vol. 98: Yu, H.S., Houlsby, G.T. (1991). Finite cavity expansion in dilatant soils: loading analysis, Geotechnique, Vol. 41(2): Yu, H.S. (2000). Cavity Expansion Methods in Geomechanics. Kluwer Academic Publishers,
49 CHAPTER 3 NUMERICAL ANALYSIS 3.1 INTRODUCTION Two-dimensional finite element numerical analyses were carried out in order to provide refinement to the existing numerical models based on the results of the laboratory experiments and to investigate the effectiveness of a two-dimensional plane strain numerical model to estimate the maximum allowable mud pressures during HDD applications. One of the purposes of the numerical analyses was to refine previously presented models. Kennedy et al. (2004a,b; 2006) present material for the development of a two-dimensional finite element analysis which investigated the effectiveness of the discussed model with respect to previously reported closed-form solutions (Obert and Duval, 1967) and the current state-of-the-art practice used for estimating the limiting mud pressure for horizontal boreholes within a continuous medium (Lugar and Hergarden, 1988). The work by Kennedy et al. (2004a) demonstrated that the mesh he developed was adequate to provide a reasonable approximation of an actual material subjected to forces acting radially on the walls of a cavity. Kennedy et al. reported that the mesh that they developed along with the methodology used to apply the internal fluid pressure resulted in peak tangential stresses that were within 1% of the closed-form solution provided by Obert and Duval (1967). In his analyses, Kennedy et al. (2004a) compared tangential stresses at the crown and invert of the borehole calculated using the finite element analyses, elastic plate theory, and plasticity theory for purely frictional and purely cohesive materials. Equations based on purely frictional strength provided results for tangential stress that matched the finite element calculations for a pure sand system 36
50 collapsing inward at low fluid pressures, and expanding outwards at high fluid pressures, (Kennedy et al. 2004a; 2006). The numerical model that was used for this research was identical to the model developed by Kennedy et al. (2004a; 2006). As a result, a description of the mesh development, refinement and loading methodology will not be provided in this dissertation. For complete details of the mesh refinement and loading methodology please refer to the two refereed journal papers published by Kennedy et al. in The sole purpose of the numerical analysis was to examine the effect of the filtercake on the strength of the borehole and to provide estimated results that could be used for comparison with the laboratory experiments reported in the following chapters. The analyses presented in this chapter used the numerical model developed by Kennedy et al. (2004a,b; 2006), and improved upon the material properties based on physical data, which will be discussed in the following chapter. These analyses also consider the physical interaction between the drilling fluid with the host material. The model also takes into account that failure within a borehole advanced into a frictional material may occur in a different manner than presented by Kennedy et al. (2006). Kennedy investigated the possibility that borehole failure occurs when the compressive hoop stress surrounding the borehole is reduced to a tensile state as the borehole expands as a result of the internal pressure. The hoop stress is gradually reduced as the internal pressure increases, and cracking along either the obvert or springlines of the borehole occurs when the hoop stress reaches a tensile state. The analysis presented in this chapter approach the problem in a similar manner to the one presented by Moore (2005). Moore discusses a numerical analysis of a purely cohesive medium that undergoes shear failure as a result of the expansion of the internal cavity. Moore shows that as the internally applied forces increase, the radius of the plastic zone increases in a nearly radial manner to approximately two thirds of the depth of cover 37
51 over the borehole. At this point the plastic radius begins to move towards the ground surface, approximately towards one o clock. Like that of Kennedy et al. (2006), the present analysis considers the impact of the filtercake surrounding the borehole during loading. The major difference between these two models is that Kennedy assumes that the filtercake material reacts more like a soft clay due to the infiltration of the bentonite slurry, whereas the physical property testing carried out as part of this investigation indicated that the physical properties of the filtercake material did not change much from that of the host sand. As a result of these findings, the filtercake material was modelled assuming that the material was very similar to that of the host sand with only minor changes in the unit weight and the undrained shear strength, though the last assumption was not confirmed with additional strength testing. The results of physical testing of the filtercake are discussed later in Chapter 4 (Section 4.2.2). The last analysis performed in the current study focused on the impact of a layered granular soil. To date there is no known research considering a case similar to that of a typical roadbase where a dense, freely draining granular material is placed on the surface of native sand material. At the onset of this investigation, it was unclear how to assess the effectiveness of the model or even how the boundary conditions occurring at the soil interface would impact the outcome of the numerical model. It was seen as an important topic to investigate because a large number of directionally drilled boreholes are advanced below roadways so that pipelines installed below roadways would not directly impact the service of the roadway above as would be the case with conventional open cut methods. 38
52 3.2 NUMERICAL MODEL The numerical analysis was carried out using a two-dimensional finite element analysis program AFENA, originally developed by Carter (1992). The structure of the model used in this investigation consisted of one that was previously developed by Kennedy et al. (2004a,b; 2006), where verification of the numerical model was provided using the closed-form solution of an existing cavity within an infinite medium (Obert and Duval, 1958). The structure of the model was developed using several assumptions: That the length of the borehole is sufficiently longer than its cross section and may be assumed to be representative of plane strain conditions; That the distance to the boundaries in the horizontal and vertical directions was sufficiently large to avoid any effect on the overall performance of the model; To minimize the time necessary for processing, the mesh was assumed to be symmetric along the vertical axis and the redundant half was not considered. The vertical boundaries were considered to resist displacement in the horizontal direction but permitted displacement in the vertical direction. The base of the model was fixed to resist displacements in both the horizontal and vertical directions; The elements were modelled assuming an elasto-plastic, non-associated frictionalcohesive material that followed the Mohr-Coulomb failure criterion after the onset of yield. The soil structure was modelled in two steps to allow for the effects of gravity in the first step. The borehole was then excavated in the second step, at which time the reaction forces at the nodes around the circumference of the borehole were calculated. It is assumed that during loading, the elements respond elastically until reaching yield as provided by the Mohr-Coulomb criterion. Once yield has occurred, the elements are considered to have experienced shear failure and they respond elastic/plastically. All 39
53 other elements outside the radius of the plastic zone that have not yet failed are considered to remain in an elastic state; It is possible to evaluate the results of the numerical model using those obtained from the cavity expansion theory of an elastic-perfectly plastic, non-associated frictional-cohesive material developed by Yu et al. (1991). Comparisons were also made with the current state-of-the-art method for estimating the maximum internal mud pressure for directionally drilled boreholes (Van Brussel et al. 1997). The thickness of the filtercake simulated in these analyses could not be modelled to increase with time as loading occurred due to the limitations of the finite element analysis software that was used during this study. To compensate for this shortcoming, the filtercake was modelled as existing within the soil mass prior to excavation of the borehole. This is may be initially considered an inaccurate assumption, however the physical property tests carried out on the filtercake material described in Chapter 4 (Section 4.2.2) indicate that the filtercake and the host soil are very similar in composition with only minor differences in terms of the hydraulic conductivity and gradation. Based on this assumption, the filtercake was modelled with four different thicknesses and the internal pressure was obtained from each in incremental stages and the results compared to the various theoretical models. It was felt that the similarities between the two materials justified the decision to model the filtercake in place prior to the excavation of the borehole. Finally, the dimensions of the model were configured similar to that of the larger-scale tests. This was chosen so that calculations could be made to indicate the potential for boundary condition impacts in the experiments. The depth of the soil was chosen to be 1.5m deep from the surface of 40
54 the soil to the base of the model, the width of the mesh was designed to be 1m from the centreline of the borehole, the radius of the borehole was modelled as 55mm and was positioned exactly halfway to the ground surface from the base of the mesh. The larger-scale experiments were modelled assuming that the full depth of the test pit is filled with the sand and another case was considered with the upper 300mm filled with a very dense, well graded granular material. The results of the ultimate internal pressures and the surficial ground displacements of the model were then compared with those obtained from the larger-scale tests for both the layered and the nonlayered cases which will be discussed further in subsequent chapters. 3.3 SOIL PROPERTIES The properties of the soil were selected based on the results of the physical property tests carried out on both the native sand and representative samples of the filtercake material reported in Chapter 4 (Section 4.2.2). Though there are inherent limitations regarding the assumptions leading to the information obtained from standard laboratory tests, they do tend to give reasonable estimates of the desired parameters. Any remaining properties that were not obtained directly from laboratory tests were estimated based on typical values as presented in the Canadian Foundation Engineering Manual, 4 th Edition, (2006) and Foundation Engineering and Analysis (Bowles, 1996). The properties of the materials used in the various cases are shown below in Table
55 Material Properties - Filtercake Investigation Material Name Unit Weight - γ (kn/m 3 ) Friction Angle - φ (º) Cohesion (kpa) Lateral Earth Pressure (K o ) Dilation Angle - (Ψ) (º) Young's Modulus (kpa) Host Sand Filtercake Drilling Mud Table 3.1 Soil parameters used in preliminary numerical analyses The host soil is considered to represent the native (not impacted by drilling fluid) sand material that was used for both the small and larger-scale experiments. The filtercake parameters were selected based on the results from representative samples of the filtercake recovered from the smaller-scale experiments. Finally the properties of the granular material used in the layered case were assumed from typical values as given in the CFEM, 4 th Edition, (2006). The selection of the physical parameters of the drilling fluid were selected to represent a solid though it is in fact a liquid in order to calculate the resultant forces acting on the sidewalls of the borehole during loading. The material properties of the mud were not used in any other part of the analysis. Details of the calculation of the resultant forces are provided by Kennedy et al. (2004a; 2006). 3.4 AFENA METHODOLOGY The methods employed in these numerical analyses were first developed by Kennedy et al. (2004a,b; 2006) and involved the incremental loading of the borehole radially to failure. The depth of the drilling fluid pressure was linearly varied starting from the initial geostatic reaction 42
56 forces exerted on the face of the borehole following excavation, up to a maximum mud pressure considered likely based on other cavity expansion theories. The size of the loading increments was such that dynamic affects from loading may be neglected. Once the algorithm was completed, the results of the model were examined in a post processor, and the radius of the plastic zone was manually searched. The manual searching of the plastic radius was completed in the post processor by selecting a number of integration points which had yielded and determining the coordinates of that point and then back calculating the radius from the borehole to that point. To ensure that the largest radius for each increment was identified, several integration points were obtained and only the maximum radius was considered. The surficial displacements were obtained directly from the output of the model. 3.5 RESULTS SINGLE LAYER VARIABLE FILTERCAKE THICKNESS To test the effectiveness of the analysis, the case of the sand alone was modelled, and no filtercake thickness was considered. Ideally, the results would be similar to those provided by the Delft equation as shown by Kennedy (2006) provided that K o was kept equal to 1. It can be seen in Figure 3.1 that the results obtained by Lugar and Hergarden (1988) and Van Brussel et al. (1997) differed by about 6% which is close to the findings reported by Kennedy et al. (2004a). At higher internal pressures, the two numerical models tended to deviate slightly more with a percent difference of around 15%. 43
57 20 18 Yu & Houlby No Filtercake 2cm Filtercake 3cm Filtercake 4cm Filtercake 5cm filtercake Yu & Houlsby Delf t Line of best fit Delft Solution P i /P o 0 R p /R o Figure 3.1 Normalized plastic radius vs normalized internal mud pressure 44
58 Following validation of the model compared to previous research, the material with characteristics similar to the filtercake observed during the smaller-scale experiments (see Section 4.2.2) was added around the circumference of the borehole. The filtercake material could not be modelled dynamically so that the radius of the filtercake expanded as the fluid pressure increased, and therefore the filtercake was modelled as though it was present within the soil mass prior to the excavation of the borehole. The thickness of the filtercake was varied by changing the material types of the appropriate integration points within the mesh file. The thicker the filtercake became, the more angled the corners of the filtercake became and the radius of the filtercake was limited to a nearly circular shape. The filtercake lost its circular shape with distance from the centre of the borehole as a result of the mesh refinement. The increased mesh density resulted in a more circular shape when compared to regions of the mesh that were less refined. The results of the numerical analyses investigating the effect of the filtercake thickness were reported as the plastic radius normalised by the initial borehole radius (R p /R o ) versus the radial pressure acting on the face of the borehole normalised by the initial vertical stress (P i /P o ). It is expected that with increased thickness in the filtercake, the borehole strength would increase and subsequently the plastic radius should expand more slowly with respect to the applied internal pressure. It can be seen in Figure 3.1 that the overall increase in strength of the material is observed to be negligible with an increase in the filtercake thickness. The lack of physical improvement is due to the fact that there is very little change in the physical characteristics between the filtercake and the host sand materials as discussed in Chapter 4 (Section 4.2.2). It is also possible that the radius of the plastic zone is similar for each filtercake thickness because the monitoring of the plastic radius is somewhat limited. The length of the radius can only be tracked to the nearest integration point and might not represent the exact plastic radius for that internal pressure, which might explain why so many of the radius points are similar. 45
59 Based on the results of the numerical analyses to determine the effect of the filtercake on the overall strength of the borehole, it is clear the extra strength added by the growth of the filtercake is minimal and likely does not contribute much to the total resistance of the borehole to hydrofracture. Previous numerical analyses (Kennedy et al. 2004a,b; 2006) assumed that the filtercake material contributed significantly to the resistance of the borehole against hydrofracture, however, this made use of the assumption that the bentonite slurry dramatically increased the cohesion of the sand. It was assumed by Kennedy that the filtercake responded more like a soft clay rather than a frictional material with a low apparent cohesion, similar to a well cemented silty fine sand. As previously stated, this assumption was not confirmed by the physical property tests. It is recommended that additional strength testing be carried out to determine the actual changes to the undrained shear strength as a result of infiltration of the bentonite drilling slurry. Pore pressures were not modelled during this investigation, though based on the significant changes with respect to the permeability of the filtercake it is likely to be a significant factor in the failure of boreholes. Clough et al. (1983); Finno and Clough (1985) and later Yi et al. (1993) reported the changes in the pore pressures with distance from slurry shields in tunnels excavated with a pressure balanced slurry shield. It is well documented that the use of pressurized slurries increases the pore pressures in the immediate area surrounding the borehole or tunnel. Yi et al. (1993) showed using a numerical model that the pore pressures dissipate rapidly with distance form the centreline of the tunnel. Considering a short duration for the accumulation of the pore pressures (0.74 days) Yi et al. (1993) showed that the pore pressures were equal to zero at a distance approximately equal to one tunnel diameter. Pore pressures were not modelled because the laboratory experiments used to classify the changes in the material properties were conducted 46
60 after the numerical modelling was completed. The assumption of a lack of pore pressure accumulation is not considered conservative. Clearly as the pore pressures within the sand accumulate during the application of the drill fluid, the effective stress of the surrounding material would quickly reduce to zero resulting in the onset of the premature failure of the borehole. In future numerical models it should be essential to model the excess pore pressures associated with pressurized drilling slurries around the borehole NUMERICAL MODEL OF LARGE SCALE EXPERIMENTS In addition to the model refinement, numerical analyses were carried out to evaluate the existing models by comparing similar plane strain numerical models with actual laboratory experiments with identical boundary conditions and similar physical characteristics. The boundaries of the model were designed to represent those of the large pit in which the larger-scale experiments were conducted. The mesh was comprised of a vertical depth from the ground surface to the base of the soil deposit of 1.5m, and a width of 1m from the centreline of the borehole to the sidewall boundary. The mesh was cut vertically down the centre and half of the system was not considered due to symmetry. The conditions at the boundaries were set such that the sidewalls would allow vertical translation but resist any horizontal displacements. The boundary at the base was fixed and resisted both horizontal and vertical displacements. The borehole was modelled as 55mm in diameter and was positioned halfway from the base of the soil along the centreline of the mesh. A screenshot showing an example of the mesh used for these numerical analyses is provided in Figure

61 Free surface Resists horizontal displacements; Free to translate vertically. Resists horizontal displacements; Free to translate vertically. Fixed Figure 3.2 Layered mesh used during laboratory experiment numerical analyses To investigate the accuracy of the numerical analyses, when compared with the laboratory experiments discussed in subsequent chapters, two separate cases were considered. The first case assigned all of the elements material properties similar to that of the sand. The second case considered a mesh composed of elements assigned material properties similar to a very dense granular material in the upper 300mm overlying the host sand with properties identical to the first case. Material parameters selected for the numerical analyses were similar to those observed during the placement and compaction of the larger-scale single and dual layer experiments. The parameters selected to represent the various materials are shown below in Table 3.2. The reaction forces surrounding the borehole following excavation were calculated and the resultant forces were applied radially to the sidewalls of the borehole in a similar fashion to that of the model discussed in the previous section. 48
62 Material Properties - Layered Investigation Material Name Unit Weight - γ (kn/m 3 ) Friction Angle - φ (º) Cohesion (kpa) Lateral Earth Pressure (K o ) Dilation Angle - (Ψ) (º) Young's Modulus (kpa) Host Sand Granular Drilling Mud Table 3.2 Material parameters for the laboratory experiments numerical analyses In this section the results will simply be summarized, since a detailed comparison of the results of the various numerical analyses and the larger-scale laboratory experiments are presented in subsequent chapters. Observations of the nature of the growth of the plastic radius in the sand case indicate that the plastic radius expands more or less radially to a depth of approximately two thirds of the distance from the crown of the borehole and the ground surface. At this time, the radius tends to migrate nearly vertically from a line drawn at 45º from the centreline of the borehole. It is at this point that failure is considered to have occurred as the model tends to become unstable under additional loading. These observations were very similar to those made for uniform materials by Van Brussel et al. (1997) and Kennedy et al. (2004b; 2006). Similar observations were also made during numerical analyses for a purely cohesive material under similar load conditions as reported by Moore (2005). Images demonstrating the incremental growth of the plastic radius considering the sand only are shown in Figures 3.3 to 3.7. The dots shown on the integration points represent a node that has reached the yield point. 49


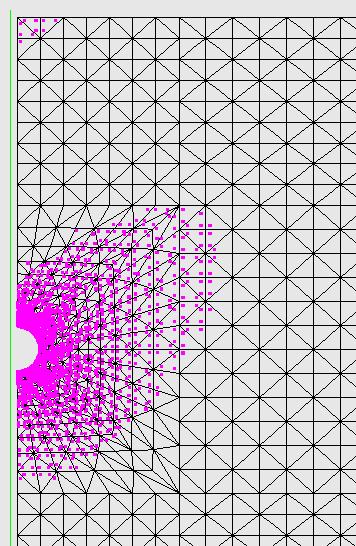
63 Figure 3.3 Plastic radius at 20 kpa Figure 3.4 Plastic radius at 40 kpa Figure 3.5 Plastic radius at 60 kpa Figure 3.6 Plastic radius at 80 kpa 50

64 Figure 3.7 Plastic radius at 95 kpa The two layered system was observed to result in much more interesting results as shown in Figures 3.8 to Observations of the growth of the plastic radius in the two layered system indicated that until contact is made with the interface of the sand and the granular materials, the model responds similarly to that of the sand alone. The images provided below indicate that the plastic radius migrates away from the borehole in a nearly radial fashion until approximately one half of the distance between the crown of the borehole and the granular A interface. Once this point has been reached, the plastic zone begins to move nearly vertically to the soil interface which is similar to the results observed in the sand only model. At the point of contact, however, the plastic radius extends through the layered material to the surface of the mesh in a much narrower area. The trend is shown below in Figure It can be clearly seen that the growth of the plastic zone is towards the surface of the mesh, however the pressure is concentrated into a much smaller area than that of the sand only where the plastic radius moves almost uniformly to 51


65 the surface. The incremental growth of the plastic zone for the layered numerical analysis is shown below in a series of images labelled as Figures 3.8 to As before, the dots represent the yielded nodes. High density material High density material Figure 3.8 Plastic radius at 25 kpa Figure 3.9 Plastic radius at 50 kpa High density material High density material Figure 3.10 Plastic radius at 75 kpa Figure 3.11 Plastic radius at 100 kpa 52

66 High density material Figure 3.12 Plastic radius at 130 kpa 3.6 CONCLUSIONS Based on the results of the numerical analyses designed to investigate the contribution of the filtercake to the overall borehole strength with respect to resistance to hydrofracture or blowout, the following conclusions may be drawn: First, it is still unclear as to the extent that the filtercake contributes to the borehole s ability to resist against blowout or tensile cracking. Though the parameters have been refined using physical data obtained from laboratory testing designed to determine the changes in the physical characteristics of the host material once impacted with drilling fluid, the actual changes in the undrained shear strength parameters still remain unknown. Refinement of the numerical analyses will be required considering a three-dimensional mesh that can dynamically model the growth of the filtercake and pore pressures with 53
67 time. The effects of this anomaly cannot be accurately modelled assuming a twodimensional plane strain case; It also appears that the ability of the borehole to resist against blowout is not influenced by the growth of the filtercake; calculations presented here did not indicate any significant resistance of the growth of the plastic radius with an increase in filtercake thickness; The results of the layered model indicated that the movement of the plastic radius was very similar to that of the sand case. The plastic zone was observed to extend radially out from the annulus of the borehole to a depth of approximately half the distance from the crown of the borehole to the interface of the Granular A material. It was at this point that the plastic zone began to move towards the one o clock position until contact was made with the overlying very dense material. Once the plastic zone came into contact with the higher strength material overlying the native sand, the plastic zone began to move vertically towards the surface of the mesh. Within the very dense Granular A material the plastic zone was observed to become significantly narrower than that of the zone within the sand indicating a concentration of stress within the higher strength material. The results of the numerical analysis and the observations obtained from the larger-scale experiments are discussed in detail in Chapter 5. It is suggested that future investigations consider the use of direct shear and consolidated undrained isotropic (CIU) tri-axial testing on the filtercake material to provide a more detailed idea of the change in the host material strength and the development of pore pressures. 54
68 REFERENCES Bowles, J.E. (1995). Foundation Analysis and Design. Fifth Edition. McGraw-Hill, New York, New York. page 100. Canadian Geotechnical Society. (2006). Canadian Foundation Engineering Manual (CFEM). Fourth Edition. Technical Committee of Foundations, Richmond, British Columbia. pages Carter, J.P. (1992). PROGRAM AFENA: A general finite element algorithm, University of Sydney. Clough, G.W., Sweeney, B.P., Finno, R.J. (1983). Measure soil response to EPB shield tunnelling. ASCE Journal of Geotechnical Engineering, Vol. 109: Finno, R.J., Clough, G.W. (1985). Evaluation of soil response to EPB shield tunnelling. ASCE Journal of Geotechnical Engineering, Vol. 111(2): Kennedy, M. J., Skinner, G. D., and Moore, I. D. (2006). Development of tensile hoop stress during horizontal directional drilling though sand. ASCE International Journal of Geomechanics, Vol. 6(5): Lugar H.J., Hergarden H.J.A.M. (1988). Directional drilling in soft soil; influence of mud pressures, Proc., ISTT-No Dig, 1998, Washington D.C., Paper 6B: 1-7. Moore, I.D. (2005). Analysis of ground fracture due to excessive mud pressure. Proc., 2005 North American No-Dig Conf., Orlando, Paper No. C
69 Obert, L., and Duval, W. I. (1967). Rock Mechanics and the Design of Structures in Rock, Wiley, New York, Van Brussel, G.G., Hergarden, H.J.A.M. (1997). Research (CPAR) program: Installation of pipelines beneath levees using horizontal directional drilling. SO /2. Department of Foundations and Underground Engineering, Delft Geotechnics, Yi, X., Lee, K.M., Rowe, R.K. (1993). Observed and calculated pore pressures and deformations induced by an earth balance shield. Canadian Geotechnical Journal, Vol. 30: Yu, H.S., Houlsby, G.T. (1991). Finite cavity expansion in dilatant soils: loading analysis, Geotechnique, Vol. 41(2): Yu, H.S. (2000). Cavity Expansion Methods in Geomechanics. Kluwer Academic Publishers,
70 CHAPTER 4 SMALLER-SCALE EXPERIMENTS 4.1 INTRODUCTION Research by the U.S. Army Corps of Engineers (Conroy et al. 2002a,b) and academic institutions interested in protecting infrastructure from the damage incurred from hydrofracture in cohesionless deposits as a result of directional drilling have shown a need to validate previous analytical research. To date, a series of numerical models have been developed that were designed to explain the nature of hydrofracture in cohesionless deposits and help design engineers minimize the risks involved with horizontally directionally drilled boreholes. The method for estimating the maximum allowable mud pressure recommended by the US Army Corp of Engineers was developed at the Delft Institute in the Netherlands and is commonly referred to as the Delft solution (Van Brussel et al. 1997). The Delft solution assumes that where the pressurization of the drill fluid become greater than the shear strength of the soil, the borehole undergoes a nearly balloon-like cavity expansion as a result of the radial loading of the borehole. The solution is developed based on a modified version of the previously existing cavity expansion solution provided by Vesić (1972) for an existing spherical (and cylindrical) cavity expansion in elastic perfectly plastic material with the onset of yield defined by the Mohr-Coulomb criterion. Vesić (1972) and therefore Van Brussel et al. (1997) did not account for the angle of dilation in their solution and so neglected the volume change of the native material during shear. Carter et al. (1986) developed a cavity expansion theory which considered a fictional-cohesive material that followed the Mohr-Coulomb criterion. However the volume change following the onset of yield was estimated based on an associated flow rule (the angle of dilation is considered to be equal to the angle of internal friction). In most 57
71 cases, the assumption of an associated flow rule (dilation angle equal to friction angle) tends to over estimate the volume increase of the material during shear and can result in inaccurate estimations of the ultimate internal pressure. In 1991, Yu and Houlsby developed a theory that, like the Carter solution, accounted for volume change, but using a dilation angle different from the friction angle (a non-associated flow rule) in the calculations. Recently, investigations employing two-dimensional finite element analyses have been reported to help explain the phenomenon of hydrofracture which occurs during internal loading of a horizontally drilled borehole. Kennedy et al. (2004a,b; 2006) presented numerical models showing that the borehole undergoes reductions in compressive hoop stresses in the soil around the borehole, as the internally applied radial pressure increases. The borehole walls expand and ultimately reduce the hoop stress from a compressive to a tensile state. Kennedy et al. (2004a,b; 2006) presented numerical results for both sands and clays. Moore (2005) undertook similar numerical modeling for purely cohesive material. The purpose of his investigation was to analyse the nature of yield within the host material and the propagation of the plastic zone as shear failure occurs. While field experience demonstrates the potential for serious repercussions (e.g. mud-loss) related to hydrofracture occurring during horizontally directionally drilling of boreholes, there has been a dearth of physical research carried out to date. It is clear, therefore, that there is a need for laboratory experiments designed to investigate the formation of hydrofractures. This chapter presents the methodology and outcomes of a preliminary investigation using smaller-scale laboratory tests conducted in a uniformly (poorly) graded sand. The laboratory experiments were conducted in four stages and are as follows: 58
72 Stage 1 - Placement of the soil in the cell. The soil was placed from a height approximately 1.5m above the base of the cell in 200mm loose lifts and manually compacted until the soil reached the top of the cell; Stage 2 - Application of the overburden pressure. Using a hydraulically controlled actuator, a vertical force was applied to the surface of the soil and held for a short period of time. The soil was over-consolidated to further compact the sand and to establish a stress history similar to those typically observed in the field. Following the application of the overburden pressure, the force was reduced in preparation for the experiment; Stage 3 Excavation of the borehole. The borehole was advanced using a specially designed Shelby tube in order to create a borehole with consistent dimensions from test to test; and Stage 4 Application of the internal mud pressure. The borehole was loaded by pressurizing a pre-mixed bentonite drilling slurry until mud loss was observed at the surface of the soil. These stages will be described in greater detail in subsequent sections. Following the description of the apparatus and the instrumentation used for these experiments, the test methods will be discussed and a comparison of the experimental results with both the theoretical and analytical results will be made. Finally, recommendations for additional investigations and an associated monitoring program are provided. 59
73 4.2 TEST APPARATUS BIAXIAL CELL FRAME The smaller-scale test cell ( the cell ) consisted of a 320mm wide by 800mm long by 780mm deep, reinforced steel frame. Drawings of the cell in both plan and profile are shown below in Figure 4.1 and a photo of the loading frame, actuator and test cell is presented in Figure 4.2. The two side walls of the cell were lined with a high strength, clear plastic (Lexan). One end-wall featured a similar Lexan sheet containing a 45mm diameter hole to form the start of the borehole, while the other end wall and the base of the cell were composed of exposed steel plates and were covered with a greased plastic coating to reduce friction at these interfaces (the friction treatment scheme of Tognon et al. 1999). The plastic treatment was not placed on the walls of Lexan because of the excessive damage which occurred to the treatment during the manual compaction of the sand material (exacerbated by the limited size of the cell). By not using the plastic treatment, it was understood that additional stresses could accumulate at the sidewalls during loading as a result of the increased friction at the interface between the sand and the Lexan. It was felt at the time of the experiments that should the plastic zone actually come in contact with the sidewalls, the boundary conditions associated with the friction at the wall interface would be minimal compared to the resistance to expansion of the plastic zone. The cell was then mounted with brackets to the base of a 2.7m high actuator frame. This mounting was used to prevent the cell from sliding off the actuator frame during loading. 60
74 Plan view Profile view End view Figure 4.1 Schematic of the biaxial cell construction 61

75 Actuator Wooden Blocks Load Cell Threaded Loading Plate Loading Platen Inflatable Packer Figure 4.2 Test apparatus configuration One test objective was to examine mud loss from boreholes at different cover depths. This was simulated by applying different magnitudes of overburden pressure to the surface of the test soil, using vertical force generated by a hydraulic actuator. The actuator, fitted with a 100kN load cell, was vertically mounted from the top cross bar of the frame, so that the force acted down onto the surface of the soil in the cell. At full stroke (actuator piston fully extended), the clearance of the load cell above the top of the cell was approximately 50mm. The space between the actuator and the ground surface was fitted with a load-spreading system, to transmit an approximately uniform load to the soil. This was comprised of three hardwood loading blocks placed directly onto the surface of the sand, Figure 4.2. On top of the hardwood blocks, a steel loading frame was added to transfer the load from the actuator to the wooden blocks, Figure 4.2. The rotation of the 62
76 loading platen was visually observed and measured with the placement of a level in several locations on the surface of the loading platen. The rotation of the platen was corrected during loading by removing the load, and placing additional material in the area of excessive settlement to ensure that in fact the load was applied as uniformly as possible. Finally, a threaded loading plate was added to the base of the actuator providing an additional 50mm of separation as indicated in Figure 4.2. The surface loading scheme used in this preliminary experimental program was effectively one of almost uniform deformation, rather than uniform pressure. Vertical pressures were likely somewhat higher directly adjacent to the walls of the cell, and may have been higher or lower over the borehole (borehole geometry and construction is described subsequently in Section 4.2.4), depending on whether the borehole was empty or full of pressurized mud. However, since the borehole was approximately 8 diameters below the top surface of the sand, the overburden pressure for these preliminary tests will be interpreted as if it were uniform COHESIONLESS TEST MATERIAL HYDROSAND The material used for these tests came in three separate loads from a gravel pit local to the Kingston area. Physical property testing was undertaken on two representative samples collected from two of the loads to establish the degree of physical similarity between the various samples and testing dates. Grain size analysis curves are provided as Figure 4.3 below. The grain size curves indicate the consistent distribution of grain sizes observed within two representative samples recovered after testing. 63
77 Figure 4.3 Grain size distributions of test soil and filtercake 64
78 Because bentonite materials are regularly used in the drilling industry to seal boreholes following the completion of a drilling program or to help provide additional attenuation to leachate migration in engineered landfills, tests to determine the changes in the coefficient of permeability (k) were conducted. Testing was carried out as part of this investigation once it was found that the increase in clay particles was only around 3% when compared to the unaffected sand. Bentonite is typically selected as a seal/attenuation layer for its ability to swell and its extremely low hydraulic conductivity when hydrated. It can swell up to 15% of its original size and absorb around 4 to 5 times its own weight in water and is readily purchased in an un-hydrated state. It stands to reason that the use of a bentonite slurry would dramatically reduce the permeability of the native sand once affected. The results of the permeability testing conducted on the unaffected sand and the filtercake indicated the most significant changes due to the injection of the bentonite slurry. The coefficient of permeability (k) for the sand used in the smaller-scale experiments was measured using constant head test methods as specified in ASTM D (2006). Two tests were carried out, one on the native unaffected sand and the other on the recovered filtercake material. The k values obtained from the two tests indicated that there was a significant change in the hydraulic conductivity of the material following injection of the bentonite slurry. The k value of the sand was reported to be 3.2x10⁻³ cm/s while the k value of the filtercake material was found to be 7.0x10⁻⁶ cm/s or an increase of nearly 200%. Due to the significant change in the permeability of the sand once affected by the bentonite slurry, it is likely that pore pressures can develop in the areas close to the borehole and can significantly impact the effective strength of the surrounding material. 65
79 As part of the testing of the sand to determine the physical characteristics of the hydrosand used during the laboratory experiments, standard Proctor tests were conducted on the sand to determine the standard Proctor maximum dry density (SPMDD) and the optimum moisture content (OMC) for compaction quality control. The results of the standard Proctor indicated that the SPMDD of the sand was approximately 1750kg/m 3 with an OMC of 6.2%. Due to the spatial constraints provided by the cell frame, the sand was placed by hand into the cell from a height of approximately 1.5m above the top of the cell in 200mm loose lifts and compacted by hand using a steel plate attached to the end of a metal handle. A photo of the hand tamper used to compact the sand material is shown below in Figure 4.4. The actual compaction resulting from the air pluviation was minor and additional compaction was required in each case. The sand was placed and compacted until it reached a level approximately 25mm below the top of the cell frame. The relative density of the test sand was estimated based on the results of a standard Proctor test assuming that optimal compaction was achieved. As the typical density testing methods require the removal of soil (nuclear gauge or sand cone), no in situ density testing could be carried out without potentially compromising the integrity of the experiments. It was also extremely difficult to reach the base of the cell considering the spatial constraints, adding further difficulty to obtaining the relative density of the sand using a sand cone. During the placement of test soil for one experiment the relative density was tested using a nuclear gauge. The result of the nuclear test was considered spurious because it indicated a relative density of approximately 1925kg/m 3 well above the standard Proctor maximum dry density. It is likely that the result of the nuclear test was influenced by the proximity of the steel walls comprising the test cell. It was at this point that the wooden loading blocks and steel platen were placed prior to the application of the load. 66
80 The scale of the smaller-scale laboratory experiments was similar to that of smaller diameter pipeline installations like fibre optic cables or smaller diameter pressurized watermains through clean, poorly graded sands. The borehole diameter of 45mm is considered to be scaled from 0.45:1 since most small utility drill heads are approximately 100mm in diameter. The depth of the borehole was scaled to be approximately 0.5:1 to 1:1 considering a typical depth of pipeline installation of approximately 1.5m below the ground surface. The scale of the fluid pressure was considered to be 1:1 because the displacement pump used in the experiments is identical to those used in the drilling industry. Since the strength the soil is a function of the stress state, and this is controlled by the depth of burial, these test parameters are consistent with the prototype, because the depth is consistent. The rate of fluid application was the only portion of the experiments that the scale was not reasonably quantifiable. The rate of application was very difficult to control during the experiments and typically resulted in a breach of the surface of the soil of drilling fluid within ten to twenty seconds. In full scale directional drilling projects, the duration of time that passes between the start of drilling and when the failure occurs in horizontal boreholes is difficult to quantify though likely on the order of minutes. The rate of drilling fluid application is considered to be approximately 1:1 when compared to full scale drilling projects as the equipment used during the experiments was identical to that used in the field. The rate of application is also considered similar because, once the flow of the fluid into the borehole has been established, the flow through the drill string would be the same as that through the test apparatus. There is however a significant difference in terms of the application of the fluid pressure on the walls of the borehole. In the smaller-scale experiments, the fluid pressure is a result of the displacement pump alone while in the field, the fluid pressure is a combination of the pumped fluid pressure and the height of the column of fluid above the end of the borehole. The height of the column of 67
81 fluid is highly variable in the field depending on the depth of the utility installation. Considering the scale of the installation of the smaller diameter utilities as described above, the pressure resulting from the column of fluid would be approximately 5 to 15% of the total failure pressure when considering a depth of installation of 1.5m below the ground surface. Without question, the incremental volume applied by the displacement pump during the experiment is a much greater proportion of the initial volume of the mud in the borehole compared to field conditions. The reduced scale of the borehole diameter will influence the peak fluid pressure, based on consideration of the cavity expansion theory given in Chapter 2 (Equation 2.1). However, comparisons of measured strength (peak fluid pressures) are made to theories based on the experimental dimensions, not field dimensions. Therefore, efficacy of those calculation procedures will be effectively determined even though field strengths are lower. 68

82 Figure 4.4 Hand tamper for manual compaction APPLICATION OF SIMULATED OVERBURDEN PRESSURE Once the sand and the loading plates were in place, the predetermined overburden pressure could then be applied by the actuator. The actuator that was used employed a 75mm stroke and could monitor applied loads up to a maximum load of 100kN. The actuator was connected to a manifold system, designed to control the flow into and out of the actuator as well as to provide an 69
83 additional safeguard against hydraulic fluid surges to the ram (actuator). A 125V, MTS 4801 controller was used to power the actuator in either stroke control (where the actuator has a defined displacement and load is measured), or in load control (where the piston is given a predetermined load and the deformation is measured). Finally a 20L/min, 3000psi hydraulic compressor was connected with the controller so that hydraulic power could be provided to the actuator. During the initial tests, additional static mechanical compaction was applied by placing a similar overburden pressure on the surface of the test soil. The rate of application of the vertical force by the MTS actuator to the loading platen was 2kN/min. The total load applied was monitored using the load cell and the MTS controller. The load was held at the prescribed value for a period ten minutes in each case to allow for compression of the sand. This time period was found sufficient for soil compression (associated with this static compaction) to be completed, as monitored by observing movement (stroke) of the actuator. During testing, the actuator was placed in load control so that the surface of the sand was free to move vertically. This was thought to be a realistic representation of the confining stresses that occur in the field during the application of the drilling fluid since in reality, there is no way to place additional load to the surface of the soil once displacement begins to occur. This is not to say that the application of a mechanical overburden pressure fully recreates geostatic stresses that would occur in the field. It is understood that the stress applied to the surface of the soil dissipated with depth and could not realistically re-create the effects of gravity acting on the soil mass. The method of the mechanical overburden pressure was selected because it provided a simple alternative to scale modelling in a centrifuge. The financial cost of conducting experiments in the centrifuge at C-Core in St. John s Newfoundland were thought of as too costly for preliminary 70
84 experiments that were unclear at the time whether the experiments would yield results. The use of the actuator did allow for development of the testing methodology considering the simple and relatively quick set up and removal of the application of the overburden pressure. Consideration was given to conducting several experiments at the testing facility. In order to develop the testing methods, it was thought that carrying out the bulk of the smaller-scale hydrofracture experiments at the facility at C-Core would have been too costly and might not end in results that were significantly different than those obtained from the experiments using the actuator to apply the mechanical overburden. It was also felt that once the majority of the smaller-scale experiments were completed additional, larger-scale experiments may yield results closer to those found in practice and did not warrant additional smaller-scale tests in a centrifuge. Several tests were carried out where stroke control was inadvertently used for the actuator. These tests were considered to be unsuccessful, since the ram resisted displacement of the soil surface, and so overburden pressure increased with time (uplift of the soil surface was prevented). This additional overburden stress would have altered the maximum recorded mud pressure BOREHOLE EXCAVATION Once the majority of the additional static compaction had occurred following the application of the load, and the initial internal stresses within the soil were established, the borehole was advanced. A 45mm borehole was advanced through the aperture in the Lexan at one end of the cell using a specially designed Shelby tube. To minimize disturbance to the test soil as a result of the borehole advancement, the Shelby tube was advanced by hand at a constant rate until refusal was achieved. Once refusal was encountered, the Shelby tube was extracted and the contents emptied. This process was continued until the desired borehole depth of 500mm had been 71
85 reached. Once the borehole was advanced, the soil specimen was complete and ready for installation of the downhole pressure transducer EXTENSION OF THE TEST CELL The use of pressure applied to the ground surface (at the top of the test cell) to simulate deeper burial depths might have influenced how the mud moved up through the sand since the pressurized mud could be expected to interact with and influence the pattern of stresses on the overlying surface. By confining the ground surface, the drilling fluid no longer has a distinct free surface to seek, This top surface boundary condition and the effects of the three dimensional borehole geometry and the side boundary conditions are discussed further later in this chapter. Therefore, a few tests were conducted using an extension to the test cell so that deeper boreholes could be examined without the use of the loading system (wooden blocks, steel platen, and actuator) to represent the weight of additional overlying soil. The intention was to compare these results with those obtained using overburden pressure to determine whether the surface pressure influenced the maximum downhole mud pressure. The depth of the cell was extended by 780mm by the addition of a solid steel frame that was specifically designed to allow for the placement of additional soils on top of the test cell. The extension box provided a unique opportunity to test the assumptions regarding the applied stresses associated with the hydraulic overburden pressure. The extension was clamped onto the top of the loading cell and filled with the compacted sand. Two tests were carried out with the sand filled to the surface of the extended box and one test was carried out with the extension box only partially filled. An image of the cell extension box is shown below in Figure


 resistance pressure transducers which were manufactured by")


86 Cell extension Compacted sand Lower cell Low pressure packer Figure 4.5 Configuration of the test cell extension DOWNHOLE PRESSURE TRANSDUCER A number of different pressure transducers were used for these experiments. For the duration of the laboratory experiments, two, 15V (excitation voltage) resistance pressure transducers which were manufactured by American Sensor Technologies (AST) were used. A photograph of the one of the pressure transducers used in these experiments is shown in Figure 4.6 below. The pressure transducers are part of the AST4000 stainless steel line of pressure transducers which provide an error of less than 0.5% of the maximum rated pressure. The pressure ranges of the transducers varied from 350kPa (50psi) up to 2070kPa (300psi). The output of the transducers was in the form of voltages ranging from 1 to 5V. The measured pressures were then calculated 73
87 using calibration records provided by the manufacturer and by calibrations carried out in the laboratory prior to each series of experiments. These pressure transducers required a continuous connection with a power source and data acquisition system in order to collect the measurements. The chosen sample rate for the resistance pressure transducers was 1000Hz so that the instantaneous loss of internal pressure could be captured fully. The output from readings at this frequency was averaged every 100 readings to minimize the noise associated with a high sample rate. The net sample rate of 10Hz was selected because an initial sample rate of 2Hz, used by the downhole data logger described below was found to be insufficient to fully capture the pressure accumulation and dissipation during the experiments. Because of the need to connect the pressure transducers physically with a computer/data acquisition system, difficulties with respect to maintaining a seal around the borehole were encountered and an alternative had to be provided until a solution could be developed. To overcome the complications associated with the wire connections posed by the high precision pressure transducers, three trial tests were carried out using a common groundwater level pressure transducer. The pressure transducer was a self contained, stainless steel pressure transducer designed for installation into vertical groundwater monitoring wells to monitor the changes in groundwater levels with time. The precision of the data collected by the self contained pressure transducer was related to the overall pressure range of the transducer and therefore was significantly less than that of the resistance pressure transducers; however as a means to test the experimental methodology, the information obtained by the datalogger was essential. Prior to use during the experiments, the pressure transducers were tested and calibrated for accuracy using a falling head apparatus typically used in the geotechnical field to determine the hydraulic conductivity (k value) of a compacted soil. 74

88 Signal cable Downhole pressure sensor Figure 4.6 Downhole resistance pressure transducer The groundwater pressure transducer was programmed to record pressure readings at 0.5sec increments. The pressure range of the groundwater datalogger varied from 0 to 100kPa. The datalogger was programmed and the data was downloaded using a USB optical connection port and commercially available software issued by the manufacturer (Solinst Canada, 2007). Following development of the test methods, the groundwater pressure transducer was replaced with a pressure transducer with a range of 0 to 345kPa (0 to 50psi). The previous difficulties of maintaining a seal around the signal cable were corrected with the use of a compression fitting around the signal cable located outside the borehole. The pressure transducer was calibrated every time it was disconnected from the data acquisition system using a controlled range of pressures with the corresponding output voltages recorded. The calibration curves were then used to calculate changes in pressure recorded during the course of the experiments based on the recorded voltages. 150mm of signal cable was left free on the downhole side of the packer to allow for drilling fluid to flow freely around the pressure transducer. This configuration of the 75
89 pressure transducer attached directly to a data acquisition system was used successfully for the remainder of the experiments. Since lateral earth pressures (K o ) were not monitored during the first series of experiments, questions remained regarding the impact of K o on hydrofracture pressures in sands. During the second set of experiments, specially designed pressure transducers were installed into the sidewall of the cell. The objectives for using the sidewall pressure transducers were to monitor the changes in the lateral earth pressures with respect to changes in the overburden pressures, and to monitor the lateral pressures exerted during radial loading of the borehole. It is part of the goal of this thesis to evaluate previously suggested analytical solutions and it is felt that by monitoring the K o values of the test soil, a more accurate model might be developed. Finally, it was thought from the onset of the experiments, that monitoring of the pore pressures throughout the test cell would be a key factor in determining when and how hydrofracture occurred. Through careful consideration, it was determined that pressure transducers designed to monitor the in situ pore pressures during testing could not be installed. It was felt that to ensure artificial flow paths were not developed to the ground surface, additional pressure transducers could not be placed at variable depths throughout the soil in the vicinity of the borehole. It is understood that by omitting this key aspect of the monitoring program, some information regarding the nature and formation of hydrofracture or blowout would not be collected and would be better left for either numerical or full-scale field experiments. 76
90 4.2.7 MEASUREMENT OF LATERAL EARTH PRESSURE To estimate the effect of lateral earth pressure on hydrofracture in cohesionless materials, the lateral earth pressures were monitored in two of the smaller-scale tests. Pressure cells or null gauges designed to monitor the lateral stresses acting on the sidewall of the cell were mounted to one side of the test cell. They were mounted at two different depths within the cell so that K o, and the pressure variation during mud application at various depths could be investigated. Monitoring of the lateral pressures was carried out from before the cells were covered with the sand material through to the completion of the test. Due to the complexity of using these cells, the lateral earth pressure cells were only used during these two smaller-scale experiments. The pressure cells were specifically designed to minimize errors related to soil arching or the shedding of stresses due to deflection of the pressure cell. To achieve this, the pressure cells were designed to provide an internal air pressure applied behind the face of the cell equal to the earth pressure (Talesnick, 2005). The internal pressure was constantly monitored and adjusted by a computer at a frequency of 50Hz throughout the monitoring. The internal pressure applied to the inside face of the pressure cell were applied to minimize any deformations that occur on the bearing surface and thereby minimizing soil arching across the face of the cell. The null pressure cells detect lateral earth pressures more accurately than pressure cells designed to minimize deflection by maximizing the stiffness of the cell (Talesnick, 2005). Talesnick reports that the null pressure sensors detected around 99% of the applied loads regardless of the range of stiffness of the soils tested. It was also reported that other pressure cells typically used to monitor lateral earth pressures only detected 35 to 77% of the applied loads depending on the difference of stiffness between the soil and sensor. 77

91 The locations of the sidewall pressure transducers are indicated in Figure 4.1 and an image of both the large and the small pressure transducers or null gauges are shown below in Figures 4.7 and 4.8, respectively. Face of pressure cell Figure 4.7 Larger-diameter horizontal pressure transducer (large null gauge) 78
92 Figure 4.8 Smaller-diameter horizontal pressure transducer (small null gauge) SURFACE HEAVE MONITORING During the experiments, an attempt was made to investigate the possibility of accurately measuring the ground displacements associated with the application of drilling mud during hydrofracture. Using the surface of the steel loading frame, a linear potentiometer (LP) was vertically positioned to monitor the uplift of the frame during the tests. Since the steel frame did not allow for the detection of the variations in the surface displacements (where rotation or nonuniform displacements could not be ascertained), and the base plates were susceptible to dislocation due to the proximity to the loading plate, these LPs were not employed in subsequent experiments, and did not result in any useful data. 79
93 4.2.9 PACKER AND DISPLACEMENT PUMP To pump the drilling fluid necessary to apply the internal pressure of the borehole, a three stage displacement pump common to the drilling industry and marketed as the Moyno L Series was employed. The pump was comprised of a 450 mm long pump shaft fitted with a stainless steel helix placed within a rubber membrane. As the helix spins within the membrane, the fluid is sucked into the back of the helix and forced out through the front end of the pump. This design allows the displacement pump to move slurries without damaging any internal impellors that would be typical to most conventional pumps. Another benefit of the displacement pump, is in the enormous force that the fluid can be pumped at using a low rate of revolution. At 200 rpm, the three stage Moyno pump can generate up to 270 PSI (Moyno, 2008) which was sufficient to induce hydrofracture in the test material described above. The pump was powered by a 6.5 horsepower, two stroke, gas powered engine fitted with a centrifugal clutch on its drive shaft. The displacement pump and the engine were held together with a specially designed steel frame. The frame held the engine perfectly in-line with the displacement pump. During operation of the pump, the vibrations associated with the running engine tended to cause the pump and engine to move. The frame was designed to force the pump and engine to move together during the operation of the engine. Finally, the drive shaft of the pump was connected with a chain and sprocket to the centrifugal clutch which was fixed onto the drive shaft of the engine. The centrifugal clutch was required to allow the rotation of the drive shaft during the pull starting of the engine. Without the clutch in place, the engine would not start. The centrifugal clutch was fitted with three weights that were influenced by the centrifugal forces generated by the rotation of the drive shaft. At low rotation, the drive shaft was allowed to spin freely so that the engine 80
94 could fire and start up during the pull start. Once the engine had started and the rotation of the drive shaft increased to a certain speed, the weights would be pushed to the walls of the clutch causing, the clutch to engage the rotation of the attached drive cog. The displacement pump was configured such that immediately upon engaging the engine, the clutch would engage, driving the pump and initiating the flow of mud into the borehole. The overall flow rate of the drill fluid was controlled by the throttle of the gas engine providing power to the pump. As a result the flow rate could be increased or decreased as required. A photo of the displacement pump attached to the gas powered engine is shown below as Figure 4.9. Gas Powered Engine Suction Inlet Outlet Centrifugal Clutch Displacement Pump Figure 4.9 Displacement pump and gas engine To prevent the loss of the drill fluid from the annular space of the borehole and the flow outlet, a Model 800 low pressure inflatable packer marketed by Solinst Canada was inserted into the borehole. The packer was inflatable with air and was filled by hand using a bicycle air pump fitted with a pressure gauge. The packer measured a total of 737 mm in length 45 mm in diameter, and was inserted 400 mm into the borehole. The source end of the packer was 81
95 connected to the displacement pump through a ball valve. Once the packer was connected and in place the bladder of the packer was inflated with air until the membrane remaining outside of the borehole expanded to about 1.5 times the borehole diameter and effectively sealed the borehole for testing DRILL FLUID The drill fluid used for all of the experiments was comprised of a high viscosity bentonite slurry designed to stabilize horizontal boreholes in cohesionless deposits. The bentonite-based drilling mud Baroid Bore Gel was mixed using the displacement pump in a 170L drum using concentrations ranging from 50 to 75 grams of bentonite drilling powder per litre of water as recommended by the manufacturer (Baroid, 2006). In all cases, an additive with the trade name Quik-Trol was included to provide additional stability to the borehole, as recommended by the manufacturer for granular materials (Baroid, 2006). The concentration of the stabilizer was kept constant for each mixture at 1 gram of stabilizer per litre of water. The addition of the powdered bentonite and the stabilizer at the concentrations recommended by the manufacturer (Baroid, 2006) resulted in a drilling slurry mixture with an approximate density ranging from 1050 kg/m 3 to 1100 kg/m 3. The slurry was mixed by first filling the drum with a known volume of water and circulated using the displacement pump. As the water was circulated, the powdered bentonite which was preweighed, based on the desired consistency, was then added to the jet stream of water. The mixture was circulated into the drum until no obvious lumps were observed. In order to ensure that consistent mixing occurred, a shovel was scraped along the bottom of the drum to remove any clumps of bentonite that may have adhered to the base. Once the bentonite and water were 82
96 thoroughly mixed, a pre-determined mass of the stabilizer was added to the circulating slurry mixture. Like the bentonite, the stabilizer was added to the outflow stream of the circulating slurry to ensure that the powered stabilizer was properly mixed into the slurry. A purple and red dye was added to the slurry in the same manner as the bentonite additives above to help identify the filtercake in cases where saturation was difficult to determine with confidence. All of the drilling mud concentrations were selected based on the manufactures (Baroid, 2006) recommended mix designs. 4.3 EXPERIMENTAL RESULTS INTRODUCTION Table 4.1 lists the smaller-scale experiments that were carried out during this investigation. The list includes the maximum internal mud pressures measured for a specific overburden pressure for both the successful and unsuccessful experiments. Included with the measured information is a brief summary of the observations of the failed experiments. Details of how an experiment was accepted or considered to be spurious are provided in the Appendix. The trend of the internal mud pressures was observed during the various experiments and how the trend was influenced by additional overburden pressure. A discussion regarding the typical mechanisms by which the mud flowed to the surface will be provided. Following an experiment, the soil was carefully excavated and the type of flow path to the surface was observed. The following section discusses the data collected from the tests using the simulated overburden pressure. Finally, the results of the horizontal pressure monitoring will be discussed in detail. These observations were considered to be essential to confirm the effectiveness of the cell in providing a test apparatus with minimal boundary affects. 83
97 Test Label Overburden Pressure pi (kpa) Max. Int. Pressure pmax (kpa) Pressure Transducer Test Success Observations LL Level Logger No -Likely due to air bubbles from air compressor (initial test set up) PT1 8.7 N/A Resistance No -Failure to initialize the data acquisition system prior to test PT Resistance Yes PT Resistance Yes PT Resistance No -Multiple engine failures during loading PT Resistance No -Mudloss from the side of the borehole; breach from corner joints EXT Resistance No -Mudloss from the connection between upper and lower cells LL Level Logger No -Likely due to air bubbles from air compressor (initial test set up) PT Resistance Yes PT Resistance No -Packer slipped from borehole during loading PTN Resist/Null No -Multiple engine failures during loading PT N/A Resistance No -Failure to initialize the data acquisition system prior to test PT Resistance No -Multiple engine failures during loading PT N/A Resistance No -Packer slipped from borehole during loading PT Resistance Yes PTN Resist/Null No -Actuator in stroke control leading to an increase in vertical pressure PT Resistance Yes LL Level Logger No -Likely due to air bubbles from air compressor (initial test set up) PT Resistance Yes PT Resistance Yes PT N/A Resistance No -Failure to initialize the data acquisition system prior to test PT N/A Resistance No -Damaged lead wires to pressure transducer PT Resistance Yes PT Resistance No -Multiple engine failures during loading EXT Resistance No -Mudloss from the connection between upper and lower cells EXT Resistance No -Mudloss from the connection between upper and lower cells PT Resistance Yes PT Resistance No -Multiple engine failures during loading PT Resistance No -Multiple engine failures during loading PT Resistance Yes PT Resistance No -Packer slipped from borehole during loading Table 4.1 Summary of experimental results and general comment 84
98 4.3.2 MUD PRESSURE TIME HISTORIES The results of monitoring the internal drilling fluid pressure for the simulated overburden pressure experiments are shown in Figures 4.10 and These data indicate that when the experiments were carried out in a continuous manner without interruption, the maximum internal mud pressure was found to vary in an almost linear fashion with respect to the applied overburden pressure. The internal mud pressures observed during the successful simulated overburden experiments were found to range from 135 to 260kPa for respective simulated overburden pressures ranging from 8.7 to 28.0kPa or approximately 0.5 to 1.65m of soil cover. The results of the internal drilling fluid pressures are indicated on Table 4.1 and are shown below as Figure 4.10 and are represented by the triangles shown on Figure From the traces shown in Figure 4.10, it can be seen in each case that there were three distinct portions of each successful experiment: First it is apparent that there is a rapid accumulation of the internal mud pressure which eventually came to a peak pressure dictated by the relative density of the sand. The relative density of the material is also directly proportionate to the applied overburden pressure. Observations of the mud flow indicated that the peak pressure corresponded very closely with the explosive loss of mud at the surface of the material, indicating a complete loss of the soil s ability to further resist the accumulation of the fluid pressure; The internal mud pressure then underwent a decrease that, like the peak pressure is apparently dictated by the initial density of the sand. The actuator also began compressing the sand again until resistance equal to the pre-selected vertical force was reached. This was because a relaxation of the sand occurred once the mud was flowing to the surface and could no longer accumulate pore pressures; 85
99 PT kpa 200 PT kpa PT kpa P T k P a P T kpa P T kpa PT kpa PT kpa PT kpa PT kpa Time (s) 0 Mud Pressure (kpa) Figure 4.10 Traces of applied mud pressure with respect to time for different values of overburden pressure 86
100 PT24 Peak Internal Pressure PT PT12 Line of Best Fit PT7 PT14 PT6 PT4 PT3 PT2 Max. Mud Pressure (kpa) 50 5kPa offset Overburden Pressure (kpa) Figure 4.11 Peak internal fluid pressures as a function of overburden pressure 87
101 Finally, following the decline of the internal pressure, it can be seen from Figure 4.10 that the pressure would achieve a nearly horizontal asymptote which continued throughout the remainder of the experiment until the mud flow was discontinued. Observations of this phase indicated that at this point the flow paths had been fully established and the hydraulic actuator was no longer seeking the desired overburden pressure. The flow rate of the mud leaving the soil appeared to be constant and was assumed to be at the same rate as that of the inflow provided by the displacement pump. The flow rate exiting the cell could not be measured due to the random nature of the flow path creation. The points that are plotted on Figure 4.10 are averages of the output from the downhole pressure transducer. The net sample rate of 10Hz described above still resulted in a significant amount of noise which is likely a result of transducer error. Prior to each experiment, the pressure transducer was calibrated to ensure that the output that was recorded during the experiments was accurate. The peak pressures shown on Figure 4.11 are the actual measured peak pressures indicating the peak readings from each experiment PEAK FLUID PRESSURE AS A FUNCTION OF OVERBURDEN PRESSURE During each experiment the peak internal fluid pressures were isolated and compared to one another based on the applied overburden pressure. As previously stated, the use of the actuator during the experiments was to determine how the peak pressures varied relative to the initial density of the soil prior to the application of the drilling fluid. Figure 4.11 illustrates a summary of peak values of mud pressures versus the simulated overburden pressures for each successful test. Based on the findings of the experiments, a line of best fit has been placed within the data points to indicate the relative scatter. The smaller-scale experiments clearly indicate that the relative density of the material dictates the maximum internal drilling fluid pressure within a 88
102 borehole. As the applied overburden is increased, so is the corresponding peak internal fluid pressure. The line of best fit plotted between the nine points shown on Figure 4.11 indicates that the increase of the peak internal fluid pressure is nearly linear with respect to the applied overburden pressure. Inspection of the line of best fit shows that extrapolation to the origin would result in a maximum internal pressure of 40kPa. If the line of best fit is offset by approximately 5kPa, the line of best fit of the maximum internal fluid pressures would pass through the origin. Springman et al. (2003) reported that suction pressures in partially wetted soils can vary in the field up to around 40kPa. Based on this study, it is likely that there would be an influence from the partial saturation of the sand prior to loading that would further contribute to the borehole s ability to resist failure resist blowout or hydrofracture. It is possible that negative pore pressures or the internal suction of the partially wetted soil could explain the 4 to 5kPa offset of the line of best fit observed in Figure Observations of the peak internal fluid pressures in comparison to the line of best fit indicate that the scatter of the data points is relatively small throughout the number of experiments conducted. The coefficient of variability was calculated based on the nine points above to range from 2.9% at lower peak pressures, to 4.2% for the peak pressures recorded at overburden pressures of 16.7 and 20.7 kpa, to a minimum of 2.6% for the peak pressure recorded at an overburden pressure of 24.7 kpa. It is likely that the primary source of the variation stems from the level of compaction of the sand prior to testing. Though every effort was made to repeat the placement methods in a manner that 89
103 was consistent throughout the experiments, it was difficult to compact the material to an identical density for each test. In addition to the likely variation in the soil placement, it is also likely that the sometimes erratic rate of pumping of the drilling fluid could greatly contribute to the fluctuations observed from test to test. Three sets of experiments were also carried out at the same overburden pressure to compare the repeatability of the experiments. To better illustrate the results of the experiments carried out at the same overburden pressure, plots of the raw data relative to time are shown in Figure The six plots indicate trends of the pressure accumulation, peak values, gradual drop and residual pressures described above. For the experiments carried out at an overburden pressure of 12.7 kpa (approximately 0.75m depth) the two peak values were recorded as and kpa for PT3 and PT4 respectively. This corresponds to a percent difference of 6.5%. The maximum internal pressures recorded during the two successful tests carried out at 16.7 kpa (PT6 and PT7) were measured as and kpa respectively. These two peak fluid pressures correspond to a percent difference of 11.4%. Finally, tests PT10 and PT12 were carried out at an overburden pressure of 20.7 kpa, which resulted in peak internal fluid pressures of and kpa respectively, corresponding to a percent difference of 14.2% GEOMETRY OF MUD FLOW THROUGH THE SAND When each experiment was complete, the actuator was released and the drilling fluid within the soil mass was allowed to drain from the sand by removing the packer. The soil was excavated in 50mm lifts and the areas of the affected soil were observed and noted to document or map the flow path of the mud to the ground surface. In most cases, the path that the drilling fluid followed to the ground surface featured one of two geometries. 90
104 PT kpa PT kpa PT kpa PT kpa PT kpa PY kpa PT kpa PT7 16.7kPa PT kpa Time (s) 0 Mud Pressure (kpa) PT4 12.7kPa PT kpa PT6 16.7kPa Figure 4.12 Comparison traces of smaller-scale experiments carried out at similar overburden pressures 91
105 The first flow geometry observed in the tests involved relatively thin (up to 2mm thick) vertical cracks extending across the width of the test cell. The flow would primarily travel within an extremely thin (approximately < 0.5mm thick) flow path within the crack to the surface of the soil. The remaining volume of saturated soil appeared to be a combination of infiltration due to the pressure applied to the drilling fluid and, at the limits of the saturated zone, capillary action of the drill fluid interacting with the dry sand. As the soil was excavated, it was observed that cracks had initiated at the end of the borehole indicated by a smaller amount of impacted sand close to the obvert of the borehole. The transverse cracks were observed to fan out to the sidewalls over a short distance where they extended for the remainder of the depth of the soil. The drilling fluid would typically reach the sidewalls of the test cell within approximately 75mm above the borehole obvert. A sketch of the shape and nature of a typical transverse crack is shown below in Figure Images of typical transverse cracks are shown below in Figures 4.14 and
106 Figure 4.13 Sketch of typical transverse crack (not to scale or actual crack location) 93
 15 Transverse crack near the crown of the borehole")
107 Transverse crack across the width of the test cell Figure 4.14 Typical transverse crack across test cell (approximately 100 mm depth) Transverse crack across the width of the test cell Figure 4.15 Transverse crack near the crown of the borehole (approximately 250 mm depth) 94
108 The second route by which the drilling fluid travelled to the ground surface was within one or two largely washed out flow tubes that, like the transverse cracks, formed their own filtercake/wetted zones around the circumference of the flow tube. When the flow tubes developed, they formed at the closed end of the borehole and proceeded to the ground surface away from the end of the borehole and would reach the surface of the sand at points ranging from 40 to 80 mm away from the end of the borehole. Slight deviation from the centreline of the axis was common, but rarely exceeded 100mm from the centreline of the borehole. The flow tubes were typically conical with the widest section located at the ground surface and coming to a point near to the borehole. The range of diameters observed at the base of the flow tube cones, varied from 25 to 60mm at the ground surface tapering to a minimum of approximately 10mm immediately above the crown of the borehole. The flow paths were generally vertical though by no means straight; they appear to follow the path of least resistance. A sketch of the shape and nature of a typical flow tube failure is shown below in Figure Images of typical flow tube or wash out failures are shown below in Figures 4.17 and
109 Figure 4.16 Sketch of typical flow tube (not to scale or actual crack location) 96


110 Flow tube Figure 4.17 Typical hydrofracture flow tube at the surface of the sand Flow tube and filtercake at the borehole crown Figure 4.18 Typical hydrofracture flow tube and saturated zone above the borehole obvert (Approximately 310 mm below the surface of the sand) 97
111 How the formation of the two types of flow patterns took place and the why the route that the drilling fluid took to the ground surface is unknown. There was also no obvious indication as to why one pattern (either the flow tubes or the transverse cracks) formed instead the other. It is clear though that because each of the two types of flow paths (flow tubes/transverse cracks) formed at the end of the borehole in almost all of the cases, that plane strain conditions will not apply to this model. Considering this fact the model should be considered to be similar to the conditions encountered at the end of a borehole during the advancement of the pilot bore. It also stands to reason that the results obtained from a two-dimensional numerical model should not accurately represent the conditions of these experiments. In order to accurately represent the stresses developed during these specific experiments, it is likely that a three-dimensional numerical model would provide much better results than those obtained from a two-dimensional model. It is recommended that future experiments be designed to pressurize the borehole in a manner that allows uniform loading throughout the length of the borehole resulting in longitudinal cracks along the crown of the borehole as opposed to the formation of the transverse cracks at the end of the borehole observed during these experiments HORIZONTAL EARTH PRESSURE MONITORING In two of the experiments, the horizontal pressures of the soil were monitored throughout the entire process of the experiments. As described in Section 4.2.7, two horizontal pressure sensors were installed into one sidewall of the test cell. The results of the experiments were considered to be unsuccessful in that mud flow was never established with the ground surface and occurred 98
112 either from the side of the test cell or along the interface between the cell and the packer. The results of the monitoring of the lateral pressures did indicate the extent of the influence of the sidewall boundaries on the experiments. Monitoring of the horizontal earth pressure was commenced prior to Stage 1, or the placement of the material. This was done so that an ambient baseline reading of the cells could be recorded, and so that the effectiveness of the monitoring equipment could be assessed as the pressure cells were slowly covered with the soil. The material was prepared in the same fashion as the previous experiments, being sure to compact the loosely placed material in 200mm lifts, taking special care along the sidewall where the pressure sensors were located. At Stage 2, the actuator was used to provide additional compaction of the material prior to testing. In these experiments, the preloading was manually powered in stroke control so that a compactive force of 75kN (295kPa) could be applied slowly and the horizontal pressures could be continually monitored during the loading process. The results of the horizontal stress accumulation, for experiments PTN13 and PTN8 are shown on Figures 4.19 and 4.20 respectively. The horizontal pressure accumulation was approximately linear and was nearly half that of the applied vertical load shown by the black line indicating a K o of 1 (1:1 Line). The coefficients of horizontal earth pressure, (K o ) calculated from both sensors for tests PTN13 and PTN8 respectively were 0.58 and 0.56 for the upper smaller sensor, and 0.61 to 0.51 for the larger sensor. On the basis of these measurements, the K o of the compacted sand material is taken to be The vertical separation of the two sensors was 0.11 m, considering a relative density of 1760 kg/m 3 and a K 0 of 0.55, the expected difference between the two sensors should be approximately 10.5 kpa. Observations of the horizontal stress accumulation versus the applied overburden pressure indicate that for both 99
113 PTN8 and PTN13, the typical deviation of the horizontal pressures during loading was approximately 10 to 15 kpa. 100
114 140 Sustained Load Unloading Curve Hydrofracture Test Loading Curve Small Top NG PT (kpa) Large Bot NG PT (kpa) Vertical Pressure (kpa) 0 Horizontal Pressure (kpa) Figure 4.19 Lateral earth pressure development with vertical stress accumulation (PTN13) 101
115 Sustained Load Unloading Curve Loading Curve Hydrofracture Test Small Top NG PT (kpa) Large Bot NG PT (kpa) Vertical Pressure (kpa) 0 Horizontal Pressure (kpa) Figure 4.20 Lateral earth pressure development with vertical stress accumulation (PTN8) 102
116 Stage 3 indicates an interesting observation of the soil reaction during unloading. The hysteresis observed in both the upper and lower sensors for PTN13 and PTN8 is shown on Figures 4.19 and The K o measured during the unloading of the soil was calculated as 0.41 and 0.45 in the small transducer for PTN13 and PTN8 respectively. These K o values correspond with percent differences from the initial loading curve of 34% and 27% respectively. The measurements of the horizontal earth pressure recorded in the large sensor during Stage 3 were calculated as 0.35 and 0.48, which corresponds to a percent difference of 54% and 6% for tests PTN13 and PTN8 respectively. The minimal deviation in the unloading curves between the two sensors for the experiment PTN13 indicates that the material unloaded in a uniform fashion during the reduction in the overburden pressure, showing that the compaction of the sand was consistent throughout. The greater hysteresis observed within the lower sensor during PTN8 indicates that perhaps the compaction of the lower layers may not have been as complete as the soil near to the upper sensor which demonstrated very little hysteresis from the loading curve. Some additional hysteresis may have occurred as a result of some deformation of the Lexan sidewalls during loading. Though the sidewalls were constrained against lateral movement using bolts and clamps, it is inevitable that there would be some movement of the Lexan walls resulting in a slight reduction in pressure. It is expected that the movement of the sidewalls would have a greater impact on the unloading curve. This is because any displacements that occur during loading would take place immediately creating a delay when the sensors detect the stresses at the sidewall. During unloading, the immediate movement of the walls into the sand, following the release of the overburden pressure would tend to influence the degree of hysteresis by increasing the horizontal stress on the sidewalls as the Lexan moves into the soil. 103
117 At Stage 4, the application of the drilling fluid, the horizontal stresses exerted on the sidewall from the internally applied pressure were also monitored. However, due to the rapid nature of the experiments, observations of the horizontal earth pressures during the loading of the borehole were difficult to interpret. Though the accumulation of horizontal stresses during the tests is difficult to quantify, the effect of the radial loading applied to the annulus of the borehole may have been detected by the pressure gauges installed in the sidewalls of the cell. At an approximate overburden pressure of 20kPa, there is a slight deviation from the unloading path as can be seen in both of the above figures. These clusters of data points represent the stresses at the sidewalls of the cell, suggesting that, the radial expansion of loading stresses was transmitted through the soil mass to the sidewall. A better indication of the impact of the internal loading is shown in Figures 4.21 and These figures indicate the horizontal stress measured in both the upper and lower null gauges with respect to time. These figures clearly show the effects of Stages 1 through 3, as indicated by the dramatic increase in pressure with time immediately following a gradual increase in pressure during the initial deposition and hand compaction stages of the experiment. 104
118 130 Sustained Load Small Top NG PT (kpa) Large Bot NG PT (kpa) Unloading of Surface Surface Loading Internal Borehole Pressure Applied Horizontal Stress (kpa) 30 Placement of Soil Borehole Excavation Time (min) Figure 4.21 Record of horizontal stress with respect to time (PTN13) 105
119 Sustained Load 140 Small Top NG PT (kpa) Large Bot NG PT (kpa) Surface Loading Unloading of Surface Internal Borehole Pressure Applied Time (min) 0 Horizontal Stress (kpa) Placement of Soil Borehole Excavation Figure 4.22 Record of horizontal stress with respect to time (PTN8) 106
120 At the end of each of the graphs an increase in the horizontal stresses is observed at the sidewall in the pressure transducers is quite clear. Interestingly, there is very little stress increase in the lower gauge located below the invert of the borehole. The majority of the stresses observed during the experiments were in the upper gauge installed slightly above the crown of the borehole. Clearly the proximity of the sidewalls to the borehole, even though the distance is greater than 4 radii is still a factor, as the stress was actually felt at the sidewalls of the cell. It is likely that the hypothesis regarding the potential impacts due to the limited boundary conditions is valid. This confirms the need to conduct larger-scale experiments with sidewall boundaries significantly further from the borehole so that a more reliable picture of the stresses and the associated ground displacements could be realized. An attempt was made to try to quantify the horizontal impact of the drilling fluid on the side walls of the cell. Observations were made of the horizontal pressure time curves shown as Figures 4.21 and At the end of each curve, the loading of the borehole took place and the impact of the internal loading could be slightly detected at the sidewalls of the cell. The observed sidewall pressures in the upper and lower gauges during PTN13 indicate increases of the sidewall pressures from 35.2 to 56.9 kpa and 48.5 to 55.3 kpa respectively. It is clear that the upper gauge which was positioned almost immediately beside the springline of the borehole detected the highest change in pressure. The measured pressure variation during loading was found to result in an increase in sidewall pressure of 21.7 and 6.8 kpa or a 62% and 14% increase in pressure for PTN13 upper and lower gauges respectively. The horizontal pressure detected in the upper and lower gauges during PTN8 indicate that the horizontal pressure increased from 12.3 to 60.9 kpa and from 37.1 to 43.5 kpa for the upper and lower gauges respectively. These pressure changes correspond to increases of 48.6 and 6.4 kpa 107
121 or 395% and 17% for the upper and lower gauges respectively. It is likely that the detection of the pressure of the drilling fluid acting on the sidewalls would have been greater had the sample rate of the null gauges been approximately 4 to 5 times greater. It is clear that further and more detailed experiments are needed using the pressure transducers or null gauges to better understand the impact that radial pressures have on the failure of horizontally drilled boreholes during internal loading. Any additional investigations must consider the rapid nature of the tests and devise an appropriate sample rate in order to properly capture the stress changes during the course of the experiments. It is apparent from the results that a frequency of 50Hz, which was employed during the experiments, was not sufficient to fully capture the response of the horizontal stresses during the internal loading of the borehole. This however may not be possible with the current horizontal earth pressure sensors as the rate at which the air pressure is provided to the face of the sensors may not be sufficient to match the rate of application during the experiments, though additional testing should be undertaken and concrete conclusions should not be made at this time. 108
122 4.4 CONCLUSIONS In this chapter the results of several smaller-scale experiments designed to reproduce and measure the internal fluid pressures which accumulate during horizontal directional drilling projects within a frictional cohesive material are reported. A borehole measuring 45mm in diameter and 500mm in length was advanced into a poorly graded sand material that had been compacted using manual methods and was subjected to a simulated overburden pressure provided by a calibrated hydraulic actuator. In each test, the boreholes were pressurized with a bentonite based drilling slurry or drilling mud until mud loss was observed at the surface of the test cell. During each experiment, the mud pressure exerted on the borehole walls was monitored using a pressure transducer programmed to record at a net frequency of 10Hz to capture the failure of the borehole indicated by an instantaneous loss of internal pressures. Following the experiments, representative samples of the sand and filtercake materials were recovered and subjected to a series of physical characteristic tests including standard Proctor tests, grain size analyses and falling head permeability tests. The results of the horizontal pressure monitoring during two experiments indicated the limitations associated with the size of the test cell used during the experiments and the need for additional tests in a larger test cell and using a similar methodology. Instrumentation used in this series of experiments provided guidance as to what could be reasonably monitored during the course of experiments carried out in a larger test cell. The radius of the soil infiltrated by the drill fluid within the test cell was found to extend either to or very near to the sidewalls of the cell in each successful experiment. Based on the results of the smaller-scale experiments it was clear that additional experiments are required to better 109
123 understand the nature of hydrofracture/blowout in a uniform cohesionless material. The methodology developed and used in these experiments was found to be straightforward to set up and conduct, and would easily be applied in a larger test cell. Based on the findings of the smaller-scale laboratory experiments, several conclusions are drawn. A test methodology was developed that yielded consistent results in terms of the measured pressures applied to the borehole walls by the pressurized drilling fluid. The methodology developed could be easily translated into larger-scale or even full scale field experiments if desired; The scale of the experiments was variable considering that the depth and diameter of the borehole; the internal fluid pressures; rate of fluid application; and duration of experiments to the time of failure. Each of the aspects were at scales close to 1:1 with the exception of the last characteristic. The length of the time of the experiments is considerably shorter than would typically occur in the field, though the precise time necessary for failure to occur in the field is difficult to quantify; Due to the rapid nature of the experiments, it was essential that the sample rate of the downhole pressure transducer be as fast as could be sustained by the data acquisition system. The applied frequency of 1,000Hz resulted in excessive noise in the readings that required the data to be averaged by every 100 measurements in order to provide relatively stable results. The need for this sample rate was shown by the fact that the self contained datalogger was unable to fully capture the failure of the borehole at a sample rate of 2Hz; It is possible that negative pore pressures of the partially saturated sand may contribute up to 40 to 50kPa of additional internal fluid pressures. The additional fluid pressure is 110
124 shown in Figure 4.11 by the offset of the line of best fit of the maximum internal fluid pressures which does not pass through the origin. If a negative pore pressure of only 4 to 5 kpa is considered, the line of best fit results in a maximum pressure of 0 kpa at an overburden of zero metres depth; The confinement of the upper surface of the test sand by the loading frame and the actuator may have had an impact on the formation of hydrofracture within the test sand; however the extent of this effect could not be quantified; Measurement of the lateral earth pressures during loading indicated that the value for K o was found to range from 0.51 to 0.61, or 0.55 on average. The K o value observed during unloading was indicated as 0.35 to 0.48, or 0.42 on average. The deviation (percent difference) from the initial loading curve during unloading or the hysteresis of the small sidewall pressure transducers was found to be 34 and 27% and 54 and 6% for the large transducers. Finally the impact of the internal mud pressures during the borehole pressurization on the sidewall transducers could not be accurately reported as the sample rate of 50Hz was insufficient; The dimensions of the test cell may have had an impact on the maximum observed internal drill fluid pressures. Even though the distance to the sidewalls was greater than 3.5 borehole diameters, the maximum internal mud pressure may have been limited as a result of the influence of the boundary conditions. This was shown to be somewhat of a factor as the upper null gauge installed into the sidewall of the cell indicated an increase in pressure of approximately 62% to 400% in tests PTN13 and PTN8 respectively with the application of the drilling slurry. The potential for impact at the boundaries indicates that there is a need to conduct larger-scale experiments where the sidewall and surface boundary conditions could be either eliminated or minimized. 111
125 A comparison of the observed maximum fluid pressures and the results of the various theoretical methods were not made because of the findings of the monitoring of the stresses acting on the sidewalls of the test cell. Because it was shown that there was a significant influence on the internal fluid pressures due to the proximity of the sidewalls to the centre of the borehole. This location of the sidewall boundaries render the assumptions of the closed form solutions and the finite element analyses invalid since the boundary conditions are not at a distance that would not impact the stresses within the test model. REFERENCES ASTM (2006). Standard test method for permeability of granular soils (constant head), ASTM D Philadelphia, PA: American Society for Testing and Materials. Baroid International. (2006). webpage, Carter, J.P., Booker, J.R. and Yeung, K.S. (1986). Cavity expansion in cohesive frictional soils. Geotechnique, Vol. 36(3): Conroy, P. J., Latorre, C. A., and Wakeley, L. D. (2002a). Installation of fiber-optic cables under flood-protection structures using horizontal directional drilling techniques. ERDC/GSL TR-02-8, Geotechnical Structures Laboratory, Vicksburg, MS.USACE. Conroy, P. J., Latorre, C. A., and Wakeley, L. D. (2002b). Guidelines for installation of utilities beneath Corps of Engineers levees using horizontal directional drilling. ERDC/GSL TR-02-9, Geotechnical Structures Laboratory, Vicksburg, MS. USACE. 112
126 Kennedy, M. J., Skinner, G. D., and Moore, I. D. (2004a). Elastic calculations of limiting mud pressure to control hydrofracturing during HDD. Proc., No-Dig 2004, New Orleans, Paper No. E Kennedy, M. J., Skinner, G. D., and Moore, I. D. (2004b). Limiting drilling slurry pressures to control hydrofracturing during HDD through purely cohesive soil. Proc., 2004 Canadian Geotechnical Society Conf., Quebec City, Paper No. 4E: Kennedy, M. J., Skinner, G. D., and Moore, I. D. (2006). Development of tensile hoop stress during horizontal directional drilling though sand. ASCE International Journal of Geomechanics, Vol. 6(5): Lugar H.J., Hergarden H.J.A.M. (1988). Directional drilling in soft soil; influence of mud pressures, Proc., ISTT-No Dig, 1998, Washington D.C., Paper 6B: 1-7. Moore, I.D. (2005). Analysis of ground fracture due to excessive mud pressure. Proc., 2005 North American No-Dig Conf., Orlando, Paper No. C Moyno Incorporated. (2008). webpage, Solinst Canada. (2006). webpage, Springman, S. M., Jommi, C., Teysseire, P. (2003). Instabilities on moraine slopes induced by loss of suction: a case history. Geotechnique, Vol. 53(1):
127 Talesnick, M. (2005). Measuring soil contact pressure on a solid boundary and quantifying soil arching, ASCE Geotechnical Testing Journal, Vol. 28, No.2: 1 9. Tognon, A.R.M., Rowe, R.K., and Brachman, R.W.I. (1999). Evaluation of sidewall friction for a buried pipe testing facility. Geotextiles and Geomembranes, Vol. 17: Van Brussel, G.G., Hergarden, H.J.A.M. (1997). Research (CPAR) program: Installation of pipelines beneath levees using horizontal directional drilling. SO /2. Department of Foundations and Underground Engineering, Delft Geotechnics, Vesić, A.S. (1972). Expansion of cavities in infinite soil mass. ASCE Journal of the Soil Mechanics and Foundations Division, Vol. 98: Yu, H.S., Houlsby, G.T. (1991). Finite cavity expansion in dilatant soils: loading analysis, Geotechnique, Vol. 41(2): Yu, H.S. (2000). Cavity Expansion Methods in Geomechanics. Kluwer Academic Publishers,
128 CHAPTER 5 LARGER-SCALE HYDROFRACTURE TESTS 5.1 LARGER-SCALE EXPERIMENTS INTRODUCTION Previous analytical models to help designers estimate the maximum allowable internal fluid pressure of directionally drilled boreholes within low cohesive frictional materials have not been properly evaluated to ascertain the accuracy of each method employed. To date the state-of-theart method for estimating the allowable fluid pressures was first described by Lugar and Hergarden (1988) and later by Keulen et al. (2001). The US Army Corps of Engineers has adopted this theory as a guideline to practitioners responsible for the design of horizontal directionally drilled boreholes. Conroy et al. (2002a,b) present a series of potential issues related to the installation of infrastructure below existing dyke systems and describe how hydrofracture could potentially lead to the catastrophic failure of the dyke during flood conditions. The two theories suggest that a material defined by equilibrium, Hooke s law for increments of elastic deformation, a Mohr-Coulomb failure criterion, and the absence of volume change within the plastic zone (zero dilation angle) can be used to adequately describe the behaviour of a directionally drilled borehole with an internal fluid pressure. The theory commonly referred to as the Delft solution was developed based on the expansion of a pre-existing cylindrical opening within a frictional cohesive material that undergoes expansion due to a uniformly applied internal pressure as reported by Vesić (1972). The Delft equation, which defines the maximum internal fluid pressure, is shown below as Equation 5.1. This equation assumes that complete failure of 115
129 the surrounding soil has occurred when the radius of the plastic zone comes in contact with the ground surface. [5.1] where; ; p max is the maximum internal pressure; p f is the effective mud pressure defined as [σ o (1+sinφ) + (c cosφ)] u; R o is the initial borehole radius; R pmax is the maximum plastic radius; G is the shear modulus of the material; σ o is the initial vertical overburden pressure; and c is the cohesion of the soil. Lugar and Hergarden (1988) as well as Keulen (2001) have defined the limiting internal pressure or the allowable internal fluid pressure that would prevent the complete failure of the surrounding soil mass differently. Lugar and Hergarden (1988) defined the limiting pressure as 90% of the maximum internal pressure for a purely cohesive material (saturated fine grained soils responding in an undrained condition). The maximum pressure is defined as a plastic radius (R pmax ) equal to the total depth of soil cover measured from the crown of the borehole to the ground surface. While Keulen et al. (2001) have defined the limiting pressure for a cohesive frictional material as the internal borehole pressure which corresponds with a maximum plastic radius (R pmax ) equal to two thirds of the depth of soil cover, measured from crown of the borehole to the ground surface. A full scale experiment carried out by Lugar and Hergarden (1988) reported a good correlation of the actual downhole pressures during fluid loss with those estimated using Equation 5.1 and numerical modelling. Chapter 2 of this thesis describes the work by Lugar and Hergarden in greater detail. 116
130 5.1.2 LARGER-SCALE EXPERIMENT OBJECTIVES It was the objective of these larger-scale laboratory experiments to evaluate the effectiveness of the cavity expansion theories developed by others for cohesive frictional materials subjected to pure shear as a result of the expansion of a pre-existing cavity, when they are applied to a low cohesive frictional material subjected to an internal pressure applied by a real drilling fluid. These experiments were also to evaluate the effectiveness of other more complex cavity expansion theories that considered the deformations of the material within the elastic zone during loading as well as the influence of the angle of dilation or volume change that occurs within the material during shear failure. It was also considered desirable to develop an understanding of the nature of fluid loss during directional drilling operations and by doing so, investigating other aspects of failure related to fluid loss such as ground heave and the formation of the filtercake within a relatively pervious material. This investigation was to be undertaken within a laboratory setting using a larger test cell than the one used in the experiments described in the previous chapter, with greater but still manageable size. Through the knowledge gained during those experiments, additional tests could be conducted at a larger-scale to provide better approximations to the conditions typically encountered during directional drilling projects. The final reason for employing larger-scale experiments was that the smaller-scale experiments indicated that the method of the vertical loading and the proximity of the sidewalls of the test box influenced the results of the experiments. It was recognized from the previous experiments that the confinement of the soil surface by the application of the mechanical overburden pressure may have had an influence on the flow of the drill fluid towards the soil surface. Observations of the sidewall pressure transducers described in the previous chapter also indicated that there were likely stresses imposed by the sidewalls during loading which may have had an influence on the stresses within the material. It was the goal of 117
131 the larger-scale experiments to eliminate the need to load to the ground surface of the soil deposit, so that the flow of the drilling fluid is only influenced by soil self-weight and the applied borehole pressure (the overlying soil is then present, and is no longer simply represented by an overburden pressure). Furthermore, by conducting experiments at a larger-scale, it was expected that the movement of the sidewalls to a distance of approximately 35 radii from the centre of the borehole would limit the effects of side boundary strength and stiffness. In addition to removing the possible influence of the boundary conditions, it was considered valuable to investigate the surface displacements associated with the increased volume related with the injection of the drilling fluid. There are no known previous investigations that focus on surface displacements connected with hydrofracture in frictional materials. Finally, this investigation permitted examination of the effects of the placement of a dense to very dense granular material on the surface of the sand. The purpose of this was two-fold, first, to help understand the impact of layered granular systems similar to those used for the construction of roadways, and second to conduct hydrofracture tests at different overburden pressures. Unlike the previous smaller-scale experiments, the applied overburden pressure could not readily be adjusted to examine the maximum internal pressures for a range of vertical stress values (since the overburden was generated by soil self-weight rather than surface pressure, an increased overburden pressure above the borehole would require larger burial depth). Instead, by removing a portion of the less dense sand layer and replacing it with a well compacted, well graded, sand and gravel material, the initial vertical stresses acting on the crown of the borehole could be altered slightly. The gradation of the sand and gravel ranged from fine sand sized particles (approximately 7.4 μm) to 19 mm diameter crushed limestone, which is similar in composition to granular subgrades used in road construction. The relative density of the sand material was 118
132 determined from standard Proctor tests to be around 1750 kg/m 3 and the relative density of the sand and gravel was estimated from multiple nuclear density tests and from literature for a Granular A to be around 2100 to 2150 kg/m LARGER-SCALE EXPERIMENTAL APPARATUS AND TESTING REGIME The experiments were conducted in a similar fashion to those presented in the previous chapter with the replacement of the biaxial cell described in the previous chapter by a concrete pit measuring 2m wide by 2m long by 1.5m deep. The tests featured an additional 0.6m of borehole length, making the total length of the test pit in the direction of the borehole 2.6m. A schematic drawing of the test pit and a photo showing the configuration of the test pit prior to filling are presented in Figures 5.1 and 5.2 respectively. The scale of the larger-scale model, like the smaller-scale experiments is variable considering the various components of the test apparatus. The key difference in the larger-scale experiments had to do with the location of the sidewall boundaries which were positioned at a distance considerably greater than the smaller-scale experiments. The depth of the borehole, unlike the smaller-scale experiments was not varied and was held relatively constant to a scale of approximately 0.5:1 assuming a depth of installation in the field of 1.5m below the ground surface. The depth ratio is consistent with small diameter installations of fibre optic cables or small diameter pressurized gas or water conduits. The diameter of the borehole was slightly larger than that of the smaller-scale experiments and was modelled to be approximately 0.5:1 when compared to a pilot bore diameter of 100mm which is the typical diameter of smaller drill rigs used for short, small diameter installations common within urban settings. Like in field applications, the rate of the drill fluid application would be considered to be 1:1 because once the 119
133 borehole had been excavated and recirculation of the drill fluid had been established, the rate of mud flow through the drill string will remain constant as dictated by the fluid pump at the drill rig. It was reported in Chapter 4 that the displacement pump used in the smaller and larger-scale experiments was identical to the equipment used in the drilling industry. The pressure application processes observed in the field are slightly different than those observed in the laboratory. This is because the fluid pressures applied to the walls of the borehole in the field is a combination of the pressure generated by the pump applied through the drill string and the column of drill fluid acting above the end of the borehole. Because the depth of the borehole being modelled in the laboratory experiments is only around 1.5m below the ground surface, the actual contribution of the column of drilling fluid is only around 16kPa or around 5 to 15% of the overall internal fluid pressures. The major difference between the experiments and actual field applications lies in the time lapse that occurs between the start of the experiments and when failure takes place. In the field, the time lapse between the start of drilling and when mud loss at the surface occurs can vary significantly, but is likely to occur over a much longer period of time than was observed in the laboratory. 120
134 Plan view End view Profile view Figure 5.1 Biaxial pit configuration used in larger-scale experiments Opening for Borehole (Bulkhead) Geo-textile covered end wall (Concrete blocks) Figure 5.2 Biaxial pit used in larger-scale experiments seen from above 121
135 Seven experiments were conducted using the large concrete pit, however due to an error using the data acquisition system, the data for two experiments were overwritten, though the maximum values and the surface displacements were recorded. Of the seven experiments, two were carried out after removing the upper 300mm of sand from the test pit and replacing it with a well graded sand and gravel material similar to a Granular A. The ground surface displacements were calculated from interpretation of images captured by two high resolution cameras from two angles throughout the experiments to document the nature of the ground heave associated with mud loss in cohesionless materials. An image of the GeoPIV configuration used during the larger-scale experiments is shown as Figure 5.3. A MatLab based displacement tracking system was used to interpret the displacements of the soil suface. The system used is marketed under the name GeoPIV (Particle Image Velocimetry) and was developed for use by White et al. (2003). Two, 10.1 mega-pixel Canon Eos Rebel XTi cameras fitted with 28 to 90mm standard zoom lenses were placed at ninety degrees to one another and each was programmed to take high resolution photographs of targets placed on the ground surface of the test soil at regular intervals. Analysis of the photographs was then carried out using the GeoPIV program which tracks predetermined pixels within a known search radius. By tracking the displacements of the selected pixels the corresponding displacements were then calculated in three dimensions. The results of the numerical analyses described in Chapter 3 and the calculations using several cavity expansion theories were then compared to the results obtained from both the maximum internal fluid pressures and surface displacements of the larger-scale experiments providing an evaluation of the performance of current state-of-the-art design practices. A discussion of the theoretical methods will be provided in subsequent sections. 122
136 Stationary targets to monitor camera movement GeoPIV Target blocks High Resolution Cameras Figure 5.3 Configuration of GeoPIV cameras and targets 5.2 EXPERIMENTAL METHODOLOGY TEST PIT PREPARATION The test pit used for these experiments is 4m long, 2m wide, and 2m deep. To reduce the amount of sand used in the experiments, the internal dimensions of the pit were reduced through the addition of six concrete block sections placed approximately 2.6m from the borehole opening (bulkhead) as shown in Figure 5.2. The concrete blocks were placed side by side to maintain the initial width of the pit and reduced the fill-able depth of the pit to 1.5m. Following the placement of the temporary concrete barrier, a woven geo-textile was placed along the face of the wall to minimize the migration of the sand material between the cracks of the blocks and to provide a uniform bearing surface. 123

137 The borehole was advanced through a steel plate (bulkhead) bolted to the end of the pit opposite from the temporary concrete barrier. The bulkhead separated the smaller pit used to conduct the current experiments from a larger pit where the drilling fluid and displacement pump were located. The opening in the steel plate was initially 200mm in diameter, which was found to be too large to provide an effective seal for the 55mm diameter packer. To ensure that the aperture of the steel plate would provide an opening small enough for the high-pressure packer to expand around, the opening was reduced by the placement of a 25mm thick Lexan sheet with a 60mm diameter opening cut through its centre. An image of the borehole opening is shown in Figure 5.4. The borehole was positioned at a depth of 750mm from the ground surface that is at the centre of the soil deposit. Borehole Opening Hand Auger Figure 5.4 Large scale hand auger and borehole opening (Xia, 2008) 124
138 The pit was backfilled with a material similar in nature to that used in the smaller-scale experiments described in Chapter 4. The sand was placed in 300mm loose lifts using a rubber tired skid steer loader and mechanically compacted using a light-duty vibratory compactor marketed by Wacker Packers, model number and type WP1550 Plate Compactor to at least 95% of its standard Proctor maximum dry density as reported in Chapter 4. During compaction it was observed that there was disturbance to the surface of the sand due to the operator footsteps; to mitigate this disturbance, water was added to the surface of the material to maintain a slightly stiffer working surface. Care was taken to control the amount of water added so that compaction could still be maintained within ±2% of the optimum moisture content of 6.2% determined from the standard Proctor tests carried out on the uniform sand. Throughout the course of the larger-scale experiments, consistency was considered to be an imperative in order to achieve and demonstrate the repeatability of the tests. To control the quality of the placement of the soil, the relative density and the moisture content of the sand material was measured with a calibrated nuclear density gauge at the four corners and the centre of each lift. The probe rod of the nuclear gauge was set to penetrate into the sand a depth of 150mm and the gauge was kept a minimum of 0.5m from the sidewalls in order to reduce any interference from the concrete walls. Following the compaction tests, the probe holes were refilled with sand and compacted further to minimize the formation of any possible flow paths through discontinuities in the sand. Following approval of the compaction of each lift, subsequent lifts were placed and tested in a similar fashion until the maximum depth of 1.5m had been reached. The measured relative densities of the sand material during placement ranged from 1668 to 1786kg/m 3 though were typically around 1740kg/m 3. All of the measured densities of the sand material were within 5% of the standard Proctor maximum dry density reported to be kg/m
139 The water content of the sand material was measured to vary from 4.2 to 6.7%, which was within 2% ± of the optimum water content, calculated during the standard Proctor test to be 6.2% as determined from physical characteristic laboratory experiments. The typical range of the compacted relative densities and the moisture content of the Granular A as reported by the nuclear gauge were observed to be from 2026 up to 2074kg/m 3 and 6.8 to 7.6%, respectively. As before, the penetration of the probe rod was set at a depth of 150mm below the ground surface. The lower moisture content was considered to be acceptable as the observed density of the granular A material was greater than the expected standard Proctor maximum dry density. Following compaction, a grid spaced at 0.5m intervals was painted on the surface of the sand or the well graded granular material providing control points for the displacement monitoring targets as shown in Figure 5.3. The borehole was advanced into the sand using a hand auger specifically designed for excavation in cohesionless materials. As the borehole was advanced, rod lengths were added allowing for borehole penetration up to 1.5m into the host material. The statically driven Shelby tube could not be used in this case as there was no adapter made to allow for the excavation of the borehole to depths of 1.5m or more. A photo of the hand auger used to excavate the boreholes is shown below in Figure 5.4. Due to the nature of the excavation of the borehole the samples recovered during the excavation were considered to be disturbed and therefore were not collected for further laboratory testing. During the manual rotation of the hand auger, the borehole was found to 126
140 deviate from the horizontal. In an attempt to correct this error, the horizontal plumbness of the auger was checked frequently by affixing two levels to the shaft of the auger located at 90º to one another and this orientation corrected as necessary. The test procedures and monitoring techniques employed for these experiments were similar to those used in the smaller-scale tests. The accumulation of the internal mud pressure was monitored using the same resistance pressure transducer described in Chapter 4 with the signal cable fed through the centre of the packer. Due to the larger-scale, a larger diameter, highpressure packer manufactured and marketed by RocTest Canada (model number LP/ ) and an American Sensor Technologies (AST) pressure transducer were substituted for the low pressure instruments described in Chapter 4. Each instrument was capable of resisting or monitoring pressures up to 6500kPa (RocTest, 2007) and 2400kPa for the packer and the pressure transducer respectively. The pressure transducer is accurate to <±0.5% best fit straight line (BFSL) at a temperature of 25 Celsius as reported by AST for an AST4000 series pressure transducer. The packer was a high-pressure nitrogen inflated packer commonly used to maximize groundwater yield through hydrofracture of water wells, to test in situ rock strength by inducing hydrofractures in rock formations (Hefny and Lo, 1992), and to estimate the relative hydraulic conductivity in fractured rock formations (CFEM, 4 th Edition, 2006). The packer measured 1.2m in length and was set into the borehole so that there was a minimum of 0.5m of open borehole available at the end of the excavation for testing. The high-pressure packer was substituted so that the occasional slippage of the packer out of the borehole observed during the smaller-scale experiments was avoided. The length that the packer was placed into the borehole may have expanded a section of soil immediately around the length of the packer and potentially could lead to premature failure of the borehole through shear failure. The shear failure of the borehole 127
141 during fluid loading did not consider the additional expansion of the soil due to the inflation of the packer within the borehole. As in the smaller-scale experiments, a resistance pressure transducer cable was used so that the downhole pressures could be accurately monitored throughout the course of the experiments. A minimum of 250 mm of signal cable was extended beyond the end of the packer so that the pressure transducer was positioned in the centre of the borehole opening. A photo of the highpressure packer with the pressure transducer is shown in Figure 5.5. As with the smaller-scale experiments, the signal cable was connected to a data acquisition system (described in Chapter 4), that was capable of monitoring the applied pressures at a sufficient sample rate to fully capture the dynamic effects of the hydrofracture tests. Care was taken to protect the accuracy of the pressure transducer by minimizing the disturbance to the pressure transducer during movement into and out of the borehole. To ensure that the opening of the borehole was sealed by the packer, a small portion of the packer was left out of the borehole so that the packer could balloon out around the opening in the Lexan plate effectively sealing off the soil. A profile of the un-inflated packer once installed into the borehole is shown in Figure 5.6. If a seal was not made with the Lexan opening, mud loss would typically occur along the length of the packer and escape from the borehole opening. 128


142 Figure 5.5 High-pressure packer used in larger-scale experiments Figure 5.6 Position of the high-pressure packer in the borehole SURFACE DISPLACEMENT MONITORING The surface monitoring carried out during the larger-scale experiments was completed using a relatively new method specifically designed for multiple point, surface displacement monitoring referred to as Particle Image Velocimetry. By capturing multiple, high resolution digital images 129
143 of pre-selected targets throughout the experiments, the displacements of the targets were tracked and subsequently calculated to give the overall displacement pattern for that target. The cameras were positioned in such a way that they would each capture a key region of the ground surface. One camera was positioned axially along the length of the borehole facing the end wall and the second was positioned on the ground surface across the length of the borehole. The camera positioned to capture the displacements across the length of the borehole was placed in the centre of the sidewall so that any ground heave at the end of the borehole would be effectively captured. Small wooden blocks with similar dimensions were painted with black smears, so that distinct targets could be selected on each block. These black paint smears or dots were painted on two sides of each block at ninety degrees to each other so that both cameras would have adequate mutual targets to focus on. Based on the observations of the smaller-scale experiments, it was clear the frequency of the image capturing would need to be sufficient to accurately capture the displacement of the ground surface as the tests occurred. The two cameras were programmed to capture images at four (4) second intervals, and then the images were uploaded directly to a personal computer (PC) for storage. The cameras were synchronised by setting identical times for the two image storing computers. Once the internal clocks were synchronized, the cameras were pre-programmed to start recording images at a mutually set time. Some deviation between the actual and programmed sample rate occurred causing the cameras to come out of synch though the error remained relatively small (generally less than one second). 130
144 By knowing the dimensions of the fixed objects within the images, the displacement in millimetres could be calculated in each respective direction. Displacements are reported in terms of millimetres for both the horizontal (x or y) and vertical (z) directions. Displacements towards or away from the camera could not be recorded. Two cameras with axes oriented at ninety degrees to one another were used so that displacements in three dimensions can be evaluated. The targets were placed at 0.25m intervals on the ground surface, staggered so that movement of any one target did not result in interruption of the view of other targets behind. In the line of site of both cameras, stationary (or fixed) targets were painted on the concrete walls of the pit so that, should the camera have moved during the experiment, the displacement of the camera could be determined by tracking these targets. The placement of the fixed targets was necessary as one of the cameras was placed directly on the surface of the soil to minimize parallax effects. During ground displacements that arose during the layered soil tests, that camera on the ground surface was subject to minor vertical displacements. If left uncorrected, these would have lead to substantial inaccuracies in the values of surface heave. It was not possible to fix the camera placed on the ground surface and not introduce parallax angles to the images. The configuration of the cameras was one that allowed the images to be recorded on a level plane. Additional lighting was also provided to minimize errors resulting from the movement of shadows or shifts in the natural light as it entered the laboratory. Finally, prior to the start of the tests, photographs were taken of the targets for at least one minute prior to loading of the borehole with the pressurized drilling fluid. This was done to collect a baseline of background movement or noise to help differentiate between the actual surface displacements and movements of the camera during the test. Once the experiments were completed, the data were compiled and the vertical and horizontal displacements were calculated 131
145 to the nearest millimetre. A check of the displacement data for each test was available in that each camera provided values of vertical displacement for each target. Once the displacements were calculated in engineering terms, the vertical displacements captured from each direction were compared to ensure accuracy of the computations. In each of the larger-scale experiments, the percent difference between the vertical displacements detected by the two cameras ranged from 1.1 to 5.3%, and was typically around 3.0%. The results of the displacement monitoring during the larger-scale experiments will be discussed in further detail in subsequent chapters DATA ACQUISITION SYSTEM Just as in the smaller-scale experiments, a 24Volt DC current power source was used to excite the pressure transducer which provided an output range of 1 to 5 Volts which were then converted to engineering units based on the instrument calibrations. The pressure transducer was calibrated between each experiment to ensure accuracy and detect any damage to the instrumentation that might have occurred. The data acquisition system software used was Labtech Notebook installed and run from a personal computer (PC), which was the same system used in the smaller-scale experiments, where it was found to perform well. A sample rate of 500HZ was programmed into the data logger for the larger-scale experiments. In order to stabilize the recorded output, and to minimize noise, the data was averaged over every fifty points, resulting in an effective sample rate of 10Hz. This sample rate of 500Hz was the shortest sample rate that could be stably sustained by the data acquisition system over the duration of the experiments. 132
146 5.3 EXPERIMENTAL RESULTS INTERNAL FLUID PRESSURES - SAND The results of the experiments on uniform layer of sand obtained using the experimental methodology described in the previous sections will be described in this section. When the measured maximum internal pressures from experiments LS1, LS2 and LS3 are compared, the maximum internal fluid pressures in the borehole were found to be 75.6, 81.1 and 94.6 kpa, corresponding to a maximum percent difference between the three experiments of 22%. The results of the maximum internal mud pressures measured during the larger-scale experiments are shown below in Figure 5.7, and test details are provided in Table 5.1. Images of the ground surface of the sand experiments following fluid loss at the ground surface are shown below as Figures 5.8 to Test Identification Estimated Internal FEA Delft Yu & σ vo p max Results Solution Houlsby (kpa) (kpa) (kpa) (kpa) (kpa) Carter, Booker & Yeung (kpa) LS 1 - Sand LS 2 - Sand LS 3 - Sand LS 4 - Layered LS 5 - Layered Table 5.1 Results of larger-scale experiments and various analytical solutions 133
147 LS5 Layered LS1 - Sand LS2 - Sand LS3 - Sand LS4 - Layered LS4 Layered LS5 - Layered LS2 Sand Only Time (sec) 0 Internal Pressure (kpa) LS3 Sand Only LS1 Sand Only Figure 5.7 Large scale tests: internal drilling fluid pressures (sand and layered experiments) 134
 Approximate open borehole location Figure 5.")
148 End of packer (approximate) Drilling fluid Approximate open borehole location Figure 5.8 LS1 sand only Drilling fluid End of packer (approximate) Approximate open borehole location Figure 5.9 LS2 sand only 135
149 End of packer (approximate) Approximate open borehole location Drilling fluid Figure 5.10 LS3 sand only The results of the two-dimensional finite element analysis using the program AFENA (Carter, 1992) considering only a low cohesive frictional material with no filtercake, was calculated as 74kPa. The percent difference between the experimental results and those calculated during the finite element analysis was found to be 2, 9 and 24%. Comparison of the FEA results with the average peak pressure obtained from the sand only experiments (83.8kPa) results in a difference of approximately 12%. Comparison of the Delft solution Keulen et al. (2001) shows that blowout is estimated to occur at a maximum internal pressure of 97.7kPa or a percent difference of 3.2, 18 and 25% when compared to each of the peak experimental fluid pressures. The average of the three sand only experiments results in difference of approximately 15% when compared to the Delft solution. Application of the cavity expansion theory developed by Yu and Houlsby (1991) suggest that a 136
150 maximum internal pressure is calculated as 207.8kPa or percent differences of approximately 75, 88 and 93% when compared to the observed peak internal pressures and 85% when compared to the overall average of the three experiments. The last cavity expansion solution that was considered was developed by Carter et al. (1986). This solution results in a maximum internal pressure of 199.3kPa or percent differences of approximately 71, 84 and 89% when compared to the observed maximum internal pressures. The difference between the calculated and average peak pressure is approximately 82%. It is interesting that the more complex cavity expansion theories tended to significantly overestimate the maximum internal pressure, while the two-dimensional finite element analysis and Delft solution generally resulted in a reasonable correlation with the observed experimental values. When considering the maximum allowable internal radius as two thirds of the depth to the ground surface, as suggested by Keulen et al. (2001), one can conclude that the finite element analysis and the Delft solution would provide adequate estimations of limiting internal mud pressures during projects involving HDD through uniformly graded, unsaturated sands INTERNAL FLUID PRESSURES - LAYERED MATERIALS As described above, the two experiments presented in this section were carried out using a layered sand/granular configuration. The surface layer was composed of a well-graded granular material commonly referred to as Granular A that is typically used as a subgrade or base course for most roadways. The sand was placed as before; however, in the case of the granular surface, the upper 300mm consisted of the Granular A material compacted to a density near to typically reported relative densities for this type of material (Bowles, 1996). Standard Proctor testing was not carried out on representative samples of this material. 137

151 It was expected in these experiment, that the peak internal mud pressure would be higher than those pressures observed in the sand tests, because the relative density of the granular material was higher than sand material alone. Because the upper layer was replaced with a material with a higher relative density, the initial internal geostatic pressure acting on the crown of the borehole (p o ) was greater than the overburden pressure from the sand alone. The maximum internal mud pressures that were measured during the two layered experiments were observed as and 150.5kPa. The results of the maximum internal mud pressures observed during the experiments carried out in the case of layered granular materials are indicated on Figure 5.7 and on Table 5.1. Photographs of the ground surface following completion of the two layered tests are shown below as Figures 5.11 and End of packer (approximate) Drilling fluid Approximate open borehole location Figure 5.11 LS4 sand and Granular A' layered materials 138

152 End of packer (approximate) Drilling fluid Approximate open borehole location Figure 5.12 LS5 sand and Granular A' layered materials Comparison of the results of the layered experiments to those obtained from the analytical methods was then carried out to evaluate the effectiveness of each method. The maximum internal pressure estimated by the two-dimensional finite element analysis was 130.1kPa which corresponds to percent differences of 1.7 and 14.5% when compared to the experimental results. Comparison of the FEA results with the average peak pressure obtained from the layered experiments (141.4kPa) results in a difference of approximately 8%. The results for the maximum internal pressures calculated by the Delft solution, Yu and Houlsby (1991) as well as by Carter et al. (1986) were determined by assuming a composite unit weight, cohesion and angle of internal friction that was weighted based on the total depth of each 139
153 material. Though the assumption of a composite material is a slight approximation, to compute a maximum internal pressure considering two materials, some conjecture is required. Calculation of the maximum internal pressure assuming the Delft solution results in an internal pressure of 101.6kPa or percent differences of 26 and 39%. The average of the two layered experiments results in difference of approximately 33% when compared to the Delft solution. The cavity expansion theory presented by Yu and Houlsby (1991) results in a peak internal pressure of 214.3kPa corresponding to percent differences of 47 and 35% or 41% when compared to the average peak pressure. Finally the result of the cavity expansion theory developed by Carter et al. (1986) results in a maximum internal pressure of 209.7kPa or percent differences of 45 and 33% respectively and 39% for the average peak pressure SURFACE DISPLACEMENT The surface displacements were monitored throughout the course of all of the larger-scale experiments using the GeoPIV system described in previous sections. The surface heave observed during the sand tests was found to vary from 8.7 to 43.8mm though was typically around 25 to 27mm along the centreline of the borehole. The horizontal displacements in both lateral directions were found to vary from 3 to 25mm though were typically around 15 to 22mm. The final results indicate that the ground showed near vertical heave with the maximum displacement occurring along the centreline of the borehole. The displacements tapered down to near zero with distance from the centreline of the borehole. Observation the movement of the camera placed on the surface of the soil indicated slight vertical movement around 1 to 2mm as a result of the radial expansion during the internal pressurization of the drilling fluid. Quiver and contour images of each of the experiments carried out in the single layered sand material are shown as Figures 5.13 through to
154 The volume of the displaced material was calculated from the three dimensional images following calculation of the overall displacements for the single layered experiments. The fluid volumes ranged from 6.7 to 24.1L. An incremental volume was calculated for the first case to try to determine how the displacement occurred with time of application. From Figures 5.13b and 5.14b, it can be seen that at a time approximately 12 to 15 seconds before the fluid breach of the ground surface, (approximately 1/2 of the experimental time) resulted in approximately 1/3 of the total displacement. The time reference used for the volume calculations assumed that the breach of the ground surface corresponds with the maximum observed fluid pressure. The displacement results of the two-dimensional finite element analyses of the case of the sand only were then compared to those observed during the single layer laboratory experiments. It was found from the finite element analysis that the displacements were not very well represented by the current finite element model. Typical displacements reported by the numerical analysis ranged from 2 to 3mm, with the upper limit observed with increasing soil density. When compared to the observed displacements of around 25mm, the percent difference between the numerical analysis and the experimental findings was around 89%. The source of this error is likely based in the fact that the numerical analysis models the application of the drilling fluid as a pressure which does not possess a physical volume. During the application of the drilling fluid, the additional volume resulted in substantially greater surface displacements than those reported by the FEA. Another possible source of error may be that for a FE model to be valid, it is assumed that the material being modelled is continuous (either a solid mass or highly fractured throughout). Clearly it can be seen from the photographs that the cracking resulting from the borehole pressurization is concentrated to a small area, and consequently the material within the cracked zone is no longer a continuous. 141
155 Based on these results, it is clear that a finite element numerical analysis cannot be used to describe the surface deformations in HDD applications. Further research is required to develop a suitable numerical model to accurately represent the deformations resulting from the application of a drilling fluid. Open Borehole End of Packer (approximate) Figure 5.13a Resultant quiver diagram LS1 - Sand only Note: All dimensions in metres; total volume of displaced soil is 6.7L. 142
156 Open Borehole End of Packer (approximate) Figure 5.13b Partial resultant quiver diagram LS1 - Sand only Note: All dimensions in metres; total volume of displaced soil is 2.1L. 143

 144")
157 Open Borehole End of Packer (approximate) Figure 5.14a Resultant contour diagram LS1 Sand only (all dimensions in metres) Open Borehole End of Packer (approximate) Figure 5.14b Partial resultant contour diagram LS1 Sand only (all dimensions in metres) 144
158 Open Borehole End of Packer (approximate) Figure 5.15 Resultant quiver diagram LS2 - Sand only Note: All dimensions in metres; total volume of displaced soil is 17.8L. 145
 Open Borehole Figure 5.")
159 Open Borehole End of Packer (approximate) Figure 5.16 Resultant contour diagram LS2 - Sand only (all dimensions in metres) Open Borehole Figure 5.17 Resultant quiver diagram LS3 - Sand only Note: All dimensions in metres; total volume of displaced soil is 24.1L. 146
 The calculated surface displacements monitored during the two layered experiments were found to be very similar to those")
160 Open Borehole Figure 5.18 Resultant contour diagram LS3 - Sand only (all dimensions in metres) The calculated surface displacements monitored during the two layered experiments were found to be very similar to those observed in the previous experiments carried out in the sand only. The most distinct difference was in the total area of the material that underwent displacement during loading or the zone of influence impacted by the loss of drilling fluid at the ground surface. Observations of the surface displacements of the layered material indicated that some displacements occurred at the edges of the test pit and were found to affect the position of the camera placed on the surface of the soil. In the overlying layer of the experiments involving sand and gravel, the area that experienced surficial cracking and heave was significantly greater than these regions in the uniform sand tests. As is shown in the vector and contoured images attached below as Figures 5.19 to 5.22, the area impacted by the ground failure is contained mostly to a radius of around 400mm or less, whereas 147
161 the radius of influence in the sand and gravel was found to heave relatively uniformly as a mass forming a shallow crown on the surface over the centreline of the borehole. The maximum observed surface displacements for the layered experiments were found to vary from 25 to 27mm in the vertical direction and from 5 to 22mm in both horizontal directions (lateral ground movements). Open Borehole End of Packer (approximate) Figure 5.19 Resultant quiver diagram LS4 - Sand and gravel layered Note: All dimensions in metres; total volume of displaced soil is 22.8L. 148
 21 Resultant quiver diagram LS5 - Sand and gravel layered Note: All dimensions")
162 Open Borehole End of Packer (approximate) Figure 5.20 Resultant contour diagram LS4 - Sand and gravel (all dimensions in metres) Open Borehole End of Packer (approximate) Figure 5.21 Resultant quiver diagram LS5 - Sand and gravel layered Note: All dimensions in metres; total volume of displaced soil is 20.2L. 149
 The volume changes associated with the application of the drilling fluid were calculated following completion of the")
163 Open Borehole End of Packer (approximate) Figure 5.22 Resultant contour diagram LS5 - Sand and gravel (all dimensions in metres) The volume changes associated with the application of the drilling fluid were calculated following completion of the displacement analysis from the three dimensional plots. The total change in volume calculated during the layered material experiments ranged from 20.2 to 43.6L. When the experimental results were compared to the displacement results of the numerical model, it was observed that like the sand case the finite element analysis did a poor job in representing the actual displacements above the centreline of the borehole. In most cases, the estimated vertical displacements at the ground surface were around 1.5 to 2.5mm and the horizontal displacements were negligible. These estimated displacements result in percent differences in the vertical and horizontal directions of around 92 and 100% respectively. When compared to the physical models, the surface displacements determined from the FE model were not accurate. The finite element analysis model is relatively good at estimating the maximum allowable 150
164 internal pressures however it underestimates the magnitude of the vertical displacements observed at the ground surface above the centreline of the borehole. Unlike the smaller-scale experiments, the movement of the surface of the layered material did not necessarily occur above the centreline of the borehole. In fact, in the two, layered, larger-scale experiments, the fluid leakage at the ground surface occurred at some distance from the centreline. It is believed that the drilling fluid pooled beneath the granular layer and as pressure accumulated, the drilling fluid naturally sought the path of least resistance which would have been the thinnest and/or the least compact section. It should be noted that though the sand and gravel material was cohesionless and possessed a relatively high coefficient of permeability (k), the permeability of the underlying sand was slightly higher. The coefficient of permeability of the sand was measured from the laboratory tests to be approximately 3.2x10⁻³ cm/s while the typical k value is around 1x10⁻⁴ cm/s for a well graded Granular A material (Holtz and Kovacs, 1981, OPSS 1010, 2004). The difference between the two k values was enough to allow the fluid to pool and travel horizontally below the sand and gravel until a breach of the surface could be completed. The pooling of the drilling fluid was observed to some extent during the excavation process where the upper 25 to 50mm of the underlying sand was infiltrated with drilling fluid as a path was formed to the ground surface. The granular layer immediately above the pool was not always infiltrated by the drilling fluid, and in fact, in most cases once failure had occurred and flow with the ground surface had been established, the volume of infiltrated granular material was very small. Most of the affected granular soil was from the accumulation of drilling fluid at the ground surface that began to seep back into surface cracks formed around the initial flow path from the pooled drilling mud once the pump was turned off. 151
165 5.4 CONCLUSIONS Based on the results of the larger-scale hydrofracture experiments, it can be concluded that within a relatively loose to compact sand material as well as in the layered soil profile considered in these experiments, the nature of the hydrofracture failure is largely concentric around the centreline of the borehole. The assumption of the nature of the borehole failure is based on the observations of the soil around the borehole that was affected by the drilling fluid. The filtercake thickness generally formed a uniform thickness around the borehole that measured approximately 2 to 4 borehole diameters. The maximum displacements typically occur immediately above the centreline with a relatively large area impacted in terms of soil disturbance and surface cracking. The maximum internal mud pressures are well estimated employing either the solution described by Lugar and Hergarden (1988) or the Delft solution (Keulen et al. 2001) or a finite element analysis model with reasonably accurate soil parameters. The solutions outlined by Yu and Houlsby as well as by Carter et al. (1986) were found to overestimate the maximum internal pressures significantly. When the finite element analysis was used to estimate the displacements at the ground surface, it was found that the maximum vertical heave was significantly underestimated. A summary of the findings is provided below. In general, the test methodology developed during the smaller-scale experiments transferred well to the larger-scale tests which yielded consistent reproducible results for similar test scenarios. The variation between the three larger-scale tests carried out on the sand alone was found to be approximately 22%. The percent difference between the two tests conducted on the layered soils was observed as 13%; During the single layered sand experiments, the range of maximum internal fluid pressures was recorded as 75.6, 81.1 and 94.6kPa. These results compared well to the results obtained from the finite element analyses and the Delft solution which imply that the maximum pressures is 74.0 and 97.7kPa respectively or percent differences from the 152
166 observed values of 2 to 24% for the finite element analysis and from 3.2 to 25.5% for the Delft solution; In the layered materials the measured internal mud pressures were observed as and 150.5kPa. When the test results are compared to those of the finite element analysis and the three closed-form solutions, again the finite element analysis provided an accurate estimation of the maximum internal mud pressure of 130kPa corresponding to a percent difference of 1.7 and 14.5% respectively. The Delft solution was found to underestimate the maximum pressure with a result of 101.6kPa or a percent difference of 33%. Yu and Houlsby (1991) as well as Carter et al. (1986), overestimated the maximum internal pressures resulting in maximum pressures of and 209.7kPa respectively. These pressures correspond to differences of 38 and 39% respectively. The source of error from the closed form solutions is likely from the assumption of a composite material based on a weighted average of the sand sand and gravel materials.; Displacement monitoring using digital cameras and post-test calculation using GeoPIV proved to be very effective in capturing the vertical heave observed and the displacements in three dimensions. The difference between similar targets captured from two different angles ranged between 1.1 and 5.3%; Displacements in the sand alone scenarios were found to range from 8.7mm to greater than 40mm though were typically around 25 to 27mm. Displacements greater than 40mm could not be reported with any certainty. The displacements in both horizontal directions were measured to be approximately 15 to 22mm; The displacements of the layered soils were slightly less than those observed in the sand alone cases. Vertical heave was measured to vary from 25 to 27mm immediately above the centreline of the borehole and tapering down towards the sidewalls of the test cell. 153
167 The horizontal displacements ranged from 5 to 22mm which is similar to those observed in the sand alone; The finite element analysis was found to underestimate the vertical displacements significantly resulting in typical displacements of 2 to 3mm in both the sand alone and the layered cases. These resulted in a variation of approximately 89% for the sand alone and around 92 to 100% differences for the layered case. It is likely that the source of the error between the physical and the numerical model is a result of two key assumptions of the numerical model. First, it is assumed that the pressure of the drilling fluid can be accurately represented by nodal forces acting on the elements surrounding the borehole; and second, that the material modelled is a continuum. The experiments showed that the drilling fluid adds a significant amount of volume to the material (approximately 6.7 to 43.6 L, though volume change was typically around 20 L) which cannot be accurately represented by the numerical model. It was also clear that once cracks began to form around the borehole, the soil was no longer continuous and cannot be modelled assuming a continuum. Incremental monitoring of the volume changes with application of the drilling fluid indicate that the majority of the surface displacements take place near to the breach of the drilling fluid at the ground surface. At approximately 12 to 15 seconds before the breach of the ground surface (approximately 1/2 to 2/3 of the total experimental time), only 1/3 of the total of displacement had occurred. REFERENCES Bowles, J.E. (1995). Foundation Analysis and Design. Fifth Edition. McGraw-Hill, New York, New York. page
168 Canadian Geotechnical Society. (2006). Canadian Foundation Engineering Manual (CFEM). Fourth Edition. Technical Committee of Foundations, Richmond, British Columbia. pages Carter, J.P. (1992). PROGRAM AFENA: A general finite element algorithm, University of Sydney. Carter, J.P., Booker, J.R. and Yeung, K.S. (1986). Cavity expansion in cohesive frictional soils. Geotechnique, Vol. 36(3): Conroy, P. J., Latorre, C. A., and Wakeley, L. D. (2002a). Installation of fiber-optic cables under flood-protection structures using horizontal directional drilling techniques. ERDC/GSL TR-02-8, Geotechnical Structures Laboratory, Vicksburg, MS.USACE. Conroy, P. J., Latorre, C. A., and Wakeley, L. D. (2002b). Guidelines for installation of utilities beneath Corps of Engineers levees using horizontal directional drilling. ERDC/GSL TR-02-9, Geotechnical Structures Laboratory, Vicksburg, MS. USACE. Hefny, A., Lo, K.Y. (1992). The interpretation of horizontal and mixed-mode fractures in hydraulic fracturing tests in rocks. Canadian Geotechnical Journal, Vol. 29: Holtz, R.d., Kovacs, W.D. (1981). An Introduction to Geotechnical Engineering, Prentice Hall, Toronto, page 210. Keulen, B., Arends, G., Mastbergen, D.R. (2001). Maximum allowable pressures during directional drillings focused on sand. Delft Geotechnics Thesis Paper: 23-32, Appendices
169 Latorre, Carlos A., Wakeley, Lillian D., and Conroy, Patrick J. (2002). Guidelines for installation of utilities beneath Corps of Engineers levees using horizontal direction drilling. Geotechnical Structures Laboratory, Vicksburg, MS. USACE. Lugar H.J., Hergarden H.J.A.M. (1988). Directional drilling in soft soil; influence of mud pressures, Proc., ISTT-No Dig, 1998, Washington D.C., Paper 6B: 1-7. Ontario Provincial Standards Specification (2004). Material specifications for aggregates base, subbase, select subgrade and backfill material. Ontario Provincial Standards, Vol. 2(1010): RocTest Canada. (2007). Technical specifications high-pressure packers. website, Van Brussel, G.G., Hergarden, H.J.A.M. (1997). Research (CPAR) program: Installation of pipelines beneath levees using horizontal directional drilling. SO /2. Department of Foundations and Underground Engineering, Delft Geotechnics, Vesić, A.S. (1972). Expansion of cavities in infinite soil mass. ASCE Journal of the Soil Mechanics and Foundations Division, Vol. 98: White D. J., Take W.A., Bolton, M.D. (2003). Soil deformation measurement using particle image velocimetry (PIV) and photogrammetry. Geotechnique, Vol. 53(7):
170 Yu, H.S., Houlsby, G.T. (1991). Finite cavity expansion in dilatant soils: loading analysis, Geotechnique, Vol. 41(2): Yu, H.S. (2000). Cavity Expansion Methods in Geomechanics. Kluwer Academic Publishers,
171 CHAPTER 6 SUMMARY, CONCLUSIONS AND RECOMMENDATIONS FOR FUTURE RESEARCH 6.1 INTRODUCTION The purpose of this research was to investigate and evaluate the effectiveness of various cavity expansion theories when they are used to estimate the maximum internal drilling fluid pressures as they relate to hydrofracture or blowout of horizontally directionally drilled (HDD) boreholes. Currently the state-of-the-art method for estimating the maximum allowable mud pressure is determined using numerical models and closed-form solutions (Conroy et al. 2002a,b). These methods are readily employed and can to some extent help design engineers overcome the restrictions that have previously been imposed on the trenchless installation of pipelines within either a populated urban setting or within environmentally sensitive areas. Though there are a variety of numerical models and closed-form solutions to the problem of the expansion of the borehole cavity during loading, there have been very few studies carried out to determine the actual usefulness of these methods. It was the goal of this study to design and carry out a series of laboratory experiments that could provide physical hydrofracture data and corresponding insight into the problem of hydrofracture within a cohesive frictional material. Using the physical data, a comparison was made between the test results the theoretical models and solutions. Input parameters for the existing two-dimensional models were also refined to reflect the findings of the laboratory tests, and a parametric study was undertaken to compare the impact that the drilling fluid would have on the overall strength of the borehole. During the course of this investigation two sets of laboratory experiments were carried out. To date there have been a number of studies investigating the impact of the accumulation of down- 158
172 hole drilling fluid pressures within perfectly cohesive soils typically associated with lacustrine (lake sediment) deposits. Lugar and Hergarden (1988), Stehali et al. (1998) and Keulen et al. (2001) report on a variety of full and larger-scale experiments undertaken during field installations of buried pipelines or within a controlled laboratory setting where the problem of fluid loss could be closely monitored. The experiments carried out during this investigation differed from the abovementioned studies in that the emphasis was solely on the response of low cohesion, primarily frictional materials, whereas the earlier test programs were primarily focussed on purely cohesive deposits. Furthermore, the goal was to obtain a variety physical data for parameters associated with the internal loading of horizontal boreholes, rather than measuring ultimate downhole pressures in the vertical boreholes considered in the previously reported experiments. The issues investigated during the laboratory experiments reported in this thesis included: The maximum downhole pressure of the applied drilling fluid, and the influence of the applied overburden pressure on the maximum drilling fluid pressure, to help better understand the impact of borehole depth on resistance to hydrofracture; The extent and rate of radial attenuation of stresses as they are transmitted through the soil; these were examined by monitoring the horizontal stress increase at the sidewall of the test cells in the smaller-scale experiments; The overall effect of borehole pressure on ground displacements as the borehole expands, and the increase in material volume as drilling fluid is added to the soil matrix (though the fluid volume was not monitored accurately during the experiments); and 159
173 The effect of a layered granular system and the influence a very dense soil at the ground surface like those used in road pavement applications. The nature of filtercake material recovered from the annulus of the borehole during the smaller-scale experiments; samples were subjected to a series of laboratory tests to help better understand the physical changes that the native soil underwent following intrusion of the drilling fluid. 6.2 NUMERICAL MODELLING Like earlier studies, the results of this investigation were used to help refine existing numerical models. During the course of this study, the numerical models developed by Kennedy et al. (2004a,b; 2006), and Wang and Sterling (2006) were utilized and were refined by the use of material parameters determined from a series of laboratory experiments designed to define the physical characteristics of the filtercake and sand materials. Material properties were obtained using a series of laboratory tests to determine the physical properties of both the native sand and the filtercake materials, including tests to determine the representative grain sizes of both materials as determined by several sieve and hydrometer tests, compaction characteristics verified from standard Proctor testing, and hydraulic parameters from falling head tests. All lab experiments were carried out on both the filtercake and the sand materials. A numerical investigation of the influence of the filtercake on the overall shear strength of the material in the borehole walls was also undertaken. Based on the results of the physical characteristics of the filtercake material, the two-dimensional finite element model and mesh developed by Kennedy et al. (2004a; 2006) was refined and analysed assuming a variable thickness of filtercake surrounding the annulus of the borehole. The results of the numerical analysis were then compared to the results of the Delft solution (Lugar and Hergarden, 1988) and those reported by 160
174 Yu and Houlsby (1991). The results were reported in terms of the plastic radius normalized by the original borehole radius versus the applied pressure normalized by the initial pressure. It was expected that as the thickness of the filtercake increased, the growth of the plastic radius would be slower that for thinner cases. It was found however that the influence of the filtercake was minimal and did not have any obvious impact on the expansion of the plastic zone as mud pressures in the borehole increased. These results reflect the findings of the physical properties of the filtercake material relative to the native soil. Because there were few physical changes in the characteristics of the filtercake with respect to the native sand, there is little change in the borehole s resistance to fluid pressures. The growth of the plastic radius did not indicate any major changes from one model to the next. When the radius of the plastic radius was calculated for each model, it was clear that the radius corresponded with similar nodes from model to model. This is because the search radius was limited by the number and density of the elements. The density of the mesh decreased with distance from the borehole, which also reduced the number of nodes that were able to yield. Because the number of elements was greatly reduced with distance from the borehole, it stood that as the plastic radius expanded, the accuracy of the length of the radius would be reduced. In reality if a mesh with a greater number of small elements was utilized it was likely that the size of the plastic radius would vary slightly more than it was found to. By restricting the search to element nodes, the accuracy of the plastic radius would therefore only be as precise as the relative size of the specific finite elements used in the mesh. The results showed a close correlation at lower pressures with both the Delft solution (Van Brussel, 1997) and Yu and Houlsby (1991). The percent differences between the two solutions and the numerical model began to increase slightly as the plastic radius increased beyond 10 times that of the initial borehole radius as shown in Figure 3.1 (Chapter 3). 161
175 6.3 DOWNHOLE PRESSURES During the course of the laboratory experiments, the maximum internal fluid pressures were monitored. In each case, a freely draining, poorly graded sand was deposited in either a small or larger-scale test cell and compacted to within 98% of the standard Proctor maximum dry density. The material was placed within ±2% of the optimum moisture content. The applied overburden was varied mechanically during the smaller-scale experiments in order to provide a range of maximum internal pressures to help better understand the influence of depth on the maximum internal fluid pressure. Following placement of the sand and application of the selected overburden pressure, the borehole was advanced through an opening within an end wall of the cell. The borehole was excavated using either a specially designed Shelby tube or a hand auger with suitable length adapters (smaller and larger-scale experiments, respectively). Following the excavation of the borehole, a downhole pressure transducer was installed through the centre opening of an inflatable packer for both the smaller and larger-scale experiments. The pressure transducer was capable of capturing the dynamic nature of the experiments and provided an overall picture of the loading scenario within the borehole during the application of the drilling fluid. The results reported in Chapters 4 and 5 indicate that as the applied overburden pressure increases, the maximum internal mud pressure increases nearly linearly as shown by the scatter of the various data points from the line of best fit through these data points. Measurements of the horizontal pressures observed at the sidewalls of the smaller-scale experiments indicated that the radius of influence from the internal loading of the borehole was greater than four borehole diameters in the horizontal direction, though the exact extent of the pressure bulb could not be accurately ascertained due to the sample rate of the sidewall pressure transducers. 162
176 The results of the laboratory experiments indicated a good correlation with the current state-ofthe-art practice as described by Lugar and Hergarden (1988) for the sand only cases and a reasonable estimation of the maximum internal pressures for the layered cases. The correlation indicates that the lateral earth pressure likely does not play a major role in the hydrofracture failure of boreholes in sands beyond establishing the position of the origin of the fluid loss. During the two experiments where the horizontal stresses were monitored, it was shown that on average, the vertical stress was approximately twice that of the horizontal, indicating that failure should occur from either the invert or the obvert of the borehole. The Delft solution (Van Brussel, 1997) was applied by assuming a maximum plastic radius of the total depth of the overlying material. The Delft solution underestimated the maximum internal pressures by from 2 to 24%. The numerical (finite element) analyses provided a range of approximate maximum internal fluid pressures that tended to produce very similar results to those reported by the Delft solution with the percentage of error ranging from 3 to 25% when compared to the laboratory experiments. Other closed-form solutions describing the expansion of a cavity subjected to internal radial loading were somewhat less accurate and generally resulted in percent differences of about 40%. 6.4 FILTERCAKE FORMATION AND CHARACTERISTICS Following the loading of the borehole to failure, the soil was carefully excavated and the flow path of the drilling fluid to the soil surface during the smaller-scale experiments was observed. It was found that the connection with the surface was established in one of two ways. In some cases, a narrow transverse crack would form across the width of the test cell; through the centre of the crack a very narrow film of drilling fluid could be observed. The second case occurred by the formation of a localized flow path that completely washed out the surrounding soil and 163
177 opened large voids from the borehole to the surface of the soil. In both cases, the formation of the flow paths was believed to be random or there was no obvious indication as to why one flow path occurred instead of the other. The only common aspect of each case was the overall shape of the failure. The long narrow cracks would generally be in the shape of an inverted triangle with the point starting at the terminus of the borehole and rapidly spreading out to come in contact with the test cell walls. The washed out flow tubes were typically in the shape of inverted cones with some angular distortion, and like the cracks, they typically originated from the terminus of the borehole. Images of the two types of mud flow methods are provided in Chapter 4 as Figures 4.12 to It is possible that the size of the test cell may have restricted the expansion of the plastic radius on three of the four sides of the cell. The additional confinement of the stresses at the end may have led to a premature failure from the end of the borehole. It is also possible that the force of the drilling fluid exiting from the packer may have eroded a large portion of the end of the borehole upon the initiation of the mud flow. Observations of the nature of the flow path during the larger-scale experiments could not be accurately made. Slow excavation and observations of the drilling fluid affected material above the crown of the borehole was attempted during the larger-scale experiments. It was clear that no cracks or flow tubes were observed due to the complete saturation of the soil above the borehole. It is possible that the soil would collapse into any flow tubes that had formed once the pump was turned off. Based on these observations, it remains unclear how the mud flow to the ground surface occurred in the larger-scale experiments. Representative samples of the filtercake were obtained following the completion of the smallerscale experiments to characterise the changes in the physical properties with respect to the original sand material. It was found that the filtercake generally possessed the same grain size distribution of the native sand indicating that previous assumptions that the filtercake more 164
178 closely resembled that of a soft clay may be conservative. However the hydraulic conductivity did change dramatically with the addition of the bentonite slurry in that it was reduced by an order of magnitude. The time required to carry out the various experiments was on a scale of seconds which is not usually the case seen in actual drilling projects, nor did it provided sufficient time for the drilling fluid to solidify or set as it may in the field. The ability to control the rate of fluid application during these experiments was extremely limited and though efforts were made to slowly pump the drilling fluid into the borehole, it was found that a slow or intermittent fluid flow would cause mud loss from the sides of the smaller test cell before a surface breach could occur. It is recognized that failure of horizontal boreholes does not occur as quickly as was the case in the experiments. Failure does not usually result from the pressure of the pumped fluid alone, but rather occurs from a combination of the pumped fluid and the height of the column of drill fluid filling the borehole. However, due to the physical constraints of the laboratory setting, and the inability to safely construct and fill a suitably long column of drilling fluid needed to cause the borehole to fail, the method of the displacement pump was selected and ultimately used throughout the experiments. Samples of the filtercake material were recovered from around the borehole in the smaller-scale experiments to test the physical changes that occurred once the sand had been affected by the drilling fluid. Observations of the filtercake material that were given time to solidify did not show any significant changes in terms of cohesion or a strength increase from the material that was collected from around the borehole immediately following the experiments. It is also likely that the presence of groundwater within the soil would increase dilution to the drilling fluid. The drilling fluid itself could sit in a mixed state for weeks without solidifying or thickening from a free flowing, liquid state provided exposure to air was minimized. Once the fluid was exposed to 165
179 air, the slurry would dry to a thin crust or film that could be scraped off of the surface of the container that could not be remixed with the addition of water. 6.5 GROUND DISPLACEMENTS Throughout the course of the larger-scale experiments, the surface displacements of the soil were monitored using Particle Image Velocimetry or PIV (White et al. 2003). Targets placed on the surface of the soil at known locations were monitored by capturing a series of images throughout the course of the tests and tracking known pixel locations placed on the surface of the targets. The accuracy of the displacement monitoring was confirmed by comparing the data of two synchronized cameras positioned at 90 degrees to one another. The vertical displacements of identical targets were compared and confirmed that the measurements were consistent when monitored from two different positions. The orientation of the cameras also allowed for the monitoring of the soil displacements in three dimensions as each camera only monitors movements in a plane perpendicular to the lens axis, with vertical and horizontal components; any movements in towards or away from the camera could not be detected. Up to the time of these experiments, there had been no known examples of surficial heave monitoring carried out during the application of drilling fluid to horizontally drilled boreholes. The surficial monitoring was carried out during both the single and multiple layered larger-scale experiments. It was found that the surficial heave observed in the sand deposit was generally more localised than that of the layered soil deposits. During the layered experiments, the ground displacements were observed to generally lift the soil mass almost uniformly across its entire surface, while heave for the uniform unlayered sand was generally confined to areas located immediately above the centreline of the borehole. This suggests that the strength of the sand and gravel was greater than the underlying sand and unsurprisingly reacted as a rigid material ultimately resisting local deformation by bending and uniformly displacing until the drilling fluid breached the surface. 166
180 In general, the surficial displacements reported for both sets of experiments were very similar; they ranged from 20 to 30mm in the vertical direction. Horizontal displacements were less pronounced than the vertical displacements and ranged from 3 to 25mm. Unsurprisingly, for both cases, the surface displacement directly above the axis of the borehole involved nearly vertical movement without much horizontal movement. Calculation of the volume of drilling fluid accumulated in the test material was calculated from the PIV data following processing of the images. The volume of the fluid added to the materials during the experiments ranged from approximately 6.7 to 43.6 L for all of the experiments. The typical volume observed during the experiments was around 20 L. Calculation of the incremental volume at approximately 1/2 to 2/3 of the experimental time (assuming that breach of the drilling fluid at the ground surface corresponded with the maximum internal fluid pressure) resulted in a displacement of approximately 1/3 the overall displacement. This indicates that the majority of the surface displacement likely occurs when the drilling fluid is near to or immediately below the ground surface. 6.6 RECOMMENDATIONS FOR FUTURE RESEARCH Through the course of the experiments, areas requiring additional study were identified and addressed if possible. Based on the results of the investigation it was discovered that very little is known of the nature of hydrofracture through materials comprised of multiple layers like those found below roadways. The larger-scale experiments provided information on both the surface displacements and the impact of overburden pressure on the maximum internal pressure. However, they did not explain how failure occurred, nor did the investigation begin to provide 167
181 strong evidence as to the nature of the physical interactions which occurred at the interface between the two materials. The experiments were only carried out with one specific depth of granular material and at one relative density for the overlying material. To better understand the interactions between the two materials it is recommended that an additional series of layered experiments be carried out with specific attention paid to the nature of the fluid movement between the two soil layers and the relative density of both the host and overlying materials. It is also possible that by introducing additional flow obstructions into the soil such as existing buried pipelines or partially buried hydro poles, so that the interactions between multiple materials may be explained. It is suggested that a series of experiments be undertaken considering the proximity of partially buried infrastructure near to the borehole alignment. The infrastructure could consist of, but should not be limited to, buried poles common to hydro wire transmission or other buried pipelines. It is likely that these interactions happen on a daily basis within an urban environment as the capability of steering directional drill paths is a key factor for choosing directional drilling in city settings. It may be possible to place pore pressure transducers within the partially buried structures designed to monitor the accumulation of pore pressures in the vicinity of the borehole. Since it is likely that the addition of the partially buried structures will create potential flow paths to the ground surface, it is suggested that this imperfection be used to measure pore pressures that could not be measured during the experiments described in this thesis. To better understand the nature of the interactions between layered materials, it is recommended that additional material mixtures be utilized, including the combination of cohesive materials or fine grained cohesionless materials that are generally less conducive to compaction such as dilatant silts. Dilatant silts would likely be ideal as a fine grained material, as placement of the silts would be easier and more effective than recompacted clays. Though saturated silts tend to develop pore pressures exhibiting a livery appearance during mechanical compaction and are 168
182 therefore difficult to achieve a high level of compaction, the release of the pore water would cause the soil to dilate and flow, which would then fill any cracks or voids present within the material as a result of placement. Following a sufficient period of relaxation, the pore pressures would dissipate, resulting in a near native homogeneous state that would be adequate for testing. The data could also be compared to the results of this study as the majority of the silts in the southern Ontario region tend to possess reasonably high percentages of fine grained sands as well. It would also be desirable to expand upon the methodology developed in these experiments to test the nature of hydrofracture or blowout within a fully saturated granular material. The placement of the sand would be very difficult using conventional methods below the water table. However, an actuator could be used to provide a uniform vertical force on the surface of the sand and adequately compact the material prior to testing. This form of experiment, however, would require a specially designed test cell that is large enough to minimize the influence of the sidewalls and is capable of maintaining a level of freeboard above the surface of the soil without allowing groundwater loss through the opening for the borehole. While logistically this would be difficult, a study of maximum borehole pressures for fluvial or glacial fluvial deposits would prove invaluable in estimating the maximum allowable fluid pressures for horizontal crossings of various watercourses. From the results of the experiments, it may prove useful to recreate the experiments reported in the previous chapters and consider the effect of any negative pore pressures within the compacted granular materials. Clearly it was seen in Chapter 4 that the line of best fit through the recorded maximum internal fluid pressures if extrapolated to the y-axis do not pass through the origin. It is thought that the presence of negative pore pressures may influence the overall maximum internal 169
183 fluid pressure within horizontal boreholes. This theory has not previously been investigated, nor has it even been considered in any of the previous research that was studied during the course of this research. It is entirely possible that the influence of negative pore pressures in granular materials may play a significant role in the estimation of the maximum internal fluid pressures. To better provide a more realistic range of overburden pressures that are also closer to the actual geostatic pressures observed in actual field experiments, it is suggested that a series of scaled experiments be carried out at the centrifugal facilities located at C-Core. By using a centrifugal model, the limits of the applied geostatic stresses associated with simulated overburden pressure may be overcome. Modelling at a centrifuge would allow for rapid testing of a wide variety of overburden pressures which was ultimately attempted during this series of experiments. It is unlikely though that the pore pressures connected with the failure of the boreholes through hydrofracture or blowout will be monitored accurately during centrifugal models as the same difficulties encountered during these experiments will also be present in the centrifugal model. Finally, additional analytical models should be explored to investigate the effectiveness of two and three dimensional finite element models designed to study the impact of the abovementioned physical experiments. It would be useful to engineers and contractors alike to produce a coupled two dimensional numerical model to model both pore pressures and stresses. It is understood from the experiments reported in this thesis, that a two dimensional analysis is not representative of hydrofractures or blowouts which occur at the end of a borehole during the pilot bore. It may however present a useful method for estimating borehole failure along the length of a borehole or during final pullback of the product pipe following the completion of the pilot bore. A coupled, three dimensional analyses designed to model the pore pressures and stresses associated with internal loading of a borehole would be the most beneficial considering the nature of the 170
184 geometry and failures observed during the course of this study. It is clear based on the results of the surface displacement monitoring that plane strain conditions do not apply to these experiments, as failure typically occurred at the end of the borehole, indicating that there may be other factors associated with the loss of drill fluid from horizontal boreholes. Though the length of the borehole is significantly larger than the cross sectional area, it is likely that applied stresses which result from the internal radial loading of a borehole is not well represented by plane strain conditions. REFERENCES Conroy, P. J., Latorre, C. A., and Wakeley, L. D. (2002a). Installation of fiber-optic cables under flood-protection structures using horizontal directional drilling techniques. ERDC/GSL TR-02-8, Geotechnical Structures Laboratory, Vicksburg, MS.USACE. Conroy, P. J., Latorre, C. A., and Wakeley, L. D. (2002b). Guidelines for installation of utilities beneath Corps of Engineers levees using horizontal directional drilling. ERDC/GSL TR-02-9, Geotechnical Structures Laboratory, Vicksburg, MS. USACE. Conroy, P. J. (2003). Directional drilling under levees, St. Louis Corps of Engineers experience. Proc., 2004 North American No-Dig Conf., New Orleans, Paper No. B Kennedy, M. J., Skinner, G. D., and Moore, I. D. (2004a). Elastic calculations of limiting mud pressure to control hydrofracturing during HDD. Proc., No-Dig 2004, New Orleans, Paper No. E
185 Kennedy, M. J., Skinner, G. D., and Moore, I. D. (2004b). Limiting drilling slurry pressures to control hydrofracturing during HDD through purely cohesive soil. Proc., 2004 Canadian Geotechnical Society Conf., Quebec City, Paper No. 4E: Kennedy, M. J., Skinner, G. D., and Moore, I. D. (2006). Development of tensile hoop stress during horizontal directional drilling though sand. ASCE International Journal of Geomechanics, Vol. 6(5): Keulen, B., Arends, G., Mastbergen, D.R. (2001). Maximum allowable pressures during directional drillings focused on sand. Delft Geotechnics Thesis Paper: 23-32, Appendices Lugar H.J., Hergarden H.J.A.M. (1988). Directional drilling in soft soil; influence of mud pressures, Proc., ISTT-No Dig, 1998, Washington D.C., Paper 6B: 1-7. Moore, I.D. (2005). Analysis of ground fracture due to excessive mud pressure. Proc., 2005 North American No-Dig Conf., Orlando, Paper No. C Staheli, K., Bennett, D., Hurley, T., O Donnell, H.W. (1998). Installation of pipelines beneath levees using horizontal directional drilling. Pipeline Research Council International, Inc., Paper CPAR-GL Van Brussel, G.G., Hergarden, H.J.A.M. (1997). Research (CPAR) program: Installation of pipelines beneath levees using horizontal directional drilling. SO /2. Department of Foundations and Underground Engineering, Delft Geotechnics,
186 Wang, X., Sterling, R.L. (2006). Finite element analysis of the instability of borehole wall during horizontal directional drilling, 2006 ISTT No Dig Conf., Brisbane, Australia, 49: White D. J., Take W.A., Bolton, M.D. (2003). Soil deformation measurement using particle image velocimetry (PIV) and photogrammetry. Geotechnique, Vol. 53(7): Yu, H.S., Houlsby, G.T. (1991). Finite cavity expansion in dilatant soils: loading analysis, Geotechnique, Vol. 41(2): Yu, H.S. (2000). Cavity Expansion Methods in Geomechanics. Kluwer Academic Publishers,
187 APPENDIX A UNSUCCESSFUL SMALL SCALE EXPERIMENTS 1.0 UNSUCCESSFUL SMALL SCALE EXPERIMENTS This section of the report lists the experiments that were considered to be unsuccessful and provides a series of descriptions of how the tests failed. Refer to Table 4.1 of Chapter 4 for the applied overburden and peak internal pressures (if applicable). In general, it was found that failure of an experiment occurred in one of or a combination of several manners. An experiment was deemed to be unsuccessful and not included in the results provided in Chapter 4 on the occurrence of one of or a combination of the following: The results of the experiments using the self contained pressure transducers could not be reported because the pressure transducer appeared to malfunction during each test. All data recorded during these tests resulted in an unchanging flat line with a maximum pressure of 4.01kPa, though the transducer possessed a maximum pressure of 100kPa; (Total of 3 times) An unintended breach of the drilling fluid from either the joints in the sidewalls or the annular space between the borehole and inflatable packer. An example of one such failure is shown below in Figure A1; (Total of four times) Movement of the packer out of the borehole as a result of the internal fluid pressure exceeding the frictional resistance of the packer seal; (Total of three times) Repeated mechanical malfunctions (and restarting) the displacement pump following partial injection of fluid into the borehole; (Total of six times) Failure to correctly initialize the data acquisition system resulting in the downhole pressure readings not being recorded during the experiment; (Total of three times) 174 Low Pressure

188 Sidewall of the test cell Premature mud loss Figure A1 Failure of hydrofracture test through unexpected mudloss Severed or damaged lead wires from the pressure transducer resulting in null readings throughout the experiment. The damage occurred between calibration and insertion into the packer; and/or (One occurrence) Failure to convert the actuator following mechanical compaction from stroke to load control and consequently restricting vertical displacement during the drill fluid application. (Two times) All of the items listed above resulted in maximum internal pressures that either did not register a reading or were well above or below the typical conditions for the controlled experiments. As such, the maximum internal mud pressures for those tests were excluded or were not included in further discussions. The results of the three experiments carried out with a cell extension are reported even though mud flow was never established with the ground surface in any of these cases. It was required that mud loss had to occur at the surface of the soil because any loss from the side of the cell would not result in a drop of the mud pressure in the field. It was for this 175
EFFECTIVENESS OF HYDROFRACTURE PREDICTION FOR HDD DESIGN
 North American Society for Trenchless Technology (NASTT) No-Dig Show 2010 Chicago, Illinois May 2-7, 2010 Paper F-1-01 EFFECTIVENESS OF HYDROFRACTURE PREDICTION FOR HDD DESIGN Kimberlie Staheli, Ph.D.,
ELASTIC CALCULATIONS OF LIMITING MUD PRESSURES TO CONTROL HYDRO- FRACTURING DURING HDD
 North American Society for Trenchless Technology (NASTT) NO-DIG 24 New Orleans, Louisiana March 22-24, 24 ELASTIC CALCULATIONS OF LIMITING MUD PRESSURES TO CONTROL HYDRO- FRACTURING DURING HDD Matthew
Stability analysis of a borehole wall during horizontal directional drilling
 Tunnelling and Underground Space Technology 22 (2007) 620 632 Tunnelling and Underground Space Technology incorporating Trenchless Technology Research www.elsevier.com/locate/tust Stability analysis of
LABORATORY MEASUREMENTS OF PULLING FORCE AND GROUND MOVEMENT DURING A PIPE BURSTING TEST
 North American Society for Trenchless Technology (NASTT) NO-DIG 2004 New Orleans, Louisiana March 22-24, 2004 LABORATORY MEASUREMENTS OF PULLING FORCE AND GROUND MOVEMENT DURING A PIPE BURSTING TEST Brian
Cavity Expansion Methods in Geomechanics
 Cavity Expansion Methods in Geomechanics by Hai-Sui Yu School of Civil Engineering, University of Nottingham, U. K. KLUWER ACADEMIC PUBLISHERS DORDRECHT / BOSTON / LONDON TABLE OF CONTENTS Foreword Preface
Experimental Investigation of Soil-Pipe Friction Coefficients for Thermoplastic Pipes Installed in Selected Geological Materials
 North American Society for Trenchless Technology (NASTT) NASTT s 2014 No-Dig Show Orlando, Florida April 13-17, 2014 MM-T6-03 Experimental Investigation of Soil-Pipe Friction Coefficients for Thermoplastic
ENCE 3610 Soil Mechanics. Site Exploration and Characterisation Field Exploration Methods
 ENCE 3610 Soil Mechanics Site Exploration and Characterisation Field Exploration Methods Geotechnical Involvement in Project Phases Planning Design Alternatives Preparation of Detailed Plans Final Design
Module 1 : Site Exploration and Geotechnical Investigation
 Objectives In this section you will learn the following Displacement borings Wash boring Auger boring Rotary drilling Percussion drilling Continuous sampling Boring methods of exploration The boring methods
Instructor : Dr. Jehad Hamad. Chapter (7)
") Instructor : Dr. Jehad Hamad Chapter (7) 2017-2016 Soil Properties Physical Properties Mechanical Properties Gradation and Structure Compressibility Soil-Water Relationships Shear Strength Bearing Capacity
Instructor : Dr. Jehad Hamad Chapter (7) 2017-2016 Soil Properties Physical Properties Mechanical Properties Gradation and Structure Compressibility Soil-Water Relationships Shear Strength Bearing Capacity
Chapter 12 Subsurface Exploration
 Page 12 1 Chapter 12 Subsurface Exploration 1. The process of identifying the layers of deposits that underlie a proposed structure and their physical characteristics is generally referred to as (a) subsurface
Effect of embedment depth and stress anisotropy on expansion and contraction of cylindrical cavities
 Effect of embedment depth and stress anisotropy on expansion and contraction of cylindrical cavities Hany El Naggar, Ph.D., P. Eng. and M. Hesham El Naggar, Ph.D., P. Eng. Department of Civil Engineering
Boreholes. Implementation. Boring. Boreholes may be excavated by one of these methods: 1. Auger Boring 2. Wash Boring 3.
 Implementation Boreholes 1. Auger Boring 2. Wash Boring 3. Rotary Drilling Boring Boreholes may be excavated by one of these methods: 4. Percussion Drilling The right choice of method depends on: Ground
Rotary Drilling Rotary Drilling Bits
 GE 343 SUBSURFACE EXPLORATION CH 8 Rock Drilling, Testing, and Sampling Text Ch. 7. Dr. Norbert H. Maerz Missouri University of Science and Technology (573) 341-6714 norbert@mst.edu Instructional Objectives
SITE INVESTIGATION 1
 SITE INVESTIGATION 1 Definition The process of determining the layers of natural soil deposits that will underlie a proposed structure and their physical properties is generally referred to as site investigation.
OVERVIEW OF ER DRILLING IN EARTH EMBANKMENT DAMS AND
 OVERVIEW OF ER 1110-1-1807 DRILLING IN EARTH EMBANKMENT DAMS AND 255 255 255 237 237 237 0 0 0 217 217 217 LEVEES 163 163 163 200 200 200 131 132 122 239 65 53 80 119 27 110 135 120 Requirements and Processes
IAEA SAFETY STANDARDS Geotechnical Aspects of Site Evaluation and Foundations in NPPs, NS-G-3.6
 IAEA SAFETY STANDARDS Geotechnical Aspects of Site Evaluation and Foundations in NPPs, NS-G-3.6 Regional Workshop on Volcanic, Seismic, and Tsunami Hazard Assessment Related to NPP Siting Activities and
Instructional Objectives
 GE 343 SUBSURFACE EXPLORATION CH 8 Rock Drilling, Testing, and Sampling Text Ch. 7. Dr. Norbert H. Maerz Missouri University of Science and Technology (573) 341-6714 norbert@mst.edu Instructional Objectives
Prof. B V S Viswanadham, Department of Civil Engineering, IIT Bombay
 13 Permeability and Seepage -2 Conditions favourable for the formation quick sand Quick sand is not a type of sand but a flow condition occurring within a cohesion-less soil when its effective stress is
Coating Requirements for Pipelines Installed by Horizontal Directional Drilling John D. Hair, P.E.*
 Coating Requirements for Pipelines Installed by Horizontal Directional Drilling John D. Hair, P.E.* *President, J. D. Hair & Associates, Inc., 2121 South Columbia Avenue, Suite 101, Tulsa, OK 74114-3502;
Pierce County Department of Planning and Land Services Development Engineering Section
 Page 1 of 7 Pierce County Department of Planning and Land Services Development Engineering Section PROJECT NAME: DATE: APPLICATION NO.: PCDE NO.: LANDSLIDE HAZARD AREA (LHA) GEOLOGICAL ASSESSMENT REPORT
Liquefaction Resistance and Internal Erosion Potential of Non-Plastic Silty Sand
 Liquefaction Resistance and Internal Erosion Potential of Non-Plastic Silty Sand Jing-Wen CHEN 1, Wei F. LEE 2, Chun-Chi CHEN 3 1 Professor, Department of Civil Engineering, National Chen-Kung University
Gotechnical Investigations and Sampling
 Gotechnical Investigations and Sampling Amit Prashant Indian Institute of Technology Gandhinagar Short Course on Geotechnical Investigations for Structural Engineering 12 14 October, 2017 1 Purpose of
Horizontal Directional Drilling: An Approach to Design and Construction. Presenter: John Briand, PE Co-Author: Danielle Neamtu, PE
 Horizontal Directional Drilling: An Approach to Design and Construction Presenter: John Briand, PE Co-Author: Danielle Neamtu, PE Presentation Outline General HDD overview Conceptual-level evaluation Detailed
Measurement of effective stress shear strength of rock
 Measurement of effective stress shear strength of rock R. A. Failmezger, P.E., F. ASCE In-Situ Soil Testing, L.C., Lancaster, Virginia USA D. J. White, Ph. D., P.E. Iowa State University, Ames, Iowa USA
PRINCIPLES OF GEOTECHNICAL ENGINEERING
 PRINCIPLES OF GEOTECHNICAL ENGINEERING Fourth Edition BRAJA M. DAS California State University, Sacramento I(T)P Boston Albany Bonn Cincinnati London Madrid Melbourne Mexico City New York Paris San Francisco
Interpretation of Pile Integrity Test (PIT) Results
 Results") Annual Transactions of IESL, pp. 78-84, 26 The Institution of Engineers, Sri Lanka Interpretation of Pile Integrity Test (PIT) Results H. S. Thilakasiri Abstract: A defect present in a pile will severely
Annual Transactions of IESL, pp. 78-84, 26 The Institution of Engineers, Sri Lanka Interpretation of Pile Integrity Test (PIT) Results H. S. Thilakasiri Abstract: A defect present in a pile will severely
14 Geotechnical Hazards
 Volume 2: Assessment of Environmental Effects 296 14 Geotechnical Hazards Overview This Chapter provides an assessment of the underlying geotechnical conditions to identify: any potential liquefaction
10. GEOTECHNICAL EXPLORATION PROGRAM
 Geotechnical site investigations should be conducted in multiple phases to obtain data for use during the planning and design of the tunnel system. Geotechnical investigations typically are performed in
KDOT Geotechnical Manual Edition. Table of Contents
 KDOT Geotechnical Manual 2007 Edition The KDOT Geotechnical Manual is available two volumes. Both volumes are very large electronic (pdf) files which may take several minutes to download. The table of
The CPT in unsaturated soils
 The CPT in unsaturated soils Associate Professor Adrian Russell (UNSW) Mr David Reid (Golder Associates) Prof Nasser Khalili (UNSW) Dr Mohammad Pournaghiazar (UNSW) Dr Hongwei Yang (Uni of Hong Kong) Outline
APPENDIX F CORRELATION EQUATIONS. F 1 In-Situ Tests
 APPENDIX F 1 APPENDIX F CORRELATION EQUATIONS F 1 In-Situ Tests 1. SPT (1) Sand (Hatanaka and Uchida, 1996), = effective vertical stress = effective friction angle = atmosphere pressure (Shmertmann, 1975)
SHEAR STRENGTH OF SOIL
 Soil Failure Criteria SHEAR STRENGTH OF SOIL Knowledge about the shear strength of soil important for the analysis of: Bearing capacity of foundations, Slope stability, Lateral pressure on retaining structures,
Landslide FE Stability Analysis
 Landslide FE Stability Analysis L. Kellezi Dept. of Geotechnical Engineering, GEO-Danish Geotechnical Institute, Denmark S. Allkja Altea & Geostudio 2000, Albania P. B. Hansen Dept. of Geotechnical Engineering,
Mass Wasting. Requirements for Mass Wasting. Slope Stability. Geol 104: mass wasting
 Mass Wasting Movement of earth materials downslope, driven by Gravitational Forces. Landslides - general term for rock or soil movement. In U.S., on average, mass wasting causes 1 to 2 billion dollars
Chapter 7 Permeability and Seepage
 Permeability and Seepage - N. Sivakugan (2005) 1 7.1 INTRODUCTION Chapter 7 Permeability and Seepage Permeability, as the name implies (ability to permeate), is a measure of how easily a fluid can flow
Soils. Technical English - I 10 th week
 Technical English - I 10 th week Soils Soil Mechanics is defined as the branch of engineering science which enables an engineer to know theoretically or experimentally the behavior of soil under the action
City, University of London Institutional Repository
 City Research Online City, University of London Institutional Repository Citation: Li, Y. Q., Hu, Z., Fang, X. & Fonseca, J. (2015). Analysis of micro characteristics and influence factors of foundation
Manual on Subsurface Investigations National Highway Institute Publication No. FHWA NHI Federal Highway Administration Washington, DC
 Manual on Subsurface Investigations National Highway Institute Publication No. FHWA NHI-01-031 Federal Highway Administration Washington, DC Geotechnical Site Characterization July 2001 by Paul W. Mayne,
Cyclic Behavior of Sand and Cyclic Triaxial Tests. Hsin-yu Shan Dept. of Civil Engineering National Chiao Tung University
 Cyclic Behavior of Sand and Cyclic Triaxial Tests Hsin-yu Shan Dept. of Civil Engineering National Chiao Tung University Causes of Pore Pressure Buildup due to Cyclic Stress Application Stress are due
Experimental study of sand deformations during a CPT
 3 rd International Symposium on Cone Penetration Testing, Las Vegas, Nevada, USA - 2014 Experimental study of sand deformations during a CPT A.V. Melnikov & G.G. Boldyrev Penza State University of Architecture
Interpretation of Flow Parameters from In-Situ Tests (P.W. Mayne, November 2001)
") Interpretation of Flow Parameters from In-Situ Tests (P.W. Mayne, November 2001) FLOW PROPERTIES Soils exhibit flow properties that control hydraulic conductivity (k), rates of consolidation, construction
Interpretation of Flow Parameters from In-Situ Tests (P.W. Mayne, November 2001) FLOW PROPERTIES Soils exhibit flow properties that control hydraulic conductivity (k), rates of consolidation, construction
1.8 Unconfined Compression Test
 1-49 1.8 Unconfined Compression Test - It gives a quick and simple measurement of the undrained strength of cohesive, undisturbed soil specimens. 1) Testing method i) Trimming a sample. Length-diameter
INTERNATIONAL JOURNAL OF CIVIL AND STRUCTURAL ENGINEERING Volume 1, No 4, 2011
 Undrained response of mining sand with fines contents Thian S. Y, Lee C.Y Associate Professor, Department of Civil Engineering, Universiti Tenaga Nasional, Malaysia siawyin_thian@yahoo.com ABSTRACT This
Liquefaction and Foundations
 Liquefaction and Foundations Amit Prashant Indian Institute of Technology Gandhinagar Short Course on Seismic Design of Reinforced Concrete Buildings 26 30 November, 2012 What is Liquefaction? Liquefaction
Deep Foundations 2. Load Capacity of a Single Pile
 Deep Foundations 2 Load Capacity of a Single Pile All calculations of pile capacity are approximate because it is almost impossible to account for the variability of soil types and the differences in the
*** ***! " " ) * % )!( & ' % # $. 0 1 %./ +, - 7 : %8% 9 ) 7 / ( * 7 : %8% 9 < ;14. " > /' ;-,=. / ١
 * % )!( & ' % # $. 0 1 %./ +, - 7 : %8% 9 ) 7 / ( * 7 : %8% 9 < ;14. > /' ;-,=. / ١") ١ ******!" #$ % & '!( ) % * ") +,-./ % 01. 3 ( 4 56 7/4 ) 8%9 % : 7 ;14 < 8%9 % : *7./ = ;-, >/'." Soil Permeability & Seepage ٢ Soil Permeability- Definition ٣ What is Permeability? Permeability is the
١ ******!" #$ % & '!( ) % * ") +,-./ % 01. 3 ( 4 56 7/4 ) 8%9 % : 7 ;14 < 8%9 % : *7./ = ;-, >/'." Soil Permeability & Seepage ٢ Soil Permeability- Definition ٣ What is Permeability? Permeability is the
ISC 5 SELF-BORING PRESSUREMETER TESTS AT THE NATIONAL FIELD TESTING FACILITY, BALLINA 5 9 SEPT 2016
 ISC 5 5 9 SEPT 2016 SELF-BORING PRESSUREMETER TESTS AT THE NATIONAL FIELD TESTING FACILITY, BALLINA Fillippo Gaone James Doherty Susan Gourvenec Centre for Offshore Foundation Systems, UWA School of Civil,
STUDY OF THE BEHAVIOR OF PILE GROUPS IN LIQUEFIED SOILS
 STUDY OF THE BEHAVIOR OF PILE GROUPS IN LIQUEFIED SOILS Shin-Tower Wang 1, Luis Vasquez 2, and Lymon C. Reese 3, Honorary Member,, ASCE ABSTRACT : 1&2 President & Project Manager, Ensoft, Inc. Email: ensoft@ensoftinc.com
NEW DOWN-HOLE PENETROMETER (DHP-CIGMAT) FOR CONSTRUCTION APPLICATIONS
 FOR CONSTRUCTION APPLICATIONS") NEW DOWN-HOLE PENETROMETER (DHP-CIGMAT) FOR CONSTRUCTION APPLICATIONS 1 2 C. Vipulanandan 1, Ph.D., M. ASCE and Omer F. Usluogullari 2 Chairman, Professor, Director of Center for Innovative Grouting Materials
NEW DOWN-HOLE PENETROMETER (DHP-CIGMAT) FOR CONSTRUCTION APPLICATIONS 1 2 C. Vipulanandan 1, Ph.D., M. ASCE and Omer F. Usluogullari 2 Chairman, Professor, Director of Center for Innovative Grouting Materials
SCOPE OF INVESTIGATION Simple visual examination of soil at the surface or from shallow test pits. Detailed study of soil and groundwater to a
 Lecture-5 Soil Exploration Dr. Attaullah Shah 1 Today s Lecture Purpose of Soil Exploration Different methods 1. Test trenches and Pits 2. Auger and Wash Boring 3. Rotary Drilling 4. Geophysical Methods
SOME OBSERVATIONS RELATED TO LIQUEFACTION SUSCEPTIBILITY OF SILTY SOILS
 SOME OBSERVATIONS RELATED TO LIQUEFACTION SUSCEPTIBILITY OF SILTY SOILS Upul ATUKORALA 1, Dharma WIJEWICKREME 2 And Norman MCCAMMON 3 SUMMARY The liquefaction susceptibility of silty soils has not received
Module 9 : Foundation on rocks. Content
 FOUNDATION ON ROCKS Content 9.1 INTRODUCTION 9.2 FOUNDATION TYPES ON ROCKS 9.3 BEARING CAPCITY- SHALLOW FOUNDATION 9.3.1 Ultimate bearing capacity 9.3.2 Safe bearing pressure 9.3.3 Estimation of bearing
Introduction to Soil Mechanics
 Introduction to Soil Mechanics Sela Sode and Colin Jones WILEY Blackwell Contents Preface Dedication and Acknowledgments List of Symbols Soil Structure 1.1 Volume relationships 1.1.1 Voids ratio (e) 1.1.2
8.1. What is meant by the shear strength of soils? Solution 8.1 Shear strength of a soil is its internal resistance to shearing stresses.
 8.1. What is meant by the shear strength of soils? Solution 8.1 Shear strength of a soil is its internal resistance to shearing stresses. 8.2. Some soils show a peak shear strength. Why and what type(s)
Laboratory Testing Total & Effective Stress Analysis
 SKAA 1713 SOIL MECHANICS Laboratory Testing Total & Effective Stress Analysis Prepared by: Dr. Hetty Mohr Coulomb failure criterion with Mohr circle of stress 2 ' 2 ' ' ' 3 ' 1 ' 3 ' 1 Cot Sin c ' ' 2
Numerical analysis of effect of mitigation measures on seismic performance of a liquefiable tailings dam foundation
 Numerical analysis of effect of mitigation measures on seismic performance of a liquefiable tailings dam foundation Yong-Beom Lee, Jorge Castillo Ausenco, USA Aurelian C. Trandafir Fugro GeoConsulting
Conventional Field Testing & Issues (SPT, CPT, DCPT, Geophysical methods)
") Conventional Field Testing & Issues (SPT, CPT, DCPT, Geophysical methods) Ajanta Sachan Assistant Professor Civil Engineering IIT Gandhinagar Conventional Field Testing 1 Field Test: In-situ shear strength
Conventional Field Testing & Issues (SPT, CPT, DCPT, Geophysical methods) Ajanta Sachan Assistant Professor Civil Engineering IIT Gandhinagar Conventional Field Testing 1 Field Test: In-situ shear strength
Axially Loaded Piles
 Axially Loaded Piles 1 t- Curve Method using Finite Element Analysis The stress-strain relationship for an axially loaded pile can be described through three loading mechanisms: axial deformation in the
AXIAL FORCE IN PULLED-INTO-PLACE HDPE PIPES DURING AND AFTER INSTALLATION
 AXIAL FORCE IN PULLED-INTO-PLACE HDPE PIPES DURING AND AFTER INSTALLATION Abdul Ghafar Chehab 1 Ian D. Moore 2 Resumo Palavras-chaves: Abstract Work has been conducted to measure and calculate the axial
June 9, R. D. Cook, P.Eng. Soils Engineer Special Services Western Region PUBLIC WORKS CANADA WESTERN REGION REPORT ON
 PUBLIC WORKS CANADA WESTERN REGION REPORT ON GEOTECHNICAL INVESTIGATION PROPOSED MARTIN RIVER BRIDGE MILE 306.7 MACKENZIE HIGHWAY Submitted by : R. D. Cook, P.Eng. Soils Engineer Special Services Western
Cone Penetration Testing in Geotechnical Practice
 Cone Penetration Testing in Geotechnical Practice Table Of Contents: LIST OF CONTENTS v (4) PREFACE ix (2) ACKNOWLEDGEMENTS xi (1) SYMBOL LIST xii (4) CONVERSION FACTORS xvi (6) GLOSSARY xxii 1. INTRODUCTION
GROUND DISPLACEMENTS AND PIPE RESPONSE DURING PULLED-IN-PLACE PIPE INSTALLATION
 GROUND DISPLACEMENTS AND PIPE RESPONSE DURING PULLED-IN-PLACE PIPE INSTALLATION by Johnathan Andrew Cholewa A thesis submitted to the Department of Civil Engineering In conformity with the requirements
J. Paul Guyer, P.E., R.A.
 J. Paul Guyer, P.E., R.A. Paul Guyer is a registered mechanical engineer, civil engineer, fire protection engineer and architect with over 35 years experience in the design of buildings and related infrastructure.
Table of Contents Chapter 1 Introduction to Geotechnical Engineering 1.1 Geotechnical Engineering 1.2 The Unique Nature of Soil and Rock Materials
 Table of Contents Chapter 1 Introduction to Geotechnical Engineering 1.1 Geotechnical Engineering 1.2 The Unique Nature of Soil and Rock Materials 1.3 Scope of This Book 1.4 Historical Development of Geotechnical
February 22, 2016 AG File No
 Ainley Graham & Associates Limited 1-50 Grant Timmins Drive, Kingston, Ontario, K7M 8N2 Tel: (343) 266-0002 Fax: (343) 266-0028 E-mail Kingston@ainleygroup.com February 22, 2016 AG File No. 15062-1 Ministry
ON THE FACE STABILITY OF TUNNELS IN WEAK ROCKS
 33 rd 33 Annual rd Annual General General Conference conference of the Canadian of the Canadian Society for Society Civil Engineering for Civil Engineering 33 e Congrès général annuel de la Société canadienne
Discussion: behaviour of jacked and driven piles in sandy soil
 Title Discussion: behaviour of jacked and driven piles in sandy soil Author(s) Yang, J; Tham, LG; Lee, PKK; Chan, ST; Yu, F Citation Géotechnique, 27, v. 7 n., p. 47-478 Issued Date 27 URL http://hdl.handle.net/1722/7161
A study on the bearing capacity of steel pipe piles with tapered tips
 Japanese Geotechnical Society Special Publication The 6th Japan-China Geotechnical Symposium A study on the bearing capacity of steel pipe piles with tapered tips Hironobu Matsumiya i), Yoshiro Ishihama
Predicting Settlement and Stability of Wet Coal Ash Impoundments using Dilatometer Tests
 Predicting Settlement and Stability of Wet Coal Ash Impoundments using Dilatometer Tests Chris Hardin, P.E. CH2M Hill, Charlotte, North Carolina, E-mail: Chris.Hardin@ch2m.com Roger Failmezger, P.E., F.
Geotechnical Geotechnical Assessment
 Site Investigation Site Investigation Pile Probing Pile Probing Geotechnical Logging Geotechnical and Sampling Logging and Sampling Streetworks and Utilities Streetworks Avoidance and Utilities Avoidance
CONTENTS. 1. GeneralsG Field Investigation WorkG Laboratory Testing Work Surface Soil Description-- 7.
 CONTENTS Page 1. GeneralsG 4 2. Field Investigation WorkG 4 3. Laboratory Testing Work--- 5 4. Surface Soil Description-- 7 Appendix A Borehole Location Plan 11 Soil Profile-- 15 Bore Logs--=---- 18 Appendix
AN ABSTRACT OF THE THESIS OF
 AN ABSTRACT OF THE THESIS OF Nasim Adami for the degree of Master of Science in Civil Engineering presented on October 28, 213. Title: Development of an ACIP Pile-Specific Load-Displacement Model. Abstract
EFFECT OF STORAGE CAPACITY ON VERTICAL DRAIN PERFORMANCE IN LIQUEFIABLE SAND DEPOSITS
 EFFECT OF STORAGE CAPACITY ON VERTICAL DRAIN PERFORMANCE IN LIQUEFIABLE SAND DEPOSITS Juan M. Pestana 1, M. ASCE Christopher E. Hunt 2, Student M. ASCE R. Robert Goughnour 3, M. ASCE Ann M. Kammerer 2,
Theory of Shear Strength
 MAJ 1013 ADVANCED SOIL MECHANICS Theory of Shear Strength Prepared by, Dr. Hetty 1 Strength of different materials Steel Concrete Soil Tensile strength Compressive strength Shear strength Complex behavior
Early Exploration Plan Activity Information
 Early Exploration Plan Activity Information Activities That Require an Early Exploration Plan: Line cutting that is a width of 1.5 metres or less; Geophysical surveys on the ground requiring the use of
ATTACHMENT A PRELIMINARY GEOTECHNICAL SUMMARY
 ATTACHMENT A PRELIMINARY GEOTECHNICAL SUMMARY Kevin M. Martin, P.E. KMM Geotechnical Consultants, LLC 7 Marshall Road Hampstead, NH 0384 603-489-6 (p)/ 603-489-8 (f)/78-78-4084(m) kevinmartinpe@aol.com
Site Investigations and Geotechnical Risk For Underground Construction Greg Raines, PE
 August 14, 2017 Site Investigations and Geotechnical Risk For Underground Construction Greg Raines, PE Gregory.Raines@Stantec.com Develop Preliminary Geologic / Geotech Conceptual Model for the Project
PERFORMANCE OF BITUMINOUS COATS IN REDUCING NEGATIVE SKIN
 PERFORMANCE OF BITUMINOUS COATS IN REDUCING NEGATIVE SKIN FRICTION Makarand G. Khare, PhD Research Scholar, Indian Institute of Technology Madras, Chennai, India Shailesh R. Gandhi, Professor, Indian Institute
Geotechnical Engineering Study, Conifer Senior High School Football Field Improvements, Conifer, Colorado
 2390 South Lipan Street Denver, CO 80223 phone: (303) 742-9700 fax: (303) 742-9666 email: kadenver@kumarusa.com www.kumarusa.com Office Locations: Denver (HQ), Colorado Springs, Fort Collins, and Frisco,
Monitoring of underground construction
 Monitoring of underground construction Geotechnical Aspects of Underground Construction in Soft Ground Yoo, Park, Kim & Ban (Eds) 2014 Korean Geotechnical Society, Seoul, Korea, ISBN 978-1-138-02700-8
The theories to estimate lateral earth pressure due to a strip surcharge loading will
 Chapter LITERATURE REVIEW The theories to estimate lateral earth pressure due to a strip surcharge loading will be introduced in this chapter. Commonly geotechnical engineers apply the equations suggested
Mass Wasting. Revisit: Erosion, Transportation, and Deposition
 Mass Wasting Revisit: Erosion, Transportation, and Deposition While landslides are a normal part of erosion and surface processes, they can be very destructive to life and property! - Mass wasting: downslope
Underground Risk Management Course Marina Del Rey, California November, Geotechnical Data Reports. Greg Raines, PE
 Underground Risk Management Course Marina Del Rey, California November, 2018 Geotechnical Data Reports Greg Raines, PE Gregory.Raines@Stantec.com Introduction What is a Geotechnical Data Report? The GDR
GUIDELINE FOR HAND HELD SHEAR VANE TEST
 GUIDELINE FOR HAND HELD SHEAR VANE TEST NZ GEOTECHNICAL SOCIETY INC August 2001 CONTENTS Page 1.0 Introduction 2 2.0 Background 2 3.0 Recommended Practice 3 4.0 Undrained Shear Strength 3 5.0 Particular
Early Exploration Permit Activity Information
 Early Exploration Permit Activity Information Activities That Require an Early Exploration Permit: Line cutting that is a width greater than 1.5 metres Mechanized stripping of a total surface area of greater
Prof. B V S Viswanadham, Department of Civil Engineering, IIT Bombay
 56 Module 4: Lecture 7 on Stress-strain relationship and Shear strength of soils Contents Stress state, Mohr s circle analysis and Pole, Principal stressspace, Stress pathsin p-q space; Mohr-Coulomb failure
The process of determining the layers of natural soil deposits that will underlie a proposed structure and their physical properties is generally
 The process of determining the layers of natural soil deposits that will underlie a proposed structure and their physical properties is generally referred to as sub surface investigation 2 1 For proper
Mechanistic Investigation of Granular Base and Subbase Materials A Saskatchewan Case Study
 Mechanistic Investigation of Granular Base and Subbase Materials A Saskatchewan Case Study Curtis Berthelot, P. Eng. Department of Civil and Geological Engineering University of Saskatchewan 57 Campus
ENGINEERING GEOLOGY AND ROCK ENGINEERING ASPECTS OF OPERATION AND CLOSURE OF KBS-3
 ENGINEERING GEOLOGY AND ROCK ENGINEERING ASPECTS OF OPERATION AND CLOSURE OF KBS-3 DAVID SAIANG Principal Consultant SRK Consulting Sweden NEIL MARSHALL Corporate Consultant SRK Consulting UK 1 of XX SRK
MICRO TO MACRO ARE UK LINEAR INFRASTRUCTURE GI S SUITABLE FOR INVESTIGATING MASS SOIL PROPERTY CHARACTERISTICS?
 MICRO TO MACRO ARE UK LINEAR INFRASTRUCTURE GI S SUITABLE FOR INVESTIGATING MASS SOIL PROPERTY CHARACTERISTICS? Ben Gilson - Arup 1 OUTLINE 1. Context why linear infrastructure? 2. Geotechnical challenges
ROCK EXCAVATION (GRADING) OPSS 206 INDEX
 OPSS 206 INDEX") 206-2 - OPSS 206 INDEX 206-2.1 GENERAL 206-2.1.1 Classification of Rock Materials 206-2.1.2 Tender Items 206-2.1.3 Other Excavation Tender Items 206-2.1.4 Specifications 206-2.1.5 Special Provisions 206-2.1.6
206-2 - OPSS 206 INDEX 206-2.1 GENERAL 206-2.1.1 Classification of Rock Materials 206-2.1.2 Tender Items 206-2.1.3 Other Excavation Tender Items 206-2.1.4 Specifications 206-2.1.5 Special Provisions 206-2.1.6
GEOTECHNICAL INVESTIGATION REPORT
 GEOTECHNICAL INVESTIGATION REPORT SOIL INVESTIGATION REPORT FOR STATIC TEST FACILITY FOR PROPELLANTS AT BDL, IBRAHIMPATNAM. Graphics Designers, M/s Architecture & Engineering 859, Banjara Avenue, Consultancy
Theory of Shear Strength
 SKAA 1713 SOIL MECHANICS Theory of Shear Strength Prepared by, Dr. Hetty 1 SOIL STRENGTH DEFINITION Shear strength of a soil is the maximum internal resistance to applied shearing forces The maximum or
APPENDIX A. Borehole Logs Explanation of Terms and Symbols
 APPENDIX A Borehole Logs Explanation of Terms and Symbols Page 153 of 168 EXPLANATION OF TERMS AND SYMBOLS The terms and symbols used on the borehole logs to summarize the results of field investigation
Soil type identification and fines content estimation using the Screw Driving Sounding (SDS) data
 data") Mirjafari, S.Y. & Orense, R.P. & Suemasa, N. () Proc. th NZGS Geotechnical Symposium. Eds. GJ Alexander & CY Chin, Napier Soil type identification and fines content estimation using the Screw Driving Sounding
Mirjafari, S.Y. & Orense, R.P. & Suemasa, N. () Proc. th NZGS Geotechnical Symposium. Eds. GJ Alexander & CY Chin, Napier Soil type identification and fines content estimation using the Screw Driving Sounding
GEOTECHNICAL ENGINEERING II. Subject Code : 06CV64 Internal Assessment Marks : 25 PART A UNIT 1
 GEOTECHNICAL ENGINEERING II Subject Code : 06CV64 Internal Assessment Marks : 25 PART A UNIT 1 1. SUBSURFACE EXPLORATION 1.1 Importance, Exploration Program 1.2 Methods of exploration, Boring, Sounding
 UNIT I SITE INVESTIGATION AND SELECTION OF FOUNDATION Types of boring 1.Displacement borings It is combined method of sampling & boring operation. Closed bottom sampler, slit cup, or piston type is forced
Design of RC Retaining Walls
 Lecture - 09 Design of RC Retaining Walls By: Prof Dr. Qaisar Ali Civil Engineering Department UET Peshawar www.drqaisarali.com 1 Topics Retaining Walls Terms Related to Retaining Walls Types of Retaining
FROST HEAVE. GROUND FREEZING and FROST HEAVE
 FROST HEAVE The temperature of soils near the ground surface reflects the recent air temperatures. Thus, when the air temperature falls below 0 C (32 F) for extended periods, the soil temperature drops
SLOPE STABILITY EVALUATION AND ACCEPTANCE STANDARDS
 INFORMATION BULLETIN / PUBLIC - BUILDING CODE REFERENCE NO.: LAMC 98.0508 Effective: 1-26-84 DOCUMENT NO. P/BC 2002-049 Revised: 11-1-02 Previously Issued As: RGA #1-84 SLOPE STABILITY EVALUATION AND ACCEPTANCE