Powder River Basin Coal Update
|
|
|
- Austen Blankenship
- 6 years ago
- Views:
Transcription

1 Powder River Basin Coal Update Tom Kraemer Group Vice President Coal Southwest Power Pool Regional State Committee October 24, Santa Fe, NM
2 Discussion Topics BNSF coal transportation Historic PRB production Joint line overview Coal dust contamination Joint Line recovery plan Coal dust suppression study Impact on 2005 shipments
3 BNSF Network Coal Map Vancouver Seattle Tacoma Spokane Havre Winnipeg Portland Helena Glendive Billings Gillette Fargo Duluth/ Superior Minneapolis/St. Paul Bieber Keddie San Francisco Denver Sioux City Lincoln Omaha Galesburg Chicago Kansas City Springfield East St. Louis Paducah Los Angeles San Diego San Bernardino Phoenix Albuquerque Oklahoma City Tulsa Dallas/ Ft. Worth Memphis Birmingham El Paso BNSF Route Coal Routes Coal Reserves Eagle Pass Houston Galveston Iowa Mobile Junction Avondale (New Orleans) Brownsville
4 Wyoming and Montana PRB Coal Production PRB production up 220mm tons since Million Tons 500 Wyoming PRB Montana PRB

5 Joint Line Overview The Joint Line is a 103 mile long subdivision with more than 295 miles of track due to double and triple track segments There are 10 coal mines on the Line which are jointly served by both BNSF and UP These 10 mines produced over 300 million tons of coal in 2004
6 Infrastructure Quality The Joint Line is maintained at a high quality, robust level In 2004 and during the first quarter 2005, overall slow orders on the Joint Line were at 3-year lows Track surface conditions, as measured by BNSF s track geometry cars, improved on the Joint Line in 2004 vs Overall switch reliability on the Joint Line improved by over 40% in 2004 due to a formal preventive maintenance program and extensive switch renewals During First Quarter2005, both BNSF and Union Pacific achieved record loadings on the Joint Line
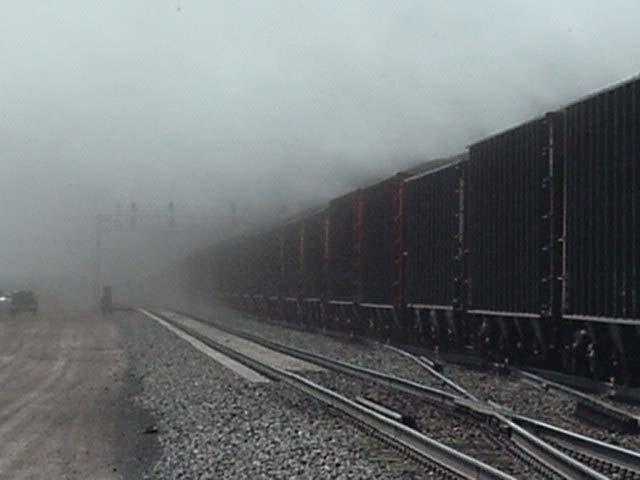
7 Joint Line Timeline April 21: May 11: April/May: May 14: May 15: May/June: June 29: July 6: Significant spring snow shutdown the mines Two inches of rain followed by six inches of snow Spring thaw BNSF train derailment UP train derailment Containment plan (slow orders/roadbed surfacing) Completion of 3 rd main between Shawnee and Walker Joint Line repair program initiated
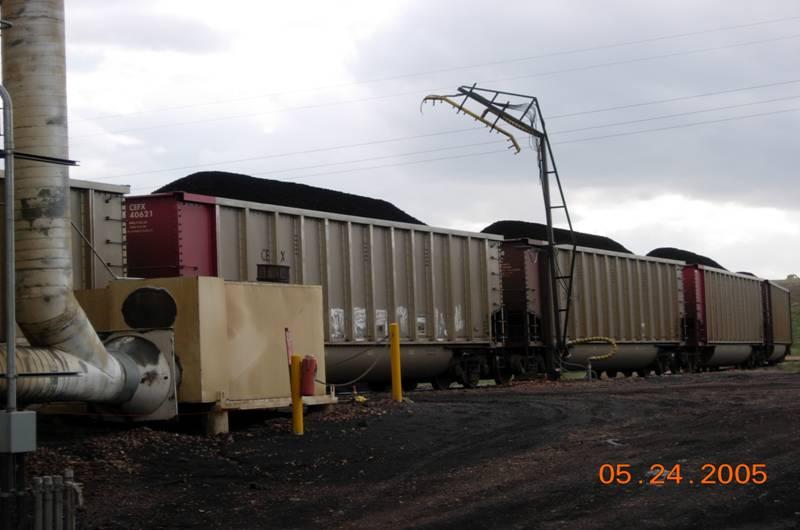
8 Coal Dust Accumulation MP 90.5 Accumulation of Coal

9 Coal Dust Accumulation MP 75.5 Accumulation of Coal Coal dust

10 Coal Dust Accumulation MP Accumulation Of Coal

11 Coal Dust Accumulation MP 62.3 Accumulation Of Coal
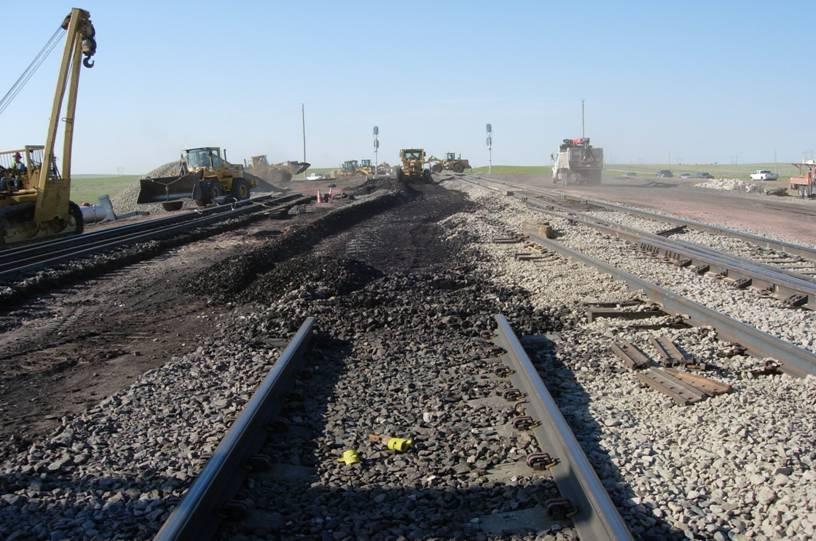
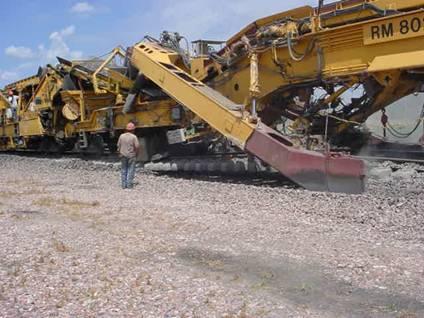
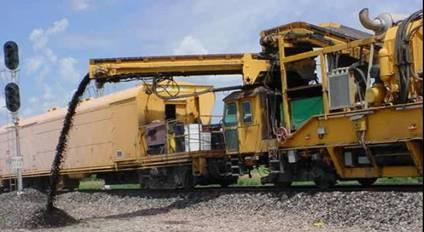
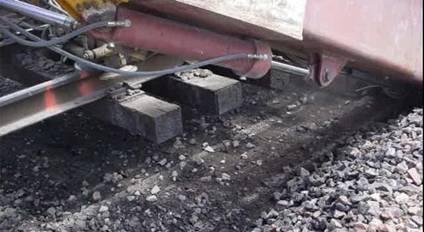
12 Coal Dust Accumulation
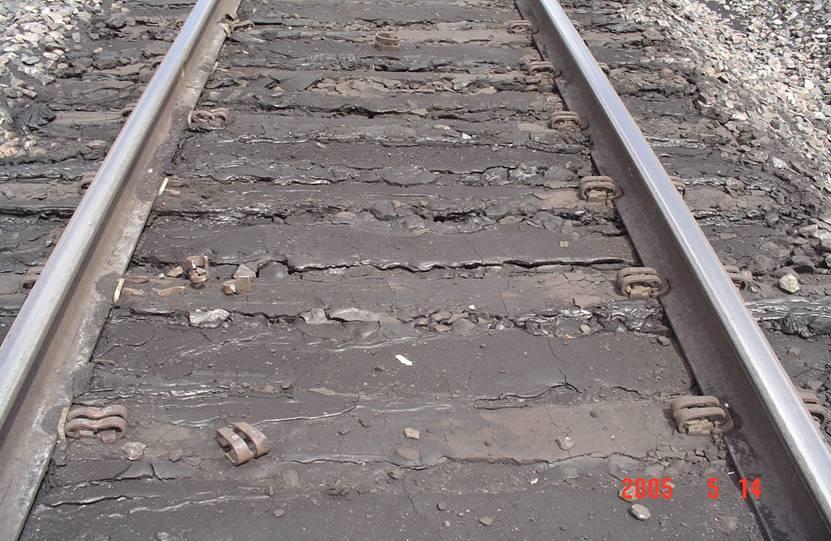
13 Coal Dust Accumulation
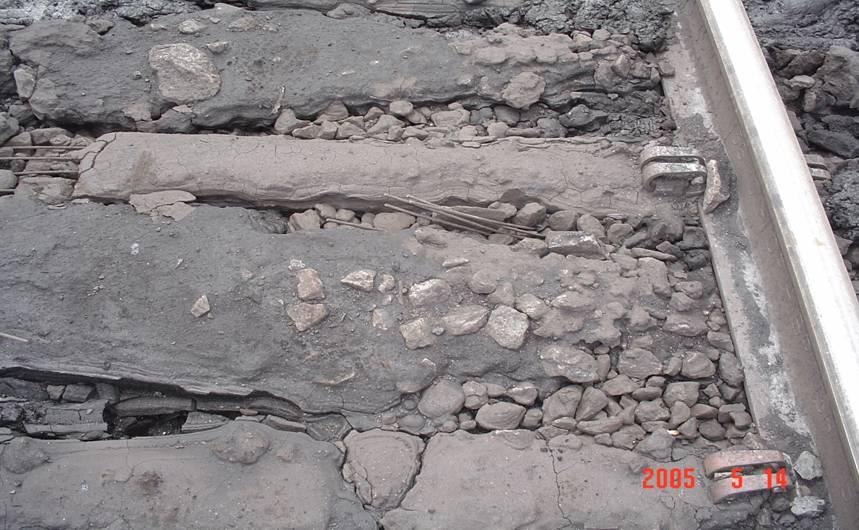
14 Coal Dust Accumulation
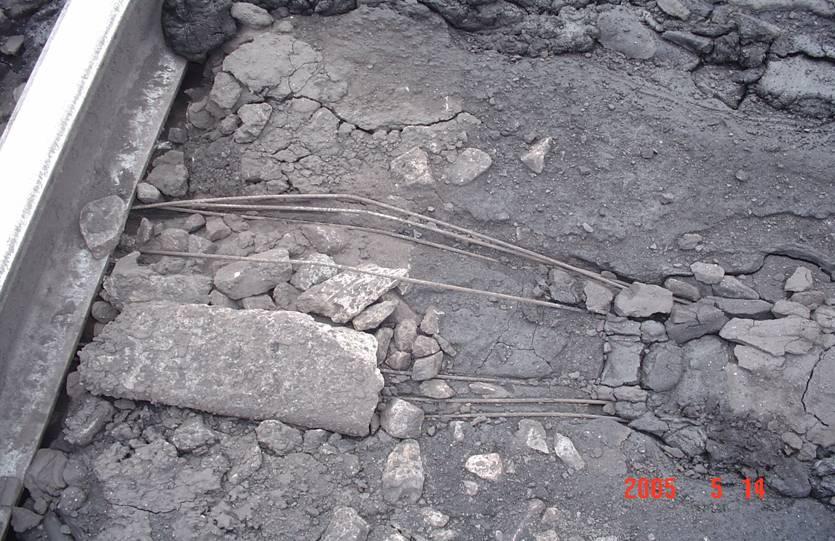
15 Coal Dust Accumulation
16 Coal Dust Accumulation
17 Coal Dust Accumulation


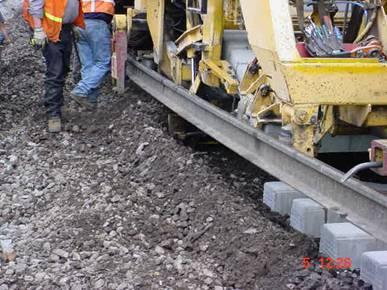
18 Phase 1: Remove/Re-ballast/Replace 12 Switches July 6, 2005 July 8, 2005 July 23, switches 12 hour window 4 switches 12 hour window 4 switches 12 hour window
19 Phase II: Concrete Tie Installation at Reno Junction July 11 August 23 30,835 concrete ties installed 12 track miles of new rail installed 16 switches rehabilitated Work days: Monday Thursday, 10 hour windows Loaded an average of 60.4 trains/day

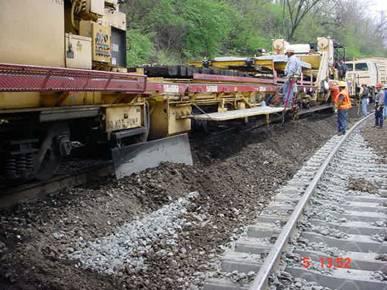
20 P- 811 Concrete Tie Installation

21 Phase III: Undercutting Program August 25 December 1 Joint Line triple track segments 94 track miles of undercutting 36 switches rehabilitated Roadbed Undercut This Section Ballast 8-12 Inches Below Bottom of Tie Work days: Day shift: Monday Wednesday, 12 hour shifts Night shift: Monday Wednesday, 12 hour shifts Sub-Ballast 12 Inches Compacted Subgrade Earth
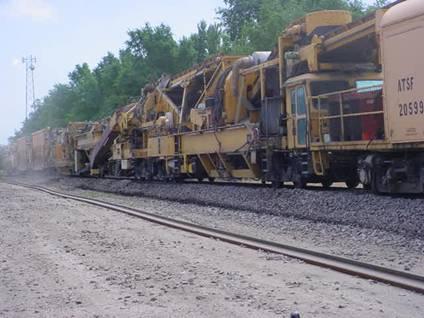
22 RM-802 Undercutter
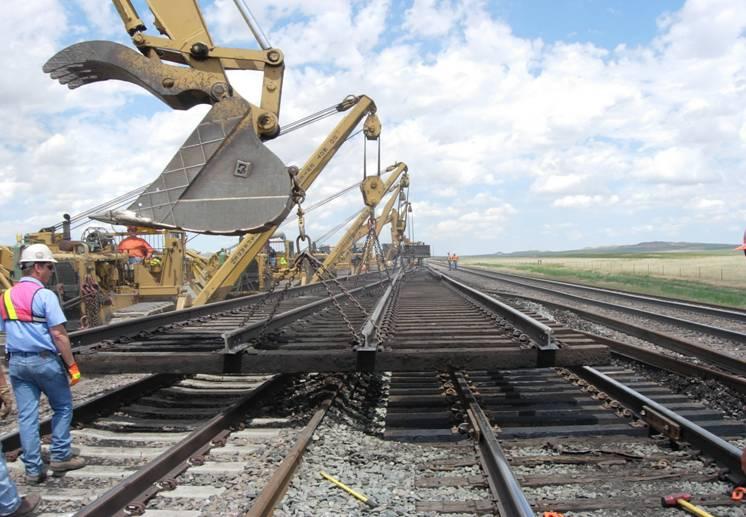
23 Switch Replacement
24 Coal Dust Suppression Study Study focus: Quantify the problem Sampling coal dust accumulation in ballast at switches Measuring coal dust accumulation over time at select locations Analyze industry best practices Analyze and field test coal dust suppression alternatives
25 Ballast Sampling Study results indicate that coal dust accumulations in the ballast at select switches range from 0.5% to 30%. The lower percentage coal values came from previously cleaned switches These study results also demonstrated that the ballast/coal mixture has the capacity to retain water, lose compressive strength, and ultimately cause track surface irregularities

26 Coal Dust Sampling Results Accumulation rates range from 6 pounds/year at MP 93 to over 700 pounds/year at MP 75.2 Average is 81 pounds/year Estimated volume of coal deposited on the Joint Line is more than 84,000 cubic yards over 103 route miles
27 Benchmarking Results

28 Benchmarking Results Stuffer Car
29 Load Profile Study "Stuffer" Car o Stuffer Car Height above sill (ft) o 43 o Coal Car Sill Height Grooming Profile Load Profile Horizontal Distance (ft)

30 Releases From Coal Cars Field test to quantify coal dust release from bottom of coal cars
31 Field Test Plan Perform laser analysis of coal load profile of PRB loads Recommend optimum load profile/ grooming process Test Samples of PRB Coal to determine the optimum binder Field test combinations of binders and grooming to confirm coal dust suppression effectiveness Field test to quantify coal dust releases from bottom of coal cars
32 Field Test Configuration Cars Current profile Cars Groomed profile Cars Current profile Cars Groomed profile Cars Groomed profile Cars 1-20 Current profile No Binder Binder B Binder A Chemical Treatment Each car in the diagram above represents 20 cars Each set of 20 cars represents a separate experiment


33 Field Test Devices Passive Collectors Portable Weather Station Attach passive collectors to back of coal cars to capture loss Attach portable weather data collection system to back of train to measure Trip Stress
34 Total Rail Haul PRB September YTD 2005 Million Tons Performance Tons Percent January % February % March % April % May % June % July % August % September % Total %
35 Total Rail Haul PRB PRB production will be up 34 mm tons in two years. Million Tons F Change Change Tons Percent 2005* Tons Percent Montana % % Wyoming North Gillette % % Joint Line % % Total % %
36 Joint Line Capacity Expansion Phase II: 3 rd Main 15 Miles In Service July 06 Caballo Mine (North End of Joint Line) Reno Junction West Nacco Junction Converse Junction Bill Phase I: 3 rd Main 14 Miles In Service June 05 Walker Shawnee Junction (South End of Joint Line)

37
Kathryn Robinson. Grades 3-5. From the Just Turn & Share Centers Series VOLUME 12
 1 2 From the Just Turn & Share Centers Series VOLUME 12 Temperature TM From the Just Turn & Share Centers Series Kathryn Robinson 3 4 M Enterprises WriteMath Enterprises 2303 Marseille Ct. Suite 104 Valrico,
Hotel Industry Overview. UPDATE: Trends and outlook for Northern California. Vail R. Brown
 Hotel Industry Overview UPDATE: Trends and outlook for Northern California Vail R. Brown Senior Vice President, Global Business Development & Marketing vbrown@str.com @vail_str 2016 STR, Inc. All Rights
Chapter 4: Displaying and Summarizing Quantitative Data
 Chapter 4: Displaying and Summarizing Quantitative Data This chapter discusses methods of displaying quantitative data. The objective is describe the distribution of the data. The figure below shows three
Impacts of Transit Rail Lines on Property Values
 Impacts of Transit Rail Lines on Property Values Rail~Volution 2007 Introduction The Question Research Tools Methodology Examples Results Question Won t transit in my backyard hurt my property value?
April 19, California Energy Commission (CEC)
") April 19, 2012 California Energy Commission (CEC) Re: March 12, 2012 45-day Language Hearing for Nonresidential Buildings - 2013 Building Energy Efficiency Standards (AHRI Comments on 140.4(e)4; Docket
April 19, 2012 California Energy Commission (CEC) Re: March 12, 2012 45-day Language Hearing for Nonresidential Buildings - 2013 Building Energy Efficiency Standards (AHRI Comments on 140.4(e)4; Docket
Upper Missouri River Basin February 2018 Calendar Year Runoff Forecast February 6, 2018
 Upper Missouri River Basin February 2018 Calendar Year Runoff Forecast February 6, 2018 Calendar Year Runoff Forecast Explanation and Purpose of Forecast U.S. Army Corps of Engineers, Northwestern Division
November 2018 Weather Summary West Central Research and Outreach Center Morris, MN
 November 2018 Weather Summary Lower than normal temperatures occurred for the second month. The mean temperature for November was 22.7 F, which is 7.2 F below the average of 29.9 F (1886-2017). This November
Missouri River Basin Water Management
 Missouri River Basin Water Management US Army Corps of Engineers Missouri River Navigator s Meeting February 12, 2014 Bill Doan, P.E. Missouri River Basin Water Management US Army Corps of Engineers BUILDING
September 2018 Weather Summary West Central Research and Outreach Center Morris, MN
 September 2018 Weather Summary The mean temperature for September was 60.6 F, which is 1.5 F above the average of 59.1 F (1886-2017). The high temperature for the month was 94 F on September 16 th. The
Research Update: Race and Male Joblessness in Milwaukee: 2008
 Research Update: Race and Male Joblessness in Milwaukee: 2008 by: Marc V. Levine University of Wisconsin Milwaukee Center for Economic Development Briefing Paper September 2009 Overview Over the past decade,
Track Substructure Characterization Using 500 MHz and 2 GHz Ground Penetrating Radar: Results from over 250 Miles of Track in Wyoming and Alaska
 Track Substructure Characterization Using 500 MHz and 2 GHz Ground Penetrating Radar: Results from over 250 Miles of Track in Wyoming and Alaska Roger Roberts 1, Imad Al-Qadi 2, and Erol Tutumluer 3 1
Upper Missouri River Basin December 2017 Calendar Year Runoff Forecast December 5, 2017
 Upper Missouri River Basin December 2017 Calendar Year Runoff Forecast December 5, 2017 Calendar Year Runoff Forecast Explanation and Purpose of Forecast U.S. Army Corps of Engineers, Northwestern Division
URD Cable Fault Prediction Model
 1 URD Cable Fault Prediction Model Christopher Gubala ComEd General Engineer Reliability Analysis 2014 IEEE PES General Meeting Utility Current Practices & Challenges of Predictive Distribution Reliability
One of the coldest places in the country - Peter Sinks yet again sets this year s coldest temperature record for the contiguous United States.
 One of the coldest places in the country - Peter Sinks yet again sets this year s coldest temperature record for the contiguous United States. In the early morning of February 22, 2010 the temperature
Sediment Deposition LET THE RIVER RUN T E A C H E R. Activity Overview. Activity at a Glance. Time Required. Level of Complexity.
 Activity at a Glance Grade: 6 9 Subject: Science Category: Physical Science, Earth Science Topic: Deposition, River Systems Time Required Two 45-minute periods Level of Complexity Medium Materials* TI-73
RNR 516A. Computer Cartography. Spring GIS Portfolio
 RNR 516A Computer Cartography Spring 2016 GIS Portfolio 1 Contents 1 Political and Locator Maps 3 2 Base Maps and Digitizing 4 3 Data Entry Report 5 4 Projections and Symbolization 6 5 Choropleth Mapping
JUPITER MILLER BUSINESS CENTER 746,400 SF FOR LEASE
 746,400 SF FOR LEASE Three LEED Certified Cross-Dock Buildings 54,600 Square Feet to 746,400 Square Feet Available Dallas City of Tax Incentives Available 36 Clear Height (Over 25% More Pallet Positions
AASHTO Committee on Maintenance 2018 Annual Meeting July 25, Hurricane Irma- Preparation and Response
 AASHTO Committee on Maintenance 2018 Annual Meeting July 25, 2018 Hurricane Irma- Preparation and Response Rudy Powell Director, Office of Maintenance Satellite Aerial Image (September 10, 2017) Hurricane
NAWIC. National Association of Women in Construction. Membership Report. August 2009
 NAWIC National Association of Women in Construction Membership Report August 2009 Core Purpose: To enhance the success of women in the construction industry Region 1 67 Gr Washington, DC 9 16 2 3 1 0 0
Cost-Benefit Analysis of the Pooled- Fund Maintenance Decision Support System: Case Study
 Cost-Benefit Analysis of the Pooled- Fund Maintenance Decision Support System: Case Study Zhirui Ye (WTI) Xianming Shi (WTI) Christopher K. Strong (City of Oshkosh) 12 th AASHTO-TRB TRB Maintenance Management
Lab Activity: Weather Variables
 Name: Date: Period: Weather The Physical Setting: Earth Science Lab Activity: Weather Variables INTRODUCTION: A meteorologist is an individual with specialized education who uses scientific principles
Integrated Science I: Locating earthquake epicenters. Name Per Date
 Integrated Science I: Locating earthquake epicenters. Name Per Date Whenever a significant earthquake occurs somewhere in the world, news media present reports about two issues; the size or magnitude of
15.0 Operations and Maintenance Cost Calculations
 15.0 Operations and Maintenance Cost Calculations 15.1 Introduction Operations and Maintenance (O&M) costs were calculated for each of the four alternatives being considered in the analysis. No Build Alternative
HI SUMMER WORK
 HI-201 2018-2019 SUMMER WORK This packet belongs to: Dear Dual Enrollment Student, May 7 th, 2018 Dual Enrollment United States History is a challenging adventure. Though the year holds countless hours
Managing an Extreme Weather Event of Prolonged Duration May 22, 2013
 Managing an Extreme Weather Event of Prolonged Duration May 22, 2013 MISSOURI RIVER FLOOD OF 2011 M I C H A E L J. K E N N E R L Y P. E. D I R E C T O R O F T H E O F F I C E O F D E S I G N I O W A D
Fast and Furious Rebuilding and Widening the I-90 West Corridor
 Fast and Furious Rebuilding and Widening the I-90 West Corridor Peter Foernssler, P.E., S.E. Deputy Chief, Illinois Tollway Marty Ross, P.E. Design Corridor Manager, TranSystems Jason Wenberg, P.E. Construction
Radar Analysis of Second Wave of UFO Sightings Near Stephenville, Texas. October 21 and 23, 2008
 Radar Analysis of Second Wave of UFO Sightings Near Stephenville, Texas Background October 21 and 23, 2008 A wave of UFO sightings occurred in the Stephenville-Dublin, Texas area on January 8, 2008 [1-3].
Non-Parametric Two-Sample Analysis: The Mann-Whitney U Test
 Non-Parametric Two-Sample Analysis: The Mann-Whitney U Test When samples do not meet the assumption of normality parametric tests should not be used. To overcome this problem, non-parametric tests can
NIDIS Intermountain West Drought Early Warning System January 16, 2018
 NIDIS Drought and Water Assessment NIDIS Intermountain West Drought Early Warning System January 16, 2018 Precipitation The images above use daily precipitation statistics from NWS COOP, CoCoRaHS, and
Renewables and the Smart Grid. Trip Doggett President & CEO Electric Reliability Council of Texas
 Renewables and the Smart Grid Trip Doggett President & CEO Electric Reliability Council of Texas North American Interconnected Grids The ERCOT Region is one of 3 North American grid interconnections. The
not for commercial-scale installations. Thus, there is a need to study the effects of snow on
 1. Problem Statement There is a great deal of uncertainty regarding the effects of snow depth on energy production from large-scale photovoltaic (PV) solar installations. The solar energy industry claims
Upper Missouri River Basin January 2018 Calendar Year Runoff Forecast January 3, 2018
 Calendar Year Runoff Forecast Upper Missouri River Basin January 2018 Calendar Year Runoff Forecast January 3, 2018 Explanation and Purpose of Forecast U.S. Army Corps of Engineers, Northwestern Division
White River Update. Jeanne Stypula, Supervising Engineer. Advisory Committee Meeting April 26, 2016
 White River Update Jeanne Stypula, Supervising Engineer Advisory Committee Meeting April 26, 2016 Department of Natural Resources and Parks Water and Land Resources Division River and Floodplain Management
Flood Risk Assessment
 Flood Risk Assessment February 14, 2008 Larry Schick Army Corps of Engineers Seattle District Meteorologist General Assessment As promised, La Nina caused an active winter with above to much above normal
7,042 7, ETA'MBST io n THE PRESS
 ETA'MBST io n THE PRESS R e l e a s e d f o r p u b l i c a t i o n S t. 5 1 3 0 Sun d a y m o r n in g, D e c. 5j F e d e r a l fiessrva B o a rd, not e a r l i e r. D ec e m b er 4, 1 9 2 6. 3ANTC D
Marine Analysis. LA 23 New. Louisiana. Prepared by:
 Gulf Intracoastal Waterway (GIWW) Marine Vessel Trafficc Analysis LA 23 New Orleans Gulf Coastt Railway Relocation PE/NEPA Project Jefferson and Plaquemines Parishes, Louisiana RPC Task LA23RR1 RPC/FRA
Septem ber 28, 2016 EL PASO, Texas
 September 28, 2016 EL PASO, Texas Crews from Paso del Norte Trackworks will finalize underground utility work and begin laying rail on a portion of Kansas Street thru Downtown El Paso in the coming weeks,
IN-NETWORK CHLORINE RESIDUAL MANAGEMENT
 IN-NETWORK CHLORINE RESIDUAL MANAGEMENT Using GIS to assess flush point efficacy Ian Toohey, P.E. Systems Planning Austin Water TABLE OF CONTENTS 1. Background 3. Surface Creation 2. Residual Sampling
Vibrancy and Property Performance of Major U.S. Employment Centers. Appendix A
 Appendix A DOWNTOWN VIBRANCY SCORES Atlanta 103.3 Minneapolis 152.8 Austin 112.3 Nashville 83.5 Baltimore 151.3 New Orleans 124.3 Birmingham 59.3 New York Midtown 448.6 Charlotte 94.1 Oakland 157.7 Chicago
Investigation 11.3 Weather Maps
 Name: Date: Investigation 11.3 Weather Maps What can you identify weather patterns based on information read on a weather map? There have been some amazing technological advancements in the gathering and
American Tour: Climate Objective To introduce contour maps as data displays.
 American Tour: Climate Objective To introduce contour maps as data displays. www.everydaymathonline.com epresentations etoolkit Algorithms Practice EM Facts Workshop Game Family Letters Assessment Management
Procedures for the Installation, Adjustment, Maintenance and. Inspection of CWR as Required by 49 CFR
 Procedures for the Installation, Adjustment, Maintenance and Inspection of CWR as Required by 49 CFR 213.119 Effective October 09, 2009 Procedures for the Installation, Adjustment, Maintenance and Inspection
JOURNAL OF THE CSXT HISTORICAL SOCIETY Volume 7 Number 2
 JOURNAL OF THE CSXT HISTORICAL SOCIETY Volume 7 Number 2 A CSXT MONON SYSTEM ABANDONMENT CSXTHS is not affiliated with CSX Transportation and is a nonprofit corporation chartered under the laws of Kentucky.
January 2011 Calendar Year Runoff Forecast
 January 2011 Calendar Year Runoff Forecast 2010 Runoff Year Calendar Year 2010 was the third highest year of runoff in the Missouri River Basin above Sioux City with 38.8 MAF, behind 1978 and 1997 which
Get involved in the City Nature Challenge 2018!
 Get involved in the City Nature Challenge 2018! ANDREA LOREK STRAUSS 1 WHAT IS CITY NATURE CHALLENGE? Cities compete to observe and record biodiversity Quest to: Document species Get people involved with
Great Lakes Update. Volume 199: 2017 Annual Summary. Background
 Great Lakes Update Volume 199: 2017 Annual Summary Background The U.S. Army Corps of Engineers (USACE) tracks and forecasts the water levels of each of the Great Lakes. This report is primarily focused
March 1, 2003 Western Snowpack Conditions and Water Supply Forecasts
 Natural Resources Conservation Service National Water and Climate Center 101 SW Main Street, Suite 1600 Portland, OR 97204-3224 Date: March 17, 2003 Subject: March 1, 2003 Western Snowpack Conditions and
Her birthday is May 4 th. He is not from Korea. You are not in Level 4.
 August is the eighth month of the year. Her birthday is May 4 th. He is not from Korea. You are not in Level 4. She is from India. What s her name? April is the fourth month of the year. They are not from
Committee Meeting November 6, 2018
 Committee Meeting November 6, 2018 Agenda Where we are in the process Land Use Plan Transportation Element Housing & Neighborhoods Elements Next Steps Schedule November 6: Plan Elements December: Plan
RESILIENCE: THE NEW REALITY JEFFREY D. KNUEPPEL DEPUTY GENERAL MANAGER MARCH 17, 2015
 RESILIENCE: THE NEW REALITY JEFFREY D. KNUEPPEL DEPUTY GENERAL MANAGER MARCH 17, 2015 EXTREME WEATHER = EXTREME COST EIGHT SEPARATE BILLION DOLLAR EXTREME WEATHER EVENTS ACROSS U.S. IN 2014 JANUARY 2014
Your web browser (Safari 7) is out of date. For more security, comfort and the best experience on this site: Update your browser Ignore
 is out of date. For more security, comfort and the best experience on this site: Update your browser Ignore") Your web browser (Safari 7) is out of date. For more security, comfort and the best experience on this site: Update your browser Ignore Educator Version TRACKING GRO W TH IN THE U.S. Late 19th century
Your web browser (Safari 7) is out of date. For more security, comfort and the best experience on this site: Update your browser Ignore Educator Version TRACKING GRO W TH IN THE U.S. Late 19th century
Monthly Long Range Weather Commentary Issued: APRIL 1, 2015 Steven A. Root, CCM, President/CEO
 Monthly Long Range Weather Commentary Issued: APRIL 1, 2015 Steven A. Root, CCM, President/CEO sroot@weatherbank.com FEBRUARY 2015 Climate Highlights The Month in Review The February contiguous U.S. temperature
Illinois Drought Update, December 1, 2005 DROUGHT RESPONSE TASK FORCE Illinois State Water Survey, Department of Natural Resources
 Illinois Drought Update, December 1, 2005 DROUGHT RESPONSE TASK FORCE Illinois State Water Survey, Department of Natural Resources For more drought information please go to http://www.sws.uiuc.edu/. SUMMARY.
T-12 / Informed Traveller
 T-12 Informed Traveller Paul McMahon Route Managing Director, Freight & National Passenger Operators Transport Focus Board 15 May 2018 1 A brief recap on context Network Rail offered May 2018 TT in November
Scaling in Biology. How do properties of living systems change as their size is varied?
 Scaling in Biology How do properties of living systems change as their size is varied? Example: How does basal metabolic rate (heat radiation) vary as a function of an animal s body mass? Mouse Hamster
Investigation IV: Seasonal Precipitation and Seasonal Surface Runoff in the US
 Investigation IV: Seasonal Precipitation and Seasonal Surface Runoff in the US Purpose Students will consider the seasonality of precipitation and surface runoff and think about how the time of year can
President s Day Weekend Storm Community Meeting and Workshop April 17, 2017
 President s Day Weekend Storm Community Meeting and Workshop April 17, 2017 Meeting outline 1. Progress update on the City of San Jose s recovery efforts 2. Water district presentation on: Weather situation
Mountain View Community Shuttle Monthly Operations Report
 Mountain View Community Shuttle Monthly Operations Report December 6, 2018 Contents Passengers per Day, Table...- 3 - Passengers per Day, Chart...- 3 - Ridership Year-To-Date...- 4 - Average Daily Ridership
2015 Fall Conditions Report
 2015 Fall Conditions Report Prepared by: Hydrologic Forecast Centre Date: December 21 st, 2015 Table of Contents Table of Figures... ii EXECUTIVE SUMMARY... 1 BACKGROUND... 2 SUMMER AND FALL PRECIPITATION...
WEATHER FORECASTING Acquisition of Weather Information WFO Regions Weather Forecasting Tools Weather Forecasting Tools Weather Forecasting Methods
 1 2 3 4 5 6 7 8 WEATHER FORECASTING Chapter 13 Acquisition of Weather Information 10,000 land-based stations, hundreds of ships and buoys; four times a day, airports hourly Upper level: radiosonde, aircraft,
Monthly Long Range Weather Commentary Issued: February 15, 2015 Steven A. Root, CCM, President/CEO
 Monthly Long Range Weather Commentary Issued: February 15, 2015 Steven A. Root, CCM, President/CEO sroot@weatherbank.com JANUARY 2015 Climate Highlights The Month in Review During January, the average
The hydrologic service area (HSA) for this office covers Central Kentucky and South Central Indiana.
 for this office covers Central Kentucky and South Central Indiana.") MONTH YEAR January 2011 February 15, 2011 X An X inside this box indicates that no flooding occurred within this hydrologic service area. January 2011 was drier than normal in all locations in the area.
MONTH YEAR January 2011 February 15, 2011 X An X inside this box indicates that no flooding occurred within this hydrologic service area. January 2011 was drier than normal in all locations in the area.
NEEDLES S STREET LEVEE SYSTEM SAN BERNARDINO COUNTY, CALIFORNIA NLD SYSTEM ID #
 SAN BERNARDINO COUNTY, CALIFORNIA NLD SYSTEM ID # 3805030008 PERIODIC INSPECTION REPORT NO. 1 GENERALIZED EXECUTIVE SUMMARY FINAL SYSTEM RATING: MINIMALLY ACCEPTABLE FINAL RATING DATE: AUGUST 2014 PERIODIC
Math 112 Spring 2018 Midterm 1 Review Problems Page 1
 Math Spring 8 Midterm Review Problems Page Note: Certain eam questions have been more challenging for students. Questions marked (***) are similar to those challenging eam questions.. Which one of the
Champaign-Urbana 1998 Annual Weather Summary
 Champaign-Urbana 1998 Annual Weather Summary ILLINOIS STATE WATER SURVEY Audrey Bryan, Weather Observer 2204 Griffith Dr. Champaign, IL 61820 wxobsrvr@sparc.sws.uiuc.edu The development of the El Nìno
PREPARED DIRECT TESTIMONY OF GREGORY TEPLOW SOUTHERN CALIFORNIA GAS COMPANY AND SAN DIEGO GAS & ELECTRIC COMPANY
 Application No: A.1-0- Exhibit No.: Witness: Gregory Teplow Application of Southern California Gas Company (U 0 G) and San Diego Gas & Electric Company (U 0 G) for Authority to Revise their Natural Gas
NIDIS Intermountain West Regional Drought Early Warning System February 7, 2017
 NIDIS Drought and Water Assessment NIDIS Intermountain West Regional Drought Early Warning System February 7, 2017 Precipitation The images above use daily precipitation statistics from NWS COOP, CoCoRaHS,
What s New in the World of Winter Maintenance Technology. Laser Road Surface Sensor (LRSS) Functional Description
 Functional Description") What s New in the World of Winter Maintenance Technology Dennis Burkheimer Winter Operations Administrator Iowa Department of Transportation John Scharffbillig Fleet Manager Minnesota Department of Transportation
What s New in the World of Winter Maintenance Technology Dennis Burkheimer Winter Operations Administrator Iowa Department of Transportation John Scharffbillig Fleet Manager Minnesota Department of Transportation
2018 Annual Review of Availability Assessment Hours
 2018 Annual Review of Availability Assessment Hours Amber Motley Manager, Short Term Forecasting Clyde Loutan Principal, Renewable Energy Integration Karl Meeusen Senior Advisor, Infrastructure & Regulatory
January 25, Summary
 January 25, 2013 Summary Precipitation since the December 17, 2012, Drought Update has been slightly below average in parts of central and northern Illinois and above average in southern Illinois. Soil
C Further Concepts in Statistics
 Appendix C.1 Representing Data and Linear Modeling C1 C Further Concepts in Statistics C.1 Representing Data and Linear Modeling Use stem-and-leaf plots to organize and compare sets of data. Use histograms
NIDIS Intermountain West Drought Early Warning System January 15, 2019
 NIDIS Drought and Water Assessment NIDIS Intermountain West Drought Early Warning System January 15, 2019 Precipitation The images above use daily precipitation statistics from NWS COOP, CoCoRaHS, and
MEASUREMENT OF VERTICAL TRACK MODULUS FROM A MOVING RAILCAR
 MEASUREMENT OF VERTICAL TRACK MODULUS FROM A MOVING RAILCAR Richard Arnold*, Sheng Lu*, Cory Hogan*, Shane Farritor* Mahmood Fateh, Magdy El-Sibaie * - Department of Mechanical Engineering University of
Cell- Each box of information in a chart or table. A cell is named by its column and row
 Lesson 7 Cell- Each box of information in a chart or table. A cell is named by its column and row Steps to read a chart or table: Check the title to find out what type of information is being presented.
Missouri River Basin Water Management Monthly Update
 Missouri River Basin Water Management Monthly Update Participating Agencies 255 255 255 237 237 237 0 0 0 217 217 217 163 163 163 200 200 200 131 132 122 239 65 53 80 119 27 National Oceanic and Atmospheric
Upper Missouri River Basin May 2018 Calendar Year Runoff Forecast May 4, 2018
 Calendar Year Runoff Forecast Explanation and Purpose of Forecast Upper Missouri River Basin May 2018 Calendar Year Runoff Forecast May 4, 2018 U.S. Army Corps of Engineers, Northwestern Division Missouri
Public Library Use and Economic Hard Times: Analysis of Recent Data
 Public Library Use and Economic Hard Times: Analysis of Recent Data A Report Prepared for The American Library Association by The Library Research Center University of Illinois at Urbana Champaign April
Huron School District Core Curriculum Guide Grade Level: 4th Content Area: Math
 Unit Title: Understand Whole Numbers and Operations Month(s): August, September, October 4N3.1; 4N1.1; 4A3.1; 4A1.3 4A1.2; 4A2.1; 4A2.2; 4A4.1 4A1.1 To read, write, and indentify the place value of whole
Great Lakes Update. Volume 188: 2012 Annual Summary
 Great Lakes Update Volume 188: 2012 Annual Summary Background The U.S. Army Corps of Engineers (USACE) tracks the water levels of each of the Great Lakes. This report highlights hydrologic conditions of
Midwest/Great Plains Climate-Drought Outlook September 20, 2018
 Midwest/Great Plains Climate-Drought Outlook September 20, 2018 Brian Fuchs National Drought Mitigation Center University of Nebraska-Lincoln School of Natural Resources September 20, 2018 General Information
Interstate 90 Road Report Montana
 Interstate 90 Road Report Montana Thank you for reading. Maybe you have knowledge that, people have look numerous times for their chosen books like this, but end up in malicious downloads. Rather than
Update on Seasonal Conditions & Summer Weather Outlook
 Update on Seasonal Conditions & Summer Weather Outlook Andy Bryant National Weather Service Portland, Oregon June 6, 2018 Overview Quick review of winter and spring conditions Seasonal water supply forecasts
MINNESOTA POWER ST LOUIS RIVER PROJECT FERC 2360 ISLAND LAKE RESERVOIR TECHNICAL COMMITTEE MEETING SUMMARY
 5/14/18 Spring Refill Meeting held via email Late spring snowmelt resulted in late start to refill. Spring runoff was not enhanced by rain on snow on frozen ground. Near record dry spring. Refill will
National Wildland Significant Fire Potential Outlook
 National Wildland Significant Fire Potential Outlook National Interagency Fire Center Predictive Services Issued: April 1, 2008 Next Issue: May 1, 2008 Wildland Fire Outlook April 2008 through July 2008
2010/2011 Winter Weather Summary
 2010/2011 Winter Weather Summary Number of Days of Snow Alerts* Precipitation Snow Rain October 0 6 Trace.91 inches November 0 16 1.1 inches.47 inches December 2 20 17.9 inches 1.54 inches 7.5" first alert
Fair Game Review. Chapter. Order the integers from least to greatest. 1. 9, 8, 0, 3, , 4, 1, 2, , 6, 8, 5, 9 4.
 Name Date Chapter 1 Fair Game Review Order the integers from least to greatest. 1. 9, 8, 0, 3, 7.,, 1,, 1 3. 11, 6, 8, 5, 9.,, 5, 0, 7 Use the graph to write an ordered pair corresponding to the point.
A Report on a Statistical Model to Forecast Seasonal Inflows to Cowichan Lake
 A Report on a Statistical Model to Forecast Seasonal Inflows to Cowichan Lake Prepared by: Allan Chapman, MSc, PGeo Hydrologist, Chapman Geoscience Ltd., and Former Head, BC River Forecast Centre Victoria
Great Plains and Midwest Climate Outlook February 18, 2016
 Great Plains and Midwest Climate Outlook February 18, 2016 Dr. Jim Angel State Climatologist Illinois State Water Survey University of Illinois jimangel@illinois.edu General Information Providing climate
Debbie Lee, Communications and Public Affairs Officer. Update on Southern California Edison s Capital Improvement Projects
 Information Item Date: June 22, 2015 To: From: Subject: Mayor and City Council Debbie Lee, Communications and Public Affairs Officer Update on Southern California Edison s Capital Improvement Projects
Unit 6: Industrialization and Development Part 3-4
 Unit 6: Industrialization and Development Part 3-4 ORIGINAL AUTHOR UNKNOWN, but appreciated greatly! Additional information added by A. Parkhurst, M.Ed. 2015 1 Part Three: The Evolution of Economic Cores
City of Hermosa Beach Beach Access and Parking Study. Submitted by. 600 Wilshire Blvd., Suite 1050 Los Angeles, CA
 City of Hermosa Beach Beach Access and Parking Study Submitted by 600 Wilshire Blvd., Suite 1050 Los Angeles, CA 90017 213.261.3050 January 2015 TABLE OF CONTENTS Introduction to the Beach Access and Parking
arxiv: v1 [q-bio.pe] 19 Dec 2012
![arxiv: v1 [q-bio.pe] 19 Dec 2012](/thumbs/88/114673757.jpg "arxiv: v1 [q-bio.pe] 19 Dec 2012") Week 49 Influenza Forecast for the 2012-2013 U.S. Season JEFFREY SHAMAN Department of Environmental Health Sciences, Mailman School of Public Health, Columbia University, New York, New York arxiv:1212.4678v1
Week 49 Influenza Forecast for the 2012-2013 U.S. Season JEFFREY SHAMAN Department of Environmental Health Sciences, Mailman School of Public Health, Columbia University, New York, New York arxiv:1212.4678v1
Name Block. My Junior Meteorologist Packet
 Name Block My Junior Meteorologist Packet 1 1 WEATHER INSTRUMENTS TUESDAY WARM UP- WEATHER TOOLS MATCH UP Write the letter of the weather instrument in the blank to show the correction function. 2 WEDNESDAY
May 31, Flood Response Overview
 May 31, 2013 Flood Response Overview Suppression 867 Personnel on three (3) shifts 289 Red Shift (A) 289 Blue Shift (B) 289 Green Shift (C) Department Overview Department Overview EMS: 40,934 False Alarm:
Vermont Soil Climate Analysis Network (SCAN) sites at Lye Brook and Mount Mansfield
 sites at Lye Brook and Mount Mansfield") Vermont Soil Climate Analysis Network (SCAN) sites at Lye Brook and Mount Mansfield 13 Years of Soil Temperature and Soil Moisture Data Collection September 2000 September 2013 Soil Climate Analysis Network
Vermont Soil Climate Analysis Network (SCAN) sites at Lye Brook and Mount Mansfield 13 Years of Soil Temperature and Soil Moisture Data Collection September 2000 September 2013 Soil Climate Analysis Network
NATIONAL WEATHER SERVICE
 January 2016 February 9, 2016 This was a dry month across the HSA despite one large and several smaller snowfalls. Most locations ended up 1-2 inches below normal for the month. The driest locations at
Plow Camera and Location Sharing Practices. National Rural ITS Conference October 23, 2018
 Plow Camera and Location Sharing Practices National Rural ITS Conference October 23, 2018 Outline NWP Program Overview Project Background Purpose What we did State Summaries ID, MT, ND, MN, IA, PA Project
Fort Lewis, Washington (47 05'N, 'W)
") Fort Lewis, Washington (47 05'N, 122 35'W) Full Year Climatology CONVENTIONS: The spelling of place names and geographical features are those used by the National Imagery and Mapping Agency (NIMA). All
Fort Lewis, Washington (47 05'N, 122 35'W) Full Year Climatology CONVENTIONS: The spelling of place names and geographical features are those used by the National Imagery and Mapping Agency (NIMA). All
NIDIS Intermountain West Drought Early Warning System February 6, 2018
 NIDIS Intermountain West Drought Early Warning System February 6, 2018 Precipitation The images above use daily precipitation statistics from NWS COOP, CoCoRaHS, and CoAgMet stations. From top to bottom,
2017 Fall Conditions Report
 2017 Fall Conditions Report Prepared by: Hydrologic Forecast Centre Date: November 15, 2017 Table of Contents TABLE OF FIGURES... ii EXECUTIVE SUMMARY... 1 BACKGROUND... 4 SUMMER AND FALL PRECIPITATION...