USAGE AND PLANS OF HOTSPOT INFORMATION IN INDONESIA
|
|
|
- Warren Golden
- 6 years ago
- Views:
Transcription


1 USAGE AND PLANS OF HOTSPOT INFORMATION IN INDONESIA Orbita Roswintiarti Natural Resources and Environmental Monitoring Division Indonesian National Institute of Aeronautics and Space (LAPAN) rs.lapan.go.id/simba LEMBAGA PENERBANGAN DAN ANTARIKSA NASIONAL INDONESIAN NATIONAL INSTITUTE OF AERONAUTICS AND SPACE
2 Background The forest/land fires in Indonesia occur every year, while the severe fires often associated with El Niño/Southern Oscillation (ENSO) events. SEA SURFACE TEMPERATURE ANOMALY AT NINO 3.4 REGION (5 N-5 S; W) / / / / / Nino 3.4 SSTA Year
 Main user: Dep.")
3 Usage of Hotspot Information - Past Hotspot information as the fire potential information has been produced by LAPAN since 1987: Source: NOAA/AVHRR data Ground receiving station: Jakarta (West Java) Main user: Dep. of Forestry Jakarta Pare-Pare

4 Usage of Hotspot Information - Now Source: NOAA/AVHRR and Terra/Aqua MODIS data Ground receiving stations: Jakarta (West Java) and Pare-Pare (South Sulawesi) Users: National Coordinating Board for Disaster Management Dep. of Forestry Dep. of Agriculture Min. of Environment Min. of Research and Technology Dep. of Home Affairs Statistics Indonesia UN World Food Programme ASEAN Secretariat EU South Sumatera Forest Fire Management Project WWF and CARE International Central Kalimantan Public through rs.lapan.go.id/simba etc.
 Tb 3 330 K")

5 NOAA/AVHRR Algorithms A pixel is classified as a hotspot if: Tb K (nighttime) Tb K (daytime) Tb 3 Tb 4 20 K Ch. 3 Ch. 4 Tb 3 : The brightness temperature of Ch. 3 Tb 4 : The brightness temperature of Ch. 4
6 Terra/Aqua MODIS Algorithms Fire (hotspot) and Vegetation Index algorithms are taken from the NASA Goddard Space Flight Center. A detailed description of the algorithm may be found in: Giglio,, L., J. Descloitres,, C. O. Justice, and Y. J. Kaufman, 2003: An enhanced contextual fire detection algorithm for MODIS. Remote Sensing of Environment,, 87,

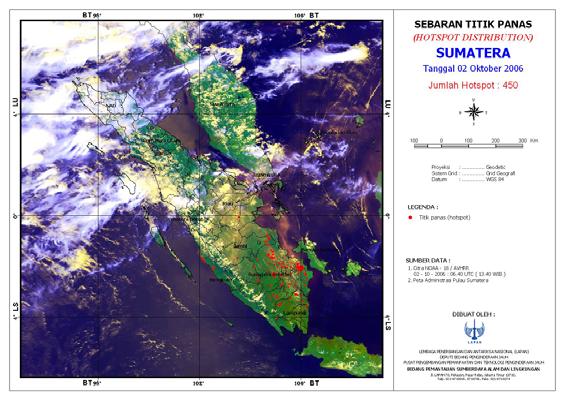
7 Hotspot from NOAA/AVHRR

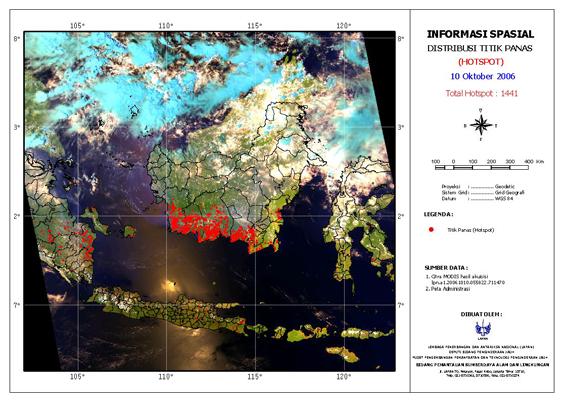
8 Hotspot from Terra/Aqua MODIS
9 Monthly Hotspot Sumatera and Kalimantan 6000 Number of Hotspots in Sumatera Island 5000 AVHRR MODIS No. of hotspot Jan Feb Mar Apr May Jun Jul Aug Sep Oct Nov Dec AVHRR MODIS Month Number of Hotspots in Kalimantan The difference between the no. of hotspots obtained by the AVHRR and MODIS could be caused by the different: acquisition time threshold method No. of hotspot Jan Feb Mar Apr May Jun Jul Aug Sep Oct Nov Dec Month


 LAPORAN PEMANTAUAN CUACA DAN")
10 Information Dissemination Website rs.lapan.go.id/simba Monthly report. Seminars, Workshops, Meetings, Trainings, etc. WFP-LAPAN Indonesia Early Warning Bulletin on Natural Hazards International links with: Sentinel Asia Disaster Management Support System in the Asia-Pacific Region Digital Asia Network ASEAN Secretariat Global Observation of Forest and Land Cover Dynamics (GOFC- GOLD) LAPORAN PEMANTAUAN CUACA DAN IKLIM DI INDONESIA BULAN DESEMBER 2006

11 Link to Digital Asia Network ang=eng Month No. of days No. of hotspots Jul ,490 Aug ,681 Sep ,313 Oct ,678 Nov ,014 Dec ,794 Jan Problems: Some technical problems related with MODIS receiving systems at LAPAN. Slow access to the Digital Asia Network server provider (send and view).
12 Usage of Hotspot Information - Plans To upgrade the existing acquisition systems (receiving and processing systems) To process the hotspot information automatically To validate the hotspot algorithms: Sentinel Asia: Joint Project Team (JPT) activities Results from Hotspot Validation Campaign in Central Kalimantan (October 2006) To extend national, regional, and international collaborations (e. g. GOFC/GOLD, GFMC, Department of Land Information - Gov. of Western Australia, etc)
13 Recommendation To support the wildland fire prevention at the national and regional levels, the assistances from the regional and international institutions/organizations are needed, particularly in: The upgrade of the acquisition, monitoring, and information management systems. The improvement of climate prediction that are likely to results in fires. The methods of the validation. The implementation of the Global Wildland Fire Early Warning System.
14
Disaster Monitoring with Remote Sensing at CRISP, NUS
 Disaster Monitoring with Remote Sensing at CRISP, NUS KWOH, Leong Keong Director, CRISP The 3rd Sentinel Asia Joint Project Team Meeting (JPTM) Le Meridien Hotel, Singapore 13-15 March 2007 6 metre Antenna
GAMINGRE 8/1/ of 7
 FYE 09/30/92 JULY 92 0.00 254,550.00 0.00 0 0 0 0 0 0 0 0 0 254,550.00 0.00 0.00 0.00 0.00 254,550.00 AUG 10,616,710.31 5,299.95 845,656.83 84,565.68 61,084.86 23,480.82 339,734.73 135,893.89 67,946.95
Food Security Monitoring Bulletin. INDONESIA Special Focus: Estimating Impact of Disasters on Market Access
 Food Security Monitoring Bulletin INDONESIA Special Focus: Estimating Impact of Disasters on Market Access Volume 10, May 2018 CLIMATE AND FOOD SECURITY January - April 2018 More floods and landslides
Computing & Telecommunications Services
 Computing & Telecommunications Services Monthly Report September 214 CaTS Help Desk (937) 775-4827 1-888-775-4827 25 Library Annex helpdesk@wright.edu www.wright.edu/cats/ Table of Contents HEAT Ticket
Weather Satellite Data Applications for Monitoring and Warning Hazard at BMKG
 The 5th Meeting of the Coordinating Group of the RA II WIGOS Satellite Project 21 October 2017, Vladivostok city, Russky Island, Russia Far Eastern Federal University Weather Satellite Data Applications
2003 Water Year Wrap-Up and Look Ahead
 2003 Water Year Wrap-Up and Look Ahead Nolan Doesken Colorado Climate Center Prepared by Odie Bliss http://ccc.atmos.colostate.edu Colorado Average Annual Precipitation Map South Platte Average Precipitation
Computing & Telecommunications Services Monthly Report January CaTS Help Desk. Wright State University (937)
") January 215 Monthly Report Computing & Telecommunications Services Monthly Report January 215 CaTS Help Desk (937) 775-4827 1-888-775-4827 25 Library Annex helpdesk@wright.edu www.wright.edu/cats/ Last
January 215 Monthly Report Computing & Telecommunications Services Monthly Report January 215 CaTS Help Desk (937) 775-4827 1-888-775-4827 25 Library Annex helpdesk@wright.edu www.wright.edu/cats/ Last
Policies and practices of remote sensing implementation in Indonesia
 Policies and practices of remote sensing implementation in Indonesia AGF 2014 Jakarta, 26 Nov 2014 Orbita Roswintiarti Deputy Chairman for Remote Sensing Affairs Outline Background Role of LAPAN in remote
UPDATE OF REGIONAL WEATHER AND SMOKE HAZE November 2016
 UPDATE OF REGIONAL WEATHER AND SMOKE HAZE November 2016 1. Review of Regional Weather Conditions in November 2016 1.1 Southwest Monsoon conditions prevailed on most days in October 2016 and the winds were
OVERVIEW OF IMPROVED USE OF RS INDICATORS AT INAM. Domingos Mosquito Patricio
 OVERVIEW OF IMPROVED USE OF RS INDICATORS AT INAM Domingos Mosquito Patricio domingos.mosquito@gmail.com Introduction to Mozambique /INAM Introduction to AGRICAB/SPIRITS Objectives Material & Methods Results
JOINT BRIEFING TO THE MEMBERS. El Niño 2018/19 Likelihood and potential impact
 JOINT BRIEFING TO THE MEMBERS El Niño 2018/19 Likelihood and potential impact CURRENT EL NIÑO OUTLOOK (SEPTEMBER 2018) CPC/IRI ENSO Forecast from September. Red bars denote probability of an El Nino developing
Stefan Liess University of Minnesota Saurabh Agrawal, Snigdhansu Chatterjee, Vipin Kumar University of Minnesota
 Introducing and Finding Tripoles: A Connection Between Central Asia and the Tropical Pacific Stefan Liess University of Minnesota liess@umn.edu Saurabh Agrawal, Snigdhansu Chatterjee, Vipin Kumar University
Variability and trend of the heat balance in the southeast Indian Ocean
 Variability and trend of the heat balance in the southeast Indian Ocean Ming Feng, CSIRO Marine & Atmospheric Research Arne Biastoch, Claus Böning, Leibniz-Institut für Meeresforschung Nick Caputi, Department
10 emergency observation requests were successfully processed during the period
 ISRO s Inputs for the Sentinel Asia DPN and JPT meeting being held during 13-16, 16, November 2012 November 2012 Sentinel Asia Activity Spectrum - A dedicated Sentinel Asia server established at NRSC,
Sierra Weather and Climate Update
 Sierra Weather and Climate Update 2014-15 Kelly Redmond Western Regional Climate Center Desert Research Institute Reno Nevada Yosemite Hydroclimate Workshop Yosemite Valley, 2015 October 8-9 Percent of
Climatography of the United States No
 Climate Division: AK 5 NWS Call Sign: ANC Month (1) Min (2) Month(1) Extremes Lowest (2) Temperature ( F) Lowest Month(1) Degree s (1) Base Temp 65 Heating Cooling 90 Number of s (3) Jan 22.2 9.3 15.8
COUNTRY REPORT. Jakarta. July, th National Directorate of Meteorology and Geophysics of Timor-Leste (DNMG)
") The Southeastern Asia-Oceania Flash Flood COUNTRY REPORT Jakarta. July, 10-12 th 2017 National Directorate of Meteorology and Geophysics of Timor-Leste (DNMG) Carla Feritas and Crisostimo Lobato Democratic
The Southeastern Asia-Oceania Flash Flood COUNTRY REPORT Jakarta. July, 10-12 th 2017 National Directorate of Meteorology and Geophysics of Timor-Leste (DNMG) Carla Feritas and Crisostimo Lobato Democratic
LEMBAGA PENERBANGAN DAN ANTARIKSA NASIONAL INDONESIAN NATIONAL INSTITUTE OF AERONAUTICS AND SPACE (LAPAN)
") LEMBAGA PENERBANGAN DAN ANTARIKSA NASIONAL INDONESIAN NATIONAL INSTITUTE OF AERONAUTICS AND SPACE (LAPAN) The Utilization of Remotely Sensed Data to Analyze The Estimated Volume of Pyroclastic Deposits
LEMBAGA PENERBANGAN DAN ANTARIKSA NASIONAL INDONESIAN NATIONAL INSTITUTE OF AERONAUTICS AND SPACE (LAPAN) The Utilization of Remotely Sensed Data to Analyze The Estimated Volume of Pyroclastic Deposits
Climatography of the United States No
 Climate Division: CA 4 NWS Call Sign: Month (1) Min (2) Month(1) Extremes Lowest (2) Temperature ( F) Lowest Month(1) Degree s (1) Base Temp 65 Heating Cooling 100 Number of s (3) Jan 55.6 39.3 47.5 77
Climatography of the United States No
 Climate Division: CA 5 NWS Call Sign: Month (1) Min (2) Month(1) Extremes Lowest (2) Temperature ( F) Lowest Month(1) Degree s (1) Base Temp 65 Heating Cooling 100 Number of s (3) Jan 56.6 36.5 46.6 81
Climatography of the United States No
 Climate Division: CA 1 NWS Call Sign: Month (1) Min (2) Month(1) Extremes Lowest (2) Temperature ( F) Lowest Month(1) Degree s (1) Base Temp 65 Heating Cooling 100 Number of s (3) Jan 57.9 38.9 48.4 85
Climatography of the United States No
 Climate Division: CA 5 NWS Call Sign: Month (1) Min (2) Month(1) Extremes Lowest (2) Temperature ( F) Lowest Month(1) Degree s (1) Base Temp 65 Heating Cooling 100 Number of s (3) Jan 44.8 25.4 35.1 72
Climatography of the United States No
 Climate Division: CA 4 NWS Call Sign: Month (1) Min (2) Month(1) Extremes Lowest (2) Temperature ( F) Lowest Month(1) Degree s (1) Base Temp 65 Heating Cooling 100 Number of s (3) Jan 49.4 37.5 43.5 73
Climatography of the United States No
 Climate Division: CA 6 NWS Call Sign: Month (1) Min (2) Month(1) Extremes Lowest (2) Temperature ( F) Lowest Month(1) Degree s (1) Base Temp 65 Heating Cooling 100 Number of s (3) Jan 69.4 46.6 58.0 92
Climatography of the United States No
 Climate Division: CA 4 NWS Call Sign: Month (1) Min (2) Month(1) Extremes Lowest (2) Temperature ( F) Lowest Month(1) Degree s (1) Base Temp 65 Heating Cooling 1 Number of s (3) Jan 58.5 38.8 48.7 79 1962
Climatography of the United States No
 Climate Division: CA 6 NWS Call Sign: Month (1) Min (2) Month(1) Extremes Lowest (2) Temperature ( F) Lowest Month(1) Degree s (1) Base Temp 65 Heating Cooling 1 Number of s (3) Jan 67.5 42. 54.8 92 1971
Climatography of the United States No
 Climate Division: CA 1 NWS Call Sign: Month (1) Min (2) Month(1) Extremes Lowest (2) Temperature ( F) Lowest Month(1) Degree s (1) Base Temp 65 Heating Cooling 1 Number of s (3) Jan 57.8 39.5 48.7 85 1962
I C P A C. IGAD Climate Prediction and Applications Centre Monthly Climate Bulletin, Climate Review for September 2017
 Bulletin Issue October 2017 I C P A C IGAD Climate Prediction and Applications Centre Monthly Climate Bulletin, Climate Review for September 2017 1. INTRODUCTION This bulletin reviews the September 2017
Average 175, , , , , , ,046 YTD Total 1,098,649 1,509,593 1,868,795 1,418, ,169 1,977,225 2,065,321
 AGRICULTURE 01-Agriculture JUL 2,944-4,465 1,783-146 102 AUG 2,753 6,497 5,321 1,233 1,678 744 1,469 SEP - 4,274 4,183 1,596 - - 238 OCT 2,694 - - 1,032 340-276 NOV 1,979-5,822 637 3,221 1,923 1,532 DEC
Average 175, , , , , , ,940 YTD Total 944,460 1,284,944 1,635,177 1,183, ,954 1,744,134 1,565,640
 AGRICULTURE 01-Agriculture JUL 2,944-4,465 1,783-146 102 AUG 2,753 6,497 5,321 1,233 1,678 744 1,469 SEP - 4,274 4,183 1,596 - - 238 OCT 2,694 - - 1,032 340-276 NOV 1,979-5,822 637 3,221 1,923 1,532 DEC
El Nino: Outlook VAM-WFP HQ September 2018
 El Nino: Outlook 2018 VAM-WFP HQ September 2018 El Nino Outlook September 2018 2015-16 El Nino Peak Possible evolution of an El Nino indicator (Pacific sea surface temperature anomaly) generated by a diverse
Climatography of the United States No
 Climate Division: ND 8 NWS Call Sign: BIS Month (1) Min (2) Month(1) Extremes Lowest (2) Temperature ( F) Lowest Month(1) Degree s (1) Base Temp 65 Heating Cooling 100 Number of s (3) Jan 21.1 -.6 10.2
Climatography of the United States No
 Climate Division: TN 1 NWS Call Sign: Month (1) Min (2) Month(1) Extremes Lowest (2) Temperature ( F) Lowest Month(1) Degree s (1) Base Temp 65 Heating Cooling 100 Number of s (3) Jan 47.6 24.9 36.3 81
Climatography of the United States No
 Climate Division: CA 5 NWS Call Sign: FAT Month (1) Min (2) Month(1) Extremes Lowest (2) Temperature ( F) Lowest Month(1) Degree s (1) Base Temp 65 Heating Cooling 1 Number of s (3) Jan 53.6 38.4 46. 78
Climatography of the United States No
 Climate Division: CA 6 NWS Call Sign: 1L2 N Lon: 118 3W Month (1) Min (2) Month(1) Extremes Lowest (2) Temperature ( F) Lowest Month(1) Degree s (1) Base Temp 65 Heating Cooling 1 Number of s (3) Jan 63.7
WHEN IS IT EVER GOING TO RAIN? Table of Average Annual Rainfall and Rainfall For Selected Arizona Cities
 WHEN IS IT EVER GOING TO RAIN? Table of Average Annual Rainfall and 2001-2002 Rainfall For Selected Arizona Cities Phoenix Tucson Flagstaff Avg. 2001-2002 Avg. 2001-2002 Avg. 2001-2002 October 0.7 0.0
Using Reanalysis SST Data for Establishing Extreme Drought and Rainfall Predicting Schemes in the Southern Central Vietnam
 Using Reanalysis SST Data for Establishing Extreme Drought and Rainfall Predicting Schemes in the Southern Central Vietnam Dr. Nguyen Duc Hau 1, Dr. Nguyen Thi Minh Phuong 2 National Center For Hydrometeorological
Climatography of the United States No
 Climate Division: CA 5 NWS Call Sign: BFL Month (1) Min (2) Month(1) Extremes Lowest (2) Temperature ( F) Lowest Month(1) Degree s (1) Base Temp 65 Heating Cooling 1 Number of s (3) Jan 56.3 39.3 47.8
Climatography of the United States No
 Climate Division: SC 7 NWS Call Sign: CHS Month (1) Min (2) Month(1) Extremes Lowest (2) Temperature ( F) Lowest Month(1) Degree s (1) Base Temp 65 Heating Cooling 100 Number of s (3) Jan 58.9 36.9 47.9
ENSO Outlook by JMA. Hiroyuki Sugimoto. El Niño Monitoring and Prediction Group Climate Prediction Division Japan Meteorological Agency
 ENSO Outlook by JMA Hiroyuki Sugimoto El Niño Monitoring and Prediction Group Climate Prediction Division Outline 1. ENSO impacts on the climate 2. Current Conditions 3. Prediction by JMA/MRI-CGCM 4. Summary
Climatography of the United States No
 Climate Division: TN 3 NWS Call Sign: BNA Month (1) Min (2) Month(1) Extremes Lowest (2) Temperature ( F) Lowest Month(1) Degree s (1) Base Temp 65 Heating Cooling 100 Number of s (3) Jan 45.6 27.9 36.8
Forecasting hotspots in East Kutai, Kutai Kartanegara, and West Kutai as early warning information
 IOP Conference Series: Earth and Environmental Science PAPER OPEN ACCESS Forecasting hotspots in East Kutai, Kutai Kartanegara, and West Kutai as early warning information To cite this article: S Wahyuningsih
Climatography of the United States No
 Climate Division: CA 5 NWS Call Sign: Elevation: 6 Feet Lat: 37 Month (1) Min (2) Month(1) Extremes Lowest (2) Temperature ( F) Lowest Month(1) Degree s (1) Base Temp 65 Heating Cooling 1 Number of s (3)
Climatography of the United States No
 Climate Division: CA 4 NWS Call Sign: Elevation: 2 Feet Lat: 37 Month (1) Min (2) Month(1) Extremes Lowest (2) Temperature ( F) Lowest Month(1) Degree s (1) Base Temp 65 Heating Cooling 1 Number of s (3)
Climatography of the United States No
 Climate Division: CA 4 NWS Call Sign: Elevation: 13 Feet Lat: 36 Month (1) Min (2) Month(1) Extremes Lowest (2) Temperature ( F) Lowest Month(1) Degree s (1) Base Temp 65 Heating Cooling 1 Number of s
Climatography of the United States No
 Climate Division: CA 5 NWS Call Sign: Elevation: 1,14 Feet Lat: 36 Month (1) Min (2) Month(1) Extremes Lowest (2) Temperature ( F) Lowest Month(1) Degree s (1) Base Temp 65 Heating Cooling 1 Number of
El Nino 2015 in South Sudan: Impacts and Perspectives. Raul Cumba
 El Nino 2015 in South Sudan: Impacts and Perspectives Raul Cumba El Nino 2015-2016 The El Nino Event of 2015-2016 The 2015/16 El Nino Event Officially declared in March 2015 Now approaching peak intensity
Midwest and Great Plains Climate and Drought Update
 Midwest and Great Plains Climate and Drought Update June 20,2013 Laura Edwards Climate Field Specialist Laura.edwards@sdstate.edu 605-626-2870 2012 Board of Regents, South Dakota State University General
Appearance of solar activity signals in Indian Ocean Dipole (IOD) phenomena and monsoon climate pattern over Indonesia
 phenomena and monsoon climate pattern over Indonesia") Bull. Astr. Soc. India (2007) 35, 575 579 Appearance of solar activity signals in Indian Ocean Dipole (IOD) phenomena and monsoon climate pattern over Indonesia Jalu Tejo Nugroho National Institute of
Bull. Astr. Soc. India (2007) 35, 575 579 Appearance of solar activity signals in Indian Ocean Dipole (IOD) phenomena and monsoon climate pattern over Indonesia Jalu Tejo Nugroho National Institute of
Climatography of the United States No
 Climate Division: CA 6 NWS Call Sign: LAX Elevation: 1 Feet Lat: 33 Month (1) Min (2) Month(1) Extremes Lowest (2) Temperature ( F) Lowest Month(1) Degree s (1) Base Temp 65 Heating Cooling 1 Number of
Climatography of the United States No
 Climate Division: CA 6 NWS Call Sign: TOA Elevation: 11 Feet Lat: 33 2W Temperature ( F) Month (1) Min (2) Month(1) Extremes Lowest (2) Lowest Month(1) Degree s (1) Base Temp 65 Heating Cooling 1 Number
YACT (Yet Another Climate Tool)? The SPI Explorer
? The SPI Explorer") YACT (Yet Another Climate Tool)? The SPI Explorer Mike Crimmins Assoc. Professor/Extension Specialist Dept. of Soil, Water, & Environmental Science The University of Arizona Yes, another climate tool for
YACT (Yet Another Climate Tool)? The SPI Explorer Mike Crimmins Assoc. Professor/Extension Specialist Dept. of Soil, Water, & Environmental Science The University of Arizona Yes, another climate tool for
El Nino: Outlook 2018
 El Nino: Outlook 2018 VAM-WFP HQ December 2018 WFP VAM Food Security Analysis El Nino Outlook December 2018 2015-16 El Nino Peak Possible evolution of an El Nino indicator (Pacific sea surface temperature
Climatography of the United States No
 No. 2 1971-2 Asheville, North Carolina 2881 COOP ID: 46646 Climate Division: CA 4 NWS Call Sign: 8W Month (1) Min (2) Month(1) Extremes Lowest (2) Temperature ( F) Lowest Month(1) Degree s (1) Base Temp
Climatography of the United States No
 No. 2 1971-2 Asheville, North Carolina 2881 COOP ID: 4792 Climate Division: CA 6 NWS Call Sign: Month (1) Min (2) Month(1) Extremes Lowest (2) Temperature ( F) Lowest Month(1) Degree s (1) Base Temp 65
Supplementary appendix
 Supplementary appendix This appendix formed part of the original submission and has been peer reviewed. We post it as supplied by the authors. Supplement to: Lowe R, Stewart-Ibarra AM, Petrova D, et al.
Implications of Climate Change on Long Lead Forecasting and Global Agriculture. Ray Motha
 Implications of Climate Change on Long Lead Forecasting and Global Agriculture Ray Motha Source: http://www.coaps.fsu.edu/lib/climatoons/toon38.shtml ENSO Teleconnections 30 Observed Monthly Sea Surface
I C P A C. IGAD Climate Prediction and Applications Centre Monthly Climate Bulletin, Climate Review for April 2018
 No. ICPAC/02/312 Bulletin Issue May 2018 I C P A C IGAD Climate Prediction and Applications Centre Monthly Climate Bulletin, Climate Review for April 2018 1. INTRODUCTION This bulletin reviews the April
Climatography of the United States No
 Month (1) Min (2) Month(1) Extremes Lowest (2) Temperature ( F) Lowest Month(1) Degree s (1) Base Temp 65 Heating Cooling 100 Number of s (3) Jan 63.9 39.3 51.6 86 1976 16 56.6 1986 20 1976 2 47.5 1973
Climatography of the United States No
 Temperature ( F) Month (1) Min (2) Month(1) Extremes Lowest (2) Lowest Month(1) Degree s (1) Base Temp 65 Heating Cooling 100 Number of s (3) Jan 32.8 21.7 27.3 62 1918 1 35.8 1983-24 1950 29 10.5 1979
Climatography of the United States No
 No. 2 1971-2 Asheville, North Carolina 2881 COOP ID: 43417 Climate Division: CA 4 NWS Call Sign: N Lon: 121 Month (1) Min (2) Month(1) Extremes Lowest (2) Temperature ( F) Lowest Month(1) Degree s (1)
Climatography of the United States No
 No. 2 1971-2 Asheville, North Carolina 2881 COOP ID: 4795 Climate Division: CA 6 NWS Call Sign: SBA Month (1) Min (2) Month(1) Extremes Lowest (2) Temperature ( F) Lowest Month(1) Degree s (1) Base Temp
1. INTRODUCTION 2. HIGHLIGHTS
 Bulletin Issue January 2017 Issue Number: ICPAC/03/44 IGAD Climate Prediction and Applications Centre Seasonal Bulletin, Review for October to December (OND) Season 2016 For referencing within this bulletin,
What Does It Take to Get Out of Drought?
 What Does It Take to Get Out of Drought? Nolan J. Doesken Colorado Climate Center Colorado State University http://ccc.atmos.colostate.edu Presented at the Insects, Diseases and Drought Workshop, May 19,
I C P A C IGAD Climate Prediction & Applications centre
 s` I C P A C IGAD Climate Prediction & Applications centre Bulletin Issue July 2017 Issue Number: ICPAC/02/303 IGAD Climate Prediction and Applications Centre Monthly Climate Bulletin, June 2017 1. INTRODUCTION
Impact of Intraseasonal Variations to the Spatial Distribution of Coastal Heavy Rainbands Intensity During HARIMAU IOP 2011 in the West Sumatera
 Impact of Intraseasonal Variations to the Spatial Distribution of Coastal Heavy Rainbands Intensity During HARIMAU IOP 2011 in the West Sumatera Ardhi Adhary Arbain, Yekti Galihselowati Agency for the
Climatography of the United States No
 Climate Division: CA 6 NWS Call Sign: Month (1) Min (2) Month(1) Extremes Lowest (2) Temperature ( F) Lowest Month(1) Degree s (1) Base Temp 65 Heating Cooling 100 Number of s (3) Jan 51.5 35.0 43.3 80
Climatography of the United States No
 No. 2 1971-2 Asheville, North Carolina 2881 COOP ID: 46175 Climate Division: CA 6 NWS Call Sign: 3L3 Elevation: 1 Feet Lat: 33 Month (1) Min (2) Month(1) Extremes Lowest (2) Temperature ( F) Lowest Month(1)
Climatography of the United States No
 No. 2 1971-2 Asheville, North Carolina 2881 COOP ID: 42713 Climate Division: CA 7 NWS Call Sign: Elevation: -3 Feet Lat: 32 Month (1) Min (2) Month(1) Extremes Lowest (2) Temperature ( F) Lowest Month(1)
Climatography of the United States No
 Climate Division: CA 5 NWS Call Sign: Month (1) Min (2) Month(1) Extremes Lowest (2) Temperature ( F) Lowest Month(1) Degree s (1) Base Temp 65 Heating Cooling 100 Number of s (3) 59.3 31.5 45.4 80 1976
Climatography of the United States No
 Climate Division: CA 7 NWS Call Sign: Month (1) Min (2) Month(1) Extremes Lowest (2) Temperature ( F) Lowest Month(1) Degree s (1) Base Temp 65 Heating Cooling 100 Number of s (3) 44.5 29.3 36.9 69 1951
Climatography of the United States No
 Climate Division: CA 2 NWS Call Sign: Month (1) Min (2) Month(1) Extremes Lowest (2) Temperature ( F) Lowest Month(1) Degree s (1) Base Temp 65 Heating Cooling 100 Number of s (3) 53.3 37.1 45.2 77 1962
Climatography of the United States No
 Climate Division: CA 2 NWS Call Sign: Month (1) Min (2) Month(1) Extremes Lowest (2) Temperature ( F) Lowest Month(1) Degree s (1) Base Temp 65 Heating Cooling 100 Number of s (3) 53.3 31.8 42.6 74+ 1975
Climatography of the United States No
 Climate Division: CA 2 NWS Call Sign: Month (1) Min (2) Month(1) Extremes Lowest (2) Temperature ( F) Lowest Month(1) Degree s (1) Base Temp 65 Heating Cooling 100 Number of s (3) 53.7 32.7 43.2 79 1962
Climatography of the United States No
 Climate Division: CA 6 NWS Call Sign: Month (1) Min (2) Month(1) Extremes Lowest (2) Temperature ( F) Lowest Month(1) Degree s (1) Base Temp 65 Heating Cooling 100 Number of s (3) 68.5 45.7 57.1 90 1971
Climatography of the United States No
 Climate Division: CA 7 NWS Call Sign: Month (1) Min (2) Month(1) Extremes Lowest (2) Temperature ( F) Lowest Month(1) Degree s (1) Base Temp 65 Heating Cooling 100 Number of s (3) 56.0 35.7 45.9 83 1975
Climatography of the United States No
 Climate Division: CA 7 NWS Call Sign: Month (1) Min (2) Month(1) Extremes Lowest (2) Temperature ( F) Lowest Month(1) Degree s (1) Base Temp 65 Heating Cooling 1 Number of s (3) 64.8 45.4 55.1 85 1971
Climatography of the United States No
 Climate Division: CA 7 NWS Call Sign: Month (1) Min (2) Month(1) Extremes Lowest (2) Temperature ( F) Lowest Month(1) Degree s (1) Base Temp 65 Heating Cooling 1 Number of s (3) 65.5 38.7 52.1 87 1962
Climatography of the United States No
 Climate Division: CA 7 NWS Call Sign: Month (1) Min (2) Month(1) Extremes Lowest (2) Temperature ( F) Lowest Month(1) Degree s (1) Base Temp 65 Heating Cooling 100 Number of s (3) 58.8 34.3 46.6 81+ 1948
Climatography of the United States No
 Climate Division: CA 7 NWS Call Sign: Month (1) Min (2) Month(1) Extremes Lowest (2) Temperature ( F) Lowest Month(1) Degree s (1) Base Temp 65 Heating Cooling 100 Number of s (3) 70.4 44.2 57.3 95 1971
The weather effect: what it means for global sugar markets. Platts 8th Annual Kingsman Asia Sugar Conference September 8, 2017
 The weather effect: what it means for global sugar markets Platts 8th Annual Kingsman Asia Sugar Conference September 8, 2017 01/02 02/03 03/04 04/05 05/06 06/07 07/08 08/09 09/10 10/11 11/12 12/13 13/14
Climatography of the United States No
 Climate Division: CA 1 NWS Call Sign: Month (1) Min (2) Month(1) Extremes Lowest (2) Temperature ( F) Lowest Month(1) Degree s (1) Base Temp 65 Heating Cooling 100 Number of s (3) Jan 52.4 35.4 43.9 69
Climatography of the United States No
 Climate Division: CA 4 NWS Call Sign: Month (1) Min (2) Month(1) Extremes Lowest (2) Temperature ( F) Lowest Month(1) Degree s (1) Base Temp 65 Heating Cooling 100 Number of s (3) Jan 61.9 42.0 52.0 89
Climatography of the United States No
 Climate Division: CA 2 NWS Call Sign: Month (1) Min (2) Month(1) Extremes Lowest (2) Temperature ( F) Lowest Month(1) Degree s (1) Base Temp 65 Heating Cooling 100 Number of s (3) Jan 55.6 38.8 47.2 81
Climatography of the United States No
 Climate Division: CA 2 NWS Call Sign: Month (1) Min (2) Month(1) Extremes Lowest (2) Temperature ( F) Lowest Month(1) Degree s (1) Base Temp 65 Heating Cooling 100 Number of s (3) Jan 53.5 37.6 45.6 78
Climatography of the United States No
 Climate Division: CA 6 NWS Call Sign: Month (1) Min (2) Month(1) Extremes Lowest (2) Temperature ( F) Lowest Month(1) Degree s (1) Base Temp 65 Heating Cooling 100 Number of s (3) Jan 66.1 38.3 52.2 91
Climatography of the United States No
 Climate Division: CA 1 NWS Call Sign: Month (1) Min (2) Month(1) Extremes Lowest (2) Temperature ( F) Lowest Month(1) Degree s (1) Base Temp 65 Heating Cooling 1 Number of s (3) Jan 56.2 4.7 48.5 79 1962
Aniekan Eyoh 1* Department of Geoinformatics & Surveying, Faculty of Environmental Studies, University of Uyo, Nigeria
 Available online at http://euroasiapub.org/journals.php, pp. 53~62 Thomson Reuters Researcher ID: L-5236-2015 TEMPORAL APPRAISAL OF LAND SURFACE TEMPERATURE DYNAMICS ACROSS THE NINE STATES OF NIGER DELTA
Climatography of the United States No
 Climate Division: CA 1 NWS Call Sign: Month (1) Min (2) Month(1) Extremes Lowest (2) Temperature ( F) Lowest Month(1) Degree s (1) Base Temp 65 Heating Cooling 100 Number of s (3) Jan 50.2 31.2 40.7 65+
Climatography of the United States No
 Climate Division: CA 4 NWS Call Sign: Month (1) Min (2) Month(1) Extremes Lowest (2) Temperature ( F) Lowest Month(1) Degree s (1) Base Temp 65 Heating Cooling 100 Number of s (3) Jan 61.4 33.1 47.3 82+
Climatography of the United States No
 Climate Division: CA 4 NWS Call Sign: Month (1) Min (2) Month(1) Extremes Lowest (2) Temperature ( F) Lowest Month(1) Degree s (1) Base Temp 65 Heating Cooling 100 Number of s (3) Jan 56.4 43.6 50.0 77
Long-lead prediction of the 2015 fire and haze episode in Indonesia
 Long-lead prediction of the 2015 fire and haze episode in Indonesia Robert Field 1,2 Dilshad Shawki 3, Michael Tippett 2, Bambang Hero Saharjo 4, Israr Albar 5, Dwi Atmoko 6, Apostolos Voulgarakis 1 1.
Climatography of the United States No
 Climate Division: CA 7 NWS Call Sign: Month (1) Min (2) Month(1) Extremes Lowest (2) Temperature ( F) Lowest Month(1) Degree s (1) Base Temp 65 Heating Cooling 100 Number of s (3) Jan 54.4 36.9 45.7 77+
ICPAC. IGAD Climate Prediction and Applications Centre Monthly Bulletin, May 2017
 s` ICPAC Bulletin Issue June 2017 Issue Number: ICPAC/02/302 IGAD Climate Prediction and Applications Centre Monthly Bulletin, May 2017 For referencing within this bulletin, the Greater Horn of Africa
Mountain View Community Shuttle Monthly Operations Report
 Mountain View Community Shuttle Monthly Operations Report December 6, 2018 Contents Passengers per Day, Table...- 3 - Passengers per Day, Chart...- 3 - Ridership Year-To-Date...- 4 - Average Daily Ridership
JCOMM-CHy Coastal Inundation Forecasting Demonstration Project (CIFDP)
") WMO World Meteorological Organization Working together in weather, climate and water JCOMM-CHy Coastal Inundation Forecasting Demonstration Project (CIFDP) Coastal Flooding & Vulnerable Populations Coastal
WMO World Meteorological Organization Working together in weather, climate and water JCOMM-CHy Coastal Inundation Forecasting Demonstration Project (CIFDP) Coastal Flooding & Vulnerable Populations Coastal
Temporal Trends in Forest Fire Season Length
 Temporal Trends in Forest Fire Season Length Alisha Albert-Green aalbertg@sfu.ca Department of Statistics and Actuarial Science Simon Fraser University Stochastic Modelling of Forest Dynamics Webinar March
DROUGHT INDICES BEING USED FOR THE GREATER HORN OF AFRICA (GHA)
") DROUGHT INDICES BEING USED FOR THE GREATER HORN OF AFRICA (GHA) Christopher Oludhe IGAD Climate Prediction and Applications Centre (ICPAC) Inter-Regional Workshop on Indices and Early Warning Systems for
DROUGHT INDICES BEING USED FOR THE GREATER HORN OF AFRICA (GHA) Christopher Oludhe IGAD Climate Prediction and Applications Centre (ICPAC) Inter-Regional Workshop on Indices and Early Warning Systems for
COUNTRY REPORT THE SEVENTEENTH PERMANENT COMMITTEE ON GIS INFRASTRUCTURE FOR ASIA AND THE PACIFIC (PCGIAP) MEETING JULY 21 22, 2011,
 MEETING JULY 21 22, 2011,") COUNTRY REPORT INDONESIA ACTIVITIES IN 2010 THE SEVENTEENTH PERMANENT COMMITTEE ON GIS INFRASTRUCTURE FOR ASIA AND THE PACIFIC (PCGIAP) MEETING JULY 21 22, 2011, CHINGGIS KHAAN HOTEL, ULAANBAATAR CITY,
COUNTRY REPORT INDONESIA ACTIVITIES IN 2010 THE SEVENTEENTH PERMANENT COMMITTEE ON GIS INFRASTRUCTURE FOR ASIA AND THE PACIFIC (PCGIAP) MEETING JULY 21 22, 2011, CHINGGIS KHAAN HOTEL, ULAANBAATAR CITY,
Technical note on seasonal adjustment for M0
 Technical note on seasonal adjustment for M0 July 1, 2013 Contents 1 M0 2 2 Steps in the seasonal adjustment procedure 3 2.1 Pre-adjustment analysis............................... 3 2.2 Seasonal adjustment.................................