A lowering effect of Holocene changes in sea surface temperatures on the atmospheric CO 2 concentration
|
|
|
- Earl Carson
- 6 years ago
- Views:
Transcription
1 A lowering effect of Holocene changes in sea surface temperatures on the atmospheric CO 2 concentration Victor Brovkin 1,*, Jung-Hyun Kim 2, Matthias Hofmann 1, Ralph Schneider 3 1 Potsdam Institute for Climate Impact Research, P.O.Box , Potsdam, Germany 2 Netherlands Institute for Sea Research, P.O. Box 59, 1790 AB Den Burg, Texel, The Netherlands 3 Christian-Albrechts-Universität zu Kiel, Ludewig-Meyn-Straße 10, Kiel, Germany * corresponding author, Tel. +49(0) , Fax +49(0) , victor@pik-potsdam.de
2 ABSTRACT One of mechanisms proposed to explain about 20 ppmv increase in atmospheric CO 2 concentration from the early to late Holocene is a warming of the surface ocean that reduces CO 2 solubility [Indermühle et al., 1999]. Here we show that this hypothesis is not supported by both reconstructed and simulated changes in sea surface temperatures (SSTs). The reason is an inhomogeneous distribution of the SST changes across the globe during the course of Holocene. While alkenone-based SST reconstructions compiled in the GHOST database [Kim et al., 2004; Kim and Schneider, 2004] suggest a net warming of the surface ocean on a global scale by 0.2±0.2 C, both data and model results support significant cooling trend for the North Atlantic during the last 8,000 years. In response to reconstructed cooling of the North Atlantic by 1.1±0.2 C, zonally-averaged model of oceanic biogeochemistry simulates a drawdown of atmospheric CO 2 by 7±0.8 ppmv, while reconstructed warming of Pacific Ocean by 0.6±0.4 C counterbalances this effect by about 1 ppmv. On a global scale, this model simulates a lowering of atmospheric CO 2 from the Holocene to pre-industrial by 6±2 ppmv due to changes in SSTs, while more complex, three-dimensional biogeochemistry model indicates a moderate decrease by 1 ppmv after 300 years of the model integration. Our study suggests that changes in SSTs had altered atmospheric CO 2 in a direction opposite to the observed trend and that the other mechanisms were responsible for the CO 2 growth during the Holocene. 2
3 Introduction Understanding of carbon cycle in the past is a key for successful projection of atmospheric CO 2 dynamics in the future. What mechanisms have caused about 20 parts per million by volume (ppmv) increase in atmospheric CO 2 during the Holocene recorded in the Taylor Dome ice core [Indermühle et al., 1999]? An interest to this question is heated up by Ruddiman s [2003; 2005; 2006] hypothesis that this CO 2 growth manifests a beginning of profound influence of humans on climate. There are no doubts that anthropogenic land cover changes have started long before industrial era, but the magnitude of these changes and their climatic consequences is quite uncertain [Houghton et al., 1983; Klein Goldewijk, 2001; Brovkin et al., 2004; Olofsson and Hickler, in press]. Meanwhile, there is a rationale to check a need to invoke anthropogenic hypothesis by firstly testing hypotheses about natural forcings in the Holocene, especially ones that might be tested against available proxy data [Claussen et al., 2005; Crucifix et al., 2005; Broecker and Stocker, 2006; Schurgers et al., in press]. Several natural explanations for the Holocene CO 2 trend have been suggested, including release of terrestrial carbon and changes in SSTs [Indermühle et al., 1999], carbonate compensation in the ocean [Broecker et al., 1999a; Broecker and Clark, 2003], and coral reef growth [Ridgwell et al., 2003]. Here we focus on the effect of changes in SSTs on the atmospheric CO 2. Indermühle et al. [1999] applied inverse modeling and estimated an effect on global SST increase of 0.5 C on atmospheric CO 2 in 10 ppmv. Brovkin et al. [2002] have found no substantial effect of SSTs on the CO 2 in the Holocene simulations, while model results by Joos et al. [2004] suggest that up to one third of CO 2 growth during the Holocene could be caused by increasing SSTs. Wang et al. [2005] suggested some increase in CO 2 due to small increase in SSTs (0.2 C on a global scale) during the Holocene simulated by their climate model. The uncertainty in SSTs effect on CO 2 in simulations discussed above was caused by differences in physical and biogeochemical models, as well as boundary conditions. For example, Brovkin et al. [2002] have not accounted for cooling effect of Laurentide ice sheet on climate that completely disappeared only around 7,000 yr BP, while this factor was included in simulations by Joos et al. [2004] and Wang et al. [2005]. At the same time, an impulse response model of biogeochemistry applied by Joos et al. [2004] is driven by globally-averaged SSTs changes, while CLIMBER-2 model used by Brovkin et al. [2002] includes zonally-averaged model with 2.5 latitudinal resolution. The latter 3
4 model accounts for difference in precessional forcing between tropical and extratropical regions that is pronounced for the Holocene [Berger and Loutre, 2004]. Recently, Kim et al. [2004] reconstructed changes in SSTs during the Holocene based on alkenone biomarker. This analysis reveals a rather complex pattern of SSTs changes during the Holocene. North Atlantic sites have a pronounced trend towards cooling, while North Pacific and northern subtropical and tropical sites indicate warming trend. For the North Atlantic, their conclusions are in line with results by Marchal et al. [2002] on longterm cooling of the sea surface in the northeast Atlantic and Mediterranean during the Holocene. The assemblage of alkenone SST data in GHOST dataset [Kim and Schneider, 2004] provides globally-average changes in 0.2±0.2 C for the last 8,000 years (Fig. 1). Methods Are opposite trends in the North Atlantic and the tropics revealed in the proxy data supported by model simulations? If so, what is their effect on atmospheric CO 2 concentration? To address these questions, we have used two Earth system models developed in PIK. CLIMBER-2 model that includes interactive atmospheric and land surface modules, zonally-averaged model of ocean dynamics, and oceanic biogeochemistry [Petoukhov et al., 2000; Ganopolski et al., 2001; Brovkin et al., 2002] has been used for transient simulations through the Holocene and in the sensitivity analysis. More sophisticated model, CLIMBER-3α, consisting of interactive atmosphere, land surface, and 3-dimensional ocean model [Montoya et al., 2005] has been applied in sensitivity experiments to evaluate effect of reconstructed SSTs on atmospheric CO 2. CLIMBER-3α was coupled with the same type of NPZD model [Six and Maier-Reimer, 1996] as CLIMBER-2, however, in contrast to the latter, air-sea gas-exchange of CO 2 was treated as a quadratic function of the 10m height wind speed [Wanninkhof, 1992] provided by the NCEP climatology [Kalnay et al., 1996]. Since the CLIMBER-3α ocean model employs an advection scheme which is nearly free of numerical diffusion, it was used with low diapycnal background diffusivities of the order of 0.1 cm 2 s -1, notably within the permanent thermocline [Hofmann and Maqueda, 2006]. Results CLIMBER-2 transient simulation 4
5 In the transient simulation TRAN of climate from 8,000 yr BP to pre-industrial, CLIMBER-2 model has been driven by changes in orbital forcing [Berger and Loutre, 1991], ice sheet [Peltier, 1994; Joos et al., 2004], and observed atmospheric CO 2 concentration [Indermühle et al., 1999]. Initial state was achieved after 10,000 years of the model integration with boundary conditions for 8,000 yr BP. On a global scale, simulated SST increased from 8,000 yr BP to pre-industrial period by 0.1 C, most of this warming occurred from 8,000 to 7,000 yr BP in response to decay of the Laurentide ice sheet. During the later period, warming effect of increasing atmospheric CO 2 concentration counteracts cooling due to declining summer insolation in the northern high latitudes. In the high latitude regions, the biomarkers such as alkenones are proxies for temperature during the summer when organic production is taking place. In general, CLIMBER-2 shows changes in SSTs of a smaller scale than in the alkenone SST reconstructions. In the North Atlantic, simulated temperatures in August (mid-summer) in N region declines by 1 C, the most changes occurs during the period from 8,000 to 3,000 yr BP (Fig. 2, a). In latitudes N, a cooling trend is visible but amplitude of changes is smaller (from 0.2 C at 8,000 yr BP to -0.1 C at 3,000 yr BP). Data for marine core MD (59 N, 26 W) from the open ocean support an SSTs decrease by about 1.2 C from 8,000 to 3,500 yr BP and some tendency for later warming (Fig. 2a). In the tropical region of 0-10 N, the model simulates a warming trend in SST by about 0.1 C and 0.2 C for the Atlantic and the Pacific, respectively (Fig. 2b). In the other latitudes in zone 30 S to 30 N, SSTs behavior is similar (not shown). A marine core M (12 N, 61 W) from the Caribbean basin demonstrates warming of 0.7 C that is stronger than changes simulated by the model but goes in the same direction. Simulated SSTs in the North Atlantic decline during the Holocene, and this cooling trend is reversed towards warming in the tropical region. As already discussed by Marchal et al. [2002] and Lorenz et al. [2004] these trends could be explained by the orbital forcing, and an increase in atmospheric CO 2 concentration may play additional role that counterbalanced orbital forcing in the North Atlantic and amplified in the tropics. In the North Pacific, CLIMBER-2 simulations doesn t show a warming trend reconstructed from alkenone records by Kim et al. [2004]. This could be explained by both model and data limitation. First, CLIMBER-2 model doesn t simulate planetary waves and zonal oscillation patterns that might be responsible for Northeast Atlantic - Northeast Pacific dipole (see discussion below). Second, alkenone records analyzed by Kim et al. [2004] were collected for coastal regions that might be not fully representative for the open ocean areas. 5
6 Kim et al. [2004] suggested that a dipole in temperature changes between the Northeast Atlantic (cooling) and the Northeast Pacific (warming) could be caused by an interaction between positive Pacific North American (PNA) and negative North Atlantic Oscillation (NAO) phases of the atmospheric circulation. This hypothesis was supported by simulation of the ECHO-G model [Lorenz and Lohmann, 2004]. ECHO-G is a general circulation model that in particular simulates atmospheric planetary waves responsible for oscillation patterns and teleconnections, while CLIMBER-2 has a statistical-dynamical atmospheric module that simulates average atmospheric dynamics and neglects planetary waves. Therefore, the hypothesis on the suggested mechanism of teleconnection cannot be tested with CLIMBER-2 that simulates a cooling trend in the North Pacific similar to the North Atlantic. CLIMBER-2 simulations with SST forcing The SST changes presented on Fig. 1 are site-dependent while for using as a forcing in numerical experiments, they should be spatially and temporally aggregated. To account for the course resolution of the CLIMBER-2 model, the values were averaged over 10 latitudinal belts for Atlantic, Indian, and Pacific basins. Arctic region and Southern Ocean to the south of 30 S were excluded from the analysis because of the lack of data. The values for the other areas with absent data, e.g. the tropical Pacific, were taken from the adjusted neighboring sectors for the same basin. To correct for the seasonality in sensitivity simulations, we reduced a magnitude of SST changes for the Atlantic region N in accordance with ratio of summer to annual temperature changes in the transient simulation TRAN. Due to this seasonality adjustment, we assume that estimates of SST changes for the region and their effect on SST are conservative. Resulting SST changes with 95% confidence interval are listed in the Table 1. What is a consequence of reconstructed SSTs changes for the atmospheric CO 2? In the global simulation GLOB, changes in SSTs reported in the Table 1 were applied to the oceanic surface within CLIMBER-2 oceanic biogeochemical model while physical climate model components were driven by pre-industrial initial condition so that neither changes in SSTs nor CO 2 influence the climate. Atmospheric CO 2 was interactive between ocean and atmosphere and the model has been integrated for 2,000 years to achieve a new steady state. As a result, atmospheric CO 2 concentration was lowered by 6±2 ppmv. Assuming that circulation patterns and marine biology has not been changed substantially during the Holocene, this CO 2 decrease could be interpreted as an effect of 6
7 reconstructed SST trend on atmospheric CO 2 during the Holocene. To get deeper insight into effect of regional SSTs changes on CO 2, additional simulations have been performed in which SSTs were changed only in North Atlantic (30-80 N), North Pacific (30-60 N), Tropical Atlantic (30 S-30 N), and Tropical Pacific (30 S-30 N) realms. A spatial distribution of SST forcing averaged over realms and atmospheric CO 2 response is presented on Fig. 3 in schematic form. The model driven by SST changes for the North Atlantic realm reveals a decrease in atmospheric CO 2 by 7±0.8 ppmv. The SST changes in the other oceanic realms had much less pronounced effect on atmospheric CO 2 : the later has been increased by 0.3±0.2 and 0.4±0.2 ppmv in simulations for the North Pacific and the North Atlantic, respectively. An effect of SST changes in tropical Atlantic was insignificant (0±0.2 ppmv). This suggests that regarding effect on atmospheric CO 2, the cooling in the North Atlantic dominates over the warming in the other oceanic realms. Note that SSTs in the Southern Ocean were unchanged in the sensitivity simulations since data for this region are not available. CLIMBER-3α simulations with SST forcing CLIMBER-2 model possesses simplified, zonally-averaged oceanic module. How different its results are from a response of three-dimensional model? We performed simulation GLOB with CLIMBER-3α model. For comparison with CLIMBER-2, the SST forcing was kept in the same basin-averaged zonal form and mean SST values from the Table 1 were applied simultaneously to the all oceanic realms. After 1500 year spinup of the ocean physics, the oceanic biogeochemistry was switched on in CLIMBER-3α and integrated for the further 500 years. During this spinup, the atmospheric pco 2 rose to a level of ppmv, with an upward trend of about 0.25 ppmv per decade. The carbon cycle spinup was followed by a further integration over 300 years using the SST forcing applied in the carbon cycle model at the year 20 of the simulation. To account for the pco 2 drift, a 300 years control simulation without Holocene SST forcing was performed as well. A dynamics of difference in atmospheric CO 2 between the experiment and control is shown in Fig. 4. In response to the SST changes, the atmospheric CO 2 difference rose abruptly by 0.3 ppmv, presumably in response to a warming in the large Pacific and Indian basins, and then started to decline due to cooling in Atlantic. By the end of the experiment, the atmospheric CO 2 difference was 1 ppmv and continued to grow indicating a further possible decrease in the SST experiment. A spatial distribution of annual mean sea-surface CO 2 difference between sensitivity and control simulations at the end of integration (year 300) is shown in Fig. 5. While CO 2 in Pacific and Indian basins was increased by 5 to 15 ppmv, it has been decreased by 10 to 20 ppmv in the 7
8 North Atlantic, in particular in the regions where North Atlantic Deep Waters (NADW) are formed. The later explains why, although regions with CO 2 increase have larger area than areas with CO 2 decrease, the model reveals an averaged decrease in atmospheric CO 2, in line with CLIMBER-2 simulations. Although the amplitude of the increase of the annual mean sea-surface pco 2 over the Pacific- and Indian basin is much higher in the simulation using CLIMBER-3α than in CLIMBER-2, the global net effect in applying reconstructed SST anomalies is very small and tends in the same direction. Discussion and conclusions We have performed several additional tests with CLIMBER-2. The biogeochemistry model of CLIMBER-2 has a sensitivity of atmospheric CO 2 in 11 ppmv/ C for presentday circulation (neglecting changes in land carbon and carbonate compensation). This is close to the 9-10 ppmv/ C equilibrium sensitivity suggested by Bacastow [1996] and Archer et al. [2004]. A Harvardton-Bear Equilibration Index (HBEI) has been suggested to measure an effect of low latitudes on atmospheric CO 2. The index is a ratio of equilibrium changes to instantaneous changes in CO 2 after perturbation of the warm lowlatitude surface ocean. Broecker et al. [1999b] have showed that box models typically possess low values of HBEI ( ) that corresponds to a low significance of warm ocean for atmospheric CO 2 while three-dimensional models reveal higher values of the index ( ) that suggests a greater exchange between warm and cold waters than in the box model. To evaluate the HBEI, the CLIMBER-2 model performed 2,000 yrs simulation of a 6 C cooling of the surface ocean between 40 S and 40 N and calculating changes in the surface CO 2. The resulting HBEI value of 0.33 suggests that the CLIMBER-2 model, as a 2-dimensional model that explicitly simulated thermohaline circulation, is more similar to the 3-dimensional ocean general circulation models than to the box models. Broecker et al. [1999b] reported that Bern 2-D model that is similar to CLIMBER-2 has a HBEI value of 0.14, while Ridgwell [2001] has found a HBEI value of 0.39 for the similar 2-D model. As suggested by Ridgwell [2001], the representation of convective mixing is a primary factor responsible for the variability in values reported by Broecker et al. [1999b]. Transient Holocene simulations with CLIMBER-2 model suggested that the SSTs in the North Atlantic realm declined during the Holocene, and that this cooling trend was reversed towards warming in the tropical region. These results support the view by Marchal et al. [2002] and Kim et al. [2004] that the Holocene SST dynamics could be 8
9 explained by the orbital forcing changes, and an increase in atmospheric CO 2 concentration may play additional role that counterbalanced orbital forcing in northern temperate and subtropical latitudes (see comments above). In the North Pacific, CLIMBER-2 simulations do not reveal a warming trend observed in alkenone records. Presumably, a simplicity of atmospheric dynamics module prevents the model from simulation of a dipole in temperature changes between Atlantic and Pacific basins due to an interaction between positive PNA and negative NAO phases of the atmospheric circulation [Kim et al., 2004; Lorenz and Lohmann, 2004]. [Lorenz et al., 2006] argued that the warming in the tropics is due to the winter insolation increase in the tropics while the cooling in the North Atlantic is due to the summer insolation decrease. The increase of CO 2 might have increased SST everywhere. Therefore, a CO 2 -induced warming in the North Atlantic is overprinted by a stronger cooling by orbital forcing but amplified a warming in the tropics. The CO 2 lowering by 1 ppmv in CLIMBER-3α is much less than a decrease by 6±2 ppmv obtained in CLIMBER-2 simulations. One of the reasons for this difference is that 300 yrs simulation with CLIMBER-3α is not long enough to come to equilibrium with the new boundary conditions. In CLIMBER-2 simulations, the decrease in CO 2 after 300 years (3 ppmv) is only about a half of the equilibrium response after 2,000 years. The same temporal dynamics could be valid for CLIMBER-3α. As opposed to CLIMBER-2, CLIMBER-3α uses a variable air-sea gas-exchange parameterization [Wanninkhof, 1992] and low vertical diffusivities [Hofmann and Maqueda, 2006], which might also lead to a less sensitive model behaviour. Simulations of oceanic biogeochemistry with CLIMBER-2 and CLIMBER-3α models suggested that the Holocene SST changes reconstructed by Kim and Schneider [2004] led to a decrease in atmospheric CO 2. A difference in the magnitude of CO 2 decrease, 6±2 ppmv and 1 ppmv for CLIMBER-2 and CLIMBER-3α models respectively, could be explained by differences in model parameterization and simulation length. Our study suggests that changes in SSTs had altered atmospheric CO 2 in a direction opposite to the observed trend and that the other mechanisms, presumably related to the changes in carbonate chemistry, were responsible for the CO 2 increase during the Holocene. 9
10 References Archer, D., P. Martin, B. Buffett, V. Brovkin, S. Rahmstorf, and A. Ganopolski (2004), The importance of ocean temperature to global biogeochemistry, Earth and Planetary Science Letters, 222, Bacastow, R. B. (1996), The effect of temperature, change of the warm surface waters of the oceans on atmospheric CO2, Global Biogeochemical Cycles, 10, Berger, A., and M. F. Loutre (1991), Insolation Values for the Climate of the Last Years, Quaternary Science Reviews, 10, Berger, A., and M. F. Loutre (2004), Astronomical theory of climate change, Journal De Physique Iv, 121, Broecker, W., J. Lynch-Stieglitz, D. Archer, M. Hofmann, E. Maier-Reimer, O. Marchal, T. Stocker, and N. Gruber (1999b), How strong is the Harvardton-Bear constraint?, Global Biogeochemical Cycles, 13, Broecker, W. S., and E. Clark (2003), Holocene atmospheric CO2 increase as viewed from the seafloor, Global Biogeochemical Cycles, 17. Broecker, W. S., E. Clark, D. C. McCorkle, T. H. Peng, I. Hajdas, and G. Bonani (1999a), Evidence for a reduction in the carbonate ion content of the deep sea during the course of the Holocene, Paleoceanography, 14, Broecker, W. S., and T. F. Stocker (2006), The Holocene CO2 Rise: Anthropogenic or Natural?, Eos Trans. AGU, 87, 27. Brovkin, V., J. Bendtsen, M. Claussen, A. Ganopolski, C. Kubatzki, V. Petoukhov, and A. Andreev (2002), Carbon cycle, vegetation, and climate dynamics in the Holocene: Experiments with the CLIMBER-2 model, Global Biogeochemical Cycles, 16, 1139, doi: /2001gb Brovkin, V., S. Sitch, W. von Bloh, M. Claussen, E. Bauer, and W. Cramer (2004), Role of land cover changes for atmospheric CO2 increase and climate change during the last 150 years, Global Change Biology, 10, Claussen, M., V. Brovkin, R. Calov, A. Ganopolski, and C. Kubatzki (2005), Did humankind prevent a Holocene glaciation?, Climatic Change, 69, Crucifix, M., M. F. Loutre, and A. Berger (2005), Commentary on "The anthropogenic greenhouse era began thousands of years ago", Climatic Change, 69, Ganopolski, A., V. Petoukhov, S. Rahmstorf, V. Brovkin, M. Claussen, A. Eliseev, and C. Kubatzki (2001), CLIMBER-2: a climate system model of intermediate complexity. Part II: model sensitivity, Climate Dynamics, 17, Hofmann, M., and M. A. M. Maqueda (2006), Performance of a second-order moments advection scheme in an Ocean General Circulation Model, Journal of Geophysical Research-Oceans, 111. Houghton, R. A., J. E. Hobbie, J. M. Melillo, B. Moore, B. J. Peterson, G. R. Shaver, and G. M. Woodwell (1983), Changes in the Carbon Content of Terrestrial Biota and Soils between 1860 and a Net Release of Co2 to the Atmosphere, Ecological Monographs, 53, Indermühle, A., T. F. Stocker, F. Joos, H. Fischer, H. J. Smith, M. Wahlen, B. Deck, D. Mastroianni, J. Tschumi, T. Blunier, R. Meyer, and B. Stauffer (1999), Holocene 10
11 carbon-cycle dynamics based on CO2 trapped in ice at Taylor Dome, Antarctica, Nature, 398, Joos, F., S. Gerber, I. C. Prentice, B. L. Otto-Bliesner, and P. J. Valdes (2004), Transient simulations of Holocene atmospheric carbon dioxide and terrestrial carbon since the Last Glacial Maximum, Global Biogeochemical Cycles, 18. Kalnay, E., M. Kanamitsu, R. Kistler, W. Collins, D. Deaven, L. Gandin, M. Iredell, S. Saha, G. White, J. Woollen, Y. Zhu, M. Chelliah, W. Ebisuzaki, W. Higgins, J. Janowiak, K. C. Mo, C. Ropelewski, J. Wang, A. Leetmaa, R. Reynolds, R. Jenne, and D. Joseph (1996), The NCEP/NCAR 40-year reanalysis project, Bulletin of the American Meteorological Society, 77, Kim, J. H., N. Rimbu, S. J. Lorenz, G. Lohmann, S. I. Nam, S. Schouten, C. Ruhlemann, and R. R. Schneider (2004), North Pacific and North Atlantic sea-surface temperature variability during the Holocene, Quaternary Science Reviews, 23, Kim, J.-H., and R. R. Schneider (2004), GHOST global database for alkenone-derived Holocene sea-surface temperature records, Klein Goldewijk, K. (2001), Estimating global land use change over the past 300 years: The HYDE Database, Global Biogeochemical Cycles, 15, Lorenz, S. J., J. H. Kim, N. Rimbu, R. R. Schneider, and G. Lohmann (2006), Orbitally driven insolation forcing on Holocene climate trends: Evidence from alkenone data and climate modeling, Paleoceanography, 21, /2005PA Lorenz, S. J., and G. Lohmann (2004), Acceleration technique for Milankovitch type forcing in a coupled atmosphere-ocean circulation model: method and application for the holocene, Climate Dynamics, 23, Marchal, O., I. Cacho, T. F. Stocker, J. O. Grimalt, E. Calvo, B. Martrat, N. Shackleton, M. Vautravers, E. Cortijo, S. van Kreveld, C. Andersson, N. Koc, M. Chapman, L. Sbaffi, J. C. Duplessy, M. Sarnthein, J. L. Turon, J. Duprat, and E. Jansen (2002), Apparent long-term cooling of the sea surface in the northeast Atlantic and Mediterranean during the Holocene, Quaternary Science Reviews, 21, Montoya, M., A. Griesel, A. Levermann, J. Mignot, M. Hofmann, A. Ganopolski, and S. Rahmstorf (2005), The earth system model of intermediate complexity CLIMBER-3 alpha. Part 1: description and performance for present-day conditions, Climate Dynamics, 25, Olofsson, J., and T. Hickler (in press), Effects of human land-use on the global carbon cycle during the last 6000 years, Vegetation History and Archaeobotany. Peltier, W. R. (1994), Ice-Age Paleotopography, Science, 265, Petoukhov, V., A. Ganopolski, V. Brovkin, M. Claussen, A. Eliseev, C. Kubatzki, and S. Rahmstorf (2000), CLIMBER-2: a climate system model of intermediate complexity. Part I: model description and performance for present climate, Climate Dynamics, 16, Ridgwell, A. J., Glacial-interglacial perturbations in the global carbon cycle, Ph.D. thesis, Norwich, UK,2001, Ph.D. thesis, Univ. of East Anglia at Norwich, Norwich, UK,
12 Ridgwell, A. J., A. J. Watson, M. A. Maslin, and J. O. Kaplan (2003), Implications of coral reef buildup for the controls on atmospheric CO2 since the Last Glacial Maximum, Paleoceanography, 18. Ruddiman, W. F. (2003), The anthropogenic greenhouse era began thousands of years ago, Climatic Change, 61, Ruddiman, W. F. (2005), The early anthropogenic hypothesis a year later - An editorial reply, Climatic Change, 69, Ruddiman, W. F. (2006), On The Holocene CO2 Rise: Anthropogenic or Natural?" Eos Trans. AGU, 87, 352. Schurgers, G., U. Mikolajewicz, M. Gröger, E. Maier-Reimer, M. Vizcaíno, and A. Winguth (in press), Changes in terrestrial carbon storage during interglacials: a comparison between Eemian and Holocene, Climate of the Past. Six, K. D., and E. Maier-Reimer (1996), Effects of plankton dynamics on seasonal carbon fluxes in an ocean general circulation model, Global Biogeochemical Cycles, 10, Wang, Y., L. A. Mysak, and N. T. Roulet (2005), Holocene climate and carbon cycle dynamics: Experiments with the "green" McGill Paleoclimate Model, Global Biogeochemical Cycles, submitted. Wanninkhof, R. (1992), Relationship between Wind-Speed and Gas-Exchange over the Ocean, Journal of Geophysical Research-Oceans, 97,
13 Table 1. Changes in SSTs used to force the biogeochemistry models. GHOST data [Kim and Schneider, 2004], shown in Fig. 1, are seasonally adjusted for latitudes N in the Atlantic and substituted with nearest basin data in case no data is available for the latitudinal belt. SSTs changes in the Arctic basin and to the south of 30 S were neglected. The measurement error is for 95% confidence interval. Latitude SST, C Atlantic Indian Pacific N -1.3± N -1.5± N -1.4± ± N -0.9± ± N -0.8± ± N -0.9± ± ± N 0.2± ± ± N 0.2± ± ± S 0.2± ± ± S -0.2± ± ± S -0.2± ± ±0.1 13
14 Figure captions Fig. 1. The spatial distribution of linear trend in SST ( C/8,000 yr) reconstructed from the alkenone data [Kim and Schneider, 2004]. Blue and red color of labels indicates cooling and warming trends from 8,000 yr BP to pre-industrial, respectively. Fig. 2. Model-data comparison of SST changes ( C) through the Holocene relative to the pre-industrial period. Model results are from the transient CLIMBER-2 simulation: a) North Atlantic and b) Tropical Ocean. Fig. 3. A sketch showing an effect of SST changes in Table 1 on atmospheric CO 2 for different oceanic realms during the last 8,000 years obtained in CLIMBER-2 sensitivity simulations (see text for details). Fig. 4. A dynamics of difference in annual mean sea-surface CO 2 difference (ppmv) simulated by CLIMBER-3α in response to the SST changes. Shown is a difference between sensitivity and control simulations, the SST forcing was applied after first 20 simulation years. Fig. 5. Annual mean sea-surface CO 2 difference (ppmv) simulated by CLIMBER-3α in response to the SST changes in Table 1. Shown is a difference between sensitivity and control simulations after 300-yr integration. 14
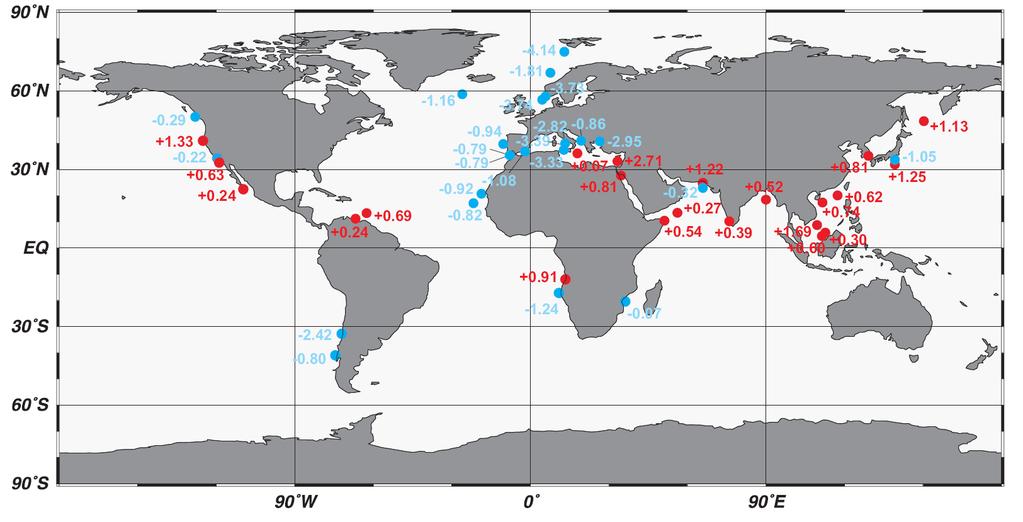
15 Figure 1
16 a) North Atlantic model,70-80 N, August model, N, summer model, N, summer data, MD data, trend SST, C b) yr BP Tropics model, 0-10 N, Atlantic model, 0-10 N, Pacific data, M trend, data -0.5 SST, C yr BP Figure 2

17 North Atlantic -1.1±0.2 C -7±0.8 ppm Tropical Atlantic -0.1±0.2 C 0±0.1 ppm North Pacific +0.6±0.5 C +0.3 ±0.2 ppm Tropical Pacific +0.6±0.3 C +0.4±0.2 ppm Southern Ocean? Figure 3
18 Figure 4
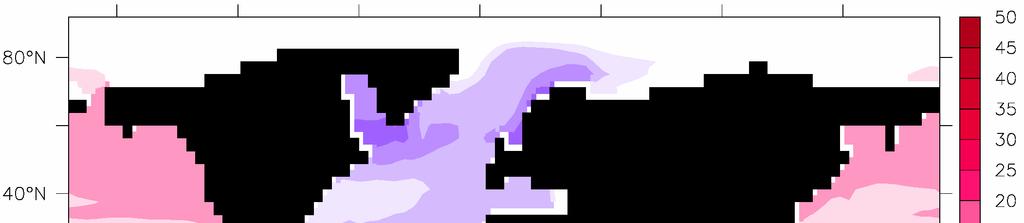
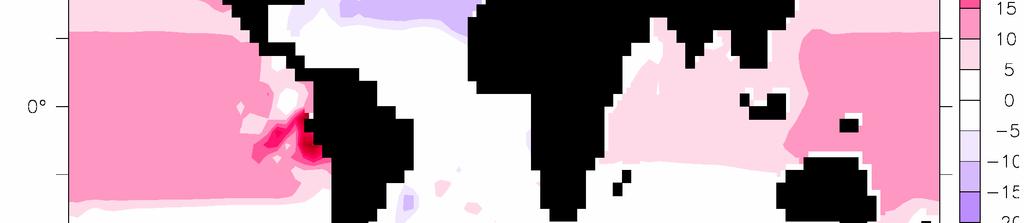
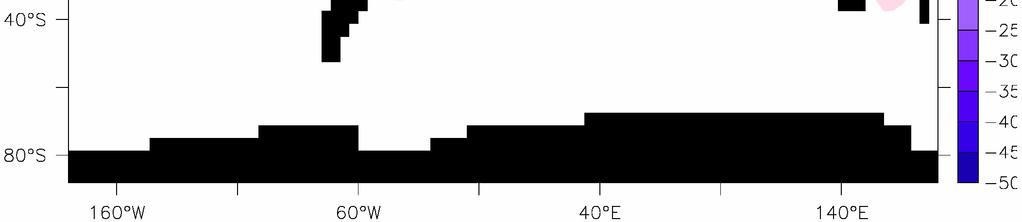
19 Figure 5
The Arctic Ocean's response to the NAM
 The Arctic Ocean's response to the NAM Gerd Krahmann and Martin Visbeck Lamont-Doherty Earth Observatory of Columbia University RT 9W, Palisades, NY 10964, USA Abstract The sea ice response of the Arctic
The North Atlantic Oscillation: Climatic Significance and Environmental Impact
 1 The North Atlantic Oscillation: Climatic Significance and Environmental Impact James W. Hurrell National Center for Atmospheric Research Climate and Global Dynamics Division, Climate Analysis Section
Land cover effect on climate
 Land cover effect on climate Martin Claussen Max Planck Institut for Meteorology KlimaCampus Hamburg CITES 2009 Land cover and climate dynamics Martin Claussen Max Planck Institut for Meteorology KlimaCampus
Simulation of Long-Term Future Climate Changes with the Green McGill Paleoclimate Model: The Next Glacial Inception
 1 FUTURE CLIMATE CHANGES Simulation of Long-Term Future Climate Changes with the Green McGill Paleoclimate Model: The Next Glacial Inception by Anne-Sophie B. Cochelin, Lawrence A. Mysak and Zhaomin Wang
Separation of atmosphere-ocean-vegetation feedbacks and synergies for mid-holocene climate
 GEOPHYSICAL RESEARCH LETTERS, VOL. 36, L09701, doi:10.1029/2009gl037482, 2009 Separation of atmosphere-ocean-vegetation feedbacks and synergies for mid-holocene climate J. Otto, 1,2 T. Raddatz, 1 M. Claussen,
Holocene carbon cycle dynamics
 GEOPHYSICAL RESEARCH LETTERS, VOL.???, XXXX, DOI:10.1029/, 1 Holocene carbon cycle dynamics Thomas Kleinen, 1 Victor Brovkin, 1,2 Werner von Bloh, 2 David Archer, 3 and Guy Munhoven 4 T. Kleinen, Max Planck
1. Introduction. 3. Climatology of Genesis Potential Index. Figure 1: Genesis potential index climatology annual
 C. ENSO AND GENESIS POTENTIAL INDEX IN REANALYSIS AND AGCMS Suzana J. Camargo, Kerry A. Emanuel, and Adam H. Sobel International Research Institute for Climate and Society, Columbia Earth Institute, Palisades,
When Did the Anthropocene Begin? Observations and Climate Model Simulations
 When Did the Anthropocene Begin? Observations and Climate Model Simulations by John Kutzbach University of Wisconsin-Madison March 31, 2011 Colleagues: W. Ruddiman, S. Vavrus, G. Philippon-Berrthier Main
SEASONAL ENVIRONMENTAL CONDITIONS RELATED TO HURRICANE ACTIVITY IN THE NORTHEAST PACIFIC BASIN
 SEASONAL ENVIRONMENTAL CONDITIONS RELATED TO HURRICANE ACTIVITY IN THE NORTHEAST PACIFIC BASIN Jennifer M. Collins Department of Geography and Geosciences Bloomsburg University Bloomsburg, PA 17815 jcollins@bloomu.edu
Jacob Schewe Potsdam Institute for Climate Impact Research. Ocean circulation under climate change: Examples of qualitative changes
 Jacob Schewe Potsdam Institute for Climate Impact Research Ocean circulation under climate change: Examples of qualitative changes Acknowledgments Anders Levermann Potsdam Institute for Climate Impact
SUPPLEMENTARY INFORMATION
 1. Simulation of Glacial Background Climate Globally averaged surface air is 3 K cooler than in the pre-industrial simulation. This is less than the 4-7 K cooling estimated for the Last Glacial Maximum
Transient simulations of Holocene atmospheric carbon dioxide and terrestrial carbon since the Last Glacial Maximum
 GLOBAL BIOGEOCHEMICAL CYCLES, VOL. 18,, doi:10.1029/2003gb002156, 2004 Transient simulations of Holocene atmospheric carbon dioxide and terrestrial carbon since the Last Glacial Maximum Fortunat Joos,
ATOC OUR CHANGING ENVIRONMENT
 ATOC 1060-002 OUR CHANGING ENVIRONMENT Class 22 (Chp 15, Chp 14 Pages 288-290) Objectives of Today s Class Chp 15 Global Warming, Part 1: Recent and Future Climate: Recent climate: The Holocene Climate
Ice on Earth: An overview and examples on physical properties
 Ice on Earth: An overview and examples on physical properties - Ice on Earth during the Pleistocene - Present-day polar and temperate ice masses - Transformation of snow to ice - Mass balance, ice deformation,
LETTERS. Influence of the Thermohaline Circulation on Projected Sea Level Rise
 VOLUME 13 JOURNAL OF CLIMATE 15 JUNE 2000 LETTERS Influence of the Thermohaline Circulation on Projected Sea Level Rise RETO KNUTTI AND THOMAS F. STOCKER Climate and Environmental Physics, Physics Institute,
Variability of the Northern Annular Mode s signature in winter sea ice concentration
 Variability of the Northern Annular Mode s signature in winter sea ice concentration Gerd Krahmann & Martin Visbeck Historical winter sea ice concentration data are used to examine the relation between
Chapter outline. Reference 12/13/2016
 Chapter 2. observation CC EST 5103 Climate Change Science Rezaul Karim Environmental Science & Technology Jessore University of science & Technology Chapter outline Temperature in the instrumental record
Welcome to ATMS 111 Global Warming.
 Welcome to ATMS 111 Global Warming http://www.atmos.washington.edu/2010q1/111 Isotopic Evidence 16 O isotopes "light 18 O isotopes "heavy" Evaporation favors light Rain favors heavy Cloud above ice is
TROPICAL-EXTRATROPICAL INTERACTIONS
 Notes of the tutorial lectures for the Natural Sciences part by Alice Grimm Fourth lecture TROPICAL-EXTRATROPICAL INTERACTIONS Anomalous tropical SST Anomalous convection Anomalous latent heat source Anomalous
Today s Climate in Perspective: Hendrick Avercamp ( ) ~1608; Rijksmuseum, Amsterdam
 ~1608; Rijksmuseum, Amsterdam") Today s Climate in Perspective: Paleoclimate Evidence Hendrick Avercamp (1585-1634) ~1608; Rijksmuseum, Amsterdam Observations Instrumental surface temperature records? (Le Treut et al., 2007 IPCC AR4
Today s Climate in Perspective: Paleoclimate Evidence Hendrick Avercamp (1585-1634) ~1608; Rijksmuseum, Amsterdam Observations Instrumental surface temperature records? (Le Treut et al., 2007 IPCC AR4
The first-order effect of Holocene Northern Peatlands on global carbon cycle dynamics
 University of New Hampshire University of New Hampshire Scholars' Repository Earth Sciences Scholarship Earth Sciences 2010 The first-order effect of Holocene Northern Peatlands on global carbon cycle
Speleothems and Climate Models
 Earth and Life Institute Georges Lemaître Centre for Earth and Climate Research Université catholique de Louvain, Belgium Speleothems and Climate Models Qiuzhen YIN Summer School on Speleothem Science,
lecture 11 El Niño/Southern Oscillation (ENSO) Part II
 Part II") lecture 11 El Niño/Southern Oscillation (ENSO) Part II SYSTEM MEMORY: OCEANIC WAVE PROPAGATION ASYMMETRY BETWEEN THE ATMOSPHERE AND OCEAN The atmosphere and ocean are not symmetrical in their responses
lecture 11 El Niño/Southern Oscillation (ENSO) Part II SYSTEM MEMORY: OCEANIC WAVE PROPAGATION ASYMMETRY BETWEEN THE ATMOSPHERE AND OCEAN The atmosphere and ocean are not symmetrical in their responses
Is the basin wide warming in the North Atlantic Ocean related to atmospheric carbon dioxide and global warming?
 Click Here for Full Article GEOPHYSICAL RESEARCH LETTERS, VOL. 37,, doi:10.1029/2010gl042743, 2010 Is the basin wide warming in the North Atlantic Ocean related to atmospheric carbon dioxide and global
MAR110 LECTURE #28 Climate Change I
 25 November 2007 MAR 110 Lec28 Climate Change I 1 MAR110 LECTURE #28 Climate Change I Figure 28.1 Climate Change Diagnostics Drought and flooding represent just a couple of hazards related to climate variability
ENIGMA: something that is mysterious, puzzling, or difficult to understand.
 Lecture 12. Attempts to solve the Eccentricity Enigma ENIGMA: something that is mysterious, puzzling, or difficult to understand. Milankovitch forcing glacier responses pre-900,000 yr BP glacier responses
Unusual North Atlantic temperature dipole during the winter of 2006/2007
 Unusual North Atlantic temperature dipole during the winter of 2006/2007 4 J. J.-M. Hirschi National Oceanography Centre, Southampton, United Kingdom Over most of western Europe and generally over the
DEVELOPMENT OF A DOWNSCALING MODEL FOR ESTIMATION OF AN 'ARTIFICIAL ICE CORE' DERIVED FROM LARGE SCALE PARAMETERS OF A 1000 YEAR GCM RUN
 PRACE GEOGRAFICZNE, zeszyt 107 Instytut Geografii UJ Krak6w 2000 Traute Criiger, Hans von Storch DEVELOPMENT OF A DOWNSCALING MODEL FOR ESTIMATION OF AN 'ARTIFICIAL ICE CORE' DERIVED FROM LARGE SCALE PARAMETERS
Development of the Global Environment
 Development of the Global Environment G302: Spring 2004 A course focused on exploration of changes in the Earth system through geological history Simon C. Brassell Geological Sciences simon@indiana.edu
Climate Changes: Past & Future (Ch 16) Iceberg 100km east of Dunedin, South Island, New Zealand, 2006
 Iceberg 100km east of Dunedin, South Island, New Zealand, 2006") Climate Changes: Past & Future (Ch 16) Climate change change in any statistical property of earth-atmosphere climate system in response to alteration of an external boundary condition or as an internal
Climate Changes: Past & Future (Ch 16) Climate change change in any statistical property of earth-atmosphere climate system in response to alteration of an external boundary condition or as an internal
THE EARLY ANTHROPOGENIC HYPOTHESIS A YEAR LATER An Editorial Reply. 1. Introduction
 THE EARLY ANTHROPOGENIC HYPOTHESIS A YEAR LATER An Editorial Reply WILLIAM F. RUDDIMAN Department of Environmental Sciences, University of Virginia, Charlottesville, VA 22904, USA E-mail: wfr5c@virginia.edu
lecture 12 Paleoclimate
 lecture 12 Paleoclimate OVERVIEW OF EARTH S CLIMATIC HISTORY Geologic time scales http://www.snowballearth.org/index.html Features of the climate during the Cretaceous period the land-sea distribution
A Seasonally Forced Ocean Atmosphere Model for Paleoclimate Studies
 15 MARCH 2001 SCHMITTNER AND STOCKER 1055 A Seasonally Forced Ocean Atmosphere Model for Paleoclimate Studies ANDREAS SCHMITTNER School of Earth and Ocean Sciences, University of Victoria, Victoria, British
RAPID TRANSITIONS OF THE THERMOHALINE OCEAN CIRCULATION
 Chapter 9 RAPID TRANSITIONS OF THE THERMOHALINE OCEAN CIRCULATION A Modelling Perspective Stefan Rahmstorf Potsdam Institute for Climate Impact Research PO Box 60 12 03, D-14412 Potsdam, Germany www.pik-potsdam.de/~stefan
Holocene carbon cycle dynamics
 Click Here for Full Article GEOPHYSICAL RESEARCH LETTERS, VOL. 37, L02705, doi:10.1029/2009gl041391, 2010 Holocene carbon cycle dynamics Thomas Kleinen, 1 Victor Brovkin, 1,2 Werner von Bloh, 2 David Archer,
Global ocean response to orbital forcing in the Holocene
 PALEOCEANOGRAPHY, VOL. 18, NO. 2, 1041, doi:10.1029/2002pa000819, 2003 Global ocean response to orbital forcing in the Holocene Z. Liu Center for Climatic Research, University of Wisconsin, Madison, Wisconsin,
Contents 1 Introduction 4 2 Examples of EOF-analyses SST in the tropical Atlantic SST in the tropical Indian Oc
 A Cautionary Note on the Interpretation of EOFs Dietmar Dommenget and Mojib Latif Max Planck Institut fur Meteorologie Bundesstr. 55, D-20146 Hamburg email: dommenget@dkrz.de submitted to J. Climate August
Orbital-Scale Interactions in the Climate System. Speaker:
 Orbital-Scale Interactions in the Climate System Speaker: Introduction First, many orbital-scale response are examined.then return to the problem of interactions between atmospheric CO 2 and the ice sheets
IPCC AR5 WG1 - Climate Change 2013: The Physical Science Basis. Nandini Ramesh
 IPCC AR5 WG1 - Climate Change 2013: The Physical Science Basis Nandini Ramesh Seminar in Atmospheric Science 21 st February, 2014 1. Introduc,on The ocean exchanges heat, freshwater, and C with the atmosphere.
An Introduction to Coupled Models of the Atmosphere Ocean System
 An Introduction to Coupled Models of the Atmosphere Ocean System Jonathon S. Wright jswright@tsinghua.edu.cn Atmosphere Ocean Coupling 1. Important to climate on a wide range of time scales Diurnal to
The Ice Age sequence in the Quaternary
 The Ice Age sequence in the Quaternary Subdivisions of the Quaternary Period System Series Stage Age (Ma) Holocene 0 0.0117 Tarantian (Upper) 0.0117 0.126 Quaternary Ionian (Middle) 0.126 0.781 Pleistocene
On the importance of initial conditions for simulations of the Mid-Holocene climate
 Clim. Past, 2, 91 97, 2006 Author(s) 2006. This work is licensed under a Creative Commons License. Climate of the Past On the importance of initial conditions for simulations of the Mid-Holocene climate
Ocean & climate: an introduction and paleoceanographic perspective
 Ocean & climate: an introduction and paleoceanographic perspective Edouard BARD Chaire de l évolution du climat et de l'océan du Collège de France CEREGE, UMR CNRS, AMU, IRD, CdF Aix-en-Provence The ocean
Analysis of the mid-latitude weather regimes in the 200-year control integration of the SINTEX model
 ANNALS OF GEOPHYSICS, VOL. 46, N. 1, February 2003 Analysis of the mid-latitude weather regimes in the 200-year control integration of the SINTEX model Susanna Corti ( 1 ), Silvio Gualdi ( 2 ) and Antonio
Final report for Project Dynamical downscaling for SEACI. Principal Investigator: John McGregor
 Final report for Project 1.3.6 1.3.6 Dynamical downscaling for SEACI Principal Investigator: John McGregor CSIRO Marine and Atmospheric Research, john.mcgregor@csiro.au, Tel: 03 9239 4400, Fax: 03 9239
Presentation A simple model of multiple climate regimes
 A simple model of multiple climate regimes Kerry Emanuel March 21, 2012 Overview 1. Introduction 2. Essential Climate Feedback Processes Ocean s Thermohaline Circulation, Large-Scale Circulation of the
MAR110 LECTURE #22 Climate Change
 MAR 110: Lecture 22 Outline Climate Change 1 MAR110 LECTURE #22 Climate Change Climate Change Diagnostics Drought and flooding represent just a couple of hazards related to climate variability (O) The
Dynamic sea level changes following changes in the thermohaline circulation
 Climate Dynamics (2005) 24: 347 354 DOI 10.1007/s00382-004-0505-y Anders Levermann Æ Alexa Griesel Matthias Hofmann Æ Marisa Montoya Stefan Rahmstorf Dynamic sea level changes following changes in the
Supplementary Figure 1. New downcore data from this study. Triangles represent the depth of radiocarbon dates. Error bars represent 2 standard error
 Supplementary Figure 1. New downcore data from this study. Triangles represent the depth of radiocarbon dates. Error bars represent 2 standard error of measurement (s.e.m.). 1 Supplementary Figure 2. Particle
Lecture 28: Observed Climate Variability and Change
 Lecture 28: Observed Climate Variability and Change 1. Introduction This chapter focuses on 6 questions - Has the climate warmed? Has the climate become wetter? Are the atmosphere/ocean circulations changing?
SUPPLEMENTARY INFORMATION
 SUPPLEMENTARY INFORMATION DOI: 10.1038/NCLIMATE1449 Multistability and critical thresholds of the Greenland ice sheet Alexander Robinson 1,2,3, Reinhard Calov 1 & Andrey Ganopolski 1 February 7, 2012 1
Sensitivity of the Last Glacial Inception to initial and surface conditions
 Sensitivity of the Last Glacial Inception to initial and surface conditions CLAUDIA KUBATZKI*, MARTIN CLAUSSEN, REINHARD CALOV, ANDREY GANOPOLSKI Potsdam Institute for Climate Impact Research, Potsdam,
M. Wary et al. Correspondence to: M. Wary
 Supplement of Clim. Past, 11, 1507 1525, 2015 http://www.clim-past.net/11/1507/2015/ doi:10.5194/cp-11-1507-2015-supplement Author(s) 2015. CC Attribution 3.0 License. Supplement of Stratification of surface
Lecture 8: Natural Climate Variability
 Lecture 8: Natural Climate Variability Extratropics: PNA, NAO, AM (aka. AO), SAM Tropics: MJO Coupled A-O Variability: ENSO Decadal Variability: PDO, AMO Unforced vs. Forced Variability We often distinguish
Variations in the Earth's Orbit: Pacemaker of the Ice Ages
 Variations in the Earth's Orbit: Pacemaker of the Ice Ages For 500,000 years, major climatic changes have followed variations in obliquity and precession. J. D. Hays, John Imbrie, N. J. Shackleton Science,
Lecture 5: Climate Changes and Variations
 Lecture 5: Climate Changes and Variations Climate Sensitivity and Feedback El Nino Southern Oscillation Pacific Decadal Oscillation North Atlantic Oscillation (Arctic Oscillation) Major Climate Feedback
The Pacemaker of the Chandler Wobble
 1 The Pacemaker of the Chandler Wobble Robert W. Grumbine, 1 Robert W. Grumbine, P.O.Box 1243, Greenbelt, MD, 20768, USA. (Robert.Grumbine@gmail.com) 1 Marine Modeling and Analysis Branch, Environmental
2/18/2013 Estimating Climate Sensitivity From Past Climates Outline
 Estimating Climate Sensitivity From Past Climates Outline Zero-dimensional model of climate system Climate sensitivity Climate feedbacks Forcings vs. feedbacks Paleocalibration vs. paleoclimate modeling
Natural Climate Variability: Longer Term
 Natural Climate Variability: Longer Term Natural Climate Change Today: Natural Climate Change-2: Ice Ages, and Deep Time Geologic Time Scale background: Need a system for talking about unimaginable lengths
Sensitivity of the Younger Dryas climate to changes in freshwater, orbital, and greenhouse gas forcing in CESM1.
 OCE-1536630 EAR-0903071 Sensitivity of the Younger Dryas climate to changes in freshwater, orbital, and greenhouse gas forcing in CESM1. The 21 st Annual CESM Workshop Paleoclimate Working Group Taylor
Lecture 1. Amplitude of the seasonal cycle in temperature
 Lecture 6 Lecture 1 Ocean circulation Forcing and large-scale features Amplitude of the seasonal cycle in temperature 1 Atmosphere and ocean heat transport Trenberth and Caron (2001) False-colour satellite
OCN/ATM/ESS 587. Ocean circulation, dynamics and thermodynamics.
 OCN/ATM/ESS 587 Ocean circulation, dynamics and thermodynamics. Equation of state for seawater General T/S properties of the upper ocean Heat balance of the upper ocean Upper ocean circulation Deep circulation
Land Surface Sea Ice Land Ice. (from Our Changing Planet)
") Lecture 5: Land Surface and Cryosphere (Outline) Land Surface Sea Ice Land Ice (from Our Changing Planet) Earth s s Climate System Solar forcing Atmosphere Ocean Land Solid Earth Energy, Water, and Biochemistry
Lecture 5: Land Surface and Cryosphere (Outline) Land Surface Sea Ice Land Ice (from Our Changing Planet) Earth s s Climate System Solar forcing Atmosphere Ocean Land Solid Earth Energy, Water, and Biochemistry
Sensitivity of the thermohaline circulation to tropical and high latitude freshwater forcing during the last glacial-interglacial cycle
 PALEOCEANOGRAPHY, VOL. 17, NO. 2, 1017, 10.1029/2000PA000591, 2002 Sensitivity of the thermohaline circulation to tropical and high latitude freshwater forcing during the last glacial-interglacial cycle
Paleoclimate indicators
 Paleoclimate indicators Rock types as indicators of climate Accumulation of significant thicknesses of limestone and reef-bearing limestone is restricted to ~20º + - equator Gowganda tillite, Ontario
Earth s Climate System. Surface Albedo. Climate Roles of Land Surface. Lecture 5: Land Surface and Cryosphere (Outline) Land Surface Sea Ice Land Ice
 Land Surface Sea Ice Land Ice") Lecture 5: Land Surface and Cryosphere (Outline) Earth s Climate System Solar forcing Land Surface Sea Ice Land Ice Atmosphere Ocean Land Solid Earth Energy, Water, and Biochemistry Cycles (from Our Changing
Lecture 5: Land Surface and Cryosphere (Outline) Earth s Climate System Solar forcing Land Surface Sea Ice Land Ice Atmosphere Ocean Land Solid Earth Energy, Water, and Biochemistry Cycles (from Our Changing
The ocean s overall role in climate
 The ocean s overall role in climate - moderates climate in time (diurnally, annually) - redistributes heat spatially in the largescale ocean circulation - lower albedo (sea ice higher albedo) - dry atmosphere
"Global Warming Beer" Taps Melted Arctic Ice (UPDATE)
") "Global Warming Beer" Taps Melted Arctic Ice (UPDATE) The brewery filed for bankruptcy in Aug 2008 The Greenland Brewhouse is the world's first Inuit microbrewery. The water, the brewers say, is the beer's
"Global Warming Beer" Taps Melted Arctic Ice (UPDATE) The brewery filed for bankruptcy in Aug 2008 The Greenland Brewhouse is the world's first Inuit microbrewery. The water, the brewers say, is the beer's
THE EFFECT OF INTERNAL VARIABILITY ON ANTHROPOGENIC CLIMATE PROJECTIONS
 THE EFFECT OF INTERNAL VARIABILITY ON ANTHROPOGENIC CLIMATE PROJECTIONS Asgeir Sorteberg Bjerknes Centre for Climate Research, University of Bergen, Norway Nils Gunnar Kvamstø Geophysical Institute, University
Glacial-Interglacial Cycling: Ice, orbital theory, and climate. Dr. Tracy M. Quan IMCS
 Glacial-Interglacial Cycling: Ice, orbital theory, and climate Dr. Tracy M. Quan IMCS quan@marine.rutgers.edu Outline -The past - discovery of glacial periods - introduction of orbital theory -The present
The Interdecadal Variation of the Western Pacific Subtropical High as Measured by 500 hpa Eddy Geopotential Height
 ATMOSPHERIC AND OCEANIC SCIENCE LETTERS, 2015, VOL. 8, NO. 6, 371 375 The Interdecadal Variation of the Western Pacific Subtropical High as Measured by 500 hpa Eddy Geopotential Height HUANG Yan-Yan and
The Tswaing Impact Crater, South Africa: derivation of a long terrestrial rainfall record for the southern mid-latitudes
 The Tswaing Impact Crater, South Africa: derivation of a long terrestrial rainfall record for the southern mid-latitudes T.C. PARTRIDGE Climatology Research Group, University of the Witwatersrand, Johannesburg,
The increase of snowfall in Northeast China after the mid 1980s
 Article Atmospheric Science doi: 10.1007/s11434-012-5508-1 The increase of snowfall in Northeast China after the mid 1980s WANG HuiJun 1,2* & HE ShengPing 1,2,3 1 Nansen-Zhu International Research Center,
North Pacific Climate Overview N. Bond (UW/JISAO), J. Overland (NOAA/PMEL) Contact: Last updated: September 2008
, J. Overland (NOAA/PMEL) Contact: Last updated: September 2008") North Pacific Climate Overview N. Bond (UW/JISAO), J. Overland (NOAA/PMEL) Contact: Nicholas.Bond@noaa.gov Last updated: September 2008 Summary. The North Pacific atmosphere-ocean system from fall 2007
North Pacific Climate Overview N. Bond (UW/JISAO), J. Overland (NOAA/PMEL) Contact: Nicholas.Bond@noaa.gov Last updated: September 2008 Summary. The North Pacific atmosphere-ocean system from fall 2007
Glacial abrupt climate changes and Dansgaard-Oeschger oscillations in a coupled climate model
 PALEOCEANOGRAPHY, VOL. 21,, doi:10.1029/2005pa001238, 2006 Glacial abrupt climate changes and Dansgaard-Oeschger oscillations in a coupled climate model Zhaomin Wang 1,2 and Lawrence A. Mysak 1 Received
SUPPLEMENTARY INFORMATION
 SUPPLEMENTARY INFORMATION DOI: 1.138/NGEO168 "Strength and geometry of the glacial Atlantic Meridional Overturning Circulation" S2 Map of core locations Core locations of the Holocene and LGM 231 / 23
Rapid Climate Change: Heinrich/Bolling- Allerod Events and the Thermohaline Circulation. By: Andy Lesage April 13, 2010 Atmos.
 Rapid Climate Change: Heinrich/Bolling- Allerod Events and the Thermohaline Circulation By: Andy Lesage April 13, 2010 Atmos. 6030 Outline Background Heinrich Event I/Bolling-Allerod Transition (Liu et
The climate of the mid-holocene
 Chapter 6 The climate of the mid-holocene 6.1 Introduction The climate of the mid-holocene (6,000 years BP) has frequently been used to evaluate the ability of climate models to simulate climatic change.
Tropical Pacific responses to Neogene Andean uplift and highlatitude. Ran Feng and Chris Poulsen University of Michigan
 Tropical Pacific responses to Neogene Andean uplift and highlatitude sea ice expansion Ran Feng and Chris Poulsen University of Michigan Reconstructions of Neogene equatorial Pacific SSTs SST difference
NORTH ATLANTIC DECADAL-TO- MULTIDECADAL VARIABILITY - MECHANISMS AND PREDICTABILITY
 NORTH ATLANTIC DECADAL-TO- MULTIDECADAL VARIABILITY - MECHANISMS AND PREDICTABILITY Noel Keenlyside Geophysical Institute, University of Bergen Jin Ba, Jennifer Mecking, and Nour-Eddine Omrani NTU International
Variations of total heat flux during typhoons in the South China Sea
 78 Variations of total heat flux during typhoons in the South China Sea Wan Ruslan Ismail 1, and Tahereh Haghroosta 2,* 1 Section of Geography, School of Humanities, Universiti Sains Malaysia, 11800 Minden,
3. Carbon Dioxide (CO 2 )
") 3. Carbon Dioxide (CO 2 ) Basic information on CO 2 with regard to environmental issues Carbon dioxide (CO 2 ) is a significant greenhouse gas that has strong absorption bands in the infrared region and
3. Carbon Dioxide (CO 2 ) Basic information on CO 2 with regard to environmental issues Carbon dioxide (CO 2 ) is a significant greenhouse gas that has strong absorption bands in the infrared region and
Natural and anthropogenic climate change Lessons from ice cores
 Natural and anthropogenic climate change Lessons from ice cores Eric Wolff British Antarctic Survey, Cambridge ewwo@bas.ac.uk ASE Annual Conference 2011; ESTA/ESEU lecture Outline What is British Antarctic
The Formation of Precipitation Anomaly Patterns during the Developing and Decaying Phases of ENSO
 ATMOSPHERIC AND OCEANIC SCIENCE LETTERS, 2010, VOL. 3, NO. 1, 25 30 The Formation of Precipitation Anomaly Patterns during the Developing and Decaying Phases of ENSO HU Kai-Ming and HUANG Gang State Key
Orbitally driven insolation forcing on Holocene climate trends: Evidence from alkenone data and climate modeling
 PALEOCEANOGRAPHY, VOL. 21,, doi:10.1029/2005pa001152, 2006 Orbitally driven insolation forcing on Holocene climate trends: Evidence from alkenone data and climate modeling Stephan J. Lorenz, 1,2 Jung-Hyun
Ocean Constraints on the Atmospheric Inverse Problem: The contribution of Forward and Inverse Models
 Ocean Constraints on the Atmospheric Inverse Problem: The contribution of Forward and Inverse Models Nicolas Gruber Institute of Geophysics and Planetary Physics & Department of Atmospheric Sciences, University
Chapter 15 Millennial Oscillations in Climate
 Chapter 15 Millennial Oscillations in Climate This chapter includes millennial oscillations during glaciations, millennial oscillations during the last 8000 years, causes of millennial-scale oscillations,
Pleistocene Glaciations
 Chapter 14 Pleistocene Glaciations I. Geologic evidence 1. glacial deposits, etc. Pleistocene Glaciations 2. The Oxygen Isotope Record (1970s) II. Explanation of the glacial-interglacial periods The Milankovitch
Model equations for planetary and synoptic scale atmospheric motions associated with different background stratification
 Model equations for planetary and synoptic scale atmospheric motions associated with different background stratification Stamen Dolaptchiev & Rupert Klein Potsdam Institute for Climate Impact Research
Patterns and impacts of ocean warming and heat uptake
 Patterns and impacts of ocean warming and heat uptake Shang-Ping Xie Scripps Inst of Oceanography, UCSD Ocean warming & circulation change Ocean heat uptake & meridional overturning circulation Global
Supplementary Figure 1 Trends of annual mean maximum ocean mixed layer depth. Trends from uninitialized simulations (a) and assimilation simulation
 and assimilation simulation") Supplementary Figure 1 Trends of annual mean maximum ocean mixed layer depth. Trends from uninitialized simulations (a) and assimilation simulation (b) from 1970-1995 (units: m yr -1 ). The dots show grids
Supplementary Figure 1 Trends of annual mean maximum ocean mixed layer depth. Trends from uninitialized simulations (a) and assimilation simulation (b) from 1970-1995 (units: m yr -1 ). The dots show grids
Antarctic Sea Ice: Mean state and variability in CCSM control run. Laura Landrum, Marika Holland, Dave Schneider, Elizabeth Hunke
 Antarctic Sea Ice: Mean state and variability in CCSM4 1850 control run Laura Landrum, Marika Holland, Dave Schneider, Elizabeth Hunke Overview Model years and variables Mean state and some comparisons
Interhemispheric climate connections: What can the atmosphere do?
 Interhemispheric climate connections: What can the atmosphere do? Raymond T. Pierrehumbert The University of Chicago 1 Uncertain feedbacks plague estimates of climate sensitivity 2 Water Vapor Models agree
Climate Change 2007: The Physical Science Basis
 Climate Change 2007: The Physical Science Basis Working Group I Contribution to the IPCC Fourth Assessment Report Presented by R.K. Pachauri, IPCC Chair and Bubu Jallow, WG 1 Vice Chair Nairobi, 6 February
Lake Levels and Climate Change in Maine and Eastern North America during the last 12,000 years
 Maine Geologic Facts and Localities December, 2000 Lake Levels and Climate Change in Maine and Eastern North America during the last 12,000 years Text by Robert A. Johnston, Department of Agriculture,
Potential Impact of climate change and variability on the Intra-Americas Sea (IAS)
") Potential Impact of climate change and variability on the Intra-Americas Sea (IAS) Sang-Ki Lee 1, Yanyun Liu 1 and Barbara Muhling 2 1 CIMAS-University of Miami and AOML-NOAA 2 Princeton University and
Potential Impact of climate change and variability on the Intra-Americas Sea (IAS) Sang-Ki Lee 1, Yanyun Liu 1 and Barbara Muhling 2 1 CIMAS-University of Miami and AOML-NOAA 2 Princeton University and
1. Introduction 2. Ocean circulation a) Temperature, salinity, density b) Thermohaline circulation c) Wind-driven surface currents d) Circulation and
 Temperature, salinity, density b) Thermohaline circulation c) Wind-driven surface currents d) Circulation and") 1. Introduction 2. Ocean circulation a) Temperature, salinity, density b) Thermohaline circulation c) Wind-driven surface currents d) Circulation and climate change e) Oceanic water residence times 3.
1. Introduction 2. Ocean circulation a) Temperature, salinity, density b) Thermohaline circulation c) Wind-driven surface currents d) Circulation and climate change e) Oceanic water residence times 3.
The Arctic Oscillation (AO) or Northern Annular Mode (NAM)
 or Northern Annular Mode (NAM)") The Arctic Oscillation (AO) or Northern Annular Mode (NAM) Required reading for Thursday, Oct.14: -Kerr, R.A., 1999: A new force in high-latitude climate. Science, 284, 5412, 241-242. -Thompson DWJ, Wallace
The Arctic Oscillation (AO) or Northern Annular Mode (NAM) Required reading for Thursday, Oct.14: -Kerr, R.A., 1999: A new force in high-latitude climate. Science, 284, 5412, 241-242. -Thompson DWJ, Wallace
Modelling carbon cycle feedbacks during abrupt climate change
 ARTICLE IN PRESS Quaternary Science Reviews 23 (24) 431 448 Modelling carbon cycle feedbacks during abrupt climate change Tracy L. Ewen a, *, Andrew J. Weaver a, Andreas Schmittner b a Department of Earth
What We ve Learned from the AMOC Modeling Efforts about AMOC Processes and its Role in Weather and Climate
 What We ve Learned from the AMOC Modeling Efforts about AMOC Processes and its Role in Weather and Climate Rong Zhang GFDL/NOAA POS/PSMI Joint Breakout Session 2017 US CLIVAR Summit Baltimore, August 9,