Seismological Constraints on Structure and Flow Patterns Within the Mantle Wedge
|
|
|
- Rolf Morrison
- 6 years ago
- Views:
Transcription
1 Seismological Constraints on Structure and Flow Patterns Within the Mantle Wedge Douglas A. Wiens and Gideon P. Smith Department of Earth and Planetary Sciences, Washington University, St. Louis, Missouri The mantle wedge of a subduction zone is characterized by low seismic velocities and high attenuation, indicative of temperatures approaching the solidus and the possible presence of melt and volatiles. Tomographic images show a low velocity region above the slab extending from 150 km depth up to the volcanic front. The low velocities result at least partially from volatiles fluxed off the slab, which lower the solidus and thus raise the homologous temperature of the wedge material. Subduction zones with active back-arc spreading centers also show large low velocity and high attenuation seismic anomalies beneath the backarc basin, indicating that a broad zone of magma production feeds the backarc spreading center. The magnitude of the velocity anomaly is consistent with the presence of approximately 1% partial melt at depths of km. The best-imaged arc-backarc system, the Tonga-Lau region, suggests that the zone of backarc magma production is separated from the island arc source region within the depth range of primary magma production. However, the anomalies merge at depths greater than 100 km, suggesting that small slab components of backarc magmas may originate through interactions at these depths. Slow velocities extend to 400 km depth beneath backarc basins, and these deep anomalies may result from the release of volatiles transported to the top of the transition zone by hydrous minerals in the slab. Observations of seismic anisotropy can provide direct evidence for the flow pattern in the mantle wedge. Slab parallel fast directions suggesting along-arc flow within the mantle wedge are found in most, but not all, subduction zones. The Tonga-Lau region shows a complex pattern of fast directions, with along-strike fast directions beneath the Tonga island arc and convergence-parallel fast directions to the west of the Lau backarc spreading center. The pattern of flow in the Lau backarc is consistent with southward mantle flow inferred from geochemical data. Geodynamic modeling suggests several possible mechanisms of flow within the mantle wedge, which may help explain the diverse observations. Viscous coupling between the backarc flow and the downgoing plate should produce induced flow within the backarc, with flow directions parallel to the convergence direction. In contrast, subduction zone rollback may produce along-arc flow. This latter model matches the observations in most subduction zones suggesting that viscous coupling does not exert a strong control on the flow pattern in the mantle wedge. 1. INTRODUCTION The mantle wedge is the locus of the most important processes in the subduction factory, including island arc magmatism and back-arc spreading. Seismological studies can place observational constraints on the source regions and transport paths of the magmas and fluids that represent the output of the subduction factory. Seismic velocity
2 2 and attenuation anomalies are functions of mantle composition (including volatiles), temperature, and melt content. Therefore, accurate mapping of seismological anomalies can help constrain the spatial distribution of temperature anomalies and melt transport paths within the wedge. In addition, the seismic anisotropy of mantle materials is a function of the strain field, which results from the flow pattern. Therefore seismic anisotropy measurements also place constraints on the mantle flow pattern within the wedge. Thus seismological observations will provide key observational constraints necessary for construction of physically realistic geodynamic models of processes in the mantle wedge. In this paper, we first review the seismological observables and their relationship to physical parameters such as temperature and melt content. We will then present a status report on progress that has been made in constraining subduction processes in the mantle wedge using seismology. 2. RELATIONSHIP OF SEISMIC OBSERVABLES TO PHYSICAL PROPERTIES 2.1 P and S Wave Velocities Effect of temperature. The relationship between P and S wave velocities and temperature can be decomposed into anharmonic and anelastic effects [Karato, 1993], where anelastic effects result from velocity dispersion due to attenuation [Aki and Richards, 1980]. The anharmonic variation of P (V p ) and S (V s ) velocity with temperature (T) for mantle materials is relatively well known from laboratory experiments at ultrasonic frequencies. Single crystal laboratory experiments suggest values of about x 10-4 K -1 for lnv p / T and x 10-4 K -1 for lnv s / T for olivine at upper mantle pressures and temperatures [Anderson et al., 1992; Isaak, 1992]. The anelastic effects on the seismic velocity are sometimes neglected, but are actually important for the mantle wedge, where attenuation may be large. In an anelastic medium with frequency-independent attenuation (Q -1 ), the seismic velocity shows dispersion as given by Kanamori and Anderson [1977] and Karato [1993] V(ω,T) = V 0 (T) [1 + (Q -1 /π) ln ωτ(t)] (1) where ω is frequency, V 0 (T) is the anharmonic velocity, which is frequency independent, and τ(t) is the relaxation time. Table 1, from Karato [1993], shows the effect of attenuation on the effective temperature derivatives of the P and S velocity. Studies of the attenuation structure of the mantle wedge suggest P wave Q (Q P ) values of and S wave Q (Q S ) values of , with some variation caused by the
3 3 frequency dependence of attenuation [Sekiguchi, 1991; Flanagan and Wiens, 1994; Flanagan and Wiens, 1998; Roth et al., 1999; Tsumura et al., 2000]. Therefore, the anelastic effect is about as large as that solely due to the anharmonic derivatives (table 1). Assuming a Q P of 130 and a Q S of 75, with a Q P /Q S ratio of 1.75 as observed [Roth et al., 1999] and typical upper mantle seismic velocities, results in velocity derivatives of 1.0 ms -1 / K for Vp/ T and 0.8 ms -1 / K for Vs/ T. So a change of 100 C would produce changes in P and S velocity of 0.10 and 0.08 km/s respectively, or about 1.2% for P waves and 1.8% for S waves. The ratio of S to P wave anomalies can be diagnostic of the physical process causing the velocity anomalies [Hales and Doyle, 1967; Koper et al., 1999]. The parameter ν = lnvs/ lnvp, giving the fractional change in V S relative to the fractional change in Vp, is often used to describe the S to P anomaly ratio. For temperature changes, ν is generally about 1.2 for rocks of mantle composition [Kern and Richter, 1981]. Including velocity dispersion caused by attenuation gives a ν of about 1.4 for anomalies caused by temperature effects [Koper et al., 1999] Effect of melt fraction. It is widely recognized that partial melt can have a major effect on seismic velocities. Partial melt forms in pockets that assume a shape that minimizes the total free energy of the grain boundary and melt interfaces. The effect of melt on seismic velocities depends on the geometry of the melt pockets as well as the melt fraction. Our knowledge of the effect of partial melt comes from both laboratory experiments and analytical calculations of the mechanical response of material with melt-filled inclusions. Unfortunately, experiments to determine the velocity at seismic frequencies in the presence of partial melt and at the pressure and temperature of the upper mantle are difficult and have not been carried out. Ultrasonic experiments on peridotite at high pressure and temperature suggest that there is no discontinuous change in either P or S velocity at the solidus [Sato et al., 1989a]. P and S waves show similar behavior and a rapid drop in velocity is observed only if the melt fraction becomes larger than about 2%, after which the velocity decreased by about 2% for every 1% of partial melt. The effect of pressure can be accounted for by using the homologous temperature (normalizing the temperature by the solidus temperature). Since these results were obtained at ultrasonic frequencies they are unlikely to adequately represent the anelastic components of the velocity variations. Analytical studies have generally calculated the mechanical response of melt inclusions assuming idealized shapes, including cracks [O'Connell and Budianski, 1974], tubes [Mavko, 1980], and ellipsoids [Schmeling, 1985].
4 4 Melt distributed along thin films or cracks has a large effect on the shear modulus, thus reducing the S-wave velocity with relatively small partial melt, whereas melt distributed in spheroidal inclusions shows smaller effects. An alternative methodology for calculating the mechanical response based on grain-boundary contiguity [Takei, 1998] has also recently been developed and tested using analog materials [Takei, 2000]. Recently, Hammond and Humphreys [2000b] used a finite element method to calculate the effect of melt on the shear and bulk modulus. They based their calculation on images of the melt geometry from laboratory experiments, which suggest that at small melt fractions (<1%) melt is distributed in triple junction tubules, but begins to form films at higher melt fraction [Waff and Faul, 1992; Faul et al., 1994]. The Hammond and Humphreys [2000b] model (Figure 1) shows only small reductions in velocity for less than 1% partial melt, as melt is contained in tubules, but the velocity reduction becomes large for larger melt fractions where melt forms films. The total velocity reduction for a melt fraction of 2% relative to a reference temperature of 1000 C is 22% for S waves and 11% for P waves. The effect of larger melt fractions is much greater for S waves than for P waves, such that ν = lnvs/ lnvp = 2.2 for anomalies caused by melt. These results suggest that seismic anomalies caused by melt fractions smaller than 1% may be difficult to distinguish seismologically from the effects of temperature, but larger melt fractions should be easily detectable from the large amplitude seismic anomalies and the large S to P anomaly ratio (ν) Effect of composition and volatile content. The effects of mineral composition on seismic observables are generally thought to be smaller than the effects of temperature heterogeneity and partial melt in the upper mantle [Sobolev et al., 1996; Goes et al., 2000]. For example, observed P-wave velocities for a variety of peridotites from the continental upper mantle show relatively small variations (< 2%) despite significant variations in modal composition [Sobolev et al., 1996]. Strong variations in the Mg/(Mg+Fe) ratio, however, will have a significant effect on the seismic velocity [Akimoto, 1972; Jordan, 1979]. In particular, highly depleted harzburgites may be characterized by seismic velocities that are higher by ~2% when compared to undepleted peridotites [Jordan, 1979] There is some evidence that differences in volatile content can produce major variations in the seismic velocity. The presence of relatively small concentrations of dissolved water has been shown to lower the solidus of olivine and weaken olivine aggregates by several orders of magnitude [Karato et al., 1986; Hirth and Kohlstedt, 1995]. Hirth and Kohlstedt [1996], Karato and Jung [1998], and Karato [2002] (this volume) suggest that the
5 5 weakening effects of water will lower the seismic velocity by increasing seismic attenuation, thus reducing the observed seismic velocity as in equation 1 above. Simple calculations suggest that the shear wave velocity may be lowered as much as 6% by modest amounts of water, and Gaherty et al. [1996] suggest that the low velocity zone may result from the water content of the asthenosphere beneath the water-depleted lithospheric lid. The effects of water, high temperatures, and partial melt all can substantially reduce seismic velocity and are difficult to distinguish when using seismic velocity measurements alone. 2.2 Seismic Attenuation Effect of temperature. Seismic attenuation (Q -1 ) is a measure of the decay of the seismic wave amplitude due to absorption of energy by an anelastic medium. A variety of experiments show that seismic attenuation is a strong function of temperature, particularly for temperatures near the solidus [Berckhemer et al., 1982; Sato et al., 1989b; Karato and Spetzler, 1990; Jackson et al., 1992; Gribb and Cooper, 1998; Jackson, 2000]. Experiments on dunite at high temperatures suggest an S wave attenuation relationship at 1 Hz frequency [Jackson et al., 1992] Q β -1 (T) = 5 x 10 5 exp [(-201 kj/mol)/rt] (2) Using this relationship, the S wave attenuation (Q β -1 ) increases by more than an order of magnitude between temperatures of 1000 C and 1200 C. The pressure sensitivity of this relationship is not known, but there is evidence that the effect of pressure can be accounted for by using the homologous temperature (i.e. normalizing the temperature by the solidus temperature) [Sato et al., 1989b; Getting et al., 1997]. If all the attenuation were associated with the shear modulus, the ratio of Q α /Q β would be 2.25 for a Poisson solid, and about 2.45 for observed upper mantle elasticities [Anderson et al, 1965]. In contrast, if equal amounts of attenuation were associated with shear and compression, the ratio would be 1. The ratio of Q α /Q β is generally assumed to be in the range of based on both experiments and seismic observations, with one recent observational study suggesting 1.75 for the Tonga mantle wedge [Roth et al., 1999] Effect of melt fraction. The effect of melt on seismic attenuation has been approached with both experimental and analytical methods. Experiments suggest that there is little intrinsic increase in attenuation due to small quantities (less than about 5%) of partial melt [Berckhemer et al., 1982; Gribb and Cooper, 2000]. This is in agreement with analytical calculations that have
6 6 investigated possible melt-related attenuation mechanisms, including viscous shear relaxation of the melt, melt squirt, and melt-enhanced grain boundary sliding. In each case, the major relaxation effects of these processes occur well outside the seismic frequency band, suggesting that small amounts of partial melting have little effect on seismic attenuation [Schmeling, 1985; Hammond and Humphreys, 2000a] Effect of volatile content, composition, and grain size. The presence of even small amounts of water enhances anelasticity [Karato and Jung, 1998; Karato, this volume]. Thus suggests that attenuation is a strong function of volatile content. It is usually assumed that attenuation is such a strong function of temperature and volatile content that other compositional effects are clearly secondary. Several studies have suggested that attenuation is a function of homologous temperature [Sato et al., 1989b; Getting et al., 1997]. Materials of different solidus temperatures must show different attenuation at a particular temperature, and normalization by the solidus temperature may allow approximate correction for different mineral composition [Getting et al., 1997]. There is also evidence that attenuation is a function of grain size, with smaller grains showing greater attenuation [Gribb and Cooper, 1998; Jackson, 2000]. However, graingrain size variation may play a smaller role in mantle attenuation variation than in the laboratory due to the large graingrain size of mantle ultramafic rocks [Jackson, 2000] Identifying partial melt. Table 2 provides a qualitative analysis of the relative effect of various factors on the seismic observables in the upper mantle. Because temperature anomalies, volatiles, and small amounts of partial melt can produce similar seismic observations, it is often difficult to definitively associate observed anomalies with a particular cause. However, the simultaneous mapping of several different seismic observables offers a greater opportunity to distinguish between the various factors. The different responses of attenuation and seismic velocities to partial melt suggests that combined observations of seismic velocity and attenuation may be particularly valuable in distinguishing partial melt from large sub-solidus temperature anomalies [Forsyth, 1993]. Melt has the greatest effect on S-wave velocities, a smaller effect on P-wave velocities, and relatively little effect on attenuation. Conversely, high sub-solidus temperatures have an exponential effect on attenuation but a smaller effect on seismic velocities. Therefore, regions of partial melt should be distinguishable by their exceptionally slow S-wave velocity anomalies and large S to P anomaly ratios in the absence of a correspondingly large attenuation anomaly. Distinguishing between high temperature
7 7 anomalies and the presence of volatiles will remain difficult until better laboratory data are available. 2.3 Velocity Anisotropy Observations of anisotropy, where the seismic velocity depends on the propagation or polarization direction, can have a variety of causes. These include layering of different isotropic layers [Backus, 1965], cracks whether dry, fluid or melt filled [Crampin and Booth, 1985; Kendall, 1994], or systematic orientation of mantle minerals, such as olivine, whose crystallographic structure is anisotropic [Hess, 1964]. Where anisotropy can be associated with an increased ordering and alignment of mineral crystal orientations the ordering can in turn be related to the mechanical deformation of the rock [Nicolas and Christensen, 1987]. Detailed study of anisotropic structures therefore provides an opportunity to relate seismic observations to deformation processes in the Earth, including mantle flow. The mantle flow in arcs probably influences or controls many processes, such as the path of melt from the source region as well as the distribution of geochemical anomalies and is therefore of broad importance. Systematic orientation of anisotropic minerals appears to be the dominant mechanism causing anisotropy in the upper-most mantle. This preferred orientation of minerals appears to consist of alignment of one of the crystallographic axes (either a, b, or c), with the other two axes forming a girdle. Hess [1964] noted that in the oceans the fast azimuths of P n are sub-parallel to the spreading directions. Hess interpreted this as preferential orientation of the olivine b-axes, but a later laboratory study by Raleigh [1968] led to the proposal that the anisotropy is due to alignment of the a-axes. To interpret these seismological observations one must be able to relate the seismic velocities observed to the velocities of realistic mantle materials. Laboratory studies have been performed on single crystals. However, these produce only estimates of anisotropy in 'pure' crystals. In the real Earth, minerals are rarely 100% aligned and so velocities have also been measured in naturally occurring rocks, such as overthrust pieces of mantle or xenoliths, and hot-pressed polycrystalline aggregates, where such factors as composition and water content can be varied. In olivine, the a-axes are the fastest direction and the b- axes the slowest [Verma, 1960]. Although examination of rock fabrics has produced examples of b-axes alignment [Christensen and Crosson, 1968; Ave'Lallement and Carter, 1970], a-axes alignment is more common [Christensen, 1984; Mainprice and Silver, 1993; Ji et al., 1994]. In the latter case it is believed that the orientation is controlled by the finite strain [Williams, 1977]; the a-axes align in the direction of shear and the b-axes normal to it.
8 This observation gives rise to the conventional assumption that the mantle flow direction corresponds to the direction of preferential orientation of olivine a-axes and the anisotropic fast direction. Laboratory experiments that determine induced anisotropy under an applied deformation also favor alignment of the a-axes. In early experiments examination of the lattice preferred orientation (LPO) was usually performed on materials under uniaxial compression. However, theoretical models show that the type of strain is important in predicting the resulting LPO [Wenk et al., 1991] and in the upper mantle simple shear is a much more common deformation mechanism than uniaxial compression. Subsequent experiments on simple shear deformation of olivine aggregates at high temperatures and pressures (~1,500 K and 300 MPa) yielded a-axis alignment in the direction of flow at large strain [Zhang and Karato, 1995]. Small strains produced only slight rotation from the flow direction. Later studies performed on olivine aggregates under greater deformation conditions showed that stress-controlled orientations can also develop but that it is associated with grain boundary migration processes during recrystallization and growth [Zhang et al., 2000]. Water content has been shown to affect the deformation of olivine and enhance grain-boundary migration suggesting it may be important in determining the LPO. Jung and Karato [2001] demonstrated that wet and dry aggregates of olivine exhibited distinctly different LPO when they undergo simple shear deformation under conditions of high stress, temperature, and pressure. They showed that the olivine c-axis, for example, is nearly perpendicular to the shear direction under dry conditions whereas under wet conditions it is sub-parallel to the shear direction. It is unclear at this time what factors govern the deformation slip system for water rich mantle rocks and thus the relationship between the mantle flow direction and the fast direction of seismic anisotropy. Since the mantle wedge near the slab is likely to have significant water content due to slab dehydration and fluid migration, if the laboratory simulations of Jung and Karato [2001] reflect the true behavior of olivine in the Earth, then they have strong implications for the interpretation of anisotropy within a backarc basin. However, this slip system is seldom observed in natural rocks. A recent study of mantle peridotites from the relect Talkeetna arc shows yet another slip system, which differs from both the generally assumed one and that observed in the laboratory [Mehl et al., 2002]. In this slip system the olivine fast direction is sub-parallel to the mantle flow direction, as conventionally assumed. In view of this uncertainty, for the purposes of this review we continue to make the conventional assumption that the fast anisotropic direction delineates the mantle flow direction 8
9 9 Other factors that can influence the strength of anisotropy include the effect of temperature and pressure, which can affect both the strength of anisotropy [Kern, 1993] and the rate of reorientation [Goetze and Kohlstedt, 1973; Mainprice and Nicolas, 1989]. At high temperatures, diffusion and grain boundary mobility enhance orientation [Mainprice and Nicolas, 1989]. Indeed, if conditions are such that melt is formed, anisotropy may be further increased by increased grain size [Hirn et al., 1995] or reduced by increasing the degree of diffusion creep [Cooper and Kohlstedt, 1986] or embrittlement [Davidson et al., 1994]. A review of many of these effects is given by Savage [1999]. Geodynamical flow models can be linked to anisotropy observations in several ways. One approach assumes that the maximum P-wave velocity aligns with the local direction of maximum finite extension, and the minimum P-wave velocity aligns with minimum finite extension [Fischer et al., 2000; Hall et al., 2000]. The magnitude of the anisotropy is scaled by the axial ratios of the finite strain ellipsoid [Ribe, 1992]. More sophisticated approaches such as Blackman et al. [1996] and Tommasi [1998] predict LPO and the resulting anisotropic signature from a particular flow pattern by explicitly linking thermomechanical finite element models to simulations of LPO development. 3. THE SEISMIC VELOCITY AND ATTENUATION STRUCTURE OF THE MANTLE WEDGE The most detailed information on the 2-D and 3-D variation of seismic velocity beneath island arcs comes from body wave tomography. High-resolution tomography requires either a dense array of recording stations or a dense array of earthquakes, and therefore has been carried out in only a few locations. Here we discuss both a well-studied island arc (Japan) and an arc with an accompanying backarc spreading center (the Tonga-Lau system). Northeast Japan is the best-imaged island arc due to the exceptionally large seismological dataset built up by years of recording with a dense array of permanent land seismic stations [Zhao and Hasegawa, 1993; Nakajima et al., 2001]. The Tonga-Lau system is the best imaged island arc with an active back-arc spreading system due to the high seismicity rate of the Tonga slab and the temporary deployment of 12 land seismic stations (the SPASE experiment) and 30 ocean bottom seismographs (the LABATTS experiment) during [Wiens et al., 1995; Koper et al., 1998]. 3.1 Seismic Evidence on the Distribution of Volatiles and Magma Beneath the Volcanic Front
10 10 Body wave travel time tomography is the highest resolution seismological method for imaging the upper mantle structure beneath volcanic arcs. This method uses observed P or S wave travel times along many crossing raypaths to reconstruct the 2-D or 3-D velocity structure within the Earth. Several studies have computed 3-D tomographic models to reconstruct the P-wave velocity variations of NE Japan with a resolution of km [Hasagawa et al., 1991; Zhao et al., 1992, Nakajima et al., 2001] (Plate 1). These images show a dipping upper mantle low velocity zone with P-wave anomalies of up to 5% located about km above the slab and connecting to shallow crustal low velocity anomalies immediately beneath the volcanic front. The most recent studies have also obtained high-resolution S-wave tomographic images and images of the P-to-S ratio [Nakajima et al., 2001]. These images show S-wave anomalies with an amplitude of 6% and high P-to-S velocity ratios of 1.85 in the same positions as the low P-velocities. Later work suggests that the dipping low velocity feature in the mantle wedge is widespread throughout Japan, and that it extends to depths of about km [Zhao and Hasegawa, 1993; Zhao et al., 1994]. Relatively high attenuation (Q α ~ 150) has also been found in the same regions from lower resolution seismic attenuation tomography [Sekiguchi, 1991; Tsumura et al., 1996; Tsumura et al., 2000]. A dipping, low velocity zone beneath the volcanic arc and above the subduction zone is also observed in the Tonga-Lau region [Zhao et al., 1997] (Plate 2). This image resolves P velocity variations along a 1400 km long region with a resolution of km. A low velocity anomaly of up to 6% occurs above the slab and extends from the volcanic arc to a depth of about 150 km. Similar low velocity zones have been observed at other arcs, including Alaska [Zhao et al., 1995], Kyushu [Zhao et al., 2000], and Kamchatka [Gorbatov et al., 1999]. Graeber and Asch [1999] find a dipping zone of high P/S velocity ratios (low S velocity) above the subducting slab in the Andes. These observations suggest that a dipping, low velocity zone above the slab may be a ubiquitous feature of the subduction zone velocity structure. The slow velocity anomalies seem to be located at shallower depth and closer to the forearc in warmer subduction zones, where slabs may dehydrate at shallower depths [Zhao et al., 2000]. There is evidence that this low velocity anomaly below the volcanic front does not represent direct seismic observations of substantial partial melt concentrations. The magnitude of the anomaly, 3-5% for P waves and 4-7% for S-waves, is less than would be expected for melt concentrations of greater than 1%. Anomalies of this magnitude can be reasonably explained by sub-solidus temperature variations of 200 C-400 C or, more likely, by hydration of the mantle wedge.
11 11 The relatively modest S wave anomalies and Vp/Vs ratio (or lnvs/ lnvp) changes also argues against a widespread region of significant in-situ melt. Vp/Vs anomalies are found in both Japan [Nakajima et al., 2001] and the Andes [Myers et al, 1998; Graeber and Asch, 1999] but in both cases the maximum Vp/Vs ratio is about 1.85, constraining partial melt concentrations to be less than about 1%. The Japan results are compatible with a η ( lnvs/ lnvp) value of about 1.8, which is elevated with respect to the expected values from purely thermal effects (1.4) but less than 2.2 expected for anomalies caused by melt [Hammond and Humphreys, 2000a]. Obviously there is melt in localized regions beneath the volcanic front but the evidence is against large scale (> 25 km) regions with significant (> 1%) melt concentration. Instead, the dipping low velocity anomaly probably represents a hydrated region of the mantle wedge, and the source region of the melt. Most petrologic and geodynamic models suggest that island arc magmas are formed through the hydration of the mantle wedge by fluids from dehydration reactions in the subducting crust [Tatsumi, 1989; Peacock, 1990; Davies and Stevenson, 1992; Iwamori, 1998; Schmidt and Poli, 1998; Mibe et al., 1999]. The presence of water will significantly reduce the seismic velocities of the hydrated region of the mantle wedge. Small amounts of water in olivine reduce the melting temperature, resulting in mantle temperatures that are near the solidus and produce slow velocity anomalies from anelastic effects [Hirth and Kohlstedt, 1996; Karato, 1993; Karato and Jung, 1998]. In addition, larger amounts of fluid will result in hydrous phases, which generally show much lower seismic velocities than mantle peridotite [Christensen and Mooney, 1995]. The low velocity regions may also denote warmer upwelling regions in the mantle wedge where small amounts of decompression melting may occur, as predicted by geodynamic models [Andrews and Sleep, 1974; Conder et al., 2002]. Thus the low velocities above the slab in the tomographic images represent imaging of a hydrated region in the mantle wedge. This region represents the source zone for the island arc magmas erupted at the volcanic front. Significant quantities of melt (> 1%) are not imaged at present and may not occur over large regions (25 km and greater) due to efficient melt extraction mechanisms. This is suggested by geodynamic modeling [Richter and McKenzie, 1984; Scott and Stevenson, 1986], experiments [Kohlstedt, 1992], and by the rapid melt transport times indicated by U-series isotopic studies [Hawkesworth et al., 1997; Turner and Hawkesworth, 1997; Bourdon et al., 1999]. Naturally, some pockets of significant partial melt (> 1%) may likely exist within the melt source and transport region, but their spatial extent is probably too small to be imaged by the current resolution scale of tomographic studies (25-50 km). Imaging the melt
12 12 generation and transport system remains a goal for the next phase of seismological studies. 3.2 Seismic Structure of Backarc Spreading Centers and Relationship to Arc Structure Seismological studies of island arcs with active backarc spreading centers allow better understanding of the relationships between volcanic arcs and backarc spreading. The P-wave tomographic results from the Tonga-Lau region shows, in addition to the slow anomalies beneath the volcanic arc, a large slow velocity anomaly near the Central Lau spreading center (Plate 2) [Zhao et al., 1997]. This region represents the magma source region for the Lau backarc spreading center. Although S-wave data recorded in the Tonga region were insufficient for reliable S-wave tomography, further information on the S-wave structure of the Lau basin comes from inversion of seismic waveforms traversing the Lau backarc [Xu and Wiens, 1997; Wiens et al., 2002]. Although the spatial resolution of this method is inferior to P-wave tomography, the depth variation of seismic velocity averaged along the ray path is accurately recovered. These results (Figure 2) show exceptionally low S-wave velocities beneath the Lau backarc at depths of km, with a maximum S-wave heterogeneity of about 17% relative to the old Pacific Plate. These depths correspond to the depths of the low velocities in the P-wave tomography (Plate 2) and also represent the expected depths of primary MORB magma production [Shen and Forsyth, 1995]. Comparison of the various tomographic models and the waveform inversion results suggest that the maximum velocity anomalies are greater beneath the backarc spreading center than beneath the arc volcanic front. The slow velocity regions beneath the Tonga arc and the Lau back arc are geographically separated at shallow levels but merge at depths of about km depth. This suggests that although the arc and backarc systems are separated at shallow levels, where most of the magma is generated, there may be some interchange between the magma systems at depths great than 100 km. Interaction with slab-derived volatiles at depths greater than 100 km may help to explain some of the unique features of the geochemistry of back-arc magmas relative to typical MOR basalts, including excess volatiles and large ion lithophile enrichment [Hawkins, 1995; Pearce et al., 1995]. The entire upper mantle region beneath the Lau backarc shows a strong seismic attenuation anomaly [Roth et al., 1999] (Plate 3). The 2-D seismic attenuation tomography has lower resolution (~100 km) compared to the P-wave tomography, such that any possible attenuation anomaly associated with the Tonga volcanic arc is not resolved. Qualitatively, there is a sudden transition from low attenuation in the forearc to high attenuation in the
13 13 backarc, which occurs immediately beneath the volcanic arc. The high attenuation anomaly shows Q α ~ 95 and extends throughout the Lau backarc basin to a depth of km. It is unclear how much partial melt is indicated by the seismic anomalies in the Lau backarc. The maximum anomalies indicated by the P-wave tomography (-7%) and by the S-wave waveform inversion (-15 %) are so large that to explain them with only temperature changes requires temperature anomalies of ~500 C (or a corresponding lowering of the solidus temperature due to the effect of volatiles). The seismic anomalies suggest maximum melt concentrations of about 1.5% at depths of km beneath the Lau basin using the relations of Hammond and Humphreys [2000b]. The ratio of S to P wave anomalies is a possible discriminant for the presence of partial melt. However, there are too few good S-wave arrivals to perform S-wave tomography of the Tonga-Lau region. Koper et al. [1999] evaluated the parameter ν = lnvs/ lnvp for raw arrival times with raypaths traversing the upper mantle beneath the Lau backarc and found ν = , in agreement with anomalies generated by temperature changes but much less than the ν ~ 2.2 expected for anomalies caused by partial melt. One other promising method for evaluating the presence of melt is the observed Vp-Qp -1 relationship. This has not been used previously since attenuation and velocity tomographic analyses are seldom available for the same location. Roth et al. [2000] compared the relationships between Vp and Qp -1 obtained from the Tonga-Fiji results with the predictions of attenuation-corrected velocity derivatives [Karato, 1993] and the experimental results of Jackson et al., [1992], assuming the anomalies resulted from temperature changes alone (Figure 3). The experimental predictions provide a reasonable match to the observations at depths greater than 100 km. The results for depths < 100 km are scattered, and some points have large velocity anomalies relative to the attenuation anomalies. These points also correspond to the largest backarc velocity anomaly locations in the Zhao et al., [1997] results. These results suggest that the anomalies in the Tonga-Fiji back-arc region can be explained in terms of temperature anomalies, with the exception of the largest magnitude shallow velocity anomalies, which may be due to partial melt. In summary, the tomographic results for the Lau backarc probably imply some small component (~ 1%) of partial melt in the depth range of km beneath the Lau basin, although it is difficult to understand the lack of a larger Vs/Vp anomaly in the raw P and S traveltimes. 3.3 The deep structure beneath back-arc basins - evidence for deep volatile release?
14 14 Seismological results can also provide clues about deeper processes in the mantle wedge. Both plate 2 and figure 2 show substantial seismic anomalies in the Lau backarc at depths greater than the inferred maximum depth of primary melting, which is thought to be about 70 km [Shen and Forsyth, 1995]. The S-wave heterogeneity between the Pacific plate and the Lau basin is about 14% at a depth of 20 km, 17% at 70 km, and 9% at 120 km. The slow velocities beneath the backarc basins are resolvable by the data down to a depth of about 200 km. The large amplitude of the S-wave anomaly at depths of km suggests the possibility of small fractions of water-induced melting at depths significantly greater than that of primary melting (~70 km) [Hirth and Kohlstedt, 1996; Hirschmann et al., 1999]. Smaller slow anomalies at depths of km may result from the proximity of the geotherm to the wet solidus within the upwelling material beneath the ridge, or from subsolidus effects of volatiles in the mantle wedge. The P-wave tomography results show smaller anomalies (2-3%) extending to depths of ~400 km beneath the Lau backarc basin (Plate 2). Slow velocity anomalies to depths of 400 km beneath backarc basins have also been detected by lower resolution tomographic inversions in the Kurile and Izu-Bonin arcs [Van der Hilst et al., 1991; Nolet, 1995]. Such deep slow velocity anomalies have not been detected beneath mid-ocean ridges [Webb and Forsyth, 1998], and thus are unlikely to represent deep structure that is endemic to spreading centers, but rather processes unique to backarc basins. The most likely explanation is that seismic velocities in the deeper parts of the mantle wedge are reduced by hydration reactions as water and other volatiles are released from the slab [Nolet, 1995; Zhao et al., 1997]. Low temperature slabs such as Tonga may be cold enough that water can be transported, either as hydrous minerals or as ice-vii [Bina and Navrotsky, 2000], to the stability depths of dense hydrous magnesian silicate phases [Thompson, 1992; Schmidt and Poli, 1998]. The dehydration of these phases in the slab at depths of about km may produce widespread hydration in the adjacent mantle wedge near these depths. The fact that the low velocity anomalies seem to stop at depths near 400 km in several arcs may be significant; as the slab α-olivine is transformed to wadsleyite (β-mg 2 Si0 4 ) at these depths, which can readily incorporate large amounts of water [Smyth, 1994]. Therefore, slab dehydration may cease at the depth of the α to β transformation. The flux of volatiles from the slab into the mantle wedge beneath the backarc basin to depths of km may lower the viscosity of the upper mantle [Karato et al., 1986; Hirth and Kohlstedt, 1996] and be an important factor in localizing backarc extension in backarc basins. The rapid and episodic character of backarc spreading [Jurdy and
15 15 Stefanick, 1983] may thus be related to the hydration of the mantle wedge at depth by the subducting slab. 4. SEISMIC ANISOTROPY RESULTS: CONSTRAINTS ON MANTLE FLOW PATTERNS 4.1 A review of Anisotropy Observations in Arcs In an anisotropic medium vertically arriving shear waves can split into two orthogonally polarized S-waves, quasi- SH and quasi-sv, that travel at different speeds. This 'splitting' is related to the strength and path length of anisotropy traversed, and the polarization of the first arriving S-wave gives the anisotropic fast-azimuth. Estimates of these parameters can be obtained by a variety of methods (e.g. Crampin et al., 1980; Bowman and Ando, 1987; Silver and Chan, 1991]). These analysis methods produce much the same result but use differing functions to compare the two S-waves over a range of rotation angles and time-offsets to find the splitting-time and fast-azimuth [Silver and Chan, 1991]. Comparison of different phases (e.g. S, ScS, SKS, SKKS, PKS) can help localize the depth distribution of the anisotropic signature. We discuss splitting measurements here as they are also geographically well constrained and have been performed in a wide range of subduction zone environments (e.g. Ando, 1984; Bowman and Ando, 1987; Shih et al., 1991; Kaneshima and Silver, 1992; Fischer and Yang, 1994; Russo and Silver, 1994; Yang et al., 1995; Fouch and Fischer, 1996; Gledhill and Gubbins, 1996; Fouch and Fischer, 1998; Fischer et al., 1998; Smith et al., 2001] making comparison possible. For South America, Russo and Silver [1994] report small local S splitting (~0.1s) and large (3s) SKS splitting times and infer that there is thus little wedge anisotropy. They instead propose strong anisotropy beneath the slab due to horizontal trench-parallel flow consistent with Alvarez [1982] to explain trench-parallel orientations. However, contradictory fast-azimuths are observed in a variety of locations [Russo and Silver, 1994; Helffrich et al., 2002]. In addition, in the mantle wedge beneath Columbia, Shih et al., [1991] found splitting up to 0.4s with fast directions sub-parallel to the plate boundary. Similar results are also found in Peru, Brazil, and central Chile [Polet et al., 2000] but in northern Chile fast azimuths are parallel to the absolute plate motion (APM) of the Nazca plate [Bock, 1998; Polet et al., 2000]. These local S-wave measurements strongly indicate anisotropy in the mantle wedge with varying fast-azimuths. In the eastern Aleutians local S-wave splitting is again small (up to 0.35s) indicating little (~1%) anisotropic organization in the wedge. However, the orientation is highly consistentat 60 degrees, roughly parallel to the volcanic arc. A similar arc-parallel orientation is observed
16 16 using ss-s phase pairs and direct S phases [Fischer and Yang, 1994] and SKS phases [Peyton et al., 2001] in the northern Kamchatka peninsula and in S and SKS in the southern Kurils [Fouch and Fischer, 1996]. However, in the region of the Kurils between these two observations arc-perpendicular fast azimuths are observed [Fischer and Yang, 1994]. Trench parallel orientations are also observed in western Honshu [Fouch and Fischer, 1996; Hiramatsu et al., 1998] and the Japan Sea whereas in northern Japan [Sandvol and Ni, 1997] and Izu-Bonin [Fouch and Fischer, 1996; Hiramatsu et al., 1998] orientations are parallel to the absolute plate motion (APM) of the Pacific plate. In the Marianas S, ScS and SKS measurements indicate small splitting ( s) roughly 20 from the APM of the downgoing plate [Fouch and Fischer, 1998]. In the Hikurangi (New Zealand) subduction zone trench parallel fast directions are observed in SKS phases [Gledhill and Gubbins, 1996; Marson-Pidgeon et al., 1999]. In Tonga, observations at back-arc islands show striking correlation between the anisotropic fast direction and the plate convergence direction [Fischer and Wiens, 1996] and exhibit unusually large local S splitting times (>1s). However, closer to the Tonga trench the fast direction is trench parallel [Smith et al., 2001]. Many other studies have reported splitting in subduction zone environments from a variety of shear-phases. However, in the fore-going discussion we have not included observations where the location of the anisotropy remains unconstrained. Only those observations that are able to distinguish between anisotropy above and below the slab have been noted. These results are summarized in tables 3 and 4 and in figure The Tonga-Lau System: A Complex Pattern of Anisotropic Orientations In the Tonga-Lau region splitting observations are geographically distributed across the arc and backarc. This region displays a very complex pattern of strong seismic anisotropy. Figure 5 shows the averaged splitting results at both land and ocean bottom seismograph (OBS) stations in the region [Smith et al., 2001]. Results at the land based stations on the Fiji platform to the west are roughly parallel with the convergence direction and can be explained by large-scale counterflow induced by the subduction of the Pacific plate. However, this simple pattern of fast azimuths paralleling the absolute plate motion direction is not apparent all the way across the basin. Indeed, many of the fast vectors are almost perpendicular to the plate motion and there is a strong variation in the magnitude of the splitting with greatly reduced splitting times towards the center of the basin. 2D flow modeling instead predicts an almost
17 17 uniform splitting time across the basin [Fischer et al., 2000]. In order to explain the trends within this data we need to appeal to more complex modeling that takes into account factors such as the backarc spreading center and changes in the slab dip through time. Splitting times in the center of the basin are both greatly reduced and almost orthogonal to the plate motion direction; this phenomenon occurs geographically close to the spreading center and may be related to it. Near the Tonga volcanic arc we observe strong along-strike fast directions. Many of the raypaths of the split S-phases observed at the Tonga arc stations are from intermediate depth events ( km depth), with the entire path length within the mantle wedge. This indicates that the strong along-strike fast directions must be explained by processes within the mantle wedge and cannot be attributed to anisotropy within the subducted plate. Possible mechanisms that could explain trench-parallel flow include the effect of slab rollback on mineral alignment as modeled in the laboratory by Buttles and Olson [1998], which should be significant in Tonga, which has experienced rapid roll back during the past 4 Ma [Hamburger and Isaaks, 1987]. This physical modeling experiment investigated the effect of dip angle and rollback on material flow, and produced results consistent with the observations of anisotropic fast directions obtained in the eastern Lau basin and Tonga arc. There is also strong geochemical evidence to suggest that along trench mantle flow is occurring in the Tonga- Lau region. Gill and Whelan [1989] attribute a change in Fiji magmatism from arc-like to OIB to influx of the Samoan Plume around 3 Ma. A similar explanation for high Nb relative to other high field strength elements in lavas at the Islands Tafehi and Niuatoputapu at the northern end of the Tonga-Kermadec subduction zone is also proposed [Wendt et al., 1997]. Poreda and Craig [1992] use helium isotope data to infer channeling of the Samoan Plume towards the Peggy Ridge at the northern end of the Lau Basin. A later study by Turner and Hawkesworth [1998] mapped the presence of the high He 3 :He 4 ratios further south into the Lau backarc. Such isotope signatures, which are characteristic of the Samoan Plume, led Turner and Hawkesworth to propose that this was evidence of flow of shallow mantle, from the Samoan Plume into the Lau Basin parallel to the trench, through a gap in the subducting Pacific plate (see Figure 6). The anisotropy observations are thus remarkably consistent with the flow model proposed on the basis of geochemical data. 4.3 Models for arc flow patterns and relationship to observations
18 Explaining the diversity of anisotropy patterns in subduction zone systems is difficult. Clearly a simple model relating anisotropic fast directions to global models of mantle flow will not predict all of the observations. The simplest approach for modeling anisotropy in subduction zones incorporates the strain resulting from flow coupled to the downgoing plate (Figure 7). This predicts a fairly uniform pattern of anisotropy paralleling the absolute plate motion [McKenzie, 1979; Ribe, 1989] which would match observations in Izu-Bonin and the western part of Tonga-Lau. Indeed, Fischer et al. [2000] demonstrate that given the right assumptions relating the strength of LPO to strain the magnitude of these splitting times could also be predicted using a simple 2D mantle flow model (Figure 7). However, such an approach will obviously not fit the along-strike fast direction observations from the Aleutians, Japan, and the Tonga arc itself. The majority of the arcs studied actually show a predominance of along-strike fast directions for mantle wedge anisotropy, suggesting that viscous coupling to the downgoing plate may be relatively unimportant for driving backarc flow. Mechanisms which could produce trench-parallel fastdirections include the effect of melt [Kendall, 1994]. If melt forms in pockets or films then the geometry of these can significantly affect the shear-wave velocity. It is reasonable to assume that such melt-filled cracks will preferentially open parallel to the direction of minimum deviatoric compressive stress [Fischer et al., 2000]. In the case of 2D flow in the mantle wedge one would expect the maximum compression to occur in the direction of convergence. This results in the prediction of trenchparallel melt sheets and an associated along arc fast direction. However, it seems reasonable to assume that if such a mechanism were responsible for the along-strike fast axes the mechanism should apply equally to the Izu- Bonin, where instead convergence parallel fast directions are observed. One possible explanation for the differences between subduction zones may lie in the variations in subduction angle, convergence angle, and rollback between regions. Buttles and Olson [1998] showed that when there is a large component of slab rollback, the mantle flow pattern was dominated by mantle inflow to the backarc region around the ends of the slab. Their results indicated that this should occur almost independent of plate dip. Instead the amount of rollback a slab has experienced is the determining factor in trench-parallel a-axis alignment. We must also take into account the presence of other structures, such as a back-arc spreading center, in accurately accounting for splitting patterns. Blackman et al. [1996] used a finite element flow model to predict deformation in the vicinity of a spreading ridge. They used different starting parameters to obtain both buoyant and 18
19 19 passive models. Regardless of which model they used they obtained two significant results. First, close to the spreading center they saw a reduction in the amplitude of the splitting. Second, they observed a reversal in the polarization of the first arriving shear-wave. Such local deviations in flow will also affect the pattern of observed splitting and were noted in the observations for Tonga [Smith et al., 2001]. It seems clear that flow patterns, and their relationship to anisotropic observations in the mantle wedge, are complicated. We appear to have reached a stage in the study of seismic anisotropy where the resolution of our observations currently out-strips the resolution of our models. Although global flow patterns show good correlation with the long period anisotropic signature of the mantle [Tanimoto and Anderson, 1984] these predictions break down at the shorter length scales in the back-arc due to the complex flow patterns induced by the plate boundary. In addition the continent scale models such as proposed by Russo and Silver [1994] also appear unable to account for the small scale variations present in the data without resorting to additional variables such as changes in slab dip affecting local flow. Although fast-directions varied from one subduction zone to the next, until recently observations suggested that at least within a single back-arc the fast-azimuth was constant, usually either paralleling the APM or the trenchstrike. While this remained the case, 2D models of mantle flow driven by coupling to the downgoing plate or melt anisotropy remained a viable means of explaining the flow. While such simple models still appear to be valid far from the plate boundary the new observations mapping variations in the fast azimuth across the backarc require more detailed flow models. In addition, the new models must be able to provide a consistent explanation of why strikingly different observations are obtained between different subduction zones. 5. CONCLUSIONS Seismology can now provide important constraints on the locations of the melt source regions and the pattern of flow in the mantle wedge. The magma source regions for island arc volcanics are imaged as dipping low velocity zones overlying the subducting slab at depths of km. However, the imaged regions may not correspond to actual partial melt concentrations, and may instead represent hydrated regions of the mantle. The largest seismic anomalies occur at depths of km beneath backarc spreading centers and probably correspond to no more than 1% partial melt concentrations. The generally small partial melt concentrations in both the arc and backarc regions are consistent with models for rapid and efficient melt extraction, as suggested by geodynamic
20 20 modeling, experimental work, and isotope studies. In the Tonga-Lau system, anomalies related to the volcanic arc merge with anomalies beneath the backarc spreading center at depths greater than 100 km, suggesting that small slab components of backarc magmas may originate through interactions at greater depths. Low amplitude slow velocity seismic anomalies extend to 400 km depth beneath backarc basins, and may result from the release of volatiles transported to depths of km by hydrous minerals in the slab. Assuming that anisotropy results from preferential orientation of mineral fast axes in the direction of flow, shear wave splitting observations suggest that most, but not all, subduction zones are characterized by along-strike mantle flow within the mantle wedge. This suggests that counterflow in the mantle wedge induced by viscous coupling with the downgoing plate is generally weak. The flow patterns of several subduction zones appear to be dominated by inflow due to slab rollback and other local factors. Clearly major questions remain regarding the pathways of volatiles and melt through the mantle, the concentration of volatiles and melt at various locations, and how these pathways are related to mantle flow. Progress within the next ten years is likely to come from a number of different sources. Many of the issues are related to problems of spatial resolution. Large-scale experiments consisting of up to 100 stations and the accumulation of even larger datasets in areas of permanent networks will help improve resolution beyond the km limits that are currently possible. This may enable further resolution of melt pockets within hydrated regions overlying the subducting slab beneath the volcanic arc, or delineation of the shape of the melt producing region beneath the backarc spreading center. Greater density of high quality stations will also permit much better resolution of the spatial and depth variability of seismic anisotropy, thus placing better constraints on the mantle flow pattern. Progress will also arise from studies combining disparate datasets. Whereas many previous seismological studies of the mantle wedge structure have emphasized P wave travel time tomography, future work will integrate P, S, and attenuation structure to place better constraints on material properties. Anisotropy studies will also benefit from more investigations going beyond the local S and teleseismic SKS splitting work reported here. It is likely that various phase combinations, such as the ss-s differential method developed by Fischer and Yang [1994], will be important additional sources of information. Future work will also attempt to synthesize the diverse range of other measures of anisotropy (e.g. propagation anisotropy in both P n and surface waves as well as polarization anisotropy of surface waves) that are available.
21 21 Finally, much of the progress must come from experimental and modeling work necessary to understand the seismological measurements. Further experimental work is needed to help clarify the relationship between P and S velocity and attenuation anomalies and the presence of volatiles and melt. Experimental work is also needed to help better understand the relationship of seismic anisotropy to strain and stress associated with mantle flow, and the possible complicating effects of composition, volatile content, grain size, temperature, and pressure. More detailed 3-D geodynamical modeling applied to specific arc geometries is also necessary, since the available anisotropy studies suggest that the specific pattern of mantle flow is variable and dependent on the specific geometry and tectonic history of a particular arc. The results of these studies will be a more detailed mapping of the mantle flow pattern and the pathways of volatiles and melt through the subduction factory. Acknowledgements. We thank James Conder for helpful comments, and Dapeng Zhao, Bill Hammond, Karen Fischer, and Simon Turner for use of their figures. We also thank John Eiler and an anonymous reviewer for helpful suggestions. Much of the research described here used equipment and data management resources provided by the Incorporated Research Institutions in Seismology (IRIS), and ocean bottom seismograph equipment used in collaboration with Leroy Dorman, John Hildebrand, and Spahr Webb. This research was supported by the National Science Foundation under grants EAR , OCE , EAR , EAR , EAR , and OCE REFERENCES Aki, K., and P.G. Richards, Quantitative Seismology, Theory and Methods, W. H. Freeman and Company, San Francisco, Akimoto, S.-I., The system MgO-FeO-SiO2 at high pressures and temperatures - Phase equilibria and elastic properties, Tectonophysics, 13, , Alvarez, W., Geological evidence for the geographical pattern of mantle return flow and the driving mechanism of plate tectonics, J. Geophys. Res, 87, , Anderson, O.L., D. Isaak, and H. Oda, High-temperature elastic constant data on minerals relevant to geophysics, Rev. Geophys., 30, 57-90, Anderson, D. L., A. Ben-Menahem, and C. B. Archambeau, Attenuation of seismic energy in the upper mantle, J. Geophys. Res., 70, , Andrews, D. H., and N. H. Sleep, Numerical modeling of tectonic flow behind island arcs, Geophys. J. Roy. Astr. Soc., 38, , Ando, M., ScS polarization anisotropy around the Pacific Ocean, J. Phys. Earth, 32, , Ave'Lallement, H.G., and N.L. Carter, Syntectonic recrystallization of olivine and models of flow in the upper mantle, Bull. Geol. Soc. Am., 81, 2203, 1970.
22 Backus, G.E., Possible forms of seismic anisotropy of the uppermost mantle under oceans, J. Geophys. Res., 70, , Berckhemer, H., W. Kampfmann, E. Aulbach, and H. Schmeling, Shear modulus and Q of forsterite and dunite near partial melting from forced-oscillation experiments, Physics of the Earth and Planetary Interiors, 29, 30-41, Bina, C.R., and A. Navrotsky, Possible presence of high-pressure ice in cold subducting slabs, Nature, 408, , Blackman, D.K., J.-M. Kendall, P.R. Dawson, H.R. Wenk, D. Boyce, and J.P. Morgan, Teleseismic imaging of subaxial flow at mid-ocean ridges: traveltime effects of anisotropic mineral texture in the mantle, Geophys. J. Int., 127, , Bock, G., R. Kind, A. Rudloff, G. Asch, Shear wave anisotropy in the upper mantle beneath the Nazca plate in northern Chile, J. Geophys. Res., 103, , Bourdon, B., S. Turner, and C. Allegre, Melting dynamics beneath the Tonga-Kermadec Island Arc inferred from 231Pa- 235U systematics, Science, 286, , Bowman, J.R., and M. Ando, Shear-wave splitting in the uppermantle wedge above the Tonga subduction zone, Geophys. J. R. Astr. Soc., 88, 25-41, Buttles, J., and P. Olson, A laboratory model of subduction zone anisotropy, Earth and Plan. Sci. Lett., 164, , Christensen, N.I., The magnitude, symmetry and origin of upper mantle anisotropy based on fabric analyses of ultramafic tectonites, Geophys. J. R. Astr. Soc., 76, , Christensen, N.I., and R.S. Crosson, Seismic anisotropy in the upper mantle, Tectonophysics, 6, , Christensen, N.I., and W.D. Mooney, Seismic velocity structure and composition of the continental crust: A global view, J. Geophys. Res., 100, , Conder, J. A., D. A. Wiens, and J. Morris, On the deompression melting structure at volcanic arcs and back-arc spreading centers, Geophys. Res. Lett., 29, /2002GL015390, Cooper, R.F., and D.L. Kohlstedt, Rheology and structure of olivine-basalt partial melts, J. Geophys. Res., 91, , Crampin, S., and D.C. Booth, Shear-wave polarizations near the North Anatolian fault, II, Interpretation in terms of crackinduced anisotropy, Geophys. J. R. Astron. Soc., 83, 75-92, Crampin, S., R. Evans, B. Ucer, M. Doyle, J.P. Davis, G.V. Yegorkina, and A. Miller, Observations of dilatancy induced polarization anomalies and earthquake prediction, Nature, 286, , Davidson, C., S.M. Schmid, and L.S. Hollister, Role of melt during deformation in the deep crust, Terra Nova, 6, , Davies, J.W., and D.J. Stevenson, Physical model of source region of subduction zone volcanics, J. Geophys. Res., 97, , Farra, V., and L.P. Vinnik, Shear-wave splitting in the mantle of the Pacific, Geophys. J. Int., 119, , Faul, U.H., D.R. Toomey, and H.S. Waff, Intergranular basaltic melt is distributed in thin, elongated inclusions, Geophys. Res. Lett., 21, 29-32,
23 Fischer, K.M., and D.A. Wiens, The depth distribution of mantle anisotropy beneath the Tonga subduction zone, Earth Planet. Sci. Lett., 142, , Fischer, K.M., and X. Yang, Anisotropy in Kuril-Kamchatka subduction zone structure, Geophys. Res. Lett., 21 (1), 5-8, Fischer, K.M., M.J. Fouch, D.A. Wiens, and M.S. Boettcher, Anisotropy and flow in Pacific subduction zone back-arcs, Pure Appl.. Geophys., 151, , Fischer, K. M., Parmentier, E. M., Stine, A. R., Wolf, E. R., Modeling anisotropy and plate driven flow in subduction zone back-arcs, J. Geophys. Res., 105, , Flanagan, M.P., and D.A. Wiens, Radial upper mantle attenuation structure of inactive back-arc basins from differential shear wave measurements, J. Geophys. Res., 99, , Flanagan, M.P., and D.A. Wiens, Attenuation of broadband P and S waves in Tonga: Observations of frequency dependent Q, Pure appl. geophys., 153, , Forsyth, D.W., Geophysical constraints on mantle flow and melt generation beneath mid-ocean ridges, in Mantle flow and melt generation at mid-ocean ridges, edited by J.P. Morgan, D.K. Blackman, and J.M. Sinton, pp. 1-65, AGU, Washington DC, Fouch, M.J., and K.M. Fischer, Mantle anisotropy beneath northwest Pacific subduction zones, J. Geophys. Res., 101, 15,987-16,002, Fouch, M.J., and K.M. Fischer, Shear wave anisotropy in the Mariana subduction zone, Geophys. Res. Lett., 25, , Gaherty, J.B., T.H. Jordan, and L.S. Gee, Seismic structure of the upper mantle in a central Pacific corridor, J. Geophys. Res., 10, 22,291-22,310, Getting, I.C., S.J. Dutton, P.C. Burnley, S. Karato, and H.A. Spetzler, Shear attenuation and dispersion in MgO, Phys. Earth Planet. Int., 99, , Gill, and Whelan, Postsubduction ocean island alkali basalts in Fiji, J. Geophys. Res., 94, , Gledhill, K., and D. Gubbins, SKS splitting and the seismic anisotropy of the mantle beneath the Hikurangi subduction Zone, New Zealand, Phys. Earth and Planet. Int., 95 (3-4), , Goes, S., R. Govers, and P. Vacher, Shallow mantle temperatures under Europe from P and S wave tomography, J. Geophys. Res., 105, 11,153-11,170, Goetze, C., and D.L. Kohlstedt, Laboratory study of dislocation climb and diffusion in olivine, J. Geophys. Res., 78, , Gorbatov, A., J. Dominguez, G. Suarez, V. Kostoglodov, D. Zhao, and E. Gordeev, Tomographic imaging of the P-wave velocity structure beneath the Kamchatka peninsula, Geophys. J. Int., 137, , Graeber, F.M., and G. Asch, Three-dimensional models of P wave velocity and P-to-S velocity ratio in the southern central Andes by simultaneous inversion of local earthquake data, J. Geophys. Res., 104, 20,237-20,256, Gribb, T. T., and R. F. Cooper, Low-frequency shear attenuation on polycrystalline olivine: Grain boundary diffusion and the 23
24 phyhsical significance of the Andrade model for viscoelastic rheology, J. Geophys. Res., 103, , Gribb, T.T., and R.F. Cooper, The effect of an equilibrated melt phase on the shear creep and attenuation behavior of polycrystalline olivine, Geophys. Res. Lett., 27, , Hales, A. L., and H. A. Doyle, P and S travel time anomalies and their interpretation, Geophys. J. Roy. Astron. Soc., 13, , Hall, C.E., K.M. Fischer, and E.M. Parmentier, The influence of plate motions on three-dimensional back-arc mantle flow and shear wave splitting, J. Geophys. Res., 105, , Hamburger, M. W., and Isacks, B. L., Deep earthquakes in the Southwest Pacific: A tectonic interpretation, J. Geophys. Res., 92, , Hammond, W.C., and E.D. Humphreys, Upper mantle seismic wave attenuation: Effects of realistic partial melt distribution, J. Geophys. Res., 105, 10,987-11,000, 2000a. Hammond, W.C., and E.D. Humphreys, Upper mantle seismic wave velocity: The effect of realistic partial melt geometries, J. Geophys. Res., 105, , 2000b. Hasegawa, A., D. Zhao, S. Hori, A. Yamamoto, and S. Horiuchi, Deep structure of the northeastern Japan arc and its relationship to seismic and volcanic activity, Nature, 352, , Hawkesworth, C.J., S.P. Turner, F. McDermott, D.W. Peate, and P. van Calsteren, U-Th isotopes in arc magmas: Implications for element transfer from the subducted crust, Science, 276, , Hawkins, J.W., Evolution of the Lau basin - Insights from ODP leg 135, in Active margins and marginal basins of the western Pacific, edited by B. Taylor, and J. Natland, pp , AGU, Washington DC, Helffrich, G., D. A. Wiens, E. Vera, S. Barrientos, P. Shore, S. Robertson, R. Adaros, A teleseismic shear-wave splitting study to investigate mantle flow around South America and implications for plate-driving forces, Geophy. J. Int., 149, F1- F7, Hess, H.H., Seismic anisotropy of the uppermost mantle under oceans, Nature, 203, , Hiramatsu, Y., M. Ando, T. Tsukuda, and T Ooida, Threedimensional image of the anisotropic bodies beneath central Honshu, Japan, Geophys. J. Int., 135, , Hirn, A., M. Jiang, M. Sapin, J. Diaz, A. Nercessian, Q.T. Lu, J.C. Lepine, D.N. Shi, M. Sachpazi, M.R. Pandy, K. Ma, and J. Gallart, Seismic anisotropy as an indicator of mantle flow beneath the Himlayas and Tibet, Nature, 375, , Hirschmann, M.M., P.D. Asimow, M.S. Ghiorso, and E.M. Stolper, Calculation of peridotite partial melting from thermodynamic models of minerals and melts. III. Controls on isobaric melt production and the effect of water on melt production, J. Petrology, 40, , Hirth, G., and D. Kohlstedt, Water in the oceanic upper mantle: Implications for rheology, melt extraction and the evolution of the lithosphere, Earth Planet Sci Lett, 144, , Hirth, G., and D.L. Kohlstedt, Experimental constraints on the dynamics of the partially molten upper mantle, 2, Deformation 24
25 in the dislocation creep regime, J. Geophys. Res., 100, 15,441-15,450, Isaak, D.G., High-temperature elasticity of iron-bearing olivines, J. Geophys. Res., 97 (B2), , Iwamori, H., Transportation of H 2 O and melting in subduction zones, Earth Planet. Sci. Lett., 160, 65-80, Jackson, I., Laboratory measurement of seismic wave dispersion and attenuation: recent progress, in The earth's deep interior: Mineral physics and tomography from the atomic to the global scale, edited by S. -i Karato et al., Geophysical Monograph, 117, American Geophysical Union, Washington D.C., Jackson, I., M.S. Paterson, and J.D. FitzGerald, Seismic wave dispersion and attenuation in Aheim Dunite: an experimental study, Geophys. J. Int., 108, , Ji, S., X. Zhao, and D. Francis, Calibration of shear-wave splitting in the subcontinental upper mantle beneath active orogenic belts using ultramafic xenoliths from the Canadian Cordillera and Alaska, Tectonophysics, 239, 1-27, Jordan, T.H., Mineralogies, densities, and seismic velocities of garnet lherzolites and their geophysical significance, in The mantle sample: Inclusions in kimberlites and other volcanics, edited by F.R. Boyd, and H.O.A. Meyer, pp. 1-14, American Geophysical Union, Washington D.C., Jung, H., and S.-i. Karato, Water-induced fabric transitions in olivine, Science, 293, , Jurdy, D.M., and M. Stefanick, Flow models for back-arc spreading, Tectonophysics, 99, , Kanamori, H., and D.L. Anderson, Importance of physical dispersion in surface-wave and free-oscillation problems, Rev. Geophys. Space Phys., 15, , Kaneshima, S., and P.G. Silver, A search for source side mantle anisotropy, Geophys. Res. Lett., 19 (10), , Karato, S., Importance of anelasticity in the interpretation of seismic tomography, Geophys. Res. Lett., 20, , Karato, S, Mapping water content in the upper mantle, in The Subduction Factory, edited by J. Eiler and G. Abers, in press, Karato, S., and H. Jung, Water, partial melting and the origin of the seismic low velocity and high attenuation zone in the upper mantle, Tectonophysics, 157, , Karato, S., M.S. Paterson, and J.D. FitzGerald, Rheology of synthetic olivine aggregates: Influence of grain size and water, J. Geophys. Res., 91, , Karato, S., and H.A. Spetzler, Defect microdynamics in minerals and solid-state mechanisms of seismic wave attenuation and velocity dispersion in the mantle, Rev. Geophys., 28, , Kendall, J.-M., Teleseismic arrivals at a mid-ocean ridge: Effects of mantle melt and anisotropy, Geophys. Res. Lett., 21, , Kern, H., P- and S-wave anisotropy and shear wave splitting at presure and temperature in possible mantle rocks and their relations to the rock fabric, Phys. Earth and Planet. Int., 78, , Kern, H., and A. Richter, Temperature derivatives of compressional and shear wave velocities in crustal and mantle rocks at 6 kbar confining pressure, J. Geophys., 49, 47-56,
26 Kohlstedt, D.L., Structure, rheology and permeabililty of partially molten rocks at low melt fraction, in Mantle flow and melt generation at mid-ocean ridges, edited by J.P. Morgan, B.D. K., and J.M. Sinton, pp , AGU, Washington D. C., Koper, K.D., D.A. Wiens, L.M. Dorman, J.A. Hildebrand, and S.C. Webb, Modeling the Tonga slab: Can travel time data resolve a metastable olivine wedge?, J. Geophys. Res., 103, , Koper, K.D., D.A. Wiens, L.M. Dorman, J.A. Hildebrand, and S.C. Webb, Constraints on the origin of slab and mantle wedge anomalies in Tonga from the ratio of S to P anomalies, J. Geophys. Res., 104, , Mainprice, D., and A. Nicolas, Development of shape and lattice preferred orientations: Applications to the seismic anisotropy of the lower crust, J. Struct. Geol., 11, , Mainprice, D., and P.G. Silver, Interpretation of SKS-waves using samples from the subcontinental mantle, Phys. Earth Planet. Int., 78, , Marson-Pidgeon, M. K. Savage, K. Gledhill, G. Stuart, Seismic anisotropy beneath the lower half of the North Island, New Zealand, J. Geophys. Res., 104, 20,277-20,286, Mavko, G.M., Velocity and attenuation in partially molten rocks, J. Geophys. Res., 85, , McKenzie, D., Finite deformation during fluid flow, Geophys. J., 58, , Mehl, L., Hacker, B. R., and G. Hirth, Arc-parallel flow within the mantle wedge: Evidence from the accreted Talkeetna arc, South Central Alaska, J. Geophys. Res., in press, Mibe, K., T. Fuji, and A. Yasuda, Control of the location of the volcanic front in island arcs by aqueous fluid connectivity in the mantle wedge, Nature, 401, , Myers, S.C., S. Beck, G. Zandt, and T. Wallace, Lithosphericscale structure across the Bolivian Andes from tomographic images of velocity and attenuation for P and S waves, J. Geophys. Res., 103, 21,233-21,252, Nakajima, J., Matsuzawa, T., Hasegawa, A., and D. Zhao, Three dimensional structure of Vp, Vs, and Vp/Vs beneath northeastern Japan: Imlications for arc magmatism and fluids, J. Geophys. Res., 106, , Nicolas, A., and N.I. Christensen, Formation of anisotropy in upper mantle peridotites - a review, Rev. Geophysics, 25, , Nolet, G., Seismic evidence for the occurrence of volatiles below 200 km depth in the Earth, in Processes of Deep Earth and Planetary Volatiles, edited by K. Farley, pp , Am. Inst. Phys., New York, O'Connell, R.J., and B. Budianski, Seismic velocities in dry and saturated cracked solids, J. Geophys. Res., 79, , Peacock, S.M., Fluid processes in subduction zones, Science, 248, , Pearce, J.A., M. Ernewein, S.H. Bloomer, L.M. Parson, B.J. Murton, and L.E. Johnson, Geochemistry of Lau Basin volcanic rocks: influence of ridge segmentation and arc proximity, in Volcanism associated with extension at consuming plate boundaries, edited by J.L. Smellie, pp , Geological Society, London,
27 Peyton, V., V. Levin, J. Park, M. Brandon, J. Lees, E. Gordeev, A. Ozerov, Mantle flow at a slab edge: Seismic anisotropy in the Kamchatka region, Geophys. Res. Lett., 28, , Polet, J., P.G. Silver, S. Beck, T. Wallace, G. Zandt, S. Ruppert, R. Kind, and A. Rudloff, Shear wave anisotropy beneath the Andes from the BANJO, SEDA, and PISCO experiments, J. Geophys. Res., 105, , Poreda, R.J., and H. Craig, He and Sr isotopes in the Lau Basin mantle: depleted and primitive mantle components, Earth Planet. Sci. Lett., 113, , Raleigh, C.B., Mechanisms of plastic deformation of olivine, J. Geophys. Res., 73, , Ribe, N.M., Seismic anisotropy and mantle flow, J. Geophys. Res., 94, , Ribe, N.M., On the relation between seismic anisotropy and finite strain, J. Geophys. Res., 97 (B6), , Richter, F.M., and D. McKenzie, Dynamical models for melt segregation from a deformable matrix, J. Geol., 92, , Roth, E.G., D.A. Wiens, L.M. Dorman, J. Hildebrand, and S.C. Webb, Seismic attenuation tomography of the Tonga-Fiji region using phase pair methods, J. Geophys. Res., 104, , Roth, E.G., D.A. Wiens, and D. Zhao, An empirical relationship between seismic attenuation and velocity anomalies in the upper mantle, Geophys. Res. Lett., 27, , Russo, R.M., and P.G. Silver, Trench-parallel flow beneath the Nazca Plate from seismic anisotropy, Science, 263, , Sandvol, E., and J. Ni, Deep azimuthal seismic anisotropy in the southern Kurile and Japan subduction zones, J. Geophys. Res., 102, , Sato, H., S. Sacks, and T. Murase, The use of laboratory velocity data for estimating temperature and partial melt fraction in the low velocity zone: Comparison with heat flow data and electrical conductivity studies, J. Geophys. Res., 94, , 1989a. Sato, H., S. Sacks, T. Murase, G. Muncill, and H. Fukuyama, Q P - melting temperature relation in peridotite at high pressure and temperature: Attenuation mechanism and implications for the mechanical properties of the upper mantle, J. Geophys. Res., 94, 10,647-10,661, 1989b. Savage, M.K., Seismic anisotropy and mantle deformation: What have we learned from shear wave splitting?, Rev. Geophys., 37 (1), , Schmeling, H., Numerical models on the influence of partial melt on elastic, anelastic and electric properties of rocks. PartI: elasticity and anelasticity, Phys. Earth Planet. Int., 41, 34-57, Schmidt, M.W., and S. Poli, Experimentally based water budgets for dehydrating slabs and consequences for arc magma generation, Earth Planet Sci Lett, 163, , Scott, D.R., and D.J. Stevenson, Magma ascent by porous flow, J. Geophys. Res., 91, , Sekiguchi, S., Three-dimensional Q structure beneath the Kanto- Tokai district, Japan, Tectonophysics, 195, ,
28 Shen, Y., and D.W. Forsyth, Geochemical constraints on initial and final depths of melting beneath mid-ocean ridges, J. Geophys. Res., 100 (B2), , Shih, X.R., J.F. Schneider, and R.P. Meyer, Polarities of P and S waves, and shear wave splitting observed from the Bucaramanga nest, Colombia, J. Geophys. Res., 96 (B7), 12,069-12,082, Silver, P.G., and W.W. Chan, Shear wave splitting and subcontinental mantle deformation, J. Geophys. Res., 96, , Smith, G.P., D.A. Wiens, K.M. Fisher, L.M. Dorman, S.C. Webb, and J.A. Hildebrand, A complex pattern of mantle flow in the Lau backarc, Science, 292, , Smyth, J.R., A crystallographic model for hydrous wadsleyite: An ocean in the earth's interior?, Am. Mineral., 79, , Sobolev, S.V., H. Zeyen, G. Stoll, F. Werling, R. Altherr, and K. Fuchs, Upper mantle temperatures from teleseismic tomography of French Massif Central including effects of composition, mineral reactions, anharmonicity, anelasticity, and partial melt, Earth Planet. Sci. Lett., 139, , Takei, Y., Constitutive mechanical relations of solid-liquid composites in terms of grain-boundary contiguity, J. Geophys. Res., 103, 18,183-18,204, Takei, Y., Acoustic properties of partially molten media studied on a simple binary system with a controllable dihedral angle, J. Geophys. Res., 105, , Tanimoto, T., and D.L. Anderson, Mapping convection in the mantle, Geophys. Res. Lett., 11, , Tatsumi, Y., Migration of fluid phases and genesis of basalt magmas in subduction zones, J. Geophys. Res., 94, , Thompson, A.B., Water in the Earth's upper mantle, Nature, 358, , Tommasi, A., Forward modeling of the development of seismic anisotropy in the upper mantle, Earth Planet. Sci. Lett., 160, 1-13, Tsumura, N., A. Hasegawa, and S. Horiuchi, Simultaneous estimation of attenuation structure, source parameters and site response spectra -- application to the northeastern part of Honshu, Japan, Phys. Earth Planet. Int., 93, , Tsumura, N., S. Matsumoto, S. Horiuchi, and A. Hasagawa, Three-dimensional attenuation structure beneath the northeastern Japan arc estimated from spectra of small earthquakes, Tectonophysics, 319, , Turner, S., and C. Hawkesworth, Constraints on flux rates and mantle dynamics beneath island arcs from Tonga-Kermadec lava geochemistry, Nature, 389, , Turner, S., and C. Hawkesworth, Using geochemistry to map mantle flow beneath the Lau basin, Geology, 26, , Van der Hilst, R., R. Engdahl, W. Spakman, and G. Nolet, Tomographic imaging of subducted lithosphere below northwest Pacific island arcs, Nature, 353, 37-42, Verma, R.K., Elasticity of some high-density crystals, J. Geophys. Res., 65, ,
29 Waff, H.S., and U.H. Faul, Effects of crystalline anisotropy on fluid distribution in ultramafic partial melts, J. Geophys. Res., 97, , Webb, S.C., and D.W. Forsyth, Structure of the upper mantle under the EPR from waveform inversion of regional events, Science, 280, , Wendt, J.I., M. Regelous, K.D. Collerson, and A. Ewart, Evidence for a contribution from two mantle plumes to island arc lavas from northern Tonga, Geology, 25, , Wenk, H.-R., K. Bennett, G.R. Canova, and A. Molinari, Modelling plastic deformation of peridotite with the selfconsistent theory, J. Geophys. Res., 96, , Wiens, D. A., G. P. Smith, and S. D. Robertson, Seismological structure and mantle flow patterns in the Lau backarc basin, EOS Trans Am. Geophys. Un., 83, 346, Wiens, D.A., P.J. Shore, J.J. McGuire, E. Roth, M.G. Bevis, and K. Draunidalo, The Southwest Pacific Seismic Experiment, IRIS Newsletter, 14, 1-4, Williams, P.F., Foliation: a review and discussion, Tectonophysics, 39, 305, Xu, Y., and D.A. Wiens, Upper mantle structure of the Southwest Pacific from regional waveform inversion, J. Geophys. Res., 102, , Yang, X., K.M. Fischer, and G.A. Abers, Seismic anisotropy beneath the Shumagin Islands segment of the Aleutian-Alaska subduction zone, J. Geophys. Res., 100, 18,165-18,178, Zhang, S., and S. Karato, Lattice preferred orientation of olivine agregates deformed in simple shear, Nature, 375, , Zhang, S., S. Karato, J. FitzGerald, U. H. Faul, and Y. Zhou, Simple shear deformation of olivine aggregates, Tectonophysics, 316, , Zhao, D., K. Asamori, and H. Iwamori, Seismic structure and magmatism of the young Kyushu subduction zone, Geophys. Res. Lett., 27, , Zhao, D., D. Christensen, and H. Pulpan, Tomographic imaging of the Alaska subduction zone, J. Geophys. Res, 100, , Zhao, D., and A. Hasegawa, P wave tomographic imaging of the crust and upper mantle beneath the Japan Islands, J. Geophys. Res., 98, , Zhao, D., A. Hasegawa, and S. Horiuchi, Tomographic imaging of P and S wave velocity structure beneath northeastern Japan, J. Geophys. Res., 97, 19, , Zhao, D., A. Hasegawa, and H. Kanamori, Deep structure of the Japan subduction zone as derived from local, regional, and teleseismic events, J. Geophys. Res., 99, , Zhao, D., Y. Xu, D.A. Wiens, L. Dorman, J. Hildebrand, and S. Webb, Depth extent of the Lau back-arc spreading center and its relationship to the subduction process, Science, 278, , Department of Earth and Planetary Sciences, Washington University, 1 Brookings Dr., St. Louis, MO 63130, doug@seismo.wustl.edu 29
30 30 FIGURE CAPTIONS Figure 1. (a) Vp and (b) Vs velocity reduction and (c) the Vp/Vs ratio as a function of temperature and partial melt content (after Hammond and Humphreys, [2000b]). The horizontal axis plots temperature (in C) relative to the solidus. Thin vertical lines indicate melt fractions of F= 0%, 1%, and 2%. The velocity reductions were calculated using a finite element method incorporating experimentally observed melt topologies [Faul et al., 1994]. Melt percent as a function of temperature is calculated for water-free mantle at 30 km depth. This calculation assumes that the melt is contained in tubules at melt fractions below 1%. Attenuation is assumed to vary exponentially with temperature as described by Jackson et al. [1992], with Q values of Q α = 90 and Q β = 40 at the solidus (T S = 1240 C). Velocity reduction is calculated relative to a reference temperature T 0 = 1000 C; lower reference temperatures would give somewhat larger velocity reductions. Plate1. Vertical cross sections of P wave velocity perturbations (in percent) relative to an average Japan arc model in northern Japan along profiles AA', BB', and CC' (after Zhao et al., [1992]). The slices are taken from a 3-D tomographic model computed from ~14,000 P wave arrivals and additional converted phases. Red and blue colors denote low and high velocity respectively, and microearthquakes within a 60 km width along the profiles are shown as open circles. The land area and active volcanoes are shown at the top of each figure by bold horizontal lines and red triangles. Plate 2. Vertical cross section of P wave velocity anomalies perpendicular to the strike of the Tonga subduction zone from a tomographic inversion (after Zhao et al., [1997]). This image was computed from ~41,000 local and teleseismic P-wave arrivals. Solid triangles denote active volcanoes. Earthquakes within 40 km of the cross section are shown as circles. The velocity perturbation scale relative to the IASPEI91 velocity model is shown at the bottom. Figure 2. Shear wave velocity models for the Lau Basin, the North Fiji basin, the South Fiji basin, and the old Pacific plate (from Wiens et al. [2002]). Models were obtained by inversion of the entire vertical and transverse wavetrains at regional distance stations (distance 500 to 1600 km) between 5 and 60 mhz frequencies. Radial anisotropy is shown as separate SH and SV structures for each region. Back arcs with active spreading centers (the Lau Basin and the North Fiji Basin) show exceptionally slow seismic velocities in the uppermost mantle, whereas the inactive South Fiji Basin shows an intermediate structure and the Pacific Plate is exceptionally fast. The velocity structures of the backarc basins are indistinguishable beneath 100 km, but remain slower than the Pacific plate thoughout the depth range studied. Radial anisotropy is largely confined to the upper 80 km and is smaller in magnitude than in the old Pacific plate. Plate 3. Cross section perpendicular to the Tonga subduction zone showing variations in P wave attenuation (Q α ) (from Roth et al., [1999]). Results were derived from a 2-D tomographic inversion of differential body wave travel times recorded by land stations and ocean bottom seismographs. Red color indicates high attenuation (low Q) and blue indicates low attenuation. Figure 3. The relationship between velocity (δvp ) and attenuation (δq -1 ) anomalies in the Tonga-Lau region (from Roth et al., [2000]). Points represent the velocity and attenuation anomalies at a particular node in the attenuation (Plate 3) and smoothed P-wave velocity models. Higher δq -1 indicates low Q and higher δvp indicates fast velocity anomalies in the tomographic models. The dashed are the temperature and attenuation anomalies expected from experimental relations and the assumption that all anomalies are due to temperature heterogeneity. Theoretical velocity perturbations are generated using the relations in Karato [1993] incorporating the effects of anelasticity, and the attenuation perturbations are generated from Jackson et al., [1992], extrapolated to various depths by scaling Q with homologous temperature. Figure 4. Schematic map of subduction zone fast anisotropy directions from splitting studies. All splitting measurements shown are those in Table 2 that have been determined to occur within the mantle wedge. Numbers correspond to the references in Table 2. The azimuth of each vector is the fast splitting direction, however lengths are kept constant due to the different phases used in the various studies. Figure 5. Shear wave splitting across the Tonga-Lau region [after Smith et al., 2001]. Stations are shown as triangles. Splitting vectors are the result of stacking and averaging all measurements made at each station. Combined splitting observations are plotted at the stations as a vector. The azimuth of each vector is the fast splitting direction and its length is proportional to the splitting time. A 1s splitting vector is shown for scale.
31 31 Figure 6. Schematic diagram of mantle flow in the Tonga-Lau region from geochemical data (after Turner and Hawkesworth [1998]). Seismological data also suggests the existence of north-south oriented mantle flow within the Tonga Arc and Lau backarc [Smith et al., 2001], in agreement with the Helium isotope data [Turner and Hawkesworth,1998]. Figure 7. Streamlines and finite strain ellipses for a 2-D model of corner flow induced by viscous coupling with the downgoing slab [after Fischer et al., 2000]. Strain is assumed to accumulate as material rises past a depth of 410 km, and this model assumes a constant viscosity. Models such as this allow prediction of observed seismic anisotropy using finite strain scaling or polycrystalline plasticity models [Blackman et al., 1996; Tommasi, 1998; Hall et al, 2000] Figure 1. (a) Vp and (b) Vs velocity reduction and (c) the Vp/Vs ratio as a function of temperature and partial melt content (after Hammond and Humphreys, [2000b]). The horizontal axis plots temperature (in C) relative to the solidus. Thin vertical lines indicate melt fractions of F= 0%, 1%, and 2%. The velocity reductions were calculated using a finite element method incorporating experimentally observed melt topologies [Faul et al., 1994]. Melt percent as a function of temperature is calculated for water-free mantle at 30 km depth. This calculation assumes that the melt is contained in tubules at melt fractions below 1%. Attenuation is assumed to vary exponentially with temperature as described by Jackson et al. [1992], with Q values of Q α = 90 and Q β = 40 at the solidus (T S = 1240 C). Velocity reduction is calculated relative to a reference temperature T 0 = 1000 C; lower reference temperatures would give somewhat larger velocity reductions. Plate 1. Vertical cross sections of P wave velocity perturbations (in percent) relative to an average Japan arc model in northern Japan along profiles AA', BB', and CC' (after Zhao et al., [1992]). The slices are taken from a 3-D tomographic model computed from ~14,000 P wave arrivals and additional converted phases. Red and blue colors denote low and high velocity respectively, and microearthquakes within a 60 km width along the profiles are shown as open circles. The land area and active volcanoes are shown at the top of each figure by bold horizontal lines and red triangles. Plate 2. Vertical cross section of P wave velocity anomalies perpendicular to the strike of the Tonga subduction zone from a tomographic inversion (after Zhao et al., [1997]). This image was computed from ~41,000 local and teleseismic P-wave arrivals. Solid triangles denote active volcanoes. Earthquakes within 40 km of the cross section are shown as circles. The velocity perturbation scale relative to the IASPEI91 velocity model is shown at the bottom. Figure 2. Shear wave velocity models for the Lau Basin, the North Fiji basin, the South Fiji basin, and the old Pacific plate (from Wiens et al. [2002]). Models were obtained by inversion of the entire vertical and transverse wavetrains at regional distance stations (distance 500 to 1600 km) between 5 and 60 mhz frequencies. Radial anisotropy is shown as separate SH and SV structures for each region. Back arcs with active spreading centers (the Lau Basin and the North Fiji Basin) show
32 32 exceptionally slow seismic velocities in the uppermost mantle, whereas the inactive South Fiji Basin shows an intermediate structure and the Pacific Plate is exceptionally fast. The velocity structures of the backarc basins are indistinguishable beneath 100 km, but remain slower than the Pacific plate thoughout the depth range studied. Radial anisotropy is largely confined to the upper 80 km and is smaller in magnitude than in the old Pacific plate. Plate 3. Cross section perpendicular to the Tonga subduction zone showing variations in P wave attenuation (Q α ) (from Roth et al., [1999]). Results were derived from a 2-D tomographic inversion of differential body wave travel times recorded by land stations and ocean bottom seismographs. Red color indicates high attenuation (low Q) and blue indicates low attenuation. Figure 3. The relationship between velocity (δvp) and attenuation (δq -1 ) anomalies in the Tonga-Lau region (from Roth et al., [2000]). Points represent the velocity and attenuation anomalies at a particular node in the attenuation (Plate 3) and smoothed P-wave velocity models. Higher δq -1 indicates low Q and higher δvp indicates fast velocity anomalies in the tomographic models. The dashed are the temperature and attenuation anomalies expected from experimental relations and the assumption that all anomalies are due to temperature heterogeneity. Theoretical velocity perturbations are generated using the relations in Karato [1993] incorporating the effects of anelasticity, and the attenuation perturbations are generated from Jackson et al., [1992], extrapolated to various depths by scaling Q with homologous temperature. Figure 4. Schematic map of subduction zone fast anisotropy directions from splitting studies. All splitting measurements shown are those in Table 2 that have been determined to occur within the mantle wedge. Numbers correspond to the references in Table 2. The azimuth of each vector is the fast splitting direction, however lengths are kept constant due to the different phases used in the various studies. Figure 5. Shear wave splitting across the Tonga-Lau region [after Smith et al., 2001]. Stations are shown as triangles. Splitting vectors are the result of stacking and averaging all measurements made at each station. Combined splitting observations are plotted at the stations as a vector. The azimuth of each vector is the fast splitting direction and its length is proportional to the splitting time. A 1s splitting vector is shown for scale. Figure 6. Schematic diagram of mantle flow in the Tonga-Lau region from geochemical data (after Turner and Hawkesworth [1998]). Seismological data also suggests the existence of northsouth oriented mantle flow within the Tonga Arc and Lau backarc [Smith et al., 2001], in agreement with the Helium isotope data [Turner and Hawkesworth,1998]. Figure 7. Streamlines and finite strain ellipses for a 2-D model of corner flow induced by viscous coupling with the downgoing slab [after Fischer et al., 2000]. Strain is assumed to accumulate as material rises past a depth of 410 km, and this model assumes a
33 33 constant viscosity. Models such as this allow prediction of observed seismic anisotropy using finite strain scaling or polycrystalline plasticity models [Blackman et al., 1996; Tommasi, 1998; Hall et al, 2000] STRUCTURE AND FLOW PATTERNS WITHIN THE MANTLE WEDGE STRUCTURE AND FLOW PATTERNS WITHIN THE MANTLE WEDGE STRUCTURE AND FLOW PATTERNS WITHIN THE MANTLE WEDGE STRUCTURE AND FLOW PATTERNS WITHIN THE MANTLE WEDGE STRUCTURE AND FLOW PATTERNS WITHIN THE MANTLE WEDGE STRUCTURE AND FLOW PATTERNS WITHIN THE MANTLE WEDGE STRUCTURE AND FLOW PATTERNS WITHIN THE MANTLE WEDGE STRUCTURE AND FLOW PATTERNS WITHIN THE MANTLE WEDGE STRUCTURE AND FLOW PATTERNS WITHIN THE MANTLE WEDGE STRUCTURE AND FLOW PATTERNS WITHIN THE MANTLE WEDGE STRUCTURE AND FLOW PATTERNS WITHIN THE MANTLE WEDGE STRUCTURE AND FLOW PATTERNS WITHIN THE MANTLE WEDGE STRUCTURE AND FLOW PATTERNS WITHIN THE MANTLE WEDGE STRUCTURE AND FLOW PATTERNS WITHIN THE MANTLE WEDGE STRUCTURE AND FLOW PATTERNS WITHIN THE MANTLE WEDGE WIENS AND SMITH WIENS AND SMITH WIENS AND SMITH WIENS AND SMITH WIENS AND SMITH WIENS AND SMITH WIENS AND SMITH WIENS AND SMITH WIENS AND SMITH WIENS AND SMITH WIENS AND SMITH WIENS AND SMITH WIENS AND SMITH
34 WIENS AND SMITH 34
35 35 Table 1. Temperature derivatives of elastic wave velocities for olivine in the upper mantle (from Karato, [1993]). Q lnvp / T (10-4 K -1 ) lnv S / T (10-4 K -1 ) Note: Temperature derivatives for the anharmonic case (Q = ) are from Isaak [1992]
36 36 Table 2. Qualitative effect of various parameters on seismic observables Temperature Partial Melt Composition Water Content V p anomaly Large Large Modest Modest-Large? V s anomaly Large Very Large Modest Modest-Large? ν = lnv s / lnv variable ~ 1.5? Q -1 anomaly Large Small Small Large?
37 37 Table 3: Splitting occurring within the mantle wedge Subduction Zone Fast Direction Splitting References Northern Chile Arc parallel close to trench Local S 0.5s (1) Parallel to Nazca APM in east Local S 0.5s (1) Aleutians Arc Parallel Local S 0.35s (2) Mid-Kurils Parallel convergence direction ss-s 2.0s (3) Local S 1.0s Kamchatka Arc Parallel ss-s 2.0s, Local S 1.0s (3) Northern Japan Parallel convergence direction Local S 1.0s (4) Izu-Bonin Parallel convergence direction Local S 1.0s (5) 10 from convergence direction Local S 0.8s (6) Japan Arc Parallel Local S 0.4s (5) Western Honshu Arc Parallel Local S 0.8s (5) 10 from Arc Parallel Local S 0.8s (6) Marianas 20 from APM S, ScS, SKS 0.4s (7) Tonga Parallel convergence direction (Backarc) SKS, Local S >1s (8) Arc Parallel (Volcanic arc) SKS, Local S >1s (9) Hikurangi (New Zealand) No shallow wedge splitting Arc parallel Local S SKS, 1.5s (10) (11) (1) Polet et al. 2000, (2) Yang et al. 1995, (3) Fischer and Yang, 1994; (4) Sandvol and Ni, 1997; (5) Fouch and Fischer, 1996; (6) Hiramatsu et al. 1998; (7) Fouch and Fischer, 1998; (8) Fischer and Wiens, 1996; (9) Smith et al., 2000; (10) Gledhill and Stuart, 1996; (11) Marson-Pidgeon et al., 2001 Absolute plate motion (APM)
38 38 Table 4: Splitting observations attributed to anisotropy beneath the slab Subduction Zone Fast Direction Splitting References South America Arc parallel SKS 3.0s (1) (2) Arc perpendicular at SKS 3.0s (1) 16S, 24S and 33S Northern Chile Nazca APM SKS 1s (3) (4) Brazil, Peru Arc Parallel SKS <1s (4) Kamchatka Arc Parallel SKS 0.6s (5) Sakhalin Island 40 from convergence SKS 1.5s (6) (7) direction N. Japan (43N) Sub-parallel SKS 1.0s (6) convergence N. Japan (41N) Arc Parallel SKS 1.0s (7) Western Honshu Arc Parallel SKS 1.5s (7) Hikurangi Arc Parallel SKS 1.2s (8) (New Zealand) (1) Russo and Silver, 1994; (2) Shih et al., 1991 (3) Polet et al. 2000, (4) Bock, Kind, Rudloff, Asch, 1998; (5) Peyton et al., 2001; (6) Sandvol and Ni, 1997; (7) Fouch and Fischer, 1996; (8) Gledhill and Gubbins, 1996 Absolute plate motion (APM)
39 15 a) F = 0% 1% 2% %V P R eduction b) %V S R eduction c ) V P /V S (T - T s )


40
41 6 4 δ(1/qp) x Depth 500 km km km km 300 km km δvp (km/s)
42 90û 120û 150û 180û 210û 240û 270û 300û 60û 60û 30û (4,5) (3) (5) (4) (5,6) (5,6) (5) (3) (2) 30û (7) 0û 0û (8) (9) (1) -30û -30û (11) -60û -60û 90û 120û 150û 180û 210û 240û 270û 300û

43 176û 180û 184û 188û -16û 1s -16û F iji F racture Zone F iji Plateau Pacific-Australian Plate convergence -20û -20û L au B asin T onga T rench 176û 180û 184û 188û
44 S amoa Opening Lau Basin T onga island arc T onga trench N P late tearing A us tralian Infiltrating S amoan plume 40 mm yr mm yr -1 W E S P ac ific Influxing Indian mantle mm yr -1 down-welling against P acific plate mm yr mm yr -1 P acific mantle
")
45 Depth (km) Distance from the Trench (km) 0
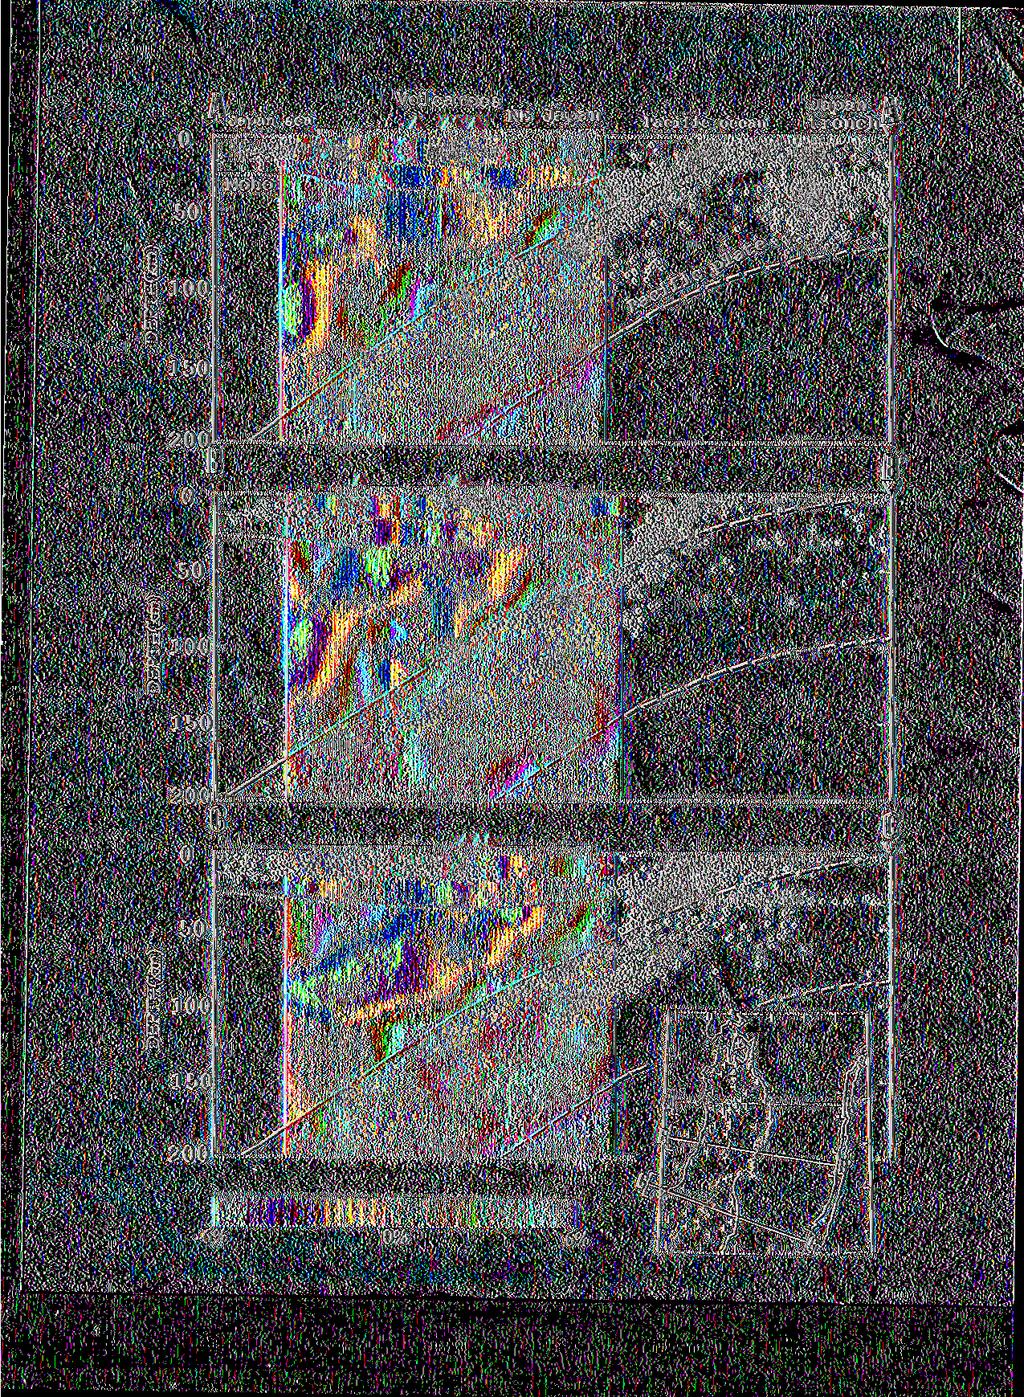
46
47 0 F iji L au S preading C enter T onga A rc P ac ific P late Depth (km) % 0% +6% P veloc ity anomaly

48 Depth (km) F iji I slands L au R idge L au Spreading Center T onga I slands T rench Niue ß ß α ßß ßßß ßßßß ßßßß ßßßß ßßßß ßßßß ßßßß ßßßß ßßßß ßßßß ßßßßßßßßßß
Seismic Anisotropy and Mantle Flow in the Izu-Bonin-Mariana Subduction System
 Seismic Anisotropy and Mantle Flow in the Izu-Bonin-Mariana Subduction System Matthew J. Fouch (Department of Geological Sciences, Arizona State University, Tempe, AZ 85287, email: fouch@asu.edu) INTRODUCTION
Mantle Structure and Flow Patterns Beneath Active Back-Arc Basins Inferred from Passive Seismic and Electromagnetic Methods
 Mantle Structure and Flow Patterns Beneath Active Back-Arc Basins Inferred from Passive Seismic and Electromagnetic Methods Douglas A. Wiens Dept. of Earth and Planetary Sciences, Washington University,
Seismic characterization of mantle flow in subduction systems: Can we resolve a hydrated mantle wedge?
 Earth and Planetary Science Letters 243 (2006) 632 649 www.elsevier.com/locate/epsl Seismic characterization of mantle flow in subduction systems: Can we resolve a hydrated mantle wedge? Teresa Mae Lassak
Dynamic processes in the mantle wedge
 Mantle Processes and Geodynamics Dynamic processes in the mantle wedge Ikuko Wada Woods Hole Oceanographic Institution Something Amazing: Despite the apparent complexity of the mantle wedge dynamics, the
The Seismic Structure and Dynamics of the Mantle Wedge
 Annu. Rev. Earth Planet. Sci. 2008. 36:421 55 First published online as a Review in Advance on February 12, 2008 The Annual Review of Earth and Planetary Sciences is online at earth.annualreviews.org This
ANOTHER MEXICAN EARTHQUAKE! Magnitude 7.1, Tuesday Sept. 19, 2017
 ANOTHER MEXICAN EARTHQUAKE! Magnitude 7.1, Tuesday Sept. 19, 2017 Why is there no oceanic crust older than 200 million years? SUBDUCTION If new oceanic crust is being continuously created along the earth
PEAT SEISMOLOGY Lecture 9: Anisotropy, attenuation and anelasticity
 PEAT8002 - SEISMOLOGY Lecture 9: Anisotropy, attenuation and anelasticity Nick Rawlinson Research School of Earth Sciences Australian National University Anisotropy Introduction Most of the theoretical
Investigating Causes of D Anisotropy
 Investigating Causes of D Anisotropy J.-M. Kendall and P. G. Silver in: The Core-Mantle Boundary Region, AGU, 1998. MDL 3/15/04 Although most of the lower mantle (below 660km) appears to be isotropic,
The influence of short wavelength variations in viscosity on subduction dynamics
 1 Introduction Deformation within the earth, driven by mantle convection due primarily to cooling and subduction of oceanic lithosphere, is expressed at every length scale in various geophysical observations.
Slabs, plumes and their interaction: new insights from global anisotropy tomography
 Slabs, plumes and their interaction: new insights from global anisotropy tomography Ana M G Ferreira Seismological Laboratory, Department of Earth Sciences University College London, UK Sung-Joon Chang,
Structure of the Earth and the Origin of Magmas
 Page 1 of 12 EENS 2120 Petrology Tulane University Prof. Stephen A. Nelson Structure of the Earth and the Origin of Magmas This document last updated on 23-Jan-2015 Magmas do not form everywhere beneath
Shear-wave anisotropy beneath the Ryukyu arc
 LETTER Earth Planets Space, 61, 1197 1202, 2009 Shear-wave anisotropy beneath the Ryukyu arc Mamoru Nakamura and Ai Yamamoto Department of Physics and Earth Sciences, Faculty of Science, University of
The Earth s Structure from Travel Times
 from Travel Times Spherically symmetric structure: PREM - Crustal Structure - Upper Mantle structure Phase transitions Anisotropy - Lower Mantle Structure D D - Structure of of the Outer and Inner Core
Subduction zones 3 arc magmatism
 5. 3 Subduction zones 3 arc magmatism Where can we observe magmatic/volcanic activities along subduction zones? Characteristics of arc magmatism (vs. mid-ocean ridge/intraplate magmatism) Structure of
THE STUDY OF ANISOTROPY IN THE SUBD ZONES AROUND JAPAN.( Dissertation_ 全.
 Title THE STUDY OF ANISOTROPY IN THE SUBD ZONES AROUND JAPAN.( Dissertation_ 全 Author(s) Hiramatsu, Yoshihiro Citation Kyoto University ( 京都大学 ) Issue Date 1996-03-23 URL http://dx.doi.org/10.11501/3083963
Plate Tectonics. entirely rock both and rock
 Plate Tectonics I. Tectonics A. Tectonic Forces are forces generated from within Earth causing rock to become. B. 1. The study of the origin and arrangement of Earth surface including mountain belts, continents,
Physics of the Earth and Planetary Interiors
 Physics of the Earth and Planetary Interiors 181 (2010) 141 154 Contents lists available at ScienceDirect Physics of the Earth and Planetary Interiors journal homepage: www.elsevier.com/locate/pepi Frequency-dependent
Geoffrey Abers. Water and volcanism. Imaging. Lessons from Central America. Oceanic. Terrestrial
 Imaging Circum-Pacific Subduction Zones with Earthquakes: Fluid Pathways and the Origins of Volcanic Arcs Geoffrey Abers Oceanic Terrestrial Water and volcanism Imaging Lessons from Central America Wet
An Introduction of Aleutian Subduction Zone. Chuanmao Yang, Hong Yang, Meng Zhang, Wenzhong Wang 2016/04/29
 An Introduction of Aleutian Subduction Zone Chuanmao Yang, Hong Yang, Meng Zhang, Wenzhong Wang 2016/04/29 Outline General Introduction Formation history Structure from seismic study geochemical features
Seismology 5: Body wave anisotropy
 Seismology 5: Body wave anisotropy what it is, how we study it, and what it can tell us about flow in the deep Earth Maureen D. Long, Yale University CIDER 7/8/16 Road map for today s talk Part I: Some
GEOPHYSICAL RESEARCH LETTERS, VOL. 35, L14308, doi: /2008gl034461, 2008
 Click Here for Full Article GEOPHYSICAL RESEARCH LETTERS, VOL. 35,, doi:10.1029/2008gl034461, 2008 Tomographic evidence for hydrated oceanic crust of the Pacific slab beneath northeastern Japan: Implications
3D IMAGING OF THE EARTH S MANTLE: FROM SLABS TO PLUMES
 3D IMAGING OF THE EARTH S MANTLE: FROM SLABS TO PLUMES Barbara Romanowicz Department of Earth and Planetary Science, U. C. Berkeley Dr. Barbara Romanowicz, UC Berkeley (KITP Colloquium 9/11/02) 1 Cartoon
Remote Sensing of the Earth s Interior
 Remote Sensing of the Earth s Interior Earth s interior is largely inaccessible Origin and Layering of the Earth: Geochemical Perspectives Composition of Earth cannot be understood in isolation Sun and
Geophysical Constraints on Incoming Plate Hydration
 Geophysical Constraints on Incoming Plate Hydration Douglas A. Wiens Dept. of Earth and Planetary Sciences Washington University, St. Louis, MO, USA Subduction Cycles the Incoming Plate Subduction Input
5: ABSOLUTE PLATE MOTIONS & HOTSPOTS
 5-1 5: ABSOLUTE PLATE MOTIONS & HOTSPOTS 1 Relative motions between plates are most important In some applications important to consider absolute plate motions, those with respect to the deep mantle ABSOLUTE
Constitution of Magmas. Magmas. Gas Law. Composition. Atomic Structure of Magma. Structural Model. PV = nrt H 2 O + O -2 = 2(OH) -
 -") Constitution of Magmas Magmas Best, Ch. 8 Hot molten rock T = 700-1200 degrees C Composed of ions or complexes Phase Homogeneous Separable part of the system With an interface Composition Most components
Constitution of Magmas Magmas Best, Ch. 8 Hot molten rock T = 700-1200 degrees C Composed of ions or complexes Phase Homogeneous Separable part of the system With an interface Composition Most components
G 3. AN ELECTRONIC JOURNAL OF THE EARTH SCIENCES Published by AGU and the Geochemical Society
 Geosystems G 3 AN ELECTRONIC JOURNAL OF THE EARTH SCIENCES Published by AGU and the Geochemical Society Article Volume 3, Number 9 2 September 22 862, doi:1.129/21gc247 ISSN: 1525-227 Seismic anisotropy
Regional 3D velocity structure
 Seismic imaging: Regional 3D velocity structure 3 Seismic anisotropy courtesy of Ed Garnero This is birefringence: tells us about the preferential orientation of minerals 1 Anisotropy beneath the East
Compositional Controls on Oceanic Plates: Geophysical Evidence from the MELT Area.
 1 Compositional Controls on Oceanic Plates: Geophysical Evidence from the MELT Area. Rob. L. Evans 1, Greg Hirth 1, Kiyoshi Baba 2, Don Forsyth 3, Alan Chave 4 and Randall Mackie 5 1. Dept of Geology and
G 3. AN ELECTRONIC JOURNAL OF THE EARTH SCIENCES Published by AGU and the Geochemical Society
 Geosystems G 3 AN ELECTRONIC JOURNAL OF THE EARTH SCIENCES Published by AGU and the Geochemical Society Article Volume 9, Number 1 26 January 2008 Q01003, doi:10.1029/2007gc001677 ISSN: 1525-2027 Effect
Textures in experimentally deformed olivine aggregates: the effects of added water and melt.
 Textures in experimentally deformed olivine aggregates: the effects of added water and melt. F. Heidelbach 1, a, B. Holtzman 2, b, S. Hier-Majumder 2, c and D. Kohlstedt 2, d 1 Bayerisches Geoinstitut,
Chapter 12 Lecture. Earth: An Introduction to Physical Geology. Eleventh Edition. Earth s Interior. Tarbuck and Lutgens Pearson Education, Inc.
 Chapter 12 Lecture Earth: An Introduction to Physical Geology Eleventh Edition Earth s Interior Tarbuck and Lutgens Earth s Internal Structure Earth s interior can be divided into three major layers defined
Whole Mantle Convection
 Whole Mantle Convection Overview 1. Evidence for whole mantle convection 2. Model of whole mantle convection reconciling geophysical and geochemical data Transition Zone Water Filter Model 3. Evidence
Seismotectonics of intraplate oceanic regions. Thermal model Strength envelopes Plate forces Seismicity distributions
 Seismotectonics of intraplate oceanic regions Thermal model Strength envelopes Plate forces Seismicity distributions Cooling of oceanic lithosphere also increases rock strength and seismic velocity. Thus
Features of Tectonic Plates
 Features of Tectonic Plates PowerPoint 12.2 The Earth s Layers Crust Brittle Continental crust composed mainly of granite Oceanic crust composed mainly of basalt Mantle Denser than the crust Upper is molten
The importance of the South-American plate motion and the Nazca Ridge subduction on flat subduction below South Peru
 Chapter 7 The importance of the South-American plate motion and the Nazca Ridge subduction on flat subduction below South Peru Abstract Flat subduction near Peru occurs only where the thickened crust of
Tracing rays through the Earth
 Tracing rays through the Earth Ray parameter p: source receiv er i 1 V 1 sin i 1 = sin i 2 = = sin i n = const. = p V 1 V 2 V n p is constant for a given ray i 2 i 3 i 4 V 2 V 3 V 4 i critical If V increases
Global Tectonics. Kearey, Philip. Table of Contents ISBN-13: Historical perspective. 2. The interior of the Earth.
 Global Tectonics Kearey, Philip ISBN-13: 9781405107778 Table of Contents Preface. Acknowledgments. 1. Historical perspective. 1.1 Continental drift. 1.2 Sea floor spreading and the birth of plate tectonics.
Rare Earth Elements in some representative arc lavas
 Rare Earth Elements in some representative arc lavas Low-K (tholeiitic), Medium-K (calc-alkaline), and High-K basaltic andesites and andesites. A typical N-MORB pattern is included for reference Notes:
Topic 5: The Dynamic Crust (workbook p ) Evidence that Earth s crust has shifted and changed in both the past and the present is shown by:
 Evidence that Earth s crust has shifted and changed in both the past and the present is shown by:") Topic 5: The Dynamic Crust (workbook p. 65-85) Evidence that Earth s crust has shifted and changed in both the past and the present is shown by: --sedimentary horizontal rock layers (strata) are found
Topic 5: The Dynamic Crust (workbook p. 65-85) Evidence that Earth s crust has shifted and changed in both the past and the present is shown by: --sedimentary horizontal rock layers (strata) are found
Modeling the Thermal-Mechanical Behavior of Mid-Ocean Ridge Transform Faults
 Excerpt from the Proceedings of the COMSOL Conference 2008 Boston Modeling the Thermal-Mechanical Behavior of Mid-Ocean Ridge Transform Faults Emily C Roland *1, Mark Behn,2 and Greg Hirth 3 1 MIT/WHOI
4 Deforming the Earth s Crust
 CHAPTER 7 4 Deforming the Earth s Crust SECTION Plate Tectonics BEFORE YOU READ After you read this section, you should be able to answer these questions: What happens when rock is placed under stress?
MYRES Seismic Constraints on Boundary Layers. Christine Thomas
 MYRES 2004 Seismic Constraints on Boundary Layers Christine Thomas Outline Seismic constraints: what can we resolve? how can we detect seismic structures? how well can we resolve these structures? (resolution
3. PLATE TECTONICS LAST NAME (ALL IN CAPS): FIRST NAME: PLATES
: FIRST NAME: PLATES") LAST NAME (ALL IN CAPS): FIRST NAME: PLATES 3. PLATE TECTONICS The outer layers of the Earth are divided into the lithosphere and asthenosphere. The division is based on differences in mechanical properties
LAST NAME (ALL IN CAPS): FIRST NAME: PLATES 3. PLATE TECTONICS The outer layers of the Earth are divided into the lithosphere and asthenosphere. The division is based on differences in mechanical properties
Complex mantle flow in the Mariana subduction system: evidence from shear wave splitting
 Geophys. J. Int. (27) doi: 1.1111/j.1365-246X.27.3433.x Complex mantle flow in the Mariana subduction system: evidence from shear wave splitting S. H. Pozgay, 1 D. A. Wiens, 1 J. A. Conder, 1 H. Shiobara
Full file at
 Chapter 2 PLATE TECTONICS AND PHYSICAL HAZARDS MULTIPLE-CHOICE QUESTIONS 1. What direction is the Pacific Plate currently moving, based on the chain of Hawaiian Islands with only the easternmost island
Captain s Tryouts 2017
 Captain s Tryouts 2017 Dynamic Planet Test Written by: Araneesh Pratap (Chattahoochee High School) Name: Date: Answer all questions on the answer sheet. Point values are given next to each question or
Magma Formation and Behavior
 Magma Formation and Behavior Questions What causes mantle rock to melt, resulting in magma formation? Why is magma formation restricted to specific plate tectonic settings? Why are mafic (basaltic) magmas
Geodynamics of MARGINS
 Geodynamics of MARGINS Scott King (Virginia Tech), Peter van Keken (Univ. Michigan), Mike Gurnis (Caltech), Marc Spiegelman (Lamont), Shijie Zhong (Univ. Colorado), Magali Billen (U.C. Davis) contact:
Seismic techniques for imaging fractures, cracks and faults in the Earth. Michael Kendall
 Seismic techniques for imaging fractures, cracks and faults in the Earth Michael Kendall Issues and Challanges Geometry (aspect ratio, size, orientation, density) Non-uniqueness (e.g., single set of aligned
OCN 201: Seafloor Spreading and Plate Tectonics I
 OCN 201: Seafloor Spreading and Plate Tectonics I Revival of Continental Drift Theory Kiyoo Wadati (1935) speculated that earthquakes and volcanoes may be associated with continental drift. Hugo Benioff
5. What is an earthquake 6. Indicate the approximate radius of the earth, inner core, and outer core.
 Tutorial Problems 1. Where Do Earthquakes Happen? 2. Where do over 90% of earthquakes occur? 3. Why Do Earthquakes Happen? 4. What are the formulae for P and S velocity 5. What is an earthquake 6. Indicate
Dynamic Crust Practice
 1. Base your answer to the following question on the cross section below and on your knowledge of Earth science. The cross section represents the distance and age of ocean-floor bedrock found on both sides
Shear wave anisotropy beneath the Cascadia subduction zone and western North American craton
 Geophys. J. Int. (2004) 157, 341 353 doi: 10.1111/j.1365-246X.2004.02175.x Shear wave anisotropy beneath the Cascadia subduction zone and western North American craton Claire A. Currie, 1,2, John F. Cassidy,
Crustal Boundaries. As they move across the asthenosphere and form plate boundaries they interact in various ways. Convergent Transform Divergent
 Name: Date: Period: Plate Tectonics The Physical Setting: Earth Science CLASS NOTES Tectonic plates are constantly moving and interacting As they move across the asthenosphere and form plate boundaries
Prentice Hall EARTH SCIENCE
 Prentice Hall EARTH SCIENCE Tarbuck Lutgens Chapter 9 Plate Tectonics 9.1 Continental Drift An Idea Before Its Time Wegener s continental drift hypothesis stated that the continents had once been joined
Prentice Hall EARTH SCIENCE
 Prentice Hall EARTH SCIENCE Tarbuck Lutgens Chapter 9 Plate Tectonics 9.1 Continental Drift An Idea Before Its Time Wegener s continental drift hypothesis stated that the continents had once been joined
What does Seismic Anisotropy tell us about the Lithosphere-Asthenosphere Boundary?
 What does Seismic Anisotropy tell us about the Lithosphere-Asthenosphere Boundary? Jean-Paul Montagner (1), Gael Burgos (1), Eric Beucler (2), Antoine Mocquet (2) and Yann Capdeville (2), Mathias Obrebski
Gravity Tectonics Volcanism Atmosphere Water Winds Chemistry. Planetary Surfaces
 Gravity Tectonics Volcanism Atmosphere Water Winds Chemistry Planetary Surfaces Gravity & Rotation Polar flattening caused by rotation is the largest deviation from a sphere for a planet sized object (as
Lecture 2: Deformation in the crust and the mantle. Read KK&V chapter 2.10
 Lecture 2: Deformation in the crust and the mantle Read KK&V chapter 2.10 Tectonic plates What are the structure and composi1on of tectonic plates? Crust, mantle, and lithosphere Crust relatively light
Geophysical Journal International
 Geophysical Journal International Geophys. J. Int. (2012) 190, 629 649 doi: 10.1111/j.1365-246X.2012.05512.x Seismic anisotropy and heterogeneity in the Alaska subduction zone You Tian and Dapeng Zhao
Convergent plate boundaries. Objective to be able to explain the formation and key features of these zones.
 Convergent plate boundaries Objective to be able to explain the formation and key features of these zones. Destructive plate margins When plates collide due to convection currents/slab pull in the asthenosphere
Beneath our Feet: The 4 Layers of the Earty by Kelly Hashway
 Beneath our Feet: The 4 Layers of the Earty by Kelly Hashway The Earth is more than a giant ball made up of dirt, rocks, and minerals. The Earth may look like a giant ball from when looking at it from
Moho (Mohorovicic discontinuity) - boundary between crust and mantle
 - boundary between crust and mantle") Earth Layers Dynamic Crust Unit Notes Continental crust is thicker than oceanic crust Continental Crust Thicker Less Dense Made of Granite Oceanic Crust Thinner More Dense Made of Basalt Moho (Mohorovicic
Earth Layers Dynamic Crust Unit Notes Continental crust is thicker than oceanic crust Continental Crust Thicker Less Dense Made of Granite Oceanic Crust Thinner More Dense Made of Basalt Moho (Mohorovicic
Sendai Earthquake NE Japan March 11, Some explanatory slides Bob Stern, Dave Scholl, others updated March
 Sendai Earthquake NE Japan March 11, 2011 Some explanatory slides Bob Stern, Dave Scholl, others updated March 14 2011 Earth has 11 large plates and many more smaller ones. Plates are 100-200 km thick
Global variation of body wave attenuation in the upper mantle from teleseismic P wave and S wave spectra
 GEOPHYSICAL RESEARCH LETTERS, VOL. 38,, doi:10.1029/2011gl046812, 2011 Global variation of body wave attenuation in the upper mantle from teleseismic P wave and S wave spectra Y. K. Hwang, 1 J. Ritsema,
Introduction to Subduction Zones
 PAGEOPH, Vol. 128, Nos. 3/4 (1988) 0033~4553/88/040449-0551.50 + 0.20/0 9 1988 Birkh/iuser Verlag, Basel Introduction to Subduction Zones LARRY J. RUFF j and HIROO KANAMORI 2 Subduction zones present many
Regional and local variations in geochemistry and tectonics along and across Central America
 Regional and local variations in geochemistry and tectonics along and across Central America Michael J. Carr, Department of Geological Sciences, Wright Lab Rutgers University, 610 Taylor Rd., Piscataway
Plate Tectonics. Structure of the Earth
 Plate Tectonics Structure of the Earth The Earth can be considered as being made up of a series of concentric spheres, each made up of materials that differ in terms of composition and mechanical properties.
CONTENT. A. Changes in the Crust Facts Changes Construction and Destruction. B. Continental Drift What is it? Evidence
 Name Earth Science Date Period TOPIC THE DYNAMIC EARTH CONTENT A. Changes in the Crust Facts Changes Construction and Destruction B. Continental Drift What is it? Evidence C. Theory of Plate Tectonics
A seismic refraction study of the Cocos plate offshore Nicaragua and Costa Rica Harm Van Avendonk (UTIG, UT Austin)
") A seismic refraction study of the Cocos plate offshore Nicaragua and Costa Rica Harm Van Avendonk (UTIG, UT Austin)! October 18, 2012 "#$%&'($)*!+,!-&./(!01!2/(+! Plate tectonics:!!large fluxes of solids
A seismic refraction study of the Cocos plate offshore Nicaragua and Costa Rica Harm Van Avendonk (UTIG, UT Austin)! October 18, 2012 "#$%&'($)*!+,!-&./(!01!2/(+! Plate tectonics:!!large fluxes of solids
Refer to the map on page 173 to answer the following questions.
 Chapter 8-1 Plate Tectonics 1. Brainstorm the type of evidence that would indicate a climate change and how this evidence supports the theory of continental drift. Tropical fossils in cold regions Evidence
A) B) C) D) 4. Which diagram below best represents the pattern of magnetic orientation in the seafloor on the west (left) side of the ocean ridge?
 B) C) D) 4. Which diagram below best represents the pattern of magnetic orientation in the seafloor on the west (left) side of the ocean ridge?") 1. Crustal formation, which may cause the widening of an ocean, is most likely occurring at the boundary between the A) African Plate and the Eurasian Plate B) Pacific Plate and the Philippine Plate C)
1. Crustal formation, which may cause the widening of an ocean, is most likely occurring at the boundary between the A) African Plate and the Eurasian Plate B) Pacific Plate and the Philippine Plate C)
Mantle Anisotropy at Mid-Ocean Ridges
 Mantle Anisotropy at Mid-Ocean Ridges Andy Nowacki, Michael Kendall, James Wookey (Nowacki et al., EPSL, 2011) Plate spreading and seismic anisotropy Hess, 1964 MOR Anisotropy Anisotropy due to LPO versus
Physical Geology, 15/e
 Lecture Outlines Physical Geology, 15/e Plummer, Carlson & Hammersley Plate Tectonics: The Unifying Theory Physical Geology 15/e, Chapter 19 Plate Tectonics Plate Tectonics Earth s surface is composed
Plates Moving Apart Types of Boundaries
 Plates Moving Apart Types of Boundaries PLATE TECTONICS IS The theory that the Earth s crust is broken into slabs of rock that move around on top of the asthenosphere. How fast are plates moving? The Arctic
Resolving three-dimensional anisotropic structure with shear wave splitting tomography
 Geophys. J. Int. (2008) 173, 859 886 doi: 10.1111/j.1365-246X.2008.03757.x Resolving three-dimensional anisotropic structure with shear wave splitting tomography David L. Abt and Karen M. Fischer Department
Earth and Space Science Semester 2 Exam Review. Part 1. - Convection currents circulate in the Asthenosphere located in the Upper Mantle.
 Earth and Space Science 2015 Semester 2 Exam Review Part 1 Convection -A form of heat transfer. - Convection currents circulate in the Asthenosphere located in the Upper Mantle. - Source of heat is from
Most mafic magmas come from the upper mantle and lower crust. This handout will address five questions:
 Geology 101 Origin of Magma From our discussions of the structure of the interior of the Earth, it is clear that the upper parts of the Earth (crust and mantle) are mostly solid because s-waves penetrate
GEOLOGY MEDIA SUITE Chapter 13
 UNDERSTANDING EARTH, SIXTH EDITION GROTZINGER JORDAN GEOLOGY MEDIA SUITE Chapter 13 Earthquakes 2010 W.H. Freeman and Company Three different types of seismic waves are recorded by seismographs Key Figure
CHAPTER 2 THE WAY THE EARTH WORKS: EXAMINING PLATE TECTONICS
 CHAPTER 2 THE WAY THE EARTH WORKS: EXAMINING PLATE TECTONICS Coverage of plate tectonics is required early in introductory Geology as context for the mineralogy, petrology, structure, internal processes,
Name Class Date. 1. What is the outermost layer of the Earth called?. a. core b. lithosphere c. asthenosphere d. mesosphere
 Name Class Date Assessment Geology Plate Tectonics MULTIPLE CHOICE Write the letter of the correct answer in the space provided. 1. What is the outermost layer of the Earth called?. a. core b. lithosphere
IGPP. Departmental Examination
 IGPP Departmental Examination 1994 Departmental Examination, 1994 This is a 4 hour exam with 12 questions. Write on the pages provided, and continue if necessary onto further sheets. Please identify yourself
Magmatic Processes at Subduction Zones
 Magmatic Processes at Subduction Zones Katherine A. Kelley Graduate School of Oceanography Univ. of Rhode Island Thanks to Terry Plank Erik Hauri GVP: Liz Cottrell Simon Carn Jennifer Jay Ed Venzke Subduction
Plate Tectonics. By Destiny, Jarrek, Kaidence, and Autumn
 Plate Tectonics By Destiny, Jarrek, Kaidence, and Autumn .The Denali Fault and San Andreas Fault - The San Andreas Fault is a continental transform fault that extends roughly 1300 km (810 miles) through
C3.4.1 Vertical (radial) variations in mantle structure
 variations in mantle structure") C3.4 Mantle structure Mantle behaves as a solid on short time scales (seismic waves travel through it and this requires elastic behaviour). Over geological time scales the mantle behaves as a very viscous
C3.4 Mantle structure Mantle behaves as a solid on short time scales (seismic waves travel through it and this requires elastic behaviour). Over geological time scales the mantle behaves as a very viscous
Plates & Boundaries The earth's continents are constantly moving due to the motions of the tectonic plates.
 Plates & Boundaries The earth's continents are constantly moving due to the motions of the tectonic plates. As you can see, some of the plates contain continents and others are mostly under the ocean.
Continental Drift and Plate Tectonics
 Continental Drift and Plate Tectonics Continental Drift Wegener s continental drift hypothesis stated that the continents had once been joined to form a single supercontinent. Wegener proposed that the
Earthquakes. Earthquakes are caused by a sudden release of energy
 Earthquakes Earthquakes are caused by a sudden release of energy The amount of energy released determines the magnitude of the earthquake Seismic waves carry the energy away from its origin Fig. 18.1 Origin
FORCES ON EARTH UNIT 3.2. An investigation into how Newton s Laws of Motion are applied to the tectonic activity on Earth.
 FORCES ON EARTH UNIT 3.2 An investigation into how Newton s Laws of Motion are applied to the tectonic activity on Earth. USE THESE NOTES: OUR HOME PLANET EARTH: What do you know about our planet? SO.HOW
Subduction zones are complex plate boundaries in which variable geometry and structure can be
 1 Chapter 1 Introduction Subduction zones are complex plate boundaries in which variable geometry and structure can be seismically observed. The along-strike transition from flat to normal subduction is
PLATE TECTONICS. Continental Drift. Continental Drift. Continental Drift. Continental Drift- Wegener s Evidence
 Continental Drift PLATE TECTONICS E.B. Taylor (1910) and Alfred Wegener (1915) published on Continental Drift. Continental Drift Wegener s evidence 1. Fit of the Continents 2. Fossil Evidence 3. Rock Type
Standard 2, Objective 1: Evaluate the source of Earth s internal heat and the evidence of Earth s internal structure.
 Standard 2: Students will understand Earth s internal structure and the dynamic nature of the tectonic plates that form its surface. Standard 2, Objective 1: Evaluate the source of Earth s internal heat
10. Paleomagnetism and Polar Wandering Curves.
 Map of ocean floor Evidence in Support of the Theory of Plate Tectonics 10. Paleomagnetism and Polar Wandering Curves. The Earth's magnetic field behaves as if there were a bar magnet in the center of
COMPOSITION and PHYSICAL PROPERTIES GENERAL SUBJECTS. GEODESY and GRAVITY
 COMPOSITION and PHYSICAL PROPERTIES Composition and structure of the continental crust Composition and structure of the core Composition and structure of the mantle Composition and structure of the oceanic
The Theory of Plate Tectonics
 Plate Tectonics Objectives Describe how plates move. Explain the features of plate tectonics. Describe the types of plate boundaries and the features that can form and events that can occur at each. The
Earth as a planet: Interior and Surface layers
 Earth as a planet: Interior and Surface layers Bibliographic material: Langmuir & Broecker (2012) How to build a habitable planet Internal structure of the Earth: Observational techniques Seismology Analysis
Plate Tectonics: A Scientific Revolution Unfolds
 Chapter 2 Lecture Earth: An Introduction to Physical Geology Eleventh Edition Plate Tectonics: A Scientific Revolution Unfolds Tarbuck and Lutgens From Continental Drift to Plate Tectonics Prior to the
Directed Reading. Section: Volcanoes and Plate Tectonics
 Skills Worksheet Directed Reading Section: Volcanoes and Plate Tectonics 1. What can cause some of the most dramatic changes to Earth s surface? a. solar activity b. tides c. geysers d. volcanic eruptions
Earthquakes & Volcanoes
 Earthquakes & Volcanoes Geology - the study of solid Earth, the rocks of which it is composed, and the processes by which they change geo = Earth; ology = study of Earth s Layers Plate Tectonics - the