Soil changes during stockpiling and after reclamation at three Wyoming natural gas production areas
|
|
|
- Marian Williamson
- 6 years ago
- Views:
Transcription
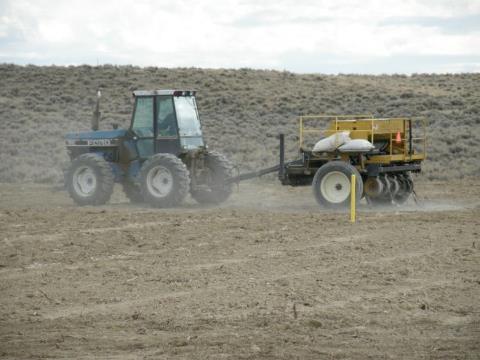
1 Soil changes during stockpiling and after reclamation at three Wyoming natural gas production areas Jay Norton and Calvin Strom University of Wyoming 217 Joint Conference of the American Society of Mining and Reclamation Mine Drainage Task Force Appalachian Regional Reforestation Initiative Morgantown, West Virginia April 12, 217
2
 Germination/establishment; B horizon: zone of accumulation of clays and solutes: ILLUVIATION Less OM, finer texture, higher EC & ph")
3 Soil Function in aridisols and aridic alfisols A horizon: interface with atmosphere: OM accumulation and ELUVIATION; loss of clays, solutes; More OM, coarser texture, lower EC & ph than other horizons; Water infiltration & holding; nutrient cycling (microbes) Germination/establishment; B horizon: zone of accumulation of clays and solutes: ILLUVIATION Less OM, finer texture, higher EC & ph Water holding in finer texture

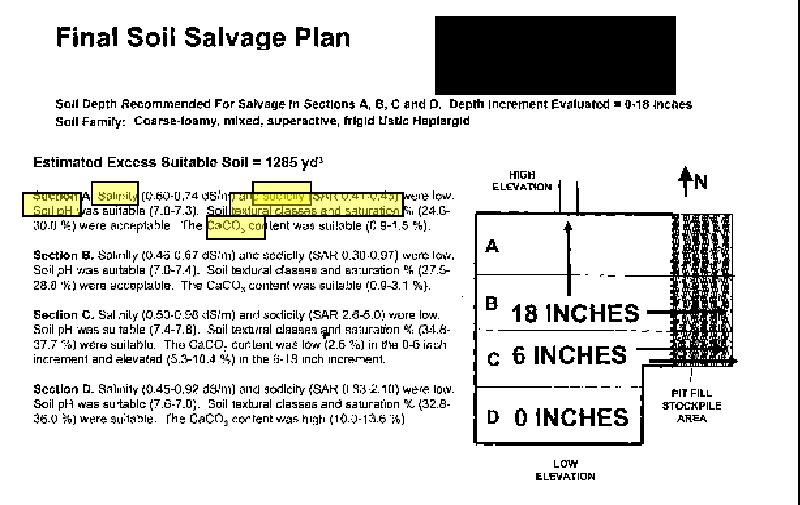
4 One size fits all Salvage & reclamation procedures


5 Pre disturbance: ABSTON FINE, SMECTITIC, FRIGID USTIC NATRARGIDS A E Bt Btn1 sandy loam clay Scraping depth Btn2 Bk Cr


6 After reclamation: ENTISOL Topsoil Clay Clay loam loam Subsoil

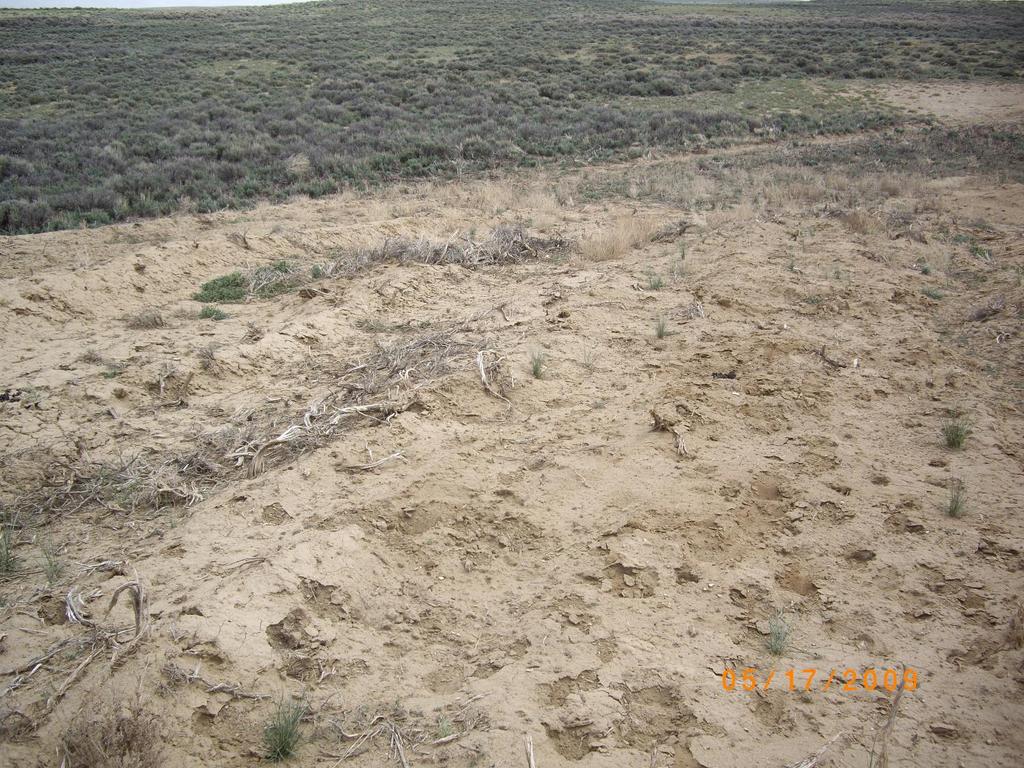
7 Loss of A horizon reduces already slim chances for germination & establishment Lifeless: little SOM to support microbial activity and nutrient cycling; Finer: inhibits water infiltration and facilitates evaporation; Drier: less OM and fine texture decrease plant-available water; Saline: EC > 4; osmotic potential and ion toxicity slow germination; Sodic: ESP > 15 disperses aggregates, exacerbating the above.

8 Pipelines + P&A + Active wells 29,683 Currently Producing Wells On File 121,626 Total Wells On File (DrillingEdge.com)

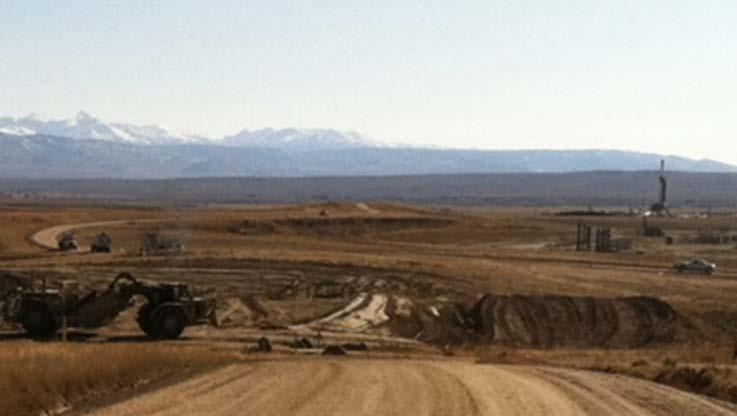
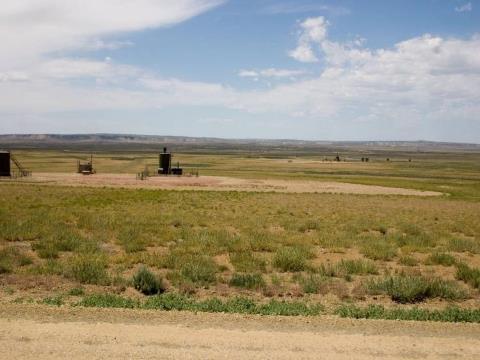
9 Great Divide and Green River Basins Objectives: determine short and longer-term effects of natural gas development and reclamation on soil quality across a precipitation gradient. Effects of topsoil depth on organic matter dynamics 11 inches Aridisols and Entisols formed in saline and sodic marine shales. 9 inches 7 inches
10 Soil Organic Matter Pools STRUCTURAL SOM METABOLIC SOM ACTIVE SOIL ACTIVE C SOM SLOW SOIL Slow C SOM PASSIVE SOM LOSSES: Harvest, CO 2 & N 2 O emissions, erosion etc. PLANT RESIDUE Active, or labile, SOM: Annual turnover Mineral N Mineralizable C& N dissolved organic C & N; Microbial C & N; light fraction C & N. Slow, or protected, SOM: Decades; Same as labile, but protected from mineralization within soil structure. Passive, or stabile, SOM: Centuries to millennia; Humus; Mineral-associated C & N;
 7 6 5 4 3 2 1 Jan Feb Mar Apr May Jun Jul Aug Sep")
11 Pinedale Anticline Elevation: 244 meters MATmax: 11 C MATmin: -6.6 C MAP: 276 mm Annual CV: 26.5% Fine-loamy, mixed, superactive, frigid Calcidic Haplustalfs Precipitation (mm) Jan Feb Mar Apr May Jun Jul Aug Sep Oct Nov Dec Temperature (C)
 6 5 4 3 2 1 Total Precipitation Max.")
12 Jonah Field Elevation: 214 meters MATmax: 11.9 C MATmin: -7.2 C MAP: 232 mm Ann CV: 27% Fine-loamy, mixed, superactive, frigid Calcidic Haplustalfs Precipitation (mm) Total Precipitation Max. Temperature Min. Temperature Jan Feb Mar Apr May Jun Jul Aug Sep Oct Nov Dec Temperature (C)
 6 5 4 3 2 1 Jan Feb Mar Apr May")
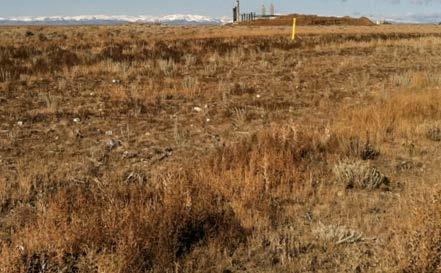
13 Wamsutter/Great Divide Basin Elevation: 265 meters MATmax: 13.2 C MATmin: -2.6 C MAP: 18 mm Ann CV: 32% Fine-loamy, mixed, superactive, frigid Typic Haplargids Precipitation (mm) Jan Feb Mar Apr May Jun Jul Aug Sep Oct Nov Dec Temperature (C)

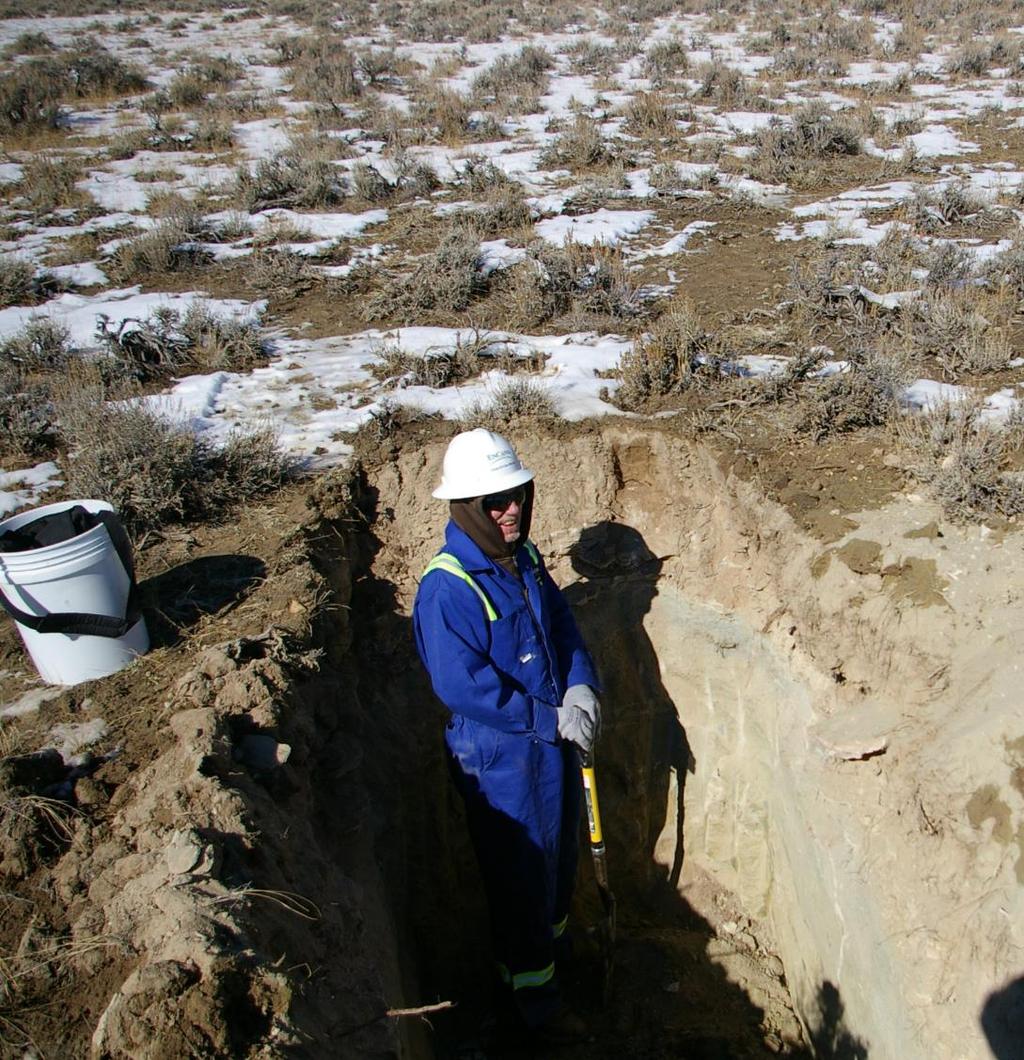
14 Three new well pads sampled at each field starting in 29 (9 points composited) 1. Predisturbance; 2. Stockpile; 3. Respread; 4. 1 year later; 5. 7 years later.


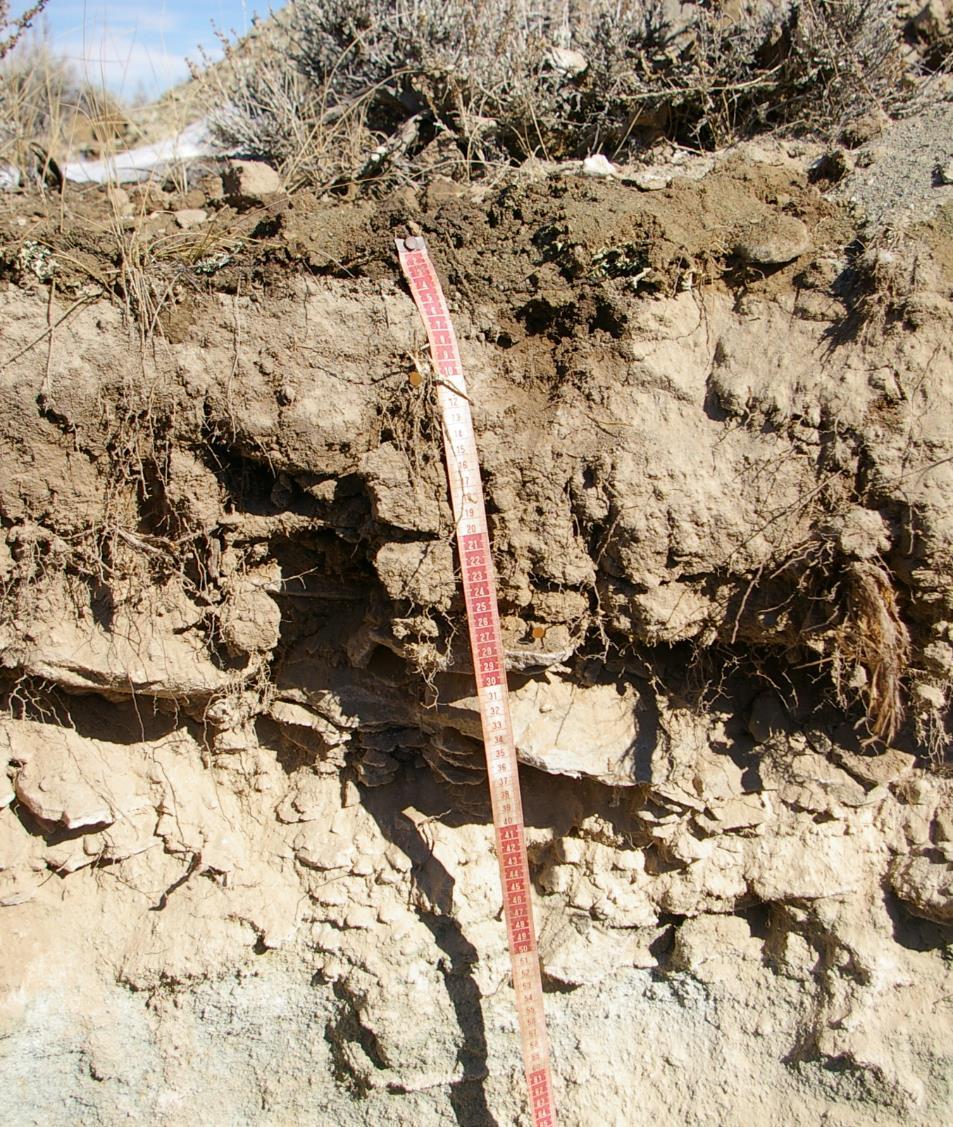
15 Soil samples from -5, 5-2, and 2-3 cm Stockpiles: Three points sampled to 25 cm
16 Data Collection Vegetation cover Physical properties: bulk density, texture Chemical properties: ph, EC Biological properties (total and labile soil organic matter): Total soil organic carbon and nitrogen; Mineral nitrogen; Dissolved organic carbon and nitrogen; Mineralizable organic carbon and nitrogen.
17

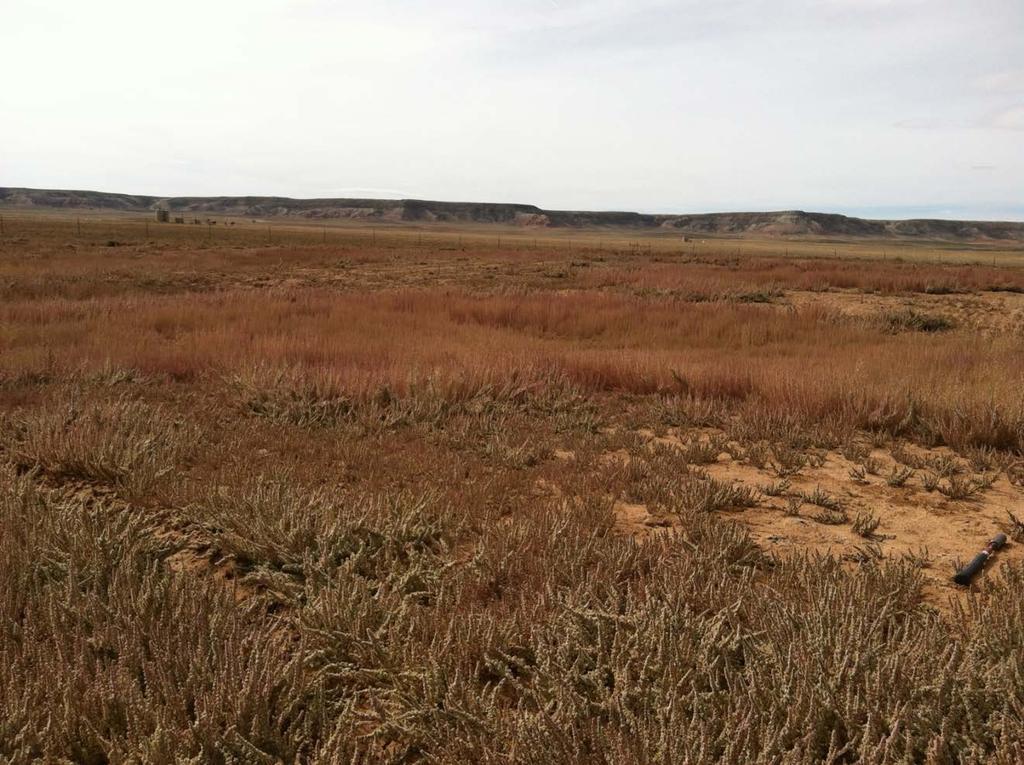
18 Jonah, 211 Jonah, 216
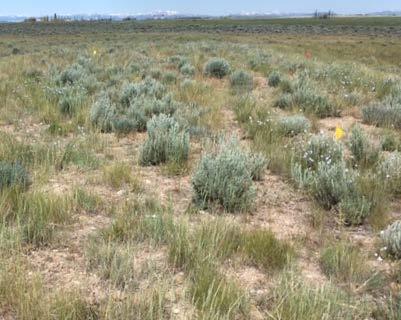
19 Anticline, 211 Anticline, 216
20 Study Period Precipitation Pinedale Jonah Wamsutter Precipitation (mm) Sep-Nov Sep-Nov Sep-Nov
21 Mineralizable C in stockpiles, 29 Pinedale Jonah Wamsutter CO 2 -C mineralized (mg kg -1 ) CO 2 -C mineralized (mg kg -1 ) CO 2 -C mineralized (mg kg -1 ) May June 5 5 Depth (cm) 1 15 August Depth (cm) 1 15 Depth (cm)
22 Reclaimed: Soil texture Anticline Jonah Wamsutter Clay Content (%) Clay Content (%) Clay Content (%) Depth (cm) Reclaimed Undisturbed Undisturbed
23 Reclaimed: Soil texture Anticline Jonah Wamsutter Clay Content (%) Clay Content (%) Clay Content (%) Depth (cm) Reclaimed Undisturbed
24 Disturbance Effects 1. Undisturbed: high labile SOM concentrations, low mineral N concentrations (low net mineralization); 2. Pulse of labile and mineral nutrients after disturbance truncated in cold storage in stockpile; 3. Pulse of mineralization at expense of PMC and N; 4. Loss of mineral N, labile OM begins to rebound. PMN and Mineral N (mg kg -1 ) Jonah Mineral N PMN PMC PMC (mg kg -1 ) Predisturbance Stockpiled Reclaimed Reclaimed 1 yr -3 cm weighted averages
25 PMN and Mineral N (mg kg -1 ) Anticline PMC (mg kg -1 ) PMN and Mineral N (mg kg -1 ) Jonah Mineral N PMN PMC PMC (mg kg -1 ) Predisturbance Stockpiled Reclaimed Reclaimed 1 yr Predisturbance Stockpiled Reclaimed Reclaimed 1 yr Disturbance Effects -3 cm weighted averages PMN and Mineral N (mg kg -1 ) Wamsutter PMC (mg kg -1 ) Anticline: complicated by stockpile being moved at least twice. Predisturbance Stockpiled Reclaimed Reclaimed 1 yr
26
27 PMC and N (mg kg -1 ) Loss of labile C and N Anticline PMC and N (mg kg -1 ) Jonah PMC and N (mg kg -1 ) Wamsutter Mineral Nitrogen (mg kg -1 ) All Well Fields
28 Soil Organic Carbon (%) Anticline Soil Organic Carbon (%) Jonah Recovery of SOM Change: predisturbance to seven years after reclamation. TOC TN % change Anticline Jonah Wamsutter Soil Organic Carbon (%) Wamsutter
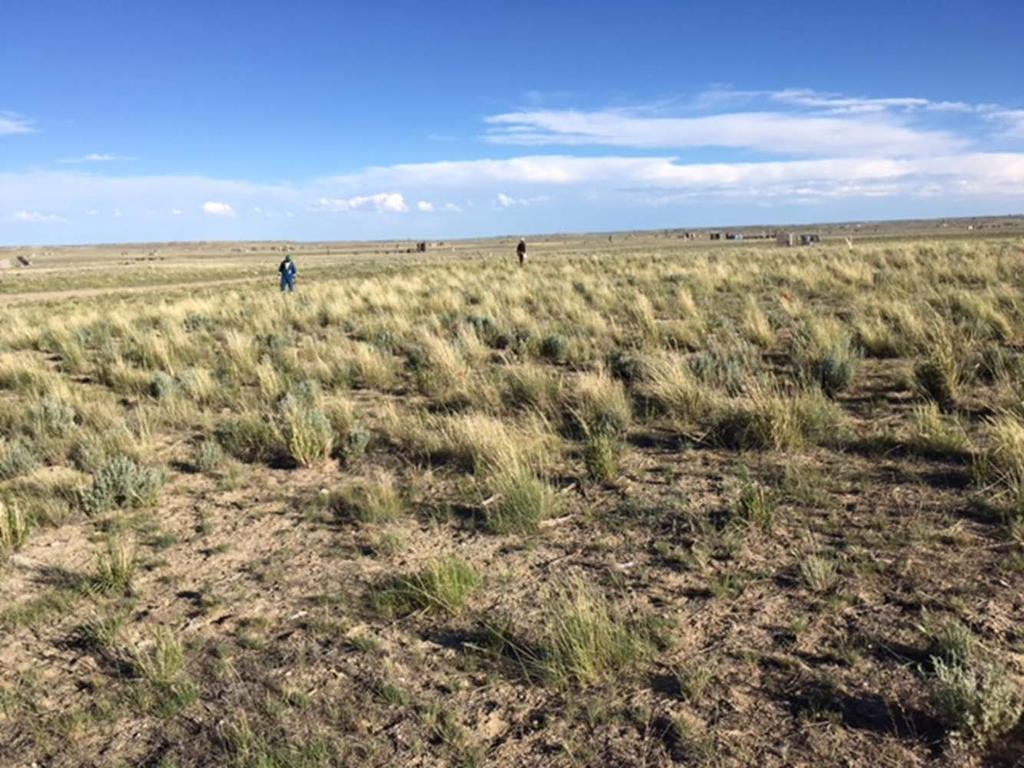
29 Conclusions Stockpiles in semiarid region may not be affected by depth, at least in the short-term; What about age? Compared with degraded reference sites, reclaimed sites seem to recover or exceed original SOM levels within seven years; Possibly due to increased herbaceous vegetation Potentially mineralizable carbon recovers more slowly; Possibly due to loss of soil structure, which protects labile SOM from mineralization, and continued accelerated mineralization, lack of woody species Interest in reclamation research is as variable as annual rainfall.

30 Thanks to Calvin Strom Cally Driessen Amber Mason Jennifer Faulkner Leann Naughton Luke Driessen Kristi Bear Todd Loubsky K.C. Harvey, Inc. Gary Austen, BP America Pete Guernsey, QEP Resources Ralph Swift, Encana Exploration UW School of Energy Resources Wyoming Reclamation & Restoration Center
GAMINGRE 8/1/ of 7
 FYE 09/30/92 JULY 92 0.00 254,550.00 0.00 0 0 0 0 0 0 0 0 0 254,550.00 0.00 0.00 0.00 0.00 254,550.00 AUG 10,616,710.31 5,299.95 845,656.83 84,565.68 61,084.86 23,480.82 339,734.73 135,893.89 67,946.95
Jackson County 2013 Weather Data
 Jackson County 2013 Weather Data 61 Years of Weather Data Recorded at the UF/IFAS Marianna North Florida Research and Education Center Doug Mayo Jackson County Extension Director 1952-2008 Rainfall Data
Jackson County 2018 Weather Data 67 Years of Weather Data Recorded at the UF/IFAS Marianna North Florida Research and Education Center
 Jackson County 2018 Weather Data 67 Years of Weather Data Recorded at the UF/IFAS Marianna North Florida Research and Education Center Doug Mayo Jackson County Extension Director 1952-2008 Rainfall Data
Jackson County 2014 Weather Data
 Jackson County 2014 Weather Data 62 Years of Weather Data Recorded at the UF/IFAS Marianna North Florida Research and Education Center Doug Mayo Jackson County Extension Director 1952-2008 Rainfall Data
Overview. Rock weathering Functions of soil Soil forming factors Soil properties
 UN-FAO A. Healthy soils are the basis for healthy food production. B. A tablespoon of normal topsoil has more microorganisms than the entire human population on Earth. C. It can take up to 1,000 years
Chiang Rai Province CC Threat overview AAS1109 Mekong ARCC
 Chiang Rai Province CC Threat overview AAS1109 Mekong ARCC This threat overview relies on projections of future climate change in the Mekong Basin for the period 2045-2069 compared to a baseline of 1980-2005.
Plant Water Stress Frequency and Periodicity in Western North Dakota
 Plant Water Stress Frequency and Periodicity in Western North Dakota Llewellyn L. Manske PhD, Sheri Schneider, John A. Urban, and Jeffery J. Kubik Report DREC 10-1077 Range Research Program Staff North
Climatic and Ecological Conditions in the Klamath Basin of Southern Oregon and Northern California: Projections for the Future
 Climatic and Ecological Conditions in the Klamath Basin of Southern Oregon and Northern California: Projections for the Future A Collaborative Effort by: CLIMATE LEADERSHIP INITIATIVE INSTITUTE FOR A SUSTAINABLE
Monday, Oct Field trip A1 & A2 signups: make sure you are where you think you should be
 Monday, Oct. 4 1. Field trip A1 & A2 signups: make sure you are where you think you should be 2. 5 credit people, field trip introduction in lab today 1. If you are unable to attend THIS SATURDAY, let
Introduction to Soil Science and Wetlands Kids at Wilderness Camp
 Introduction to Soil Science and Wetlands Kids at Wilderness Camp Presented by: Mr. Brian Oram, PG, PASEO B.F. Environmental Consultants http://www.bfenvironmental.com and Keystone Clean Water Team http://www.pacleanwater.org
January 25, Summary
 January 25, 2013 Summary Precipitation since the December 17, 2012, Drought Update has been slightly below average in parts of central and northern Illinois and above average in southern Illinois. Soil
PREDICTING SOIL SUCTION PROFILES USING PREVAILING WEATHER
 PREDICTING SOIL SUCTION PROFILES USING PREVAILING WEATHER Ronald F. Reed, P.E. Member, ASCE rreed@reed-engineering.com Reed Engineering Group, Ltd. 2424 Stutz, Suite 4 Dallas, Texas 723 214-3-6 Abstract
Changing Hydrology under a Changing Climate for a Coastal Plain Watershed
 Changing Hydrology under a Changing Climate for a Coastal Plain Watershed David Bosch USDA-ARS, Tifton, GA Jeff Arnold ARS Temple, TX and Peter Allen Baylor University, TX SEWRU Objectives 1. Project changes
WHEN IS IT EVER GOING TO RAIN? Table of Average Annual Rainfall and Rainfall For Selected Arizona Cities
 WHEN IS IT EVER GOING TO RAIN? Table of Average Annual Rainfall and 2001-2002 Rainfall For Selected Arizona Cities Phoenix Tucson Flagstaff Avg. 2001-2002 Avg. 2001-2002 Avg. 2001-2002 October 0.7 0.0
Chapter-3 GEOGRAPHICAL LOCATION, CLIMATE AND SOIL CHARACTERISTICS OF THE STUDY SITE
 Chapter-3 GEOGRAPHICAL LOCATION, CLIMATE AND SOIL CHARACTERISTICS OF THE STUDY SITE Chapter-3 GEOGRAPHICAL LOCATION, CLIMATE AND SOIL CHARACTERISTICS OF THE STUDY SITE Assam, the eastern most state of
Volume Composition of a Desirable Surface Soil
 Soil Chemistry Volume Composition of a Desirable Surface Soil 50% pore space 25% air 45 to 48% mineral matter 50% solid material 25% water 2 to 5% organic matter Soil Organic Matter Soil organic matter:
Climate Variability in South Asia
 Climate Variability in South Asia V. Niranjan, M. Dinesh Kumar, and Nitin Bassi Institute for Resource Analysis and Policy Contents Introduction Rainfall variability in South Asia Temporal variability
Average temperature ( F) World Climate Zones. very cold all year with permanent ice and snow. very cold winters, cold summers, and little rain or snow
 World Climate Zones. very cold all year with permanent ice and snow. very cold winters, cold summers, and little rain or snow") P r e v i e w Look carefully at the climagraph of Mumbai, India. What is the wettest month (or months) in Mumbai? What is the driest month (or months) in Mumbai? What effects might this city s climate
P r e v i e w Look carefully at the climagraph of Mumbai, India. What is the wettest month (or months) in Mumbai? What is the driest month (or months) in Mumbai? What effects might this city s climate
A SUMMARY OF RAINFALL AT THE CARNARVON EXPERIMENT STATION,
 A SUMMARY OF RAINFALL AT THE CARNARVON EXPERIMENT STATION, 1931-213 J.C.O. Du Toit 1#, L. van den Berg 1 & T.G. O Connor 2 1 Grootfontein Agricultural Development Institute, Private Bag X529, Middelburg
Lecture 7: Introduction to Soil Formation and Classification
 Lecture 7: Introduction to Soil Formation and Classification Soil Texture and Color Analysis Lab Results Soil A: Topsoil from Prof. Catalano s backyard Soil B: Soil above beach at Castlewood State Park
Climate Change and Water Supply Research. Drought Response Workshop October 8, 2013
 Climate Change and Water Supply Research Drought Response Workshop October 8, 2013 DWR Photo Oroville Reservoir, 2009 Talk Overview Expectations History Atmospheric Rivers and Water Supply Current Research
Mechanical Weathering
 Weathering is the disintegration and decomposition of material at or near the surface. Erosion is the incorporation and transportation of material by a mobile agent, usually water, wind, or ice. Geologists
Stream Discharge and the Water Budget
 Regents Earth Science Unit 6: Water Cycle & Climate Name: Lab # Stream Discharge and the Water Budget Introduction: The United States Geological Survey (USGS) measures and publishes values for the daily
Jackson County 2019 Weather Data 68 Years of Weather Data Recorded at the UF/IFAS Marianna North Florida Research and Education Center
 Jackson County 2019 Weather Data 68 Years of Weather Data Recorded at the UF/IFAS Marianna North Florida Research and Education Center Doug Mayo Jackson County Extension Director 1952-2008 Rainfall Data
2016 Meteorology Summary
 2016 Meteorology Summary New Jersey Department of Environmental Protection AIR POLLUTION AND METEOROLOGY Meteorology plays an important role in the distribution of pollution throughout the troposphere,
Climatography of the United States No
 Climate Division: AK 5 NWS Call Sign: ANC Month (1) Min (2) Month(1) Extremes Lowest (2) Temperature ( F) Lowest Month(1) Degree s (1) Base Temp 65 Heating Cooling 90 Number of s (3) Jan 22.2 9.3 15.8
Missouri River Basin Water Management Monthly Update
 Missouri River Basin Water Management Monthly Update Participating Agencies 255 255 255 237 237 237 0 0 0 217 217 217 163 163 163 200 200 200 131 132 122 239 65 53 80 119 27 National Oceanic and Atmospheric
Climatography of the United States No
 Climate Division: TN 1 NWS Call Sign: Month (1) Min (2) Month(1) Extremes Lowest (2) Temperature ( F) Lowest Month(1) Degree s (1) Base Temp 65 Heating Cooling 100 Number of s (3) Jan 47.6 24.9 36.3 81
Nutrient Cycling in Land Vegetation and Soils
 Nutrient Cycling in Land Vegetation and Soils OCN 401 - Biogeochemical Systems 13 September 2012 Reading: Schlesinger, Chapter 6 Outline 1. The annual Intrasystem Nutrient Cycle 2. Mass balance of the
2003 Moisture Outlook
 2003 Moisture Outlook Nolan Doesken and Roger Pielke, Sr. Colorado Climate Center Prepared by Tara Green and Odie Bliss http://climate.atmos.colostate.edu Through 1999 Through 1999 Fort Collins Total Water
a) Name the features marked P,Q, and R b) Differentiate between a normal faulty and a reverse fault. 2. Use the diagram below to answer question (a)
 Name the features marked P,Q, and R b) Differentiate between a normal faulty and a reverse fault. 2. Use the diagram below to answer question (a)") GEOGRAPHY PAPER 312 / 1 K.C.S.E 2002 SECTION A Answer all the questions in this section 1. The diagram below represents features produced by faulting. Use it to answer questions that follow. a) Name the
GEOGRAPHY PAPER 312 / 1 K.C.S.E 2002 SECTION A Answer all the questions in this section 1. The diagram below represents features produced by faulting. Use it to answer questions that follow. a) Name the
Communicating Climate Change Consequences for Land Use
 Communicating Climate Change Consequences for Land Use Site: Prabost, Skye. Event: Kyle of Lochalsh, 28 th February 28 Further information: http://www.macaulay.ac.uk/ladss/comm_cc_consequences.html Who
Physical Features of Monsoon Asia. 192 Unit 7 Teachers Curriculum Institute 60 N 130 E 140 E 150 E 60 E 50 N 160 E 40 N 30 N 150 E.
 50 N 60 E 70 E 80 E 90 E 100 E 60 N 110 E 120 E 130 E 140 E 150 E 50 N 160 E 40 N 40 N 30 N 60 E 30 N 150 E Tropic of Cancer 20 N Tropic of Cancer 20 N 10 N 10 N 0 Equator 0 Equator 10 S 10 S 0 500 1,000
Climatography of the United States No
 Climate Division: TN 3 NWS Call Sign: BNA Month (1) Min (2) Month(1) Extremes Lowest (2) Temperature ( F) Lowest Month(1) Degree s (1) Base Temp 65 Heating Cooling 100 Number of s (3) Jan 45.6 27.9 36.8
Mycorrhizal Fungi. Symbiotic relationship with plants -- form sheath around fine roots and extend hyphae into soil and sometimes into root cells
 Mycorrhizal Fungi Symbiotic relationship with plants -- form sheath around fine roots and extend hyphae into soil and sometimes into root cells Mycorrhizae transfer nutrients to roots (important in infertile
Three main areas of work:
 Task 2: Climate Information 1 Task 2: Climate Information Three main areas of work: Collect historical and projected weather and climate data Conduct storm surge and wave modeling, sea-level rise (SLR)
Climatography of the United States No
 Climate Division: CA 5 NWS Call Sign: Elevation: 6 Feet Lat: 37 Month (1) Min (2) Month(1) Extremes Lowest (2) Temperature ( F) Lowest Month(1) Degree s (1) Base Temp 65 Heating Cooling 1 Number of s (3)
Climatography of the United States No
 Climate Division: CA 4 NWS Call Sign: Elevation: 2 Feet Lat: 37 Month (1) Min (2) Month(1) Extremes Lowest (2) Temperature ( F) Lowest Month(1) Degree s (1) Base Temp 65 Heating Cooling 1 Number of s (3)
Climatography of the United States No
 Climate Division: CA 4 NWS Call Sign: Elevation: 13 Feet Lat: 36 Month (1) Min (2) Month(1) Extremes Lowest (2) Temperature ( F) Lowest Month(1) Degree s (1) Base Temp 65 Heating Cooling 1 Number of s
Climatography of the United States No
 Climate Division: CA 5 NWS Call Sign: Elevation: 1,14 Feet Lat: 36 Month (1) Min (2) Month(1) Extremes Lowest (2) Temperature ( F) Lowest Month(1) Degree s (1) Base Temp 65 Heating Cooling 1 Number of
Colluvial debris: Rocks that have fallen down hills. Types of Parent Material
 Weathered Rocks from the lithosphere are the parent materials for soils Nature of the parent material will greatly influence time it takes to make soil and the nature of the soil that is formed Types of
Soil Erosion Calculation using Remote Sensing and GIS in Río Grande de Arecibo Watershed, Puerto Rico
 Soil Erosion Calculation using Remote Sensing and GIS in Río Grande de Arecibo Watershed, Puerto Rico Alejandra M. Rojas González Department of Civil Engineering University of Puerto Rico at Mayaguez.
Climatography of the United States No
 Climate Division: CA 6 NWS Call Sign: LAX Elevation: 1 Feet Lat: 33 Month (1) Min (2) Month(1) Extremes Lowest (2) Temperature ( F) Lowest Month(1) Degree s (1) Base Temp 65 Heating Cooling 1 Number of
Climatography of the United States No
 Climate Division: CA 6 NWS Call Sign: TOA Elevation: 11 Feet Lat: 33 2W Temperature ( F) Month (1) Min (2) Month(1) Extremes Lowest (2) Lowest Month(1) Degree s (1) Base Temp 65 Heating Cooling 1 Number
Folsom Dam Water Control Manual Update Joint Federal Project, Folsom Dam
 Folsom Dam Water Control Manual Update Joint Federal Project, Folsom Dam Public Workshop May 25, 2016 Sacramento Library Galleria 828 I Street, Sacramento, CA US Army Corps of Engineers BUILDING STRONG
Folsom Dam Water Control Manual Update Joint Federal Project, Folsom Dam
 Folsom Dam Water Control Manual Update Joint Federal Project, Folsom Dam Public Workshop May 28, 2015 Library Galleria 828 I Street, Sacramento, CA US Army Corps of Engineers BUILDING STRONG WELCOME &
Analysis of Historical Pattern of Rainfall in the Western Region of Bangladesh
 24 25 April 214, Asian University for Women, Bangladesh Analysis of Historical Pattern of Rainfall in the Western Region of Bangladesh Md. Tanvir Alam 1*, Tanni Sarker 2 1,2 Department of Civil Engineering,
World Geography 3202 Practice Multiple Choice Unit 3 Ecosystems. Outcomes:
 Outcomes: SCO 3.1: The student will be expected to demonstrate an understanding that an ecosystem consists of a complex network of organisms, including the following delineations: 3.1.1 Define the term
Climatography of the United States No
 Month (1) Min (2) Month(1) Extremes Lowest (2) Temperature ( F) Lowest Month(1) Degree s (1) Base Temp 65 Heating Cooling 100 Number of s (3) Jan 63.9 39.3 51.6 86 1976 16 56.6 1986 20 1976 2 47.5 1973
Climatography of the United States No
 Temperature ( F) Month (1) Min (2) Month(1) Extremes Lowest (2) Lowest Month(1) Degree s (1) Base Temp 65 Heating Cooling 100 Number of s (3) Jan 32.8 21.7 27.3 62 1918 1 35.8 1983-24 1950 29 10.5 1979
Lecture 13 More Surface Reactions on Mineral Surfaces. & Intro to Soil Formation and Chemistry
 Lecture 13 More Surface Reactions on Mineral Surfaces & Intro to Soil Formation and Chemistry 3. charge transfer (e.g., ligand/donor sorption): Sorption involves a number of related processes that all
HYDROLOGIC AND WATER RESOURCES EVALUATIONS FOR SG. LUI WATERSHED
 HYDROLOGIC AND WATER RESOURCES EVALUATIONS FOR SG. LUI WATERSHED 1.0 Introduction The Sg. Lui watershed is the upper part of Langat River Basin, in the state of Selangor which located approximately 20
Proposal to limit Namakan Lake to 1970 Upper Rule Curve for remainder of summer
 July 7, 214 Subject: Proposal to limit Namakan Lake to 197 Upper Rule Curve for remainder of summer Background: Flooding in 214 has resulted in the highest water levels on Namakan Lake since 1968, and
A Post Processing Tool to Assess Sediment and Nutrient Source Allocations from SWAT Simulations
 A Post Processing Tool to Assess Sediment and Nutrient Source Allocations from SWAT Simulations Michael Van Liew William Puknat Montana Department of Environmental Quality Helena, Montana, USA PROBLEM:
Climatography of the United States No
 No. 2 1971-2 Asheville, North Carolina 2881 COOP ID: 46175 Climate Division: CA 6 NWS Call Sign: 3L3 Elevation: 1 Feet Lat: 33 Month (1) Min (2) Month(1) Extremes Lowest (2) Temperature ( F) Lowest Month(1)
Climatography of the United States No
 No. 2 1971-2 Asheville, North Carolina 2881 COOP ID: 42713 Climate Division: CA 7 NWS Call Sign: Elevation: -3 Feet Lat: 32 Month (1) Min (2) Month(1) Extremes Lowest (2) Temperature ( F) Lowest Month(1)
Chemical Weathering and Soils
 Chemical Weathering and Soils Fresh rocks and minerals that once occupied the outermost position reached their present condition of decay through a complex of interacting physical, chemical, and biological
2003 Water Year Wrap-Up and Look Ahead
 2003 Water Year Wrap-Up and Look Ahead Nolan Doesken Colorado Climate Center Prepared by Odie Bliss http://ccc.atmos.colostate.edu Colorado Average Annual Precipitation Map South Platte Average Precipitation
A Report on a Statistical Model to Forecast Seasonal Inflows to Cowichan Lake
 A Report on a Statistical Model to Forecast Seasonal Inflows to Cowichan Lake Prepared by: Allan Chapman, MSc, PGeo Hydrologist, Chapman Geoscience Ltd., and Former Head, BC River Forecast Centre Victoria
Climatography of the United States No
 Climate Division: CA 4 NWS Call Sign: Month (1) Min (2) Month(1) Extremes Lowest (2) Temperature ( F) Lowest Month(1) Degree s (1) Base Temp 65 Heating Cooling 100 Number of s (3) Jan 55.6 39.3 47.5 77
Climatography of the United States No
 Climate Division: CA 5 NWS Call Sign: Month (1) Min (2) Month(1) Extremes Lowest (2) Temperature ( F) Lowest Month(1) Degree s (1) Base Temp 65 Heating Cooling 100 Number of s (3) Jan 56.6 36.5 46.6 81
Climatography of the United States No
 Climate Division: CA 1 NWS Call Sign: Month (1) Min (2) Month(1) Extremes Lowest (2) Temperature ( F) Lowest Month(1) Degree s (1) Base Temp 65 Heating Cooling 100 Number of s (3) Jan 57.9 38.9 48.4 85
Climatography of the United States No
 Climate Division: CA 5 NWS Call Sign: Month (1) Min (2) Month(1) Extremes Lowest (2) Temperature ( F) Lowest Month(1) Degree s (1) Base Temp 65 Heating Cooling 100 Number of s (3) Jan 44.8 25.4 35.1 72
Climatography of the United States No
 Climate Division: CA 4 NWS Call Sign: Month (1) Min (2) Month(1) Extremes Lowest (2) Temperature ( F) Lowest Month(1) Degree s (1) Base Temp 65 Heating Cooling 100 Number of s (3) Jan 49.4 37.5 43.5 73
Webinar and Weekly Summary February 15th, 2011
 Webinar and Weekly Summary February 15th, 2011 -Assessment of current water conditions - Precipitation Forecast - Recommendations for Drought Monitor Upper Colorado Normal Precipitation Upper Colorado
Climatography of the United States No
 Climate Division: CA 6 NWS Call Sign: Month (1) Min (2) Month(1) Extremes Lowest (2) Temperature ( F) Lowest Month(1) Degree s (1) Base Temp 65 Heating Cooling 100 Number of s (3) Jan 69.4 46.6 58.0 92
Climatography of the United States No
 Climate Division: CA 4 NWS Call Sign: Month (1) Min (2) Month(1) Extremes Lowest (2) Temperature ( F) Lowest Month(1) Degree s (1) Base Temp 65 Heating Cooling 1 Number of s (3) Jan 58.5 38.8 48.7 79 1962
Climatography of the United States No
 Climate Division: CA 6 NWS Call Sign: Month (1) Min (2) Month(1) Extremes Lowest (2) Temperature ( F) Lowest Month(1) Degree s (1) Base Temp 65 Heating Cooling 1 Number of s (3) Jan 67.5 42. 54.8 92 1971
Climatography of the United States No
 Climate Division: CA 1 NWS Call Sign: Month (1) Min (2) Month(1) Extremes Lowest (2) Temperature ( F) Lowest Month(1) Degree s (1) Base Temp 65 Heating Cooling 1 Number of s (3) Jan 57.8 39.5 48.7 85 1962
Chemistry of Tiling and Crusting
 Chemistry of Tiling and Crusting Tom DeSutter Assistant Professor of Soil Science NDSU Soil and Soil/Water Training 25 January 2012 What is Dispersion? Soil particles are repelled away from each other
Global Climates. Name Date
 Global Climates Name Date No investigation of the atmosphere is complete without examining the global distribution of the major atmospheric elements and the impact that humans have on weather and climate.
APPLICATIONS OF DOWNSCALING: HYDROLOGY AND WATER RESOURCES EXAMPLES
 APPLICATIONS OF DOWNSCALING: HYDROLOGY AND WATER RESOURCES EXAMPLES Dennis P. Lettenmaier Department of Civil and Environmental Engineering For presentation at Workshop on Regional Climate Research NCAR
Climatography of the United States No
 Climate Division: ND 8 NWS Call Sign: BIS Month (1) Min (2) Month(1) Extremes Lowest (2) Temperature ( F) Lowest Month(1) Degree s (1) Base Temp 65 Heating Cooling 100 Number of s (3) Jan 21.1 -.6 10.2
Climatography of the United States No
 Climate Division: CA 5 NWS Call Sign: FAT Month (1) Min (2) Month(1) Extremes Lowest (2) Temperature ( F) Lowest Month(1) Degree s (1) Base Temp 65 Heating Cooling 1 Number of s (3) Jan 53.6 38.4 46. 78
Temperature and Precipitation. Next stage will depend on climate and parent materials
 Next stage will depend on climate and parent materials Rainfall and temperature will determine nature of vegetation Resistance of parent material to weathering will determine rate and type of clay formation,
Climatography of the United States No
 Climate Division: CA 6 NWS Call Sign: 1L2 N Lon: 118 3W Month (1) Min (2) Month(1) Extremes Lowest (2) Temperature ( F) Lowest Month(1) Degree s (1) Base Temp 65 Heating Cooling 1 Number of s (3) Jan 63.7
Climatography of the United States No
 Climate Division: CA 5 NWS Call Sign: BFL Month (1) Min (2) Month(1) Extremes Lowest (2) Temperature ( F) Lowest Month(1) Degree s (1) Base Temp 65 Heating Cooling 1 Number of s (3) Jan 56.3 39.3 47.8
Climate also has a large influence on how local ecosystems have evolved and how we interact with them.
 The Mississippi River in a Changing Climate By Paul Lehman, P.Eng., General Manager Mississippi Valley Conservation (This article originally appeared in the Mississippi Lakes Association s 212 Mississippi
Impacts of climate change on flooding in the river Meuse
 Impacts of climate change on flooding in the river Meuse Martijn Booij University of Twente,, The Netherlands m.j.booij booij@utwente.nlnl 2003 in the Meuse basin Model appropriateness Appropriate model
Water Year Day 2010
 mm mm SCA, % Storage, mm Sto, 1 mm Sat def, 1 mm 25 2 15 1 5 4 3 2 1 2 5 25 2 Saturation deficit depth (water table) Saturation deficit volume Root zone storage Unsaturated soil storage Groundwater storage
Missouri River Basin Water Management Monthly Update
 Missouri River Basin Water Management Monthly Update Participating Agencies 255 255 255 237 237 237 0 0 0 217 217 217 163 163 163 200 200 200 131 132 122 239 65 53 80 119 27 National Oceanic and Atmospheric
United States Climate
 25-1 Alabama Annual Average Temperature Data Source: http://www.wrcc.dri.edu/cgi-bin/divplot1_form.pl?0106 25-2 How does climate vary as we traverse the U.S. along 40 N? 25-3 Average Temperature Along
Disentangling Impacts of Climate & Land Use Changes on the Quantity & Quality of River Flows in Southern Ontario
 Disentangling Impacts of Climate & Land Use Changes on the Quantity & Quality of River Flows in Southern Ontario by Trevor Dickinson & Ramesh Rudra, Water Resources Engineering University of Guelph Acknowledgements
Colorado s 2003 Moisture Outlook
 Colorado s 2003 Moisture Outlook Nolan Doesken and Roger Pielke, Sr. Colorado Climate Center Prepared by Tara Green and Odie Bliss http://climate.atmos.colostate.edu How we got into this drought! Fort
DISTRIBUTION OF METALS IN PARTICLE SIZE FRACTIONS IN SOILS OF TWO FORESTED CATENAS (SMOLENSK MOSCOW UPLAND)
") 28 GEOGRAPHY Olga A. Samonova 1, Elena N. Aseyeva 2 * 1 Faculty of Geography, Moscow State University, Moscow, 119991, Russia; e-mail: оsamonova@mail.ru 2 Faculty of Geography, Moscow State University,
28 GEOGRAPHY Olga A. Samonova 1, Elena N. Aseyeva 2 * 1 Faculty of Geography, Moscow State University, Moscow, 119991, Russia; e-mail: оsamonova@mail.ru 2 Faculty of Geography, Moscow State University,
Presentation Overview. Southwestern Climate: Past, present and future. Global Energy Balance. What is climate?
 Southwestern Climate: Past, present and future Mike Crimmins Climate Science Extension Specialist Dept. of Soil, Water, & Env. Science & Arizona Cooperative Extension The University of Arizona Presentation
REDWOOD VALLEY SUBAREA
 Independent Science Review Panel Conceptual Model of Watershed Hydrology, Surface Water and Groundwater Interactions and Stream Ecology for the Russian River Watershed Appendices A-1 APPENDIX A A-2 REDWOOD
Annual Average NYMEX Strip Comparison 7/03/2017
 Annual Average NYMEX Strip Comparison 7/03/2017 To Year to Year Oil Price Deck ($/bbl) change Year change 7/3/2017 6/1/2017 5/1/2017 4/3/2017 3/1/2017 2/1/2017-2.7% 2017 Average -10.4% 47.52 48.84 49.58
Climatography of the United States No
 No. 2 1971-2 Asheville, North Carolina 2881 COOP ID: 46646 Climate Division: CA 4 NWS Call Sign: 8W Month (1) Min (2) Month(1) Extremes Lowest (2) Temperature ( F) Lowest Month(1) Degree s (1) Base Temp
Minnesota s Climatic Conditions, Outlook, and Impacts on Agriculture. Today. 1. The weather and climate of 2017 to date
 Minnesota s Climatic Conditions, Outlook, and Impacts on Agriculture Kenny Blumenfeld, State Climatology Office Crop Insurance Conference, Sep 13, 2017 Today 1. The weather and climate of 2017 to date
Climatography of the United States No
 No. 2 1971-2 Asheville, North Carolina 2881 COOP ID: 4792 Climate Division: CA 6 NWS Call Sign: Month (1) Min (2) Month(1) Extremes Lowest (2) Temperature ( F) Lowest Month(1) Degree s (1) Base Temp 65
DESCRIPTION OF A HYDROLOGIC DATASET. Department of Environmental Sciences, Wageningen University and. Research Center. Wageningen, The Netherlands
 DESCRIPTION OF A HYDROLOGIC DATASET FOR THE BRISY SUBCATCHMENT R. T. Oosterho? and C. Paniconi y? Department of Environmental Sciences, Wageningen University and Research Center Wageningen, The Netherlands
Sampling, Storage and Pre-Treatment Techniques
 1. Sampling Protocol Sample needs to be representative of the body of water (or other matrix) from where it originates. Sampling Considerations A. Location B. Frequency (hourly, daily) C. Spatial and temporal
How are adding integers and subtracting integers related? Work with a partner. Use integer counters to find 4 2. Remove 2 positive counters.
 . How are adding integers and subtracting integers related? ACTIVITY: Work with a partner. Use integer counters to find 4. Start with 4 positive counters. Remove positive counters. What is the total number
Weather and Climate of the Rogue Valley By Gregory V. Jones, Ph.D., Southern Oregon University
 Weather and Climate of the Rogue Valley By Gregory V. Jones, Ph.D., Southern Oregon University The Rogue Valley region is one of many intermountain valley areas along the west coast of the United States.
Long-term Water Quality Monitoring in Estero Bay
 Long-term Water Quality Monitoring in Estero Bay Keith Kibbey Laboratory Director Lee County Environmental Laboratory Division of Natural Resource Management Estero Bay Monitoring Programs Three significant
Climatography of the United States No
 No. 2 1971-2 Asheville, North Carolina 2881 COOP ID: 43417 Climate Division: CA 4 NWS Call Sign: N Lon: 121 Month (1) Min (2) Month(1) Extremes Lowest (2) Temperature ( F) Lowest Month(1) Degree s (1)
FORECAST-BASED OPERATIONS AT FOLSOM DAM AND LAKE
 FORECAST-BASED OPERATIONS AT FOLSOM DAM AND LAKE 255 237 237 237 217 217 217 200 200 200 0 163 131 Bridging the Gap163Conference 255 0 132 255 0 163 122 The Dana on Mission Bay San Diego, CA January 28,
Supplementary Material: Crop & Pasture Science, 2013, 64(12),
,") 10.1071/CP13168_AC CSIRO 2013 Supplementary Material: Crop & Pasture Science, 2013, 64(12), 1182 1194. Hydrological and water-use efficiency implications of geomorphological stratification in palæochannels
10.1071/CP13168_AC CSIRO 2013 Supplementary Material: Crop & Pasture Science, 2013, 64(12), 1182 1194. Hydrological and water-use efficiency implications of geomorphological stratification in palæochannels
Using the Web Soil Survey Resilience and Resistance Score Sheet Soils Report
 Using the Resilience and Resistance Score Sheet Soils Report 1. Go to http://websoilsurvey.nrcs.usda.gov/app/ and click on the Start WSS button. 2. Create an Area of Interest (AOI) using any of the available