FORM 2A UPDATED LISTING STATEMENT NOVO RESOURCES CORP. FOR THE ANNUAL FILING YEAR ENDED JANUARY 31, 2013 DATE: MAY 31, 2013
|
|
|
- Todd Wells
- 6 years ago
- Views:
Transcription
1 NOVO RESOURCES CORP. FORM 2A UPDATED LISTING STATEMENT NOVO RESOURCES CORP. FOR THE ANNUAL FILING YEAR ENDED JANUARY 3, 23 DATE: MAY 3, 23 FORM 2A LISTING STATEMENT May 25, 22 Page
2 NOVO RESOURCES CORP.. Table of Contents. Table of Contents Corporate Structure General Development of the Business Narrative Description of the Business Selected Consolidated Financial Information Management's Discussion and Analysis Market for Securities Consolidated Capitalization Options to Purchase Securities Description of the Securities Escrowed Securities Principal Shareholders Directors and Officers Capitalization Executive Compensation Indebtedness of Directors and Executive Officers Risk Factors Promoters Legal Proceedings Interest of Management and Others in Material Transactions Auditors, Transfer Agents and Registrars Material Contracts Interest of Experts Other Material Facts Financial Statements FORM 2A LISTING STATEMENT May 25, 22 Page 2
3 NOVO RESOURCES CORP. 2. Corporate Structure 2. The full corporate name of the Issuer is (the Company or the Issuer ). Its head office address is West Georgia Street, Vancouver, BC V6E 3C9 and its registered and records office is located at 625 Howe Street, Suite 7, Vancouver, BC, V6C 2T The Issuer was incorporated on October 28, 29 pursuant to the Business Corporations Act, British Columbia. The Issuer is engaged primarily in the business of evaluating, acquiring and exploring natural resource properties. The Issuer was listed for trading on the Canadian National Stock Exchange ( CNSX or the Exchange ) since June 4, 2 under the trading symbol GRS. On June 27, 2, the Issuer changed its name from Galliard Resources Corp. to On June 29, 2, the Issuer s common shares began trading under the new symbol NVO. 2.3 Intercorporate Relationship Among Issuer and Issuer s Subsidiaries Novo Resources Corp. (Incorporated in Canada) % % Novo Resources (USA) Corp. (Incorporated in United States) Conglomerate Gold Exploration (B.V.I.) Ltd. (Incorporated in British Virgin Islands) 63.33% Conglomerate Gold Exploration Pty Ltd. (Incorporated in Australia) % Grant's Hill Gold Pty Ltd. (Incorporated in Australia) % % Nullagine Gold Pty Ltd. (Incorporated in Australia) Beatons Creek Gold Pty Ltd. (Incorporated in Australia) FORM 2A LISTING STATEMENT May 25, 22 Page 3
4 NOVO RESOURCES CORP. 2.4 N/A 2.5 N/A 3. General Development of the Business 3. The Issuer is engaged in the acquisition, exploration and, if warranted, development of natural resource properties of merit. On June, 2, the Issuer completed its initial public offering (the IPO ) raising gross proceeds of $4,. A total of 2,, common shares of the Issuer were issued at a price of $.2 per share pursuant to the final prospectus of the Issuer dated April 23, 2. The Issuer was listed for trading on the Canadian National Stock Exchange ( CNSX or the Exchange ) since June 4, 2 under the trading symbol GRS. On June 27, 2, the Issuer changed its name from Galliard Resources Corp. to Novo Resources Corp. On June 29, 2, the Issuer s common shares began trading under the new symbol NVO. On July 6, 2, the Issuer terminated the Enterprise Property option agreement and returned the mineral claims to Mr. Deering. As a condition to terminate the option agreement, the Issuer paid $35,274 to Mr. Deering. The Issuer wrote off the exploration and evaluation assets of $99,363 relating to acquisition costs and exploration expenditures of the Enterprise Property. On August 2, 2, the Issuer entered into a farm-in and joint venture agreement (the Millennium Agreement ) with Millennium Minerals Ltd. ( Millennium ). As consideration for the farm-in right to earn the 7% interest in and to the Beatons Creek Tenements, the Issuer issued,293,875 common shares to Millennium. In order to earn a 7% interest in the Beatons Creek Tenements, the Issuer must issue to Millennium such number of common shares of the Issuer having a value of AUD$5,, incur expenditures on the Beatons Creek Tenements of not less than AUD$,, by the second anniversary of the effective date, not less than AUD$5, by the first anniversary of the effective date, and procuring (at its cost) a bankable feasibility study in respect of the gold rights before the fifth anniversary of the effective date. The Issuer will solely fund all expenditures on the Beatons Creek Tenements required under the Mining Act 978 (Western Australia) in relation to gold rights, and Millennium will not be required to fund any such expenditures on the Beatons Creek Tenements during the farm-in period. Millennium will bear costs associated with exploring for and recovering minerals other than gold. The principal capital expenditures and divestitures of the Issuer were made in connection with the Millennium Property. During the period from incorporation on October 28, 29 to the date of this Listing Statement, the Issuer expended a total of $985,94 on the Millennium Property. This amount was made up of acquisition costs of $277,65 and deferred exploration expenditure of $77,929. FORM 2A LISTING STATEMENT May 25, 22 Page 4
5 NOVO RESOURCES CORP. On January 6, 22, the Issuer purchased, through a non-brokered private placement, 7,, units of EurOmax Resources Ltd. at a price of $.22 per unit, for a total investment of $,54,. Each unit consists of one common share and one nontransferable share purchase warrant. Each non-transferable share purchase warrant entitles the holder thereof to purchase one additional common share of EurOmax at a price of $.3 per share for a period of two years from the date of issue. On June 26, 22, the Issuer entered into a sale and purchase agreement (the Sale and Purchase Agreement ) with Welcome Stranger Mining Ltd. ( Welcome Stranger ) for the prospecting license, mining information and title transfer of the P46/86 tenement. On July 6, 22, the Issuer entered into four farm-in and joint venture agreements (each a JVA ) with the Creasy Group ("Creasy") of Western Australia whereby Nullagine Gold Pty Ltd. ( Nullagine Gold ), is entitled to earn a 7% interest (as to gold and minerals associated with and normally mined with gold, being Gold Rights ) in the prospecting, exploration and mining tenements and applications related to Creasy's % controlled Pilbara Paleo-Placer project. On September 7, 22, the Issuer entered into a deed of variation agreement to recognize one addition tenement with respect to the JVAs. In total this project covers 33 tenements or applications for tenements (the "Properties") in the Nullagine embayment and Marble Bar sub-basin located in Western Australia. On August 4, 22, the Issuer s shares commenced trading in the United States on the OTC market s prestigious tier, OTCQX International under the symbol of NSRPF. On December 2, 22, the Issuer completed its brokered private placement, raising $3,767, by the issuance of 5,795,4 units at a price of $.65 per unit. Each unit consists of one () common share and one () common share purchase warrant. Each warrant entitles the holder thereof to purchase one () additional common share of the Issuer at a price of $.9 per share for a period of two (2) years from the closing date of the private placement. The warrants are subject to an accelerated expiry whereby if, at any time following the expiry of the statutory hold period, the volume weighted average trading price of the Issuer s common shares is equal to or exceeds $.2 for any 2 consecutive trading days, the Issuer can choose to give notice to the warrant holders that the warrants will expire on the 3 st calendar day following the date of notice. 3.2 a. Significant Acquisition Millennium Property On August 2, 2 (the Effective Date ), the Issuer and Beatons Creek Gold Pty Ltd. ( Beatons Creek ), a subsidiary of the Issuer, entered into a farm-in and joint venture agreement (the Millennium Agreement ) with Millennium Minerals Ltd. ( Millennium ). As consideration for the farm-in right to earn the 7% interest in and to the Beatons Creek Tenements, the Issuer issued,293,875 common shares to Millennium. In order to earn a 7% interest in the Beatons Creek Tenements, the Issuer must issue to Millennium such number of common shares of the Issuer having a value of AUD$5,, incur expenditures on the Beatons Creek Tenements of not less than AUD$,, by the second anniversary of the Effective Date, not less than AUD$5, by the FORM 2A LISTING STATEMENT May 25, 22 Page 5
6 NOVO RESOURCES CORP. first anniversary of the Effective Date, and procuring (at its cost) a bankable feasibility study in respect of the gold rights before the fifth anniversary of the Effective Date. The Issuer will solely fund all expenditures on the Beatons Creek Tenements required under the Mining Act 978 (Western Australia) in relation to gold rights, and Millennium will not be required to fund any such expenditures on the Beatons Creek Tenements during the farm-in period. Millennium will bear costs associated with exploring for and recovering minerals other than gold. As at January 3, 23, the Issuer has completed the following requirements to fulfill its obligation under the Millennium Agreement: Date Shares Exploration Expenditures Upon signing of the Millennium,293,875 shares - Agreement (Issued) August 2, 22 - $5, AUD (Completed) August 2, 23 - $5, AUD (Completed) Total,293,875 shares (Issued) $,, AUD (Completed) On December 6, 2, the Issuer and Millennium entered into a tribute agreement (the Tribute Agreement ) with Gravity Gold Pty Ltd. ( Gravity Gold ) by which Gravity Gold is entitled to produce gold from alluvial deposits at the Beatons Creek Tenements. Gravity Gold will pay a % production royalty to the Issuer on all gold production. The Tribute Agreement has a maximum term of three years. The Issuer is focused on exploring for the bedrock source of this alluvial gold mineralization, and any activities conducted by Gravity Gold during mining of alluvial deposits will not interfere with the Issuer s exploration efforts. Paleo-Placer Property The Issuer, Conglomerate Gold Exploration Pty Ltd ( CGE ), and Nullagine Gold Pty Ltd ( Nullagine Gold ), entered into four farm-in and joint venture agreements (the JVA ) dated July 6, 22 and one deed of variation dated September 7, 22 with Witx Pty Ltd, Mark Gareth Creasy, Whim Creek Mining Pty Ltd, and Tantalumx Pty Ltd. (collectively the Creasy Group ) of Western Australia. As consideration for the farm-in right to acquire a 7% interest in all gold rights, the Issuer must spend AUD$ million on exploration expenditure across the Paleo-Placer Property. The Issuer will solely fund all expenditures on the Paleo-Placer Property. CGE will reimburse past exploration expenditure on the Paleo-Placer Property incurred by the Creasy Group, as verified by CGE, up to a maximum of AUD$5.5 million. The reimbursement is contingent on CGE achieving a listing on a recognized stock exchange (an IPO ) within 4 years of the execution of the JVA s. The reimbursement will be paid from net funds raised in an IPO (if completed) and subsequent funding rounds (if completed), capped at % of net funds from each round, until the verified expenditure is reimbursed. If CGE has not achieved an IPO within 4 years, the Paleo-Placer Property will be returned to % ownership by the Creasy Group at no cost, unless otherwise FORM 2A LISTING STATEMENT May 25, 22 Page 6
7 NOVO RESOURCES CORP. agreed. If a mining decision is made under any of the JVA s following a bankable feasibility study but the Creasy Group elects not to participate in mining, its interest in relation to that mining area and the underlying ground will be transferred to Nullagine Gold and converted to a % net smelter royalty. The Issuer, Conglomerate Gold Exploration (B.V.I.) Ltd ( CGE BVI ), and CGE have also entered into a CGE Shareholders Agreement and a CGE Share Issue Agreement with Yandal Investments Pty Ltd and Mark Gareth Creasy (collectively Creasy ). Novo initially controls 63.33% of the issued shares in CGE and Creasy controls 36.67%. CGE is entitled to spend (via Nullagine Gold and Beatons Creek Gold) up to a further AUD$3.5 million in aggregate on the Paleo-Placer Property and the Beatons Creek tenements to increase its shareholding in CGE to 8% (and reducing Creasy s interest to 9%), subject to a maximum included expenditure on Beatons Creek tenements of AUD$2 million. Creasy is obliged to use its best endeavours to negotiate a right for Nullagine Gold to participate in an existing adjacent joint venture to which Creasy is a party, bringing certain ground within that joint venture. In return, Creasy s and one other party s interests under that joint venture with respect to exploration expenditure will be free carried by Nullagine Gold and CGE will reimburse AUD$25, to Creasy. If CGE achieves an IPO it will also issue AUD$5, of shares in CGE to a former tenement holder. If Creasy does not satisfy the obligation prior to an IPO of CGE (if completed) then Creasy will forfeit 23.3% of its shareholding in CGE. Prior to an IPO of CGE (if completed) that 23.3% of CGE shares shall have no voting or dividend rights. If the obligation is satisfied then the ground within that joint venture will be included within the minimum expenditure commitments and additional expenditure entitlements referred above. The Issuer has entered into loan agreements with its subsidiaries to fund their obligations under the JVA s. The Issuer is entitled to be reimbursed up to AUD$5, for IPO related costs of CGE (if completed) and stamp duty costs of Nullagine Gold. Grant s Hill Property On June 26, 22, the Issuer entered into a sale and purchase agreement with Welcome Stranger Mining Ltd. ( Welcome Stranger ). As consideration for the prospecting licence, mining information and title transfer of the P46/86 tenement, the Issuer paid AUD$6, plus GST to Welcome Stranger. On April, 23, which is subsequent to the year ended January 3, 23, the Issuer entered into a sale and purchase agreement with Talga Resources Limited ( Talga Resources ). As consideration for the prospecting licence and title transfer of the P46/748 and P46/749 tenements, the Issuer paid AUD$4, plus GST to Talga Resources. FORM 2A LISTING STATEMENT May 25, 22 Page 7
8 NOVO RESOURCES CORP. Beatons Creek Enterprise Grant's Hill Paleo-Placer Total $ $ $ $ $ Balance, January 3, , ,822 Acquisition Costs ,52 288,86 35,326 Exploration Expenditures: Drilling,45, ,32,254,63 Feasibility Study 23, ,25 Field Work 222,29-469, ,93 Fuel 5, ,32,847 Geology 62, , ,699 Legal 23, ,833 5,36 Meals & Travel 33, ,32 93,966 Office and General 73, ,7 6,727 Reports, Data and Analysis 5,96 -,25 7, ,99 Rock Samples 597, ,25 639,595 Tenement Administration,352 -,892 53,694 65,938 Foreign Exchange Difference 3, ,63 2,452,26-3,6 737,662 3,93,399 Balance, January 3, 23 3,385,948-66,3,26,468 4,478,547 Beatons Creek Enterprise Grant's Hill Paleo-Placer Total $ $ $ $ $ Balance, January 3, 2-99, ,363 Acquisition Costs 52, ,274 Exploration Expenditures: Data Processing 6, ,959 Distillate Drilling 24, ,46 Field Supplies 8, ,53 General Administration 5, ,88 Geological Services 52, ,369 Maps Miscellaneous Project Supervision 32, ,666 Rock Samples 2, ,24 Surveying 7, ,294 Tenements 9, ,75 Travel & Accommodation 25, ,37 43, ,548 Option agreement termination payment - 35, ,274 Impairment of exploration and evaluation assets - (34,637) - - (34,637) Balance, January 3, , ,822 FORM 2A LISTING STATEMENT May 25, 22 Page 8
9 NOVO RESOURCES CORP. b. Significant Disposition Enterprise Property On July 6, 2, the Issuer terminated the Enterprise Property option agreement and returned the mineral claims to Mr. Deering. As a condition to terminate the option agreement, the Issuer paid $35,274 to Mr. Deering. The Issuer wrote off the exploration and evaluation assets of $99,363 relating to acquisition costs and exploration expenditures of the Enterprise Property. 3.3 At present, the Issuer s operations do not generate cash flow and its financial success is dependent on management s ability to discover economically viable mineral deposits. The mineral exploration process can take many years and is subject to factors that are beyond the Issuer s control. In order to continue as a going concern and to meet its corporate objectives, which primarily consist of exploration work on its mineral property, the Issuer will require additional financing through debt or equity issuances or other available means. Although the Issuer has been successful in the past in obtaining financing, there is no assurance that it will be able to obtain adequate financing in the future or that such financing will be on terms advantageous to the Issuer. Management believes it will be able to raise equity capital as required in the long term, but recognizes there will be risks involved that may be beyond their control. 4. Narrative Description of the Business 4. General () The Issuer s primary objective is to continue to evaluate and engage in mineral properties that may have the potential for further examination and development. (a) Stated Business Objectives The Issuer has prioritized the completion of initial phase of the development plan for the Millennium Property as its most important business objectives over the coming year using the available funds. (b) Milestones Although the Issuer has adequate financial resources required for the completion of the stated business objectives noted above, the completion of further development is dependent upon the results of analysis of drilling occurring pursuant to the initial phase drilling program completed in the coming year s drilling season. Further exploration plans may derogate materially from the plan currently proposed if analysis dictates that the Issuer pursue alternative drilling and sampling objectives. In order to achieve the Issuer s ultimate goal of the development of a mine and the production of mineral resources in commercial quantities, additional capital will have to be raised. Actual costs are constantly fluctuating and are subject to change. (c) Funds Available The following chart summarizes the total funds available to the Issuer: FORM 2A LISTING STATEMENT May 25, 22 Page 9
10 NOVO RESOURCES CORP. Available Funds Total Working Capital as at April 23 $4,54,97 Total Available Funds $4,54,97 (d) Principle Purpose It is intended that the total funds available to the Issuer will be expended as follows over the next 2 months: Allocation of Total Available Funds Estimated work program $2,, Estimated ongoing legal, accounting, auditing, stock exchange, $87,5 transfer agent and filing fees (2 months) Estimated administration, rent, telephone, internet, travel, office $56,5 expenses (2 months) Management and consulting fees pursuant to management services $3, agreement and consulting agreements (2 months) Unallocated working capital to fund ongoing operations $,6,97 Total Available Funds $4,54,97 (2) N/A (3) N/A 4.2 Outstanding Asset-backed Securities The Issuer does not have any asset-backed securities. 4.3 Disclosure of Mineral Projects Please see Appendix A Technical Report and Resource Estimate, Beatons Creek Project, for further details. 4.4 N/A 5. Selected Consolidated Financial Information 5. Selected Annual Information For the year ended January 3, 23 and 22, the consolidated financial statements have been prepared in accordance with IFRS. For the year ended January 3, 2, the consolidated financial statements have been restated in accordance with IFRS. All figures are expressed in Canadian dollars. FORM 2A LISTING STATEMENT May 25, 22 Page
11 NOVO RESOURCES CORP. Statement of Operations and Deficit Data Year Ended January 3, 23 ($) Year Ended January 3, 22 ($) Year Ended January 3, 2 ($) Total Revenue (interest income only) $32,26 $27,57 $,262 Net Income (Loss) $(2,428,43) $(893,96) $(43,59) Net Income (Loss) per common share outstanding - basic and diluted $(.7) $(.5) $(.5) Dividend $Nil $Nil $Nil In accordance with IFRS In accordance with IFRS Restated as per IFRS Balance Sheet Data Year Ended January 3, 23 ($) Year Ended January 3, 22 ($) Year Ended January 3, 2 ($) Total Assets $2,34,389 $8,3,676 $2,4,674 Non-current Liabilities $Nil $Nil $Nil Shareholders Equity $,835,362 $7,887,6 $,997,447 Net Loss The Issuer incurred a net loss of $2,428,43 in the fiscal year ended January 3, 23, net loss of $893,96 in the fiscal year ended January 3, 22, and a net loss of $43,59 in the fiscal year end January 3, 2. The significant variance was mainly attributable to an impairment of exploration and evaluation assets (disposition) (23 - $Nil, 22 - $34,637, 2 - $Nil) and impairment of marketable securities (23 - $84,632, 22 - $Nil, 2 - $Nil). Explanations for the fluctuations in net losses are summarized below by separately identifying six major categories of expenses. The categories are (i) share-based payments (ii) property investigations (iii) advertising and promotion expenses, (iv) wages and salaries, (v) impairment of exploration and evaluation assets (disposition) (vi) impairment of marketable securities. Share-based payments For fiscal 23, $583,26 in share-based payments was recorded compared to $8,594 in fiscal 22 and $26,72 in fiscal 2. The reason for the increase was due to the issuance of stock options in fiscal 23. Property investigations During fiscal 23, the Issuer recognized project investigation expenditures of $98,23 as compared to $276,498 recognized in fiscal 22 and $24,596 in fiscal 2. The difference can be explained by the fact that in fiscal 22, the Issuer performed increased geological activities investigating properties for future exploration potential whereas in fiscal 23, the Issuer explored properties it already had ownership of and related costs have been capitalized in exploration and evaluation assets. FORM 2A LISTING STATEMENT May 25, 22 Page
12 NOVO RESOURCES CORP. Advertising and promotion For the 23 fiscal year, $78,26 in advertising and promotion expenses was recorded compared to $nil in fiscal years 22 and 2. The differences can be explained by the fact that the Issuer engaged more advertising and promotion activities in fiscal 23, such as, attending a mining and prospecting conferences and building the Issuer website. Wages and salaries During fiscal 23, the Issuer recognized wage and salary expenses of $2,47 compared to $9,52 in fiscal 22 and $nil in fiscal 2. The differences can be explained by the fact that the Issuer signed employment agreements with three (3) key employees in late fiscal 22. Impairment of marketable securities During fiscal 23, the Issuer recognized impairment of marketable securities of $84,632 as compared to $nil in fiscal 22 and $nil in fiscal 2. The increase in fiscal 23 can be explained by the fact that certain of the Issuer s investments were deemed to be impaired as at January 3, 23, and written-off as a result. Impairment of exploration and evaluation assets (disposition) During fiscal 23, the Issuer recognized impairment of exploration and evaluation assets of $nil as compared to $34,637 in fiscal 22 and $nil in fiscal 2. The difference can be explained by the fact that in fiscal 22, the Issuer terminated the Enterprise Property option agreement and returned the mineral claims to the Optionor. As a condition to terminate the option agreement, the Issuer paid $35,274 to the Optionor and wrote-off $99,363 of the exploration and evaluation assets relating to the Enterprise Property. Total Assets Total assets increased from $2,4,674 as at January 3, 2 to $8,3,676 as at January 3, 22 and $2,34,389 as at January 3, 23. Total assets consist mainly of cash and cash equivalents and exploration and evaluation assets and increased significantly from the previous year mainly due to the proceeds from the brokered private placement of the Issuer which closed on December 2, 22, and exploration expenditures of the Issuer s mineral properties. Shareholders Equity Total shareholders equity increased from $,997,447 as at January 3, 2 to $7,887,6 as at January 3, 22 and $,835,362 as at January 3, 23. Total shareholders equity consisted mainly of share capital and increased significantly mainly due to the securities issued from the private placements of the Issuer which closed on November 3, 2 (fiscal year 22) and December 2, 22 (fiscal year 23). FORM 2A LISTING STATEMENT May 25, 22 Page 2
13 NOVO RESOURCES CORP. 5.2 Quarterly Information The following table sets out selected unaudited quarterly financial information of the Issuer for the eight most recently quarters of operation. This information is derived from unaudited quarterly financial statements prepared by management. The financial data for the quarters are prepared in accordance with IFRS. 4 th Quarter 23 January 3, 23 Overall, advertising and promotion, accounting fees, consulting fees, impairment of marketable securities, impairment of exploration and evaluation assets, project investigation, share-based payments, legal fees, wages and salaries and general office and administrative expenses were the major components that caused variances in net loss from quarter to quarter. 5.3 N/A 5.4 N/A 6. Management's Discussion and Analysis Annual MD&A 6. Date 3 rd Quarter 23 October 3, 22 The date of this annual management s discussion and analysis (the MD&A ) is May 3, Overall Performance 2 nd Quarter 23 July 3, 22 st Quarter 23 April 3, 22 4 th Quarter 22 January 3, 22 The following discussion of the Issuer s financial performance is based on the audited consolidated financial statements for the year ended January 3, 23 and 22. Total current assets amount to $5,776,57 (January 3, 22 - $5,96,77). The increase in total current assets is mainly due to the closing of a brokered private placement in December 22 (the Private Placement ). Non-current assets at January 3, 23, totaled $6,357,882 (January 3, 22 - $2,833,95). The increase in noncurrent assets is mainly due to increases in exploration expenditures on the Beatons Creek Tenements, Paleo-Placer Project and Grant s Hill Property. FORM 2A LISTING STATEMENT May 25, 22 Page 3 3 rd Quarter 22 October 3, 2 2 nd Quarter 22 July 3, 2 st Quarter 22 April 3, 2 Net Sales $Nil $Nil $Nil $Nil $Nil $Nil $Nil $Nil Net Income $(3, (,86,83) (279,57) (488,38) (474,352) Gain/(Loss) 64) (7,88) (28,96) (39,28) Basic and Diluted Loss Per Share ($.3) ($.) ($.2) ($.2) ($.5) ($.) ($.2) ($.2)
14 NOVO RESOURCES CORP. During the year ended January 3, 23, the Issuer reported a net loss of $2,428,43 (January 3, 22 $893,96) ($.7 basic and diluted loss per share) (January 3, 22 - $.5 basic and diluted loss per share). The increase in net loss is mainly due to the share-based payments for the options granted to directors, officers and employees of the Issuer in February 22 and the impairment of marketable securities. 6.3 Selected Annual Information For the year ended January 3, 23 and 22, the consolidated financial statements have been prepared in accordance with IFRS. For the year ended January 3, 2, the consolidated financial statements have been restated in accordance with IFRS. All figures are expressed in Canadian dollars. Statement of Operations and Deficit Data Year Ended January 3, 23 ($) Year Ended January 3, 23 ($) Year Ended January 3, 22 ($) Year Ended January 3, 22 ($) Year Ended January 3, 2 ($) Total Revenue (interest income only) $32,26 $27,57 $,262 Net Income (Loss) $(2,428,43) $(893,96) $(43,59) Net Income (Loss) per common share outstanding - basic and diluted $(.7) $(.5) $(.5) Dividend $Nil $Nil $Nil Year Ended January 3, 2 ($) Balance Sheet Data Total Assets $,234,389 $8,3,676 $2,4,674 Non-current Liabilities $Nil $Nil $Nil Shareholders Equity $,835,362 $7,887,6 $,997, Variations Net Loss The Issuer incurred a net loss of $2,428,43 in the fiscal year ended January 3, 23, net loss of $893,96 in the fiscal year ended January 3, 22, and a net loss of $43,59 in the fiscal year end January 3, 2. The significant variance was mainly attributable to an impairment of exploration and evaluation assets (disposition) (23 - $Nil, 22 - $34,637, 2 - $Nil) and impairment of marketable securities (23 - $84,632, 22 - $Nil, 2 - $Nil). Explanations for the fluctuations in net losses are summarized below by separately identifying six major categories of expenses. The categories are (i) share-based payments (ii) property investigations (iii) advertising and promotion expenses, (iv) wages and salaries, (v) impairment of exploration and evaluation assets (disposition) (vi) impairment of marketable securities. FORM 2A LISTING STATEMENT May 25, 22 Page 4
15 NOVO RESOURCES CORP. Share-based payments For fiscal 23, $583,26 in share-based payments was recorded compared to $8,594 in fiscal 22 and $26,72 in fiscal 2. The reason for the increase was due to the issuance of stock options in fiscal 23. Property investigations During fiscal 23, the Issuer recognized project investigation expenditures of $98,23 as compared to $276,498 recognized in fiscal 22 and $24,596 in fiscal 2. The difference can be explained by the fact that in fiscal 22, the Issuer performed increased geological activities investigating properties for future exploration potential whereas in fiscal 23, the Issuer explored properties it already had ownership of and related costs have been capitalized in exploration and evaluation assets. Advertising and promotion For the 23 fiscal year, $78,26 in advertising and promotion expenses was recorded compared to $nil in fiscal years 22 and 2. The differences can be explained by the fact that the Issuer engaged more advertising and promotion activities in fiscal 23, such as, attending a mining and prospecting conferences and building the Issuer website. Wages and salaries During fiscal 23, the Issuer recognized wage and salary expenses of $2,47 compared to $9,52 in fiscal 22 and $nil in fiscal 2. The differences can be explained by the fact that the Issuer signed employment agreements with three (3) key employees in late fiscal 22. Impairment of marketable securities During fiscal 23, the Issuer recognized impairment of marketable securities of $84,632 as compared to $nil in fiscal 22 and $nil in fiscal 2. The increase in fiscal 23 can be explained by the fact that certain of the Issuer s investments were deemed to be impaired as at January 3, 23, and written-off as a result. Impairment of exploration and evaluation assets (disposition) During fiscal 23, the Issuer recognized impairment of exploration and evaluation assets of $nil as compared to $34,637 in fiscal 22 and $nil in fiscal 2. The difference can be explained by the fact that in fiscal 22, the Issuer terminated the Enterprise Property option agreement and returned the mineral claims to the Optionor. As a condition to terminate the option agreement, the Issuer paid $35,274 to the Optionor and wrote-off $99,363 of the exploration and evaluation assets relating to the Enterprise Property. Total Assets Total assets increased from $2,4,674 as at January 3, 2 to $8,3,676 as at January 3, 22 and $2,34,389 as at January 3, 23. Total assets consist mainly FORM 2A LISTING STATEMENT May 25, 22 Page 5
16 NOVO RESOURCES CORP. of cash and cash equivalents and exploration and evaluation assets and increased significantly from the previous year mainly due to the proceeds from the brokered private placement of the Issuer which closed on December 2, 22, and exploration expenditures of the Issuer s mineral properties. Shareholders Equity Total shareholders equity increased from $,997,447 as at January 3, 2 to $7,887,6 as at January 3, 22 and $,835,362 as at January 3, 23. Total shareholders equity consisted mainly of share capital and increased significantly mainly due to the securities issued from the private placements of the Issuer which closed on November 3, 2 (fiscal year 22) and December 2, 22 (fiscal year 23). 6.5 Results of Operations During the year ended January 3, 23, the Issuer incurred a net loss of $2,428,43 compared to a net loss of $893,96 for the year ended January 3, 22. The net loss for the year ended January 3, 23 relates primarily to operating loss of $,587,29 (January 3, 22 - $87,786), non-operating losses of $797,264 (January 3, 22 $9,6) and a deferred tax expense of $43,75 (January 3, 22 recovery of $43,75). The operating loss was mainly due to share-based payments of $583,26 (January 3, 22 - $8,594) related to the issuance of stock options, consulting fees of $297,943 (January 3, 22 - $265,9) related to administration, geological, corporate communication, investor relations, computer services and management services provided by directors, officers and consultants of the Issuer, property investigation of $98,23 (January 3, 22 - $276,498) related to legal services and geological activities investigating properties for future exploration potential, wages and salaries of $2,47 (January 3, 22 - $9,52) related to employee payroll, legal fees of $95,725 (January 3, 22 - $73,737) related to corporate matters, advertising and promotion expenses of $78,26 (January 3, 22 - $nil) related to conference and marketing expenses, accounting and audit fees of $55,53 (January 3, 22 - $4,77) related to general audit and tax return services, insurance expense of $27,64 (January 3, 22 - $2,7) related to directors and officers liability insurance coverage, travel expenses of $26, (January 3, 22 - $7,74) related to management travel expenses, and filing fees of $24,64 (January 3, 22 - $2,95) related to the CNSX s monthly listing fees and regulatory filing requirements. The residual balance of $79,658 (January 3, 22 - $8,768) is comprised of office and general, computer and internet, rent, transfer agent, telephone, meals and entertainment, professional development and depreciation expenses. During the year ended January 3, 23, non-operating items includes interest income of $32,26 (January 3, 22 - $27,57) and foreign exchange losses of $63 (January 3, 22 $,48). Other non-operating items include: realized gains on the sale of marketable securities of $2,7 (January 3, 22 - $nil) due to the sale of shares of EurOmax Resources Ltd (Euromax), and the impairment of marketable securities totaling $84,632 (January 3, 22 - $nil) due to the significant decline in value of common share held in Euromax, Evolving Gold Corp and Prosperity Goldfields Corp. During the period from incorporation on October 28, 29 to January 3, 23, there were no operating revenues as the Issuer was still in the acquisition and exploration stage. FORM 2A LISTING STATEMENT May 25, 22 Page 6
17 NOVO RESOURCES CORP. Due to the Issuer being in its early stage of development, management foresees further increases in the Issuer s expenses during the coming year resulting from its exploration activities. These expenses are contingent upon the Issuer s ability to fund these projects through private placements and other forms of financing. In the event that the Issuer does not receive the required funding, management will review all on-going expenditures and take appropriate actions to remedy the funding shortage. 6.6 Summary of Quarterly Results The following table sets out selected unaudited quarterly financial information of the Issuer for the eight most recently quarters of operation. This information is derived from unaudited quarterly financial statements prepared by management. The financial data were prepared in accordance with IFRS. 4 th Quarter 22 January 3, 23 Overall, advertising and promotion, accounting fees, consulting fees, impairment of marketable securities, impairment of exploration and evaluation assets, project investigation, share-based payments, legal fees, wages and salaries and general office and administrative expenses were the major components that caused variances in net loss from quarter to quarter. 6.7 Liquidity 3 rd Quarter 22 October 3, 22 2 nd Quarter 22 July 3, 22 st Quarter 22 April 3, 22 4 th Quarter 2 January 3, 22 As at January 3, 23, the Issuer had cash and cash equivalents balance of $5,293,833 compared to $5,4,2 as at January 3, 22. The Issuer had working capital as at January 3, 23, of $5,477,48 compared to working capital of $5,53, as at January 3, 22. The increase in working capital is mainly due to the closing of the Private Placement in December 22. Cash used in operating activities during the year ended January 3, 23, was $,32,63 (January 3, 22 - $86,855). The increase over the period relates mainly to increases in consulting fees, wages and salaries, legal fees and advertising and promotion expenses. Cash used for investing activities during the year ended January 3, 23, was $3,65,72 (January 3, 22 - $,867,544). The Issuer s principal investing activity is the acquisition and exploration of its resource property. During the year ended January 3, 23, the Issuer incurred $3,456,683 (January 3, 22 - $282,87) on its resource property. During the year ended January 3, 23, the Issuer acquired,987,527 FORM 2A LISTING STATEMENT May 25, 22 Page 7 3 rd Quarter 2 October 3, 2 2 nd Quarter 2 July 3, 2 st Quarter 2 April 3, 2 Net Sales $Nil $Nil $Nil $Nil $Nil $Nil $Nil $Nil Net Income Gain/(Loss) (,86,83) (279,57) (488,38) (474,352) (3,64) (7,88) (28,96) (39,28) Basic and Diluted Loss Per Share ($.3) ($.) ($.2) ($.2) ($.5) ($.) ($.2) ($.2)
18 NOVO RESOURCES CORP. common shares and 833,333 share purchase warrants of Prosperity Goldfields Corp. for total investment of $,, from a securities purchase agreement, and 2,, common shares and 2,, share purchase warrants of Evolving Gold Corp. for a total investment of $6, from participating in a non-brokered private placement. Cash provided by financing activities during the year ended January 3, 23, was $5,6,947 (January 3, 22 - $5,94,27). During the year January 3, 23, the Issuer issued common shares upon the exercise of share purchase warrants for gross proceeds of $,598,39 and exercises of stock options for gross proceeds of $2,875. On December 2, 22, the Issuer completed a brokered private placement, raising $3,767, by the issuance of 5,795,4 units at a price of $.65 per unit. As at the date of this Listing Statement, the contractual obligations of the Issuer are the Millennium Agreement and the JVA s. Reference should be made to section 4.3: Disclosure of Mineral Projects. 6.8 Capital Resources The Issuer will continue to require funds for future property acquisitions and exploration work as well as to meet its ongoing day-to-day operating requirements and will have to continue to rely on equity and debt financing. The Issuer s capital resources are largely determined by the strength of the junior resource markets and by the status of the Issuer s projects in relation to these markets, and its ability to compete for investor support of its projects. There can be no assurance that financing, whether debt or equity, will always be available to the Issuer in the amount required at any particular period or if available, that it can be obtained on terms satisfactory to the Issuer. 6.9 Off-Balance Sheet Arrangements There are currently no off balance sheet arrangements which could have a material effect on current or future results of operations, or the financial condition of the Issuer. 6. Transactions with Related Parties A number of key management personnel, or their related parties, hold positions in other entities that result in them having control or significant influence over the financial or operating policies of those entities. Certain of these entities transacted with the Issuer during the year. (a) Key Management Personnel Disclosures During the years ended January 3, 23 and 22, the following amounts were incurred with respect to the Chief Executive Officer, the Chief Financial Officer and directors of the Issuer: FORM 2A LISTING STATEMENT May 25, 22 Page 8
19 NOVO RESOURCES CORP. January 3, January 3, $ $ Consulting services 59,25 68,3 Wages and salaries 56,28 5,92 Wages and salaries included in exploration and evaluation assets 2,696 9,28 Share-based payments 25, ,46 93,53 (b) Other Related Party Disclosures During the period ended January 3, 23 and 22, the following amounts were incurred with respect to a corporation controlled by the Chief Financial Officer: January 3, January 3, $ $ Consulting services 2, 2, 2, 2, 6. Fourth Quarter During the three month period ended January 3, 23, the major expenses of the Issuer were consulting fees of $7,2, wages and salaries of $28,673, advertising and promotion expenses of $37,46, legal fees of $3,29, share-based payments of $3,23, and travel and accommodation of $,532. During the three month period ended January 3, 23, operating expenses were mitigated by non-operating items such as interest income of $8, Proposed transactions The Issuer does not currently have any proposed transactions approved by the Board of Directors. All current transactions are fully disclosed in the audited consolidated financial statements for the year ended January 3, Change in accounting policies The following new standards, which have not been applied in these financial statements, may have an effect on the Issuer s future financial statements: IFRS 9 Financial Instruments IFRS 9 Financial Instruments is part of the IASB's wider project to replace IAS 39 Financial Instruments: Recognition and Measurement. IFRS 9 retains but simplifies the mixed measurement model and establishes two primary measurement categories for financial assets: amortized cost and fair value. The basis of classification depends on the entity's business model and the contractual cash flow characteristics of the financial asset. The standard is effective for annual periods beginning on or after February, 25. The Issuer is in the process of evaluating the impact of the new standard on the accounting for the FORM 2A LISTING STATEMENT May 25, 22 Page 9
20 NOVO RESOURCES CORP. Issuer s investments classified as available-for-sale and fair value through profit and loss. IFRS Consolidated Financial Statements IFRS builds on existing principles by identifying the concept of control as the determining factor in whether an entity should be included within the consolidated financial statements of the parent Issuer. The standard provides additional guidance to assist in the determination of control where this is difficult to assess. The Issuer is yet to assess the full impact of IFRS and intends to adopt the standard no later than the accounting period beginning on February, 23. IFRS Joint Arrangements IFRS describes the accounting for arrangements in which there is joint control; proportionate consolidation is not permitted for joint ventures (as newly defined). IFRS replaces IAS 3 Interests in Joint Ventures and SIC 3 Jointly Controlled Entities Non-Monetary Contributions by Venturers. The Issuer is yet to assess the full impact of IFRS and intends to adopt the standard no later than the accounting period beginning on February, 23. IFRS 2 Disclosures of Interests in Other Entities IFRS 2 includes the disclosure requirements for all forms of interests in other entities, joint arrangements, associates, special purpose vehicles and other off balance sheet vehicles. The Issuer is yet to assess the full impact of IFRS 2 and intends to adopt the standard no later than the accounting period beginning on February, 23. IFRS 3 Fair Value Measurement IFRS 3 aims to improve consistency and reduce complexity by providing a precise definition of fair value and a single source of fair value measurement and disclosure requirements for use across IFRSs. The requirements, which are largely aligned between IFRSs and US GAAP, do not extend the use of fair value accounting but provide guidance on how it should be applied where its use is already required or permitted by other standards within IFRSs or US GAAP. The Issuer is yet to assess the full impact of IFRS 3 and intends to adopt the standard no later than the accounting period beginning on February, 23. IAS Presentation of Financial Statements IAS was amended to change the grouping of items presented in OCI. Items that would be reclassified to profit or loss at a future point in time will be presented separately from items that will never be reclassified. The amendments do not change the nature of the items that are currently recognized in OCI, nor do they impact the determination of whether items in OCI are reclassified through profit or loss in future periods. The Issuer is yet to assess the full impact of this amendment to IAS and will adopt the standard for the annual period beginning on February, 23. None of the other new standards, interpretations and amendments, which are effective for periods beginning after February, 23 and which have not been adopted early, are expected to have a material effect on the Issuer s future financial statements. FORM 2A LISTING STATEMENT May 25, 22 Page 2
21 NOVO RESOURCES CORP. 6.4 The Issuer changed its accounting policy for awards of stock-based compensation granted to the Issuer s officers, directors, employees and consultants with a graded vesting schedule. Prior to August, 2, the fair value of stock options with a graded vesting schedule was recognized as compensation expense and a credit to Contributed surplus on a straight line basis over the applicable vesting period. Effective August, 2, the fair value of stock options with a graded vesting schedule is determined based on different expected lives for the options that vest each year, as it would be if the award is viewed as several separate awards, each with a different vesting date, and it is accounted for on that basis. The new accounting policy provides more reliable and relevant information because it more closely reflects the substance of the expected lives of each option or unit of award. The impact of the change in accounting policy for awards granted to the Issuer s officers, directors, employees and consultants with a graded vesting schedule was immaterial to the current or any prior periods and therefore was not adjusted. 6.5 Financial Instruments and Other Instruments a) Fair value The Issuer s financial instruments include cash and cash equivalents, marketable securities (warrants and common shares), and accounts payable and accrued liabilities. IFRS 7 establishes a fair value hierarchy for financial instruments measured at fair value that reflects the significance of inputs in making fair value measurements as follows: Level applied to assets or liabilities for which there are quoted prices in active markets for identical assets or liabilities. Level 2 applies to assets or liabilities for which there are inputs other than quoted prices included in Level that are observable for the asset or liability, either directly such as quoted prices for similar assets or liabilities in active markets or indirectly such as quoted prices for identical assets or liabilities in markets with insufficient volume or infrequent transactions. Level 3 applies to assets or liabilities for which there are unobservable market data. The recorded amounts of accounts payable and accrued liabilities approximate their respective fair values due to the short-term nature. Cash and cash equivalents and marketable securities (common shares) are measured using Level inputs. The fair values of marketable securities (common shares) are measured at the closing market price obtained from the exchange. Marketable securities (warrants) are measured using Level 3 inputs. The fair values of marketable securities (warrants) are based on management`s assessment of realizable value. FORM 2A LISTING STATEMENT May 25, 22 Page 2
22 NOVO RESOURCES CORP. b) Credit Risk Financial instruments that potentially subject the Issuer to a concentration of credit risk consist primarily of cash and cash equivalents. The Issuer limits its exposure to credit loss by placing its cash and cash equivalents with high credit quality financial institutions. The carrying amount of financial assets represents the maximum credit exposure. c) Foreign Exchange Rate Risk The Issuer has operations in Canada and Australia subject to foreign currency fluctuations. The Issuer s operating expenses are incurred in Canadian, Australian and the United States dollar, and the fluctuation of the Canadian dollar in relation to these other currencies will have an impact upon the profitability of the Issuer and may also affect the value of the Issuer s assets and the amount of shareholders equity. The Issuer s exposure to foreign currency risk arises primarily on fluctuations between the Canadian dollar, US dollar, and the Australian dollar. The Issuer has not entered into any derivative instruments to manage foreign exchange fluctuations. At January 3, 23 and 22 the Issuer s Australian and US dollar denominated monetary assets and monetary liabilities are as follows: Australian Monetary assets January 3, 23 January 3, 22 Cash and cash equivalents 7, Accounts payable and accrued liabilities 24,229 27,664 US Monetary assets January 3, 23 January 3, 22 Cash and cash equivalents 4,732 5,9 Accounts payable and accrued liabilities 2, The exposure to foreign exchange rate risk is considered minimal. d) Liquidity Risk Liquidity risk is managed by ensuring sufficient financial resources are available to meet obligations associated with financial liabilities. All of the Issuer s financial liabilities are classified as current and the Issuer has a practice of paying their outstanding payables within 3 days. e) Price Risk The Issuer is exposed to price risk with respect to commodity prices. The Issuer s ability to raise capital to fund exploration and evaluation activities is subject to risks associated with fluctuations in the market price of commodities. FORM 2A LISTING STATEMENT May 25, 22 Page 22
23 NOVO RESOURCES CORP. As at January 3, 23, the Issuer owns common shares and share purchase warrants included in marketable securities. By holding these marketable securities, the Issuer is inherently exposed to various risk factors market price risk. (f) Interest Risk Interest rate risk is the risk that the fair value or cash flows of a financial instrument will fluctuate because of changes in market interest rates. The Issuer has interest-bearing assets in relation to cash at banks and GICs carried at floating interest rates with reference to the market. The Issuer s operating cash flows are substantially independent of changes in market interest rates. The Issuer has not used any financial instrument to hedge potential fluctuations in interest rates. The exposure to interest rates for the Issuer is considered minimal. The Issuer has no interest bearing borrowings. Interim MD&A 6.5 N/A 6.6 N/A 6.7 Additional Disclosure for Issuers without Significant Revenue: The Issuer has incurred the following material cost components: The Issuer has incurred the following material cost components: Year ended January 3, 23 Year ended January 3, 22 $ $ Accounting Fee 55,53 4,77 Advertising and Promotion 78,26 - Consulting Fees 297, ,9 Filing Fees 24,64 2,95 Insurance 27,64 2,7 Legal Fees 95,725 73,737 Office & General 9,385 57,79 Project Investigation 98,23 276,498 Rent 3,58 - Share-based Payment 583,26 8,594 Transfer Agent Fees,679,95 Travel 26, 7,74 Wages & Salaries 2,47 9,52 Exploration and Evaluation Assets 4,478, ,822 During the year ended January 3, 23, $55,53 (January 3, 22 - $4,77) in accounting fees was paid in relation to the previous year s financial statement audit. FORM 2A LISTING STATEMENT May 25, 22 Page 23
24 NOVO RESOURCES CORP. During the year ended January 3, 23, $78,26 (January 3, 22 - $Nil) in advertising and promotion expenses were related to mining and prospecting conferences and general corporate matters. During the year ended January 3, 23, consulting fees totalling $297,943 (January 3, 22 - $265,9) were mainly paid to directors, officers and consultants of the Issuer to provide geological, corporate communication, administrative, investor relations, computer services and management services to the Issuer. The transactions were conducted in the normal course of operations, on commercial terms established and agreed to by the related parties, and were recorded at the exchange amount. Filing fees during the year ended January 3, 23, totalling $24,64 (January 3, 22 - $2,95) were related to the CNSX s monthly listing fees and regulatory filing fees. Insurance expense of $27,64 was recorded during the year ended January 3, 23 (January 3, 22 - $2,7) was related to directors and officers liability insurance coverage. Legal fees during the year ended January 3, 23, totalling $95,725 (January 3, 22 - $73,737) were related to general corporate affairs. General office administrative expenses during the year ended January 3, 23, totaling $9,385 (January 3, 22 - $57,79) were mainly related to the purchase of office supplies. During the year ended January 3, 23, $98,23 (January 3, 22 - $276,498) in project investigation was paid in relation to legal services and geological activities provided for investigating properties for future exploration potential. During the year ended January 3, 23, $3,58 (January 3, 22 - $nil) in rent expense was paid in relation to the rent of the Issuer s US office and storage unit in Colorado, USA. During the year ended January 3, 23, $583,26 in share-based payments, a noncash charge, was expensed (January 3, 22 - $8,594), being the estimated fair value of the stock options vested in the period. The Issuer used the Black-Scholes option pricing model for all fair value calculations. During the year ended January 3, 23, $,679 (January 3, 22 - $,95) in transfer agent fees was paid in relation to general monthly transfer agent expenses. During the year ended January 3, 23, $26, (January 3, 22 - $7,74) in travel expenses was paid in relation to management travel expenses between Canada, USA and Australia. During the year ended January 3, 23, $2,47 (January 3, 22 - $9,52) in wages and salaries was paid to employees for providing management, geological and administrative services to the Issuer. The Issuer has capitalized the following exploration and development costs: FORM 2A LISTING STATEMENT May 25, 22 Page 24
25 NOVO RESOURCES CORP. Acquisition Costs ,52 288,86 35,326 Exploration Expenditures: Drilling,45, ,32,254,63 Feasibility Study 23, ,25 Field Work 222,29-469, ,93 Fuel 5, ,32,847 Geology 62, , ,699 Legal 23, ,833 5,36 Meals & Travel 33, ,32 93,966 Office and General 73, ,7 6,727 Reports, Data and Analysis 5,96 -,25 7, ,98 Rock Samples 597, ,25 639,595 Tenement Administration,352 -,892 53,694 65,938 Foreign Exchange 3, ,63 2,452,26-3,6 737,662 3,93,399 Balance, January 3, 23 3,385,948-66,3,26,468 4,478,547 Beatons Creek Enterprise Grant's Hill Paleo- Placer Total $ $ $ $ $ Balance, January 3, , ,822 Beatons Creek Enterprise Grant's Hill Paleo- Placer Total $ $ $ $ $ Balance, January 3, 2-99, ,363 Acquisition Costs 52, ,274 Exploration Expenditures: Data Processing 6, ,959 Distillate Drilling 24, ,46 Field Supplies 8, ,53 General Administration 5, ,88 Geological Services 52, ,369 Maps Miscellaneous Project Supervision 32, ,666 Rock Samples 2, ,24 Surveying 7, ,294 Tenements 9, ,75 Travel & Accommodation 25, ,37 43, ,548 Option agreement termination payment - 35, ,274 Impairment of exploration and evaluation assets - (34,637) - - (34,637) Balance, January 3, , ,822 FORM 2A LISTING STATEMENT May 25, 22 Page 25
26 NOVO RESOURCES CORP. As of the year ended January 3, 23, the Issuer capitalized exploration and evaluation costs of $4,478,547 (January 3, 22 - $933,822). Reference should be made to the section titled: Exploration and Evaluation Assets. 6.8 Description of Securities Authorized: Unlimited number of common voting shares without nominal or par value. All issued common shares are fully paid. Details of common shares are as follows: During fiscal 2: (a) On June, 2, the Issuer completed its initial public offering (the IPO ) raising gross proceeds of $4,. A total of 2,, common shares of the Issuer were issued at a price of $.2 per share pursuant to the final prospectus of the Issuer dated April 23, 2. As part of the IPO, the Issuer incurred share issuance costs of $3,5, which included 6, agent s warrants. The agent warrants were granted to the agent with an exercise price of $.2 and expire in 2 years. The agent s warrants were valued at fair value of $8,373. The fair value of these warrants was $. per share where the exercise price is the same as the market price at the date of grant and the fair value of each warrant granted is calculated using the Black-Scholes option pricing model assuming a risk-free interest rate of.55%, a dividend yield of $Nil, an expected volatility of % and an average expected life of 2 years. The average remaining contractual life in years is.36. As of January 3, 22, 86,382 of the agent s warrants remain outstanding. (b) On July 7, 2, the Issuer issued 2, common shares at $.2 per share pursuant to the provisions of the mineral interest option agreements. (c) On January, 2, the Issuer completed a non-brokered private placement of 6,57, units at a price of $.25 per unit for gross proceeds of $,642,5. Each unit consists of one common share and one-half of one share purchase warrant. Each whole warrant entitles the holder to purchase one additional common share of the Issuer at a price of $.5 per share for a period of 2 years from the closing date of the private placement. As part of the private placement, the Issuer incurred share issuance costs of $3,3. During fiscal 22: (a) On November 3, 2, the Issuer completed a non-brokered private placement of 4,782,5 units at a price of $.4 per unit for gross proceeds of $5,93,5. Each unit consists of one common share and one share purchase warrant. Each whole warrant entitles the holder to purchase one additional common share of the Issuer at a price of $.6 per share for a period of 2 years from the closing date of the private placement. As part of the private placement, the Issuer incurred share issuance costs of $,544. During fiscal 23: FORM 2A LISTING STATEMENT May 25, 22 Page 26
27 NOVO RESOURCES CORP. (a) During the year ended January 3, 23, a total of 86,346 IPO agent s share purchase warrants were exercised at a price of $.2 for gross proceeds of $7,269. A total of $9,95 of the reserve balance was reversed and credited to the share capital account. (b) During the year ended January 3, 23, a total of 3,7,5 share purchase warrants issued from the January, 2 private placement were exercised at a price of $.5 for gross proceeds of $,553,75. (c) During the year ended January 3, 23, a total of 45,5 share purchase warrants issued from the November 3, 2 private placement were exercised at a price of $.6 for gross proceeds of $27,3. (d) During the year ended January 3, 23, a total of 25, stock options issued from the August 3, 2 grant were exercised at a price of $.2 for gross proceeds of $5,. A total of $3,567 of the reserve balance was reversed and credited to the share capital account. (e) During the year ended January 3, 23, a total of 37,5 stock options issued from the February 2, 22 grant were exercised at a price of $.45 for gross proceeds of $6,875. A total of $2,428 of the reserve balance was reversed and credited to the share capital account. (f) On December 2, 22, the Issuer completed a brokered private placement of 5,795,4 units at a price of $.65 per unit for gross proceeds of $3,767,. Each unit consists of one common share and one share purchase warrant. Each whole warrant entitles the holder to purchase one additional common share of the Issuer at a price of $.9 per share for a period of 2 years from the closing date of the private placement. As part of the private placement, the Issuer incurred share issuance costs of $486,437, which included 334,524 broker s warrants. The broker s warrants were granted to the broker of the private placement with an exercise price of $.65 and expire in 2 years. The broker s warrants were valued at fair value of $62,869. The fair value of these warrants was $.49 per share where the exercise price is $.65 and the fair value of each warrant granted is calculated using the Black-Scholes option pricing model assuming a risk-free interest rate of.9%, a dividend yield of $Nil, an expected volatility of 23% and an average expected life of 2 years. The average remaining contractual life in years is.86. As of January 3, 23, 334,524 of the broker s warrants remain outstanding. (g) Escrowed shares As at January 3, 23, the Issuer has 52,5 common shares held in escrow. All of the remaining common shares held in escrow will be released on June 4, 23. Warrants The continuity of warrants is as follows: FORM 2A LISTING STATEMENT May 25, 22 Page 27
28 NOVO RESOURCES CORP. January 3, 23 January 3, 22 Number Weighted Average Exercise Price Number Weighted Average Exercise Price Balance, beginning of year 8,53,882 $.58 3,45,46 $.49 Granted 6,29,924 $.89 4,782,5 $.6 Expired (77,536) $.5 - $ - Exercised (3,239,346) $.49 (44,79) $.2 Balance, end of year 2,866,924 $.68 8,53,882 $.58 Full share equivalent warrants outstanding and exercisable at of January 3, 23: Details: Price Per Expiry Date Share Warrants Outstanding November 3, 23 $.6 4,737, December 2, 24 $.9 5,795,4 December 2, 24 $ ,524 2,866,924 On June, 2, the Issuer issued 6, Agent s warrants in accordance with the agency agreement dated April 5, 2 (the Agency Agreement ). The Agent s warrants were granted to the agent with an exercise price of $.2 and expire June 9, 22. As at January 3, 23, and the date of this Listing Statement, 59,964 Agent s warrants have been exercised and 36 Agent s warrants have expired. On January, 2, the Issuer issued 3,285, warrants in accordance with the nonbrokered private placement. Each warrant entitles the holder to purchase one additional common share of the Issuer at a price of $.5 per share for a period of two (2) years from the closing date of the private placement. As at January 3, 23, 3,7,5 warrants from the non-brokered private placement have been exercised and 77,5 warrants expired. As at the date of this Listing Statement, 3,7,5 warrants from the non-brokered private placement have been exercised and 77,5 warrants expired. On November 3, 2, the Issuer issued 4,782,5 warrants in accordance with the non-brokered private placement. Each warrant entitles the holder to purchase one additional common share of the Issuer at a price of $.6 per share for a period of two (2) years from the closing date of the private placement. As at January 3, 23, 45,5 warrants from the non-brokered private placement have been exercised and 4,737, warrants remain outstanding. As at the date of this Listing Statement, 45,5 warrants from the non-brokered private placement have been exercised and 4,737, warrants remain outstanding. On December 2, 22, the Issuer issued 5,795,4 warrants in accordance with the brokered private placement. Each Warrant entitles the holder thereof to purchase one FORM 2A LISTING STATEMENT May 25, 22 Page 28
29 NOVO RESOURCES CORP. additional common share of the Issuer at a price of $.9 per share for a period of twenty-four (24) months from the closing date of the private placement. As at the date of this Listing Statement, 5,795,4 warrants from the brokered private placement remain outstanding. In connection with this brokered private placement, Agents were paid a cash commission of $226,2.6 and were granted common share purchase warrants (the Agent s Warrants ) to acquire 347,724 common shares of the Issuer at a price of $.65 per Agent s Warrant for a period of twenty-four (24) months from the closing date of the Financing. As at the date of this Listing Statement, 347,724 Agent s warrants from the brokered private placement remain outstanding. Share option plan The Issuer has adopted a rolling stock option plan (the Plan ), in which the maximum number of common shares which can be reserved for issuance under the Plan is % of the issued and outstanding shares of the Issuer. The exercise price of each option ( Option ) shall not be less than the closing price of the common shares on the trading day immediately preceding the day on which the Option is granted, less any discount permitted by CNSX. The continuity of stock options is as follows: January 3, 23 January 3, 22 Number Weighted Average Exercise Price Number Weighted Average Exercise Price Options outstanding, beginning of year 7, $.26 8, $.2 Granted,3, $.45 5, $.48 Exercised (62,5) $.35 (,) $.2 Expired (5,) $.48 (5,) $.2 Options outstanding, end of year,797,5 $.38 7, $.26 The options outstanding and exercisable at January 3, 23 are as follows: Number Outstanding Outstanding Options Weighted Average Exercise Price Weighted Average Remaining Contractual Life Exercisable Options Number Exercisable Weighted Average Exercise Price 25, $ , $.2 275, $ , $.2,272,5 $ ,25 $.45,797,5 $ ,6,25 $.34 On June, 2, the Issuer granted 5, stock options to a consulting firm that provides investor relations services. The options were exercisable at $.48 per share and have expired on May 3, 22. The weighted average fair value of options, estimated using the Black-Scholes option pricing model, was $.2 per option (January 3, 22 - $.8). On February 2, 22, the Issuer granted,3, stock options to certain directors, officers and consultants. The options are exercisable on or before February 2, 27 at an exercise price of $.45 per share. 327,5 options vested FORM 2A LISTING STATEMENT May 25, 22 Page 29
30 NOVO RESOURCES CORP. immediately and 327,5 options vested on August 2, 22, while the remaining 655, options carry the following vesting schedule: Number of Options Vesting Date 37,5 February 9, 23 37,5 August 2, 23 The weighted average fair value of options, estimated using the Black-Scholes option pricing model, was $.34 per option for the options granted to directors and officers (January 3, 22 - $Nil) and $.54 per option for the options granted to consultants (January 3, 22 - $Nil). For the year ended January 3, 23, the total share-based payment expense was $583,26 (22 - $8,594). Included in the amount, a total of $583,52 was relating to the options granted to certain directors, officers and consultants during this year. The Issuer used the Black-Scholes option pricing model to estimate the fair value of the options at the grant date using the following weighted average assumptions: Risk-free interest.2% -.5%.% rate Dividend yield - - Expected volatility 49% - 45% 2% Expected option life.25 years years years Forfeitures - - Based on the option pricing model, the fair value of options granted during this year was $583,52 (22- $8,594). Option-pricing models require the use of estimates and assumptions the expected volatility. The Issuer uses expected volatility rates which are based upon historical volatility rates. Changes in the underlying assumptions can materially affect the fair value estimates. Details: On August 6, 2, the Issuer granted 5, stock options to directors and officers of the Issuer whereby the option holders can purchase common shares at $.2 per share. The options vest immediately and will expire on June, 22. Each option entitles the holder to acquire one common share of the Issuer. On August 3, 2, the Issuer granted an additional 3, stock options to directors, officers, and consultants of the Issuer whereby the option holders can purchase common shares at $.2. The options vest immediately and will expire ten years from the grant date. Each option entitles the holder to acquire one common share of the Issuer. On June, 2, the Issuer granted 5, stock options to an investor relations consultant of the Issuer whereby the option holder can purchase common shares at $.48 per share. The options will vest 25% on the date of grant, 25% every three months FORM 2A LISTING STATEMENT May 25, 22 Page 3
31 NOVO RESOURCES CORP. thereafter and will expire one year from the grant date. Each option entitles the holder to acquire one common share of the Issuer. On, February 2, 22, the Issuer granted,3, stock options to certain directors, officers and consultants. The options are exercisable on or before February 2, 27 at an exercise price of $.45 per share. All of the options shall vest as to one-quarter of the options at the date of grant, one-quarter of the options six months following the date of the grant, one-quarter of the options twelve months following the date of grant, and onequarter of the options eighteen months following the date of grant. As at January 3, 23, 62,5 stock options have been exercised, 3, stock options have expired without exercise and there were,797,5 options outstanding. At the date of this Listing Statement, 62,5 stock options have been exercised, 3, stock options have expired without exercise and there are,797,5 options outstanding. 6.9 See section 6.7 above. 6.2 See section 6.7 above. 6.2 N/A 7. Market for Securities The Issuer s common shares are listed for trading on the CNSX under stock symbol NVO. The Issuer s shares also trade in the United States on the OTC market s prestigious tier, OTCQX International under the symbol of NSRPF Consolidated Capitalization 8. There has been no material change in the share and loan capital of the Issuer since the date of the audited financial statements as at January 3, Options to Purchase Securities 9. Summary of Stock Option Plan Incentive stock options are governed by the Issuer s stock option plan (the Plan ). The purpose of the Plan is to offer to directors, officers, employees and consultants of the Issuer and its affiliates the opportunity to acquire a proprietary interest in the Issuer, thereby providing an incentive to such persons to promote the best interests of the Issuer and to provide the Issuer with the ability to attract qualified persons as directors, officers and employees. The Plan is administered by the Board. Options issued pursuant to the Plan will have an exercise price determined by the Board provided that the exercise price shall not be less than the price permitted by the Exchange in accordance with the policies of the Exchange. FORM 2A LISTING STATEMENT May 25, 22 Page 3
32 NOVO RESOURCES CORP. Subject to the particular provisions of option agreements, options granted under the Plan are non-transferable and expire the earlier of years from the date of grant or 3 days from the date the optionee ceases to be an officer, director, employee or consultant of the Issuer, except in the event of death of an optionee, in which case options held by the estate of such optionee will expire one year from the date of the optionee s death. Stock Options The options outstanding and exercisable at the date of this Listing Statement are as follows: Category of Optionee Directors and Executive Officers Number of Optionees Number of Options Purchase price of Options Expiry Date 3 2, $.2 June, 22 5, $.2 August 2, 22 Directors who are not Executive Officers 45, $.45 February 2, , $.2 June, 22 5, $.2 August 2, 22 25, $.45 February 2, 27 Consultants 3 75, $.2 August 2, ,5 $.45 February 2, 27 TOTAL 8,797, Description of the Securities. The Issuer is authorized to issue an unlimited number of common shares. Common Shares The Issuer is authorized to issue an unlimited number of common shares without par value. The holders of common shares are entitled to receive notice of and attend all meetings of the shareholders of the Issuer and are entitled to one vote in respect of each common share held at such meetings. In the event of liquidation, dissolution or winding-up of the Issuer, the holders of common shares are entitled to share rateably the remaining assets of the Issuer. In the event of the liquidation, dissolution or winding-up of the Issuer or other distribution of its assets, the holders of the common shares will be entitled to receive, on a pro rata basis, all of the assets remaining after the Issuer has paid out its liabilities. Distribution in the form of dividends, if any, will be set by the board of directors of the Issuer. FORM 2A LISTING STATEMENT May 25, 22 Page 32
33 NOVO RESOURCES CORP..2 N/A.3 N/A.4 N/A.5 N/A.6 N/A.7 Prior Sale The following securities to be listed have been sold within the 2 months before the date of this Listing Statement: Type of Security Common shares Notes: Date Issued December 2, 22 Number of Securities Issue Price Per Security Approximate Aggregate Consideration Nature of Consideration 5,795,4 $.65 $3,767, Cash. On December 2, 22, the Issuer completed a brokered private placement of 5,795,4 units at a price of $.65 per unit for gross proceeds of $3,767,. Each unit consists of one common share and one share purchase warrant. Each whole warrant entitles the holder to purchase one additional common share of the Issuer at a price of $.9 per share for a period of 2 years from the closing date of the private placement..8 Stock Exchange Price The following is a summary of the high and low price ranges and volume traded on the CNSX for the Issuer for the 2-month period before the date of this Listing Statement. Month High Low Close Volume May 22 $.45 $.35 $ ,8 June 22 $.4 $.35 $ ,75 July 22 $.4 $.34 $ , August 22 $.7 $.38 $.98 4,93,89 September 22 $.3 $.79 $.87 2,7,56 October 22 $.8 $.84 $.92 2,27,288 November 22 $.3 $.6 $.68 2,883,58 December 22 $.8 $.67 $ ,84 January 23 $.75 $.67 $.72,,575 February 23 $.73 $.54 $ ,32 March 23 $.67 $.475 $.5,223,4 April 23 $.7 $.465 $.62 2,73,73 FORM 2A LISTING STATEMENT May 25, 22 Page 33
34 NOVO RESOURCES CORP.. Escrowed Securities. Escrowed Securities As at the date of this Listing Statement, shares shown in the following table is held in escrow pursuant to the Escrow Agreement: Designation of Class Number of Shares Held in Escrow or that are subject to a Contractual Restriction on Transfer Percentage of Class Common 52,5.2% Under the applicable policies and notices of the Canadian Securities Administrators, securities held by Principals are required to be held in escrow in accordance with the national escrow regime applicable to initial public distributions. Equity securities owned or controlled by Principals, common shares, except for % of each Principal s holdings of common shares, are subject to the escrow requirements. The Principals will deposit in escrow with the Olympia Trust Issuer the common shares held by them (the Escrowed Securities ) pursuant to the Escrow Agreement. The Escrow Agreement will provide that the Escrowed Securities will be released from escrow in equal blocks of 5% of a Principal s Escrowed Securities at six month intervals over the 36 months following June 4, 2, with % of each Principal s holdings being released on June 4, 2. All of the remaining common shares held in escrow will be released on June 4, 23. The Issuer is an emerging issuer as defined in the applicable policies and notices of the Canadian Securities Administrators, and if the Issuer achieves established issuer status during the term of the Escrow Agreement, it will graduate, resulting in a catch-up release and an accelerated release of any securities remaining in escrow under the 8 month schedule applicable to established issuers, as if the Issuer had originally been classified as an established issuer. Pursuant to the terms of the Escrow Agreement, the Escrowed Securities may not be transferred or otherwise dealt with during the term of the Escrow Agreement unless the transfers or dealings within the escrow are: (a) (b) (c) (d) transfers to continuing or, upon their appointment, incoming directors and senior officers of the Issuer or of a material operating subsidiary, with approval of the Issuer s Board; transfers to an RRSP or similar trustee plan provided that the only beneficiaries are the transferor or the transferor s spouse or children; transfers upon bankruptcy to the trustee in bankruptcy; and pledges to a financial institution as collateral for a bona fide loan, provided that upon a realization the securities remain subject to escrow. Tenders of Escrowed Securities to a take-over bid are permitted provided FORM 2A LISTING STATEMENT May 25, 22 Page 34
35 NOVO RESOURCES CORP. that, if the tenderer is a Principal of the successor corporation upon completion of the take-over bid, securities received in exchange for tendered Escrowed Securities are substituted in escrow on the basis of the successor corporation s escrow classification. 2. Principal Shareholders As at the date of this Listing Statement, there are no persons or companies who have or are known by the Issuer to have (a) direct or indirect beneficial ownership of, (b) control or direction over, or (c) a combination of direct or indirect beneficial ownership of and control or direction over, voting securities that will constitute more than % of the issued share capital of the Issuer prior to and after the listing other than as follows: Name and Municipality of Residence of Shareholder Richmond Capital LLP Type of Ownership Number of Shares Percentage Owned Percentage Owned Fully Diluted 2 Direct 2,26, 29.38% 4.3% Note:. Excluding any common shares issuable upon the exercise of any of the stock options, warrants, and IPO agent s warrants. 2. Assuming that Agent s warrants (entitling various Agents to purchase up to 334,524 common shares), warrants (entitling the warrant holders to purchase up to a total of 2,532,4 common shares) and the stock options (entitling the option holders to purchase up to a total of,797,5common shares) have been fully exercised which would result in the issued and outstanding common shares of the Issuer being increased to 64,39,234 common shares. 3. Directors and Officers 3. The following table provides the names of the current and proposed directors and executive officers of the Issuer, their municipalities of residence, position, principal occupations and the number of voting securities of the Issuer that each of the individuals beneficially owns, controls or directs, directly or indirectly, as of the date hereof. Name, Jurisdiction of Residence and Position Quinton Hennigh, Ph.D Longmont, Colorado, USA President, CEO and Director Herrick Lau Vancouver, BC, Canada CFO and Director Principal Occupation or Employment (Past Five Years if Not Previously Elected by Shareholders) President and Chief Geologist of Evolving Gold Corp. from 28 to 2; Vice President and chief Geologist of Evolving Gold Corp. from 27 to 28; Senior Research Geologist of Newmont Mining Corp. from 24 to 27. Managing Director of Baron Global Financial Canada from August 27 to present; Vice President, Corporate Finance of Global Maxfin Capital Inc. from March 27 to August 27; Vice President, FORM 2A LISTING STATEMENT May 25, 22 Page 35 Date Appointed October 28, 29 October 28, 29 Holdings in Voting Securities of the Issuer 2,4, common shares 379, common shares
36 NOVO RESOURCES CORP. Leo Karabelas Woodbridge, ON, Canada Corporate Finance of Graydon Elliott Capital Corporation from December 23 to February 27. President of Frontline Communications Investor Relations Inc. April, 22 Nil common shares VP of Corporate Communications Akiko Levinson Vancouver, BC, Canada Director David Velisek Vancouver, British Columbia Director President and Chief Executive Officer of Gold Canyon Resources Inc. since 23. Manager, Corporate Development at Baron Group Financial Canada from 28 to present; Equities Trader and Investment Advisor at Bolder Investment Partners, Ltd. from 26 to 28; Proprietary Equities Trader at Bright Trading from 23 to 26. June 9, 2, common shares October 28, 29 25, common shares FORM 2A LISTING STATEMENT May 25, 22 Page 36
37 NOVO RESOURCES CORP. 3.2 The Issuer s directors are appointed for a one-year term to hold office until the next annual general meeting of our shareholders or until removed from office in accordance with our bylaws. The Issuer s officers are appointed by our board of directors and hold office until removed by the board. 3.3 As at the date herein, as a group, the directors and executive officers of the Issuer held an aggregate of 3,29, common shares, which is 7.5% common shares of the Issuer. 3.4 Members of the Issuer's audit committee include Herrick Lau, Akiko Levinson, and David Velisek. 3.5 The directors and officers of the Issuer have, within the past 5 years, held the following positions as directors and/or senior officers of reporting issuers: Name Issuer Market Position Held From To Quinton Hennigh NV Gold TSXV Director November Present Corporation 29 Evolving Gold Corp. Newmont Mining Corp. TSX, OTCBB, Frankfurt NYSE President and Director Senior Research Geologist May 27 November Gold Canyon TSXV Director March Present Resources 2 Interra Exploration TSXV Director July 2 Present Prosperity Goldfields Corp. TSXV Chief Geologist March 2 Present Herrick Lau Pan American Fertilizer Corp. (formerly Bastion Resources Ltd.) Kariana Resources Inc. CNSX Chief Financial Officer May 22 CNSX Director September 2 Present Present Cerro Mining Corp. Chief Executive Officer February 2 TSXV Director December 2 February 22 Present Gener8 Media Corp. (formerly Delon Resources Corp.) CNSX Director January 2 President and Chief Executive Officer Vida Ventures Ltd. TSXV Chief Financial Officer and Director Jayden Resources Inc. (formerly Pinnacle Mines TSX Chief Financial Officer September 2 January 2 December 28 Present April 23 Present Present FORM 2A LISTING STATEMENT May 25, 22 Page 37
38 NOVO RESOURCES CORP. Ltd.) Director December 28 July 22 Copper One Inc. TSXV Chief Financial Officer January 28 November 2 Director June 28 June 2 ERA Carbon Offsets Ltd. ICN Resources Ltd. TSXV Chief Financial Officer November 28 TSXV Director September 29 July 2 October 22 Lincoln Mining Corp. Mindoro Resources Ltd. Sunshine Agri- Tech Corp. United Silver Corp. TSXV TSXV TSXV TSX Chief Financial Officer Chief Financial Officer Chief Financial Officer and Director Chief Financial August 29 August 29 October 29 November 27 August 29 September 2 July 2 May 2 Officer Director May 2 February 2 Leo Karabelas Titan Goldworx Resources Inc. Everfront Ventures Corp. CNSX Chief Executive Officer and Director February 2 TSXV Director September 2 November 22 Present David Velisek Canada Coal Inc. (formerly Mercury Capital Limited) Kariana Resources Inc. TSXV Director May 2 February 22 CNSX Director September 2 Present Akiko Levinson Gener8 Media Corp. (formerly Delon Resources Corp.) Gold Canyon Resources Inc. CNSX Director January 2 TSXV President and Director June 99 October 22 Present Jipangu Holdings Inc. JASDAQ Director June 2 Present 3.6 Corporate Cease Trade Orders or Bankruptcies Other than as disclosed below, none of our directors or executive officers is or, within years before to the date of this Listing Statement has been, a director or chief executive officer or chief financial officer of any Issuer that while the director or officer was acting in that capacity, was the subject of: FORM 2A LISTING STATEMENT May 25, 22 Page 38
39 NOVO RESOURCES CORP. a) a cease trade or similar order ( a management cease trade order that applied to the directors or executive officers of the Issuer) for a period of more than 3 consecutive days; or an order that denied the Issuer access to any exemption under securities legislation for a period of more than 3 consecutive days; b) was subject to an order of the type referred to in subparagraphs (i) or (ii) above that was issued after the proposed director ceased to be a director, chief executive officer or chief financial officer of the company that resulted from an event that occurred while the proposed director was acting in the capacity as a director, chief executive officer or chief financial officer of that company. Other than as disclosed below, none of our directors or executive officers, nor any shareholder holding a sufficient number of securities of the Issuer to affect materially the control of the Issuer, nor in the case of (d) below any personal holding company of any of the foregoing: c) is or, within years before to the date of this Listing Statement has been, a director or executive officer of any company that, while the director, officer or shareholder was acting in that capacity or within a year of the director, officer or shareholder ceasing to act in that capacity, became bankrupt, made a proposal under any legislation relating to bankruptcy or insolvency or was subject to or instituted any proceedings, arrangement or compromise with creditors or had a receiver, receiver manager or trustee appointed to hold its assets; or d) has, within years before to the date of this Listing Statement, become bankrupt, made a proposal under any legislation relating to bankruptcy or insolvency or become subject to or instituted any proceedings, arrangement or compromise with creditors, or had a receiver, receiver manager or trustee appointed to hold the assets of the director, executive officer or shareholder. 3.7 Penalties or Sanctions None of our directors or executive officers, nor any shareholder holding a sufficient number of securities of the Issuer to affect materially the control of the Issuer, nor any personal holding company of any of the foregoing, has been subject to any penalties or sanctions imposed by a court relating to securities legislation or by a securities regulatory authority or has entered into a settlement agreement with a securities regulatory authority or has been subject to any other penalties or sanctions imposed by a court or regulatory body that would likely be considered important to a reasonable investor in making an investment decision. 3.8 N/A 3.9 Personal Bankruptcies None of our directors, officers or principal shareholders, or personal holding company of such persons, have, within the last years, become bankrupt or made a proposal under any legislation relating to bankruptcy or insolvency or been subject to or instituted any proceedings, arrangement or compromise with creditors or had a receiver, receive manager or trustee appointed to hold its assets. FORM 2A LISTING STATEMENT May 25, 22 Page 39
40 NOVO RESOURCES CORP. 3. Conflicts of Interest The Issuer s directors and officers serve as directors or officers of other companies or have significant shareholdings in other companies and, to the extent that such other companies may participate in ventures in which the Issuer may participate, the directors of the Issuer may have a conflict of interest in negotiating and concluding terms respecting the extent of such participation. In the event that such a conflict of interest arises at a meeting of the Issuer s directors, a director who has such a conflict will disclose his interest in the matter and abstain from voting for or against the approval of such participation or such terms. The directors of the Issuer are required to act honestly, in good faith and in the best interests of the Issuer. The directors and officers of the Issuer are aware of the existence of laws governing the accountability of directors and officers for corporate opportunity and requiring disclosures by the directors of conflicts of interest and the Issuer will rely upon such laws in respect of any directors and officers conflicts of interest or in respect of any breaches of duty by any of its directors and officers. All such conflicts will be disclosed by such directors or officers in accordance with applicable laws and shall govern themselves in respect thereof to the best of their ability in accordance with the obligations imposed upon them by law. The directors and officers of the Issuer are not aware of any such conflicts of interests. 3. Positions with Reporting Issuers: Business Experience The following is a brief account of the education and business experience of each director and executive officer during at least the past five years, indicating each person s principal occupation during the period, and the name and principal business of the organization by which he was employed. Quinton Hennigh, President, CEO and Director Quinton Hennigh, age 47, has been a director of the Issuer since its incorporation on October 28, 29. He currently serves as a director of NV Gold Corporation (TSXV: NVX). Dr. Hennigh has served as the President and a director of Evolving Gold Corp. (TSXV: EVG), Senior Research Geologist with Newmont Mining Corp. and has worked throughout North America, in Europe, Australia, Asia and South America with Newmont Mining Corp. (NYSE: NEM), Newcrest Resources Inc. and Homestake Mining. He has spent years developing regional concepts for the exploration for buried gold deposits, particularly in Nevada. Dr. Hennigh obtained a Ph.D. in Geology/Geochemistry from the Colorado School of Mines. Dr. Hennigh is not a party to any employment, non-competition or confidentiality agreement with the Issuer. It is expected that he will devote approximately 3% of his time to the business of the Issuer to effectively fulfill his duties as a director. FORM 2A LISTING STATEMENT May 25, 22 Page 4
41 NOVO RESOURCES CORP. Herrick Lau, Chief Financial Officer and Director Herrick Lau, age 47, has been an officer and a director of the Issuer since its incorporation on October 28, 29. He is currently Managing Director of Baron Global Financial Canada Ltd. Mr. Lau previously held similar positions in Global Maxfin Capital Inc. and Graydon Elliott Capital Corp. He is currently the CFO of Pan American Fertilizer Corp. (formerly Bastion Resources Ltd.) (CNSX: PAF), a director of Kariana Resources Inc. (CNSX: KAA); the CFO and director of Vida Ventures Ltd. (TSXV: VDA.P), the CFO of Jayden Resources Ltd. (formerly Pinnacle Mines Ltd.) (TSX: JDN), a director of Gener8 Media Corp. (formerly Delon Resources Corp.) (CNSX: GNR), and a director of Cerro Mining Corp. (TSXV: CRX). Mr. Lau was also formerly the CFO of Panoramix Mirrors Inc. (TSXV: MSP), the CFO and a director Copper One Inc. (TSXV:CUO), the CFO of ERA Carbon Offsets Ltd. (TSXV: ESR), the CFO of Evolving Gold Corp. (TSX: EVG), a director of ICN Resources Ltd. (TSXV: ICN), the CFO of Lincoln Mining Corp. (TSXV: LMG), the CFO of Mindoro Resources Ltd. (TSXV: MIO), the CFO and Director of United Silver Corp. (TSX: USC), and the CEO and director of Titan Goldworx Resources Inc. (CNSX: TTN). Mr. Lau obtained his masters degree in Economics from Simon Fraser University and has over years of experience in investment research and corporate finance. Mr. Lau is also a charter holder of the Chartered Financial Analyst designation. Mr. Lau is not a party to any employment, non-competition or confidentiality agreement with the Issuer. It is expected that Mr. Lau will devote approximately 2% of his time to the business of the Issuer to effectively fulfill his duties as an officer and director. Leo Karabelas, VP of Corporate Communications Leo Karabelas, age 35, has been the Vice President of Corporate Communications of the Issuer since April, 22. Mr. Karabelas brings over years of experience in the capital markets and investor relations industry. Mr. Karabelas is currently President of Frontline Communications Investor Relations Inc. ( Frontline ) Headquartered in Toronto, the firm specializes in investor relations and corporate communication strategies to clients in the resources sector. In addition to his role at Frontline, Mr. Karabelas is a director of Everfront Ventures Corp. (TSXV: EVC.P), and a former director of Mercury Capital Corp. which was ultimately taken over by Canada Coal Corp. (TSXV: CCK). Mr. Karabelas is also the president of Africa AU, a private company with a focus on mineral properties in Africa. Mr. Karabelas received his Bachelor of Commerce and Enterprise Development from Ryerson University. Mr. Karabelas is not a party to any employment, non-competition or confidentiality agreement with the Issuer. It is expected that Mr. Karabelas will devote approximately 2% of his time to the business of the Issuer to effectively fulfill his duties as a director. David Velisek, Director David Velisek, age 42, has been a director of the Issuer since October 28, 29. He has been involved in the capital markets for years in investor relations, as a trader of equities, options and futures as well as an Investment Advisor. He is currently employed FORM 2A LISTING STATEMENT May 25, 22 Page 4
42 NOVO RESOURCES CORP. with Baron Global Financial Canada Ltd. as Manager, Corporate Development. Mr. Velisek has currently serves as a director of Kariana Resources Inc. (CNSX: KAA), and he was a former director of Gener8 Media Corp. (formerly Delon Resources Corp.) (CNSX: GNR). Mr. Velisek is not a party to any employment, non-competition or confidentiality agreement with the Issuer. It is expected that he will devote 6% of his time to the business of the Issuer to effectively fulfill his duties as a director. Akiko Levinson, Director Akiko Levinson, age 59, who brings over 2 years of experience to the market, has extensive experience in mining finance and end-to-end rare earth mineral investment. Mrs. Levinson is currently the President and Director of Gold Canyon Resources Inc. (TSXV: GCU), a director of Jipangu Holdings Inc., a Japanese mining company listed on the JASDAQ. Ms. Levinson is not a party to any employment, non-competition or confidentiality agreement with the Issuer. It is expected that he will devote 2% of his time to the business of the Issuer to effectively fulfill his duties as a director. FORM 2A LISTING STATEMENT May 25, 22 Page 42
43 NOVO RESOURCES CORP. 4. Capitalization 4. The following chart is for each class of securities to be listed: Issued Capital Number of Securities (non-diluted) Number of Securities (fullydiluted) % of Issued (nondiluted) % of Issued (fully diluted) Public Float Total outstanding (A) 4,725,8 64,39,234 % % Held by Related Persons or employees of the Issuer or Related Person of the Issuer, or by persons or companies who beneficially own or control, directly or indirectly, more than a 5% voting position in the Issuer (or who would beneficially own or control, directly or indirectly, more than a 5% voting position in the Issuer upon exercise or conversion of other securities held) (B) 5,389, 5,28, 36.88% 23.73% Total Public Float (A-B) 26,336,8 49,, % 76.27% Freely-Tradeable Float Number of outstanding securities subject to resale restrictions, restrictions imposed by pooling or other arrangements or in a shareholder agreement and securities held by control block holders (C) Nil Nil Nil Nil Total Tradable Float (A-C) 4,725,8 64,39,234 % % FORM 2A LISTING STATEMENT May 25, 22 Page 43
44 NOVO RESOURCES CORP. Public Securityholders (Registered) Instruction: For the purposes of this report, "public securityholders" are persons other than persons enumerated in section (B) of the previous chart. List registered holders only. Class of Security Common Shares Size of Holding Number of holders Total number of securities - 99 securities Nil securities Nil securities Nil -, -,999 securities Nil - 2, - 2,999 securities Nil - 3, - 3,999 securities Nil - 4, - 4,999 securities Nil - 5, or more securities 7 26,336,8 Total 7 26,336,8 FORM 2A LISTING STATEMENT May 25, 22 Page 44
45 NOVO RESOURCES CORP. Public Securityholders (Beneficial) Instruction: Include (i) beneficial holders holding securities in their own name as registered shareholders; and (ii) beneficial holders holding securities through an intermediary where the Issuer has been given written confirmation of shareholdings. For the purposes of this section, it is sufficient if the intermediary provides a breakdown by number of beneficial holders for each line item below; names and holdings of specific beneficial holders do not have to be disclosed. If an intermediary or intermediaries will not provide details of beneficial holders, give the aggregate position of all such intermediaries in the last line. Class of Security Common Shares Size of Holding Number of holders Total number of securities - 99 securities Nil securities Nil securities Nil -, -,999 securities Nil - 2, - 2,999 securities Nil - 3, - 3,999 securities Nil - 4, - 4,999 securities Nil - 5, or more securities 3,32,5 Unable to confirm N/A 23,6,3 Total N/A 26,336,8 FORM 2A LISTING STATEMENT May 25, 22 Page 45
46 NOVO RESOURCES CORP. Non-Public Securityholders (Registered) Instruction: For the purposes of this report, "non-public securityholders" are persons enumerated in section (B) of the issued capital chart. Class of Security Common Shares Size of Holding Number of holders Total number of securities - 99 securities Nil securities Nil securities Nil -, -,999 securities Nil - 2, - 2,999 securities Nil - 3, - 3,999 securities Nil - 4, - 4,999 securities Nil - 5, or more securities 5 5,389, Total 5 5,389, FORM 2A LISTING STATEMENT May 25, 22 Page 46
47 NOVO RESOURCES CORP. 4.2 The following are details for any securities convertible or exchangeable into common shares of the Issuer: Description of Security (include conversion / exercise terms, conversion / exercise price) Exercise Price Expiry Date Type of Security Number of convertible / exchangeable securities outstanding FORM 2A LISTING STATEMENT May 25, 22 Page 47 Number of listed securities issuable upon conversion / exercise $.2 June, 22 Option 25, 25, $.2 August 2, 22 Option 275, 275, $.45 February 2, 27 Option,272,5,272,5 $.6 November 3, 22 Warrant 4,737, 4,737, $.9 December 2, 24 Warrant 5,795,4 5,795,4 $.65 December 2, 24 Warrant 334, , N/A 5. Executive Compensation Please refer to Appendix B Executive Compensation. 6. Indebtedness of Directors and Executive Officers No individual who is, or at any time since the beginning of the most recently completed financial year of the Issuer was, a director or executive officer of the Issuer or any of its subsidiaries and no associate of any such director, executive officer or proposed nominee, is indebted to the Issuer or any of its subsidiaries (other than for "routine indebtedness" as defined by applicable securities legislation) or has any indebtedness that is the subject of a guarantee, support agreement, letter of credit or other similar arrangement or understanding provided by the Issuer or any of its subsidiaries. 7. Risk Factors 7. The Issuer has a very limited history of operations, is in the early stage of development and must be considered a start-up. As such, the Issuer is subject to many risks common to such enterprises, under-capitalization, cash shortages, limitations with respect to personnel, financial and other resources and the lack of revenues. There is no assurance that the Issuer will be successful in achieving a return on shareholders' investment and the likelihood of success must be considered in light of its early stage of operations. The Issuer has no intention of paying any dividends in the near future. The Issuer has limited financial resources, has not earned any revenue since commencing operations, has no source of operating cash flow and there is no assurance that additional funding will be available to it for further exploration and development of the Issuer's properties or to fulfill its obligations under any applicable agreements. There can be no assurance that the Issuer will be able to obtain adequate financing in the future or that the terms of such financing will be favourable. Failure to obtain such
48 NOVO RESOURCES CORP. additional financing could result in delay or indefinite postponement of further exploration and development of the Issuer's properties with the possible loss of such properties. The Mining Industry The Issuer is a junior mining Issuer engaged in exploration and development of mineral properties. The mineral exploration and development industry involves a high degree of risk which even with a combination of experience, knowledge and careful evaluation, the Issuer may not be able to overcome. No assurance can be given that commercial quantities of minerals will be successfully found or produced. The Issuer's operations are subject to the risks normally incident to the operation and development of mineral properties, groundfall, explosions and other accidents, fires, flooding, discharge of toxic chemicals and other hazards, all of which could result in personal injuries, loss of life, damage to the property of the Issuer and others, environmental damage, delayed production, increased production costs and possible legal liability for any and all damages. Such liabilities may have a material adverse effect on the Issuer's financial position and prospects. The properties, in which the Issuer has an interest, or the right to acquire an interest, are in the early exploration stage and are without either resources or reserves. Development of the Issuer's mineral properties will only follow upon obtaining satisfactory results. Exploration for and the development of minerals involve a high degree of risk and few properties, which are explored, are ultimately developed into producing properties. There is no assurance that the Issuer's exploration and development activities will result in any discoveries of commercial bodies of ore. The long-term profitability of the Issuer's operations will be in large part directly related to the cost and success of its exploration programs, which may be affected by a number of factors. Substantial expenditures are required to establish either resources or reserves in the mining industry, to develop processes to extract the minerals and, in the case of new properties, to develop the extraction and processing facilities and infrastructure at any site chosen for extraction. Although substantial benefits may be derived from the discovery of a major deposit, no assurance can be given that minerals will be discovered in sufficient quantities to justify commercial operations or that the funds required for development can be obtained on a timely basis. The Issuer has relied and may continue to rely upon consultants and others for construction and operating expertise. The economics of developing mineral properties is affected by many factors the cost of operations, grade of ore, fluctuating mineral markets, costs of processing equipment, competition and such other factors as government regulations, regulations relating to title to mineral concessions, royalties, allowable production, importing and exporting of minerals and environmental protection. Many of the above factors are beyond the control of the Issuer. Depending on the price of minerals produced, the Issuer may determine that it is impractical to either commence or continue commercial production. The Issuer's revenues, if any, are expected to be wholly derived from the extraction and sale of base and precious metals. The price of those commodities has fluctuated widely, particularly in recent years, and is affected by numerous factors beyond the Issuer's control international, economic and political trends, expectations of inflation, FORM 2A LISTING STATEMENT May 25, 22 Page 48
49 NOVO RESOURCES CORP. currency exchange fluctuations, interest rates, global or regional consumptive patterns, speculative activities and increased production due to new extraction developments and improved extraction and production methods. The effect of these factors on the price of base and precious metals, and therefore the economic viability of any of the Issuer's exploration projects, cannot accurately be predicted. The mining industry is intensely competitive in all of its phases, and the Issuer competes with many companies possessing greater financial resources and technical facilities than itself. Competition could adversely affect the Issuer's ability to acquire suitable properties for exploration in the future. The operations of the Issuer may require licenses and permits from various governmental authorities. There can be no assurance that the Issuer will be able to obtain all necessary licenses and permits that may be required to carry out exploration, development and mining operations at its projects. Uncertainty in the Estimation of Mineral Resources There is a degree of uncertainty to the calculation of mineral resources. Until mineral resources are actually mined and processed, the quantity and grade of mineral resources must be considered as estimates only. In addition the quantity and grade of mineral resources may vary depending on, among other things, metal prices. Any material changes in quantity or grade of mineral resources may affect the economic viability of the deposit. In addition, there can be no assurance that mineral recoveries in small laboratory tests will be duplicated in larger scale tests under on-site conditions or during production. Uncertainty Relating to Inferred Mineral Resources There is a risk that inferred mineral resources cannot be converted into mineral reserves if the ability to assess geological continuity is not sufficient to demonstrate economic viability. Due to the uncertainty that may attach to inferred mineral resources, there is no assurance that inferred mineral resources will be upgraded to resources with sufficient geological constitute to constitute proven and probable mineral reserves as a result of continued exploration. Key-Man and Liability Insurance, Uninsurable Risks The success of the Issuer will be largely dependent upon the performance of its key officers. The Issuer has not purchased any "key-man" insurance with respect to any of its directors, officers, key employees or proposed directors or officers, and has no current plans to do so. Although the Issuer may obtain liability insurance in an amount which management considers adequate, the nature of the risks for mining companies is such that liabilities might exceed policy limits, the liabilities and hazards might not be insurable, or the Issuer might not elect to insure itself against such liabilities due to high premium costs or other reasons. Should such liabilities occur, the Issuer could incur significant costs that could have a material adverse effect upon its financial condition. Future Financing Requirements FORM 2A LISTING STATEMENT May 25, 22 Page 49
50 NOVO RESOURCES CORP. The Issuer may need additional financing to continue in business and there can be no assurance that such financing will be available or, if available, will be on reasonable terms. If financing is obtained by issuing common shares from treasury, control of the Issuer may change and investors may suffer additional dilution. To the extent financing is not available, lease expiry dates, work commitments, rental payments and option payments, if any, may not be satisfied and could result in a loss of property ownership or earning opportunities by the Issuer. Environmental Regulations All phases of the Issuer's operations are subject to environmental regulation. Environmental legislation is becoming more strict, with increased fines and penalties for non-compliance, more stringent environmental assessments of proposed projects and a heightened degree of responsibility for companies and their officers, directors and employees. There can be no assurance that environmental regulation will not adversely affect the Issuer's operations. Environmental hazards may exist on a property in which the Issuer holds an interest which are unknown to the Issuer at present which have been caused by previous or existing owners or operators of the property. Environmental legislation provides for restrictions and prohibitions on spills, releases or emissions of various substances produced in association with certain mining industry operations, such as seepage from tailings disposal areas, which would result in environmental pollution. A breach of such legislation may result in the imposition of fines and penalties. In addition, certain types of operations require the submission and approval of environmental impact assessments. Environmental legislation is evolving in a manner which means stricter standards, and enforcement, fines and penalties for noncompliance are more stringent. Environmental assessments of proposed projects carry a heightened degree of responsibility for companies and directors, officers and employees. The cost of compliance with changes in governmental regulations has a potential to reduce the profitability of operations. There is no assurance that future changes in environmental regulation, if any, will not adversely affect the Issuer's operations. The Issuer intends to fully comply with all environmental regulations in all of the countries in which it is active. Governmental and Regulatory Requirements Government approvals and permits are currently, and may in the future be, required in connection with the Issuer's operations. To the extent such approvals are required and not obtained, the Issuer may be restricted or prohibited from proceeding with planned exploration or development activities. Failure to comply with applicable laws, regulations and permitting requirements may result in enforcement actions thereunder, orders issued by regulatory or judicial authorities causing operations to cease or be curtailed, and may include corrective measures requiring capital expenditures, installation of additional equipment, or remedial actions. Parties engaged in mining operations may be required to compensate those suffering loss or damage by reason of the mining activities and may be liable for civil or criminal fines or penalties imposed for violations of applicable laws or regulations. Amendments to current laws, regulations and permitting requirements, or more stringent application of existing laws, could have a material adverse impact on the Issuer and cause increases in capital expenditures or FORM 2A LISTING STATEMENT May 25, 22 Page 5
51 NOVO RESOURCES CORP. production costs or reductions in levels of production at producing properties or require abandonment or delays in development of properties. Currency Exposure The Issuer does not currently engage in hedging and its operations are not subject to foreign currency fluctuations. Such fluctuations may materially affect the Issuer's financial position and results of operations. Dividends The Issuer does not anticipate paying any dividends on its common shares in the foreseeable future. See Dividend Record and Policy". Dependence on Economic Conditions The Issuer's success in its marketing efforts of its products will be dependent to some extent upon the economic conditions affecting the marketplace. The Issuer has no control over these economic conditions. 7.2 N/A 7.3 N/A 8. Promoters None. 9. Legal Proceedings There are no legal proceedings outstanding, threatened or pending, as of the date hereof, by or against the Issuer or which the Issuer is a party or to which the Millennium Property is subject, nor to the Issuer's knowledge are any such legal proceedings contemplated which could become material to a purchaser of securities of the Issuer. 2. Interest of Management and Others in Material Transactions 2. For the purposes of this Listing Statement, informed person means: (a) any director or executive officer of the Issuer; (b) a person or company that beneficially owns, or controls or directs, directly or indirectly, more than percent of the common shares; and (c) any associate or affiliate of any of the foregoing persons. No informed person has any material interest, direct or indirect, in any material transaction since within the three years prior to the date hereof. FORM 2A LISTING STATEMENT May 25, 22 Page 5
52 NOVO RESOURCES CORP. 2. Auditors, Transfer Agents and Registrars 2. The auditors of the Issuer are BDO Canada LLP, Chartered Accountants of West Georgia Street, Vancouver, BC, V6C 3L The registrar and transfer agent for the Issuer is Olympia Trust Company of 9 Cathedral Place, 925 West Georgia Street, Vancouver, BC, V6C 3L Material Contracts 22. All contracts are made in the ordinary course of the Issuer's business. 2. Option Agreement. See Narrative Description of the Business Disclosure of Mineral Projects Copies of the foregoing contracts may be inspected at 75 West Georgia Street, Suite 98, Vancouver, British Columbia, during normal business hours. 23. Interest of Experts N/A 24. Other Material Facts 24. There are no further facts or particulars that are not already disclosed herein that are necessary to be disclosed for this Listing Statement to contain full, true and plain disclosure of all material facts relating to such securities. 25. Financial Statements 25. The audited consolidated financial statements of the Issuer as at January 3, 23 and the unaudited condensed consolidated interim financial statements of the Issuer for the quarters ended April 3, 22, July 3, 22, and October 3, 22, are available for viewing on SEDAR at FORM 2A LISTING STATEMENT May 25, 22 Page 52
53 NOVO RESOURCES CORP. CERTIFICATE OF THE ISSUER Pursuant to a resolution duly passed by its Board of Directors, (the Issuer ), hereby applies for the listing of the above mentioned securities on CNSX. The foregoing contains full, true and plain disclosure of all material information relating to It contains no untrue statement of a material fact and does not omit to state a material fact that is required to be stated or that is necessary to prevent a statement that is made from being false or misleading in light of the circumstances in which it was made. Dated this 3 st day of May, 23. Quinton Hennigh Quinton Hennigh Chief Executive Officer Herrick Lau Herrick Lau Chief Financial Officer Akiko Levinson Akiko Levinson Director David Velisek David Velisek Director FORM 2A LISTING STATEMENT May 25, 22 Page 53
54 Report to: TECHNICAL REPORT AND RESOURCE ESTIMATE, BEATONS CREEK PROJECT, PILBARA REGION, AUSTRALIA EFFECTIVE DATE: MAY, 23 Prepared by Patrick C Huxtable, RPGeo MAIG Tetra Tech Address Level 5, 22 St Georges Terrace, Perth, WA, 6 Phone Fax
55 T A B L E O F C O N T E N T S. SUMMARY.... GEOLOGY CONCLUSIONS NULLAGINE (BEATONS CREEK) PROPERTY RECOMMENDATIONS PHASE BEATONS CREEK RESOURCE EXPANSION PHASE 2 BEATONS CREEK RESOURCE DELINEATION INTRODUCTION INTRODUCTION RELIANCE ON OTHER EXPERTS PROPERTY DESCRIPTION AND LOCATION LOCATION STATUS OF THE MINING TITLES ACCESSIBILITY, CLIMATE, LOCAL RESOURCES, INFRASTRUCTURE AND PHYSIOGRAPHY ACCESSIBILITY SITE TOPOGRAPHY, ELEVATION AND VEGETATION CLIMATE INFRASTRUCTURE HISTORY PREVIOUS EXPLORATION GALLIARD IN-LOOP EM SURVEYS PREVIOUS METALLURGICAL TEST WORK PREVIOUS PRODUCTION FOR BEATONS CREEK AREA GEOLOGICAL SETTING AND MINERALISATION REGIONAL GEOLOGICAL SETTING STRUCTURE AND METAMORPHISM REGIONAL EXPLORATION LOCAL GEOLOGICAL SETTING NULLAGINE SUB-BASIN POST-ARCHAEAN COVER SEQUENCES MINERALISATION DOMAIN (GRANTS HILL NE OF THE GRANTS HILL FAULT) DOMAIN 2 (GRANTS HILL SW OF THE GRANTS HILL FAULT) DOMAIN 3 (GOLDEN CROWN)...5 Technical Report and Resource Estimate on the Beatons Creek Project, i 39RZ4A
56 8. DEPOSIT TYPES GOLD DEPOSITS OF THE WITWATERSRAND BASIN PALAEOPLACER MODEL FOR THE WITWATERSRAND BASIN GOLD DEPOSITS OTHER MODELS FOR THE WITWATERSRAND DEPOSITS COMPARISONS WITH HAMERSLEY BASIN EXPLORATION DRILLING NULLAGINE TYPE AND EXTENT DRILL COLLARS DOWNHOLE SURVEYS GEOLOGICAL LOGGING DRILLHOLE CASING /2 RC DRILLING RESULTS SAMPLING METHOD DRILL PLAN - NULLAGINE SAMPLE PREPARATION, ANALYSES, AND SECURITY SAMPLE PREPARATION SAMPLE ANALYSES NULLAGINE PROPERTY NOVO QA/QC PROGRAM (NULLAGINE PROPERTY) LABORATORY STANDARD LW LABORATORY STANDARD LW LABORATORY STANDARD LW LOW-GRADE FIRE ASSAY STANDARD OREAS5F LOW GRADE FIRE ASSAY STANDARD OREAS5A LOW GRADE FIRE ASSAY STANDARD OREAS52A LOW GRADE (SCREEN) FIRE ASSAY STANDARD OXC MODERATE GRADE (SCREEN) FIRE ASSAY STANDARD OXG MODERATE GRADE (SCREEN) FIRE ASSAY STANDARD OXI HIGH GRADE (SCREEN) FIRE ASSAY STANDARD OXP NOVO LEACHWELL FIELD DUPLICATES GENALYSIS INTERNAL CHECK SAMPLES FOR LEACHWELL DATA GENALYSIS INTERNAL CHECK SAMPLES FOR FIRE ASSAY DATA QUALIFIED PERSON S OPINION DATA VERIFICATION LEACHWELL ASSAY METHODS VALIDATION QUALIFIED PERSON S OPINION MINERAL PROCESSING AND METALLURGICAL TESTING MINERAL RESOURCE ESTIMATES TETRA TECH 23 RESOURCE ESTIMATE DATABASE SPECIFIC GRAVITY...4 Technical Report and Resource Estimate on the Beatons Creek Project, ii 39RZ4A
57 4..3 EXPLORATORY DATA ANALYSIS GEOLOGICAL INTERPRETATION SPATIAL ANALYSIS RESOURCE BLOCK MODEL RESOURCE CLASSIFICATION MINERAL RESOURCE TABULATION VALIDATION COMPARISONS WITH PREVIOUS MODELS ADJACENT PROPERTIES NULLAGINE AREA OTHER RELEVANT DATA AND INFORMATION INTERPRETATION AND CONCLUSIONS RECOMMENDATIONS PHASE BEATONS CREEK RESOURCE EXPANSION PHASE 2 BEATONS CREEK RESOURCE DELINEATION OTHER RECOMMENDATIONS REFERENCES CERTIFICATE OF QUALIFIED PERSON... 3 L I S T O F F I G U R E S Figure 4-: Nullagine and Marble bar Properties location map... 8 Figure 4-2: Extent of outcropping Fortescue Group... 9 Figure 4-3: Nullagine Tenements Map... 5 Figure 6-: Map of the northern Pilbara... 9 Figure 6-2: Tenement outline for Nullagine Sub-basin project area Figure 6-3: Location of In-loop EM survey lines for Nullagine sub-basin project area Figure 6-4: Photo provided by Novo depicting some of the historical workings at Beatons Creek Figure 6-5: Historical map depicting historical workings at Beatons Creek Figure 7-: Geological map of the Hamersley Basin Figure 7-2: Comparison between Hamersley Basin and Witwatersrand Basin tectonostratigraphy... 3 Figure 7-3: Summary map showing the age and distribution of the granites Figure 7-4: Litho-stratigraphy, package boundaries and geochronology of the Fortescue Group in the Nullagine sub-basin Figure 7-5: Simplified geological map of the Nullagine sub-basin Figure 7-6: Simplified geological map of the Nullagine sub-basin showing distribution of Figure 7-7: major litho-stratigraphic packages Simplified geological map of the Nullagine sub-basin showing dominant lithologies and package boundaries Figure 7-8: Geological map of the Beatons Creek area, Nullagine Figure 7-9: Geological Map of Beatons Creek area from Scott (2) Technical Report and Resource Estimate on the Beatons Creek Project, iii 39RZ4A
58 Figure 7-: Map of the central part of the Nullagine sub-basin project area showing main... basin-architectural features, Figure 7-: Interpretive cross-sections Figure 7-2: Oblique plan view of the Beatons Creek reefs Figure 7-3: Section view of Domain looking NE Figure 7-4: Section view of Domain 2 looking NE Figure 7-5: Section view of Domain 3 looking NE... 5 Figure 7-6: Outcrop of Hardey Formation immediately south of the area of historic gold mining at Beatons Creek... 5 Figure 7-7: Figures A to E Figure 8-: Distribution of goldfields around the margin of the Witwatersrand Basin Figure 8-2: Sections through (fan head) stacked reef complexes of Eldorado Fan Delta Figure -: Collar Point at Beatons Creek Figure -2: Collar Plan for Beatons Creek Area... 8 Figure -3: Collar Plan for the Golden Crown holes Area... 8 Figure -: LW Performance Chart Figure -2: LW3 Performance Chart Figure -3: LW5 Performance Chart Figure -4: OREAS5f Performance Chart Figure -5: OREAS5a Performance Chart Figure -6: OxC88 Performance Chart Figure -7: OxG84 Performance Chart... 9 Figure -8: Oxi96 Performance Chart... 9 Figure -9: OxP9 Performance Chart Figure -: LeachWELL Analyses of Field Duplicates Figure -: LeachWELL Laboratory Repeats Plot Figure -2: Fire Assay Laboratory Repeats Plot Figure 2-: Historical Adit in the Beatons Creek Formation Figure 2-2: Unconformity mineralised horizon with nearby Adit, with Notebook for scale Figure 2-3: Remnant buckshot pyrite voids in mineralised specimen Figure 2-4: QQ plot for LeachWELL vs. Screen Fire Assay data (n=565)... Figure 2-5: QQ plot for LeachWELL vs. Fire Assay data (n=276)... Figure 3-: Collar Plan Showing Locations of Test Work Diamond Holes...3 Figure 4-: Grade-Tonnage Curve for Beatons Creek Deposit...4 Figure 4-2: Cross Section...6 Figure 4-3: Swath plots for eastings for Beatons Creek model...7 Figure 4-4: Swath plots for northings for Beatons Creek model...7 Figure 4-5: Swath plots for elevations for Beatons Creek model...8 L I S T O F T A B L E S Table -: Beatons Creek Resource as of May Table 4-: Tenements comprising the Nullagine Project area... Table 6-: Chronological summary of past exploration... 2 Table -: 2/2 RC Drilling Collars... 6 Table -2: 2/2 RC Drilling Results as at 4 February Technical Report and Resource Estimate on the Beatons Creek Project, iv 39RZ4A
59 Table -: Analysis of Novo 2/2 Field Duplicates Table -2: Analysis of Genalysis 2/2 LeachWELL Repeats Table -3: Analysis of Genalysis 2/2 Fire Assay Repeats Table 2-: Drill Collar Checks Table 4-: Drill Data Set...4 Table 4-2: Specific Gravity Data Set Summary...5 Table 4-3: DDH Assay Statistics...5 Table 4-4: Grade Capping by Threshold Summary...5 Table 4-5: DDH Composite Statistics...6 Table 4-6: Declustered DDH Composite Statistics...6 Table 4-7: Wireframe Statistics...7 Table 4-8: Variography Results...8 Table 4-9: Parent Block Model...8 Table 4-: Estimation Criteria... Table 4-: Search Criteria... Table 4-2: Search Criteria for Thresholds... Table 4-3: Beatons Creek Domain (Grants Hill) Tonnes & Grade...2 Table 4-4: Beatons Creek Domain 2 (Grants Hill) Tonnes & Grade...3 Table 4-5: Beatons Creek Domain 3 (Golden Crown) Tonnes & Grade...3 Table 4-6: Beatons Creek Deposit Tonnes & Grade...4 Table 4-7: Beatons Creek Resources as of May Table 4-8: Overall Mean Statistics...6 Table 8-: Phase...23 Table 8-2: Phase Technical Report and Resource Estimate on the Beatons Creek Project, v 39RZ4A
60 G L O S S A R Y UN ITS OF MEAS U RE Above mean sea level... Acre... Ampere... Annum (year)... Billion... Billion tonnes... Billion years ago... British thermal unit... Centimetre... Creek... Crk Cubic centimetre... cm 3 Cubic feet per minute... Cubic feet per second... ft 3 /s Cubic foot... ft 3 Cubic inch... in 3 Cubic metre... m 3 Cubic yard... yd 3 Coefficients of Variation... Day... Days per week... Days per year (annum)... Dead weight tonnes... Decibel adjusted... Decibel... Degree... Degrees Celsius... C Detection Limit... d.l. Diameter... Dollar (American)... Dollar (Canadian)... Dry metric ton... Foot... Formation... Gallon... Gallons per minute (US)... Gigajoule... Gigapascal... Gigawatt... Gram... Grams per litre... Grams per tonne... amsl ac A a B Bt Ga BTU cm cfm CVs d d/wk d/a DWT dba db ø US$ Cdn$ dmt ft Fmn gal gpm GJ GPa GW g g/l g/t Technical Report and Resource Estimate on the Beatons Creek Project, vi 39RZ4A
61 Gram metres (for grade)... m.g/t Greater than... > Hectare (, m 2 )... ha Hertz... Hz Horsepower... hp Hour... h Hours per day... h/d Hours per week... h/wk Hours per year... h/a Inch... " Kilo (thousand)... k Kilogram... kg Kilograms per cubic metre... kg/m 3 Kilograms per hour... kg/h Kilograms per square metre... kg/m 2 Kilometre... km Kilometres per hour... km/h Kilopascal... kpa Kilotonne... kt Kilovolt... kv Kilovolt-ampere... kva Kilovolts... kv Kilowatt... kw Kilowatt hour... kwh Kilowatt hours per tonne (metric ton)... kwh/t Kilowatt hours per year... kwh/a Less than... < Litre... L Litres per minute... L/m Megabytes per second... Mb/s Megapascal... MPa Megavolt-ampere... MVA Megawatt... MW Metre... m Metres above sea level... masl Metres Baltic sea level... mbsl Metres per minute... m/min Metres per second... m/s Metric ton (tonne)... t Microns... µm Milligram... mg Milligrams per litre... mg/l Millilitre... ml Millimetre... mm Million... M Million bank cubic metres... Mbm 3 Technical Report and Resource Estimate on the Beatons Creek Project, vii 39RZ4A
62 Million bank cubic metres per annum... Mbm 3 /a Million tonnes... Mt Minute (plane angle)... ' Minute (time)... min Month... mo Ounce... oz Pascal... Pa Centipoise... mpa s Parts per million... ppm Parts per billion... ppb Percent... % Pound(s)... lb Pounds per square inch... psi Revolutions per minute... rpm Second (plane angle)... " Second (time)... s Specific gravity... SG Square centimetre... cm 2 Square foot... ft 2 Square inch... in 2 Square kilometre... km 2 Square metre... m 2 Thousand tonnes... kt Three Dimensional... 3D Three Dimensional Model... 3DM Tonne (, kg)... t Tonnes per day... t/d Tonnes per hour... t/h Tonnes per year... t/a Tonnes seconds per hour metre cubed... ts/hm 3 Volt... V Week... wk Weight/weight... w/w Wet metric ton... wmt Year (annum)... a AB B REV I ATIO NS A N D A CR ONY MS Bankable Feasibility Study... Department of Indigenous Affairs... Differential GPS... Estimation... Western Australian Government Department of Minerals and Petroleum.. Memorandum of understanding Reverse circulation... BFS DIA DGPS Est DMP MOU Novo RC Technical Report and Resource Estimate on the Beatons Creek Project, viii 39RZ4A
63 Rotary air blast... Standard Deviation... RAB Std Dev. Technical Report and Resource Estimate on the Beatons Creek Project, ix 39RZ4A
64 . S U M M A R Y (Novo) co-owns in a joint venture agreement the Beatons Creek Project (also sometimes referred to as the Nullagine Project) in the Eastern Pilbara shire of Western Australia. The Beatons Creek Project mineralisation is considered to be of Palaeoplacer origins, similar to the Witwatersrand basin deposits of South Africa, which are late Archaean to early Proterozoic in age and are the subject of this report. Alluvial Gold was first discovered in Nullagine in 886 (Maitland, 95) and by 893 Nullagine had become the principal alluvial gold field in the region. A hard-rock source for alluvial deposits at Nullagine was identified in 895, in the same year that the township was formerly declared. The mineral potential of the Pilbara Craton has been generally downplayed by the minerals industry and as a result the region has been much less extensively explored than many other Archaean cratons throughout the world, the Yilgarn Craton to the south (Blewett et al., 2). The first exploration programs to target parts of the present Nullagine project area were conducted between 968 and 982. The basis for these programs was interpreted similarities between pyritic conglomerates in the Fortescue Group and auriferous and/or uraniferous Archaean conglomerates in South Africa and Canada. Exploration generally involved initial airborne radiometric surveys, followed by ground radiometrics and rock sampling. In some cases limited shallow drilling programs were also undertaken, the most significant of which were a 4 hole diamond (total 85m) and hole diamond and percussion (total 29m) drilling programs by Cominco and Esso, respectively, in the Nullagine sub-basin (Carter and Gee, 988). The deepest hole drilled in the project area was a,66m diamond hole drilled by Metana Minerals NL in 983. Galliard Resources acquired an interest in the Pilbara Palaeoplacer Project in early 2, and by mid-2 had changed its name to Novo Resources. Since then Novo has drilled some 78 reverse circulation (RC) holes for 6,663m in the Nullagine project area. The Nullagine leases are located only a few kilometers from the town of Nullagine, which consists of 2 tenements in two areas totalling approximately 56km². The central coordinates for the larger group of contiguous tenements comprising the Nullagine Project area are E, 22. S. 39RZ4A
65 . G E O L O G Y The Beatons Creek project area is located in the East Pilbara granite greenstone terrane of the Early to Late Archaean Pilbara Craton of northwestern Western Australia. The sub-basins formed on the older granite greenstone basement during the initial stages of Late Archaean continental rifting and formation of the Late Archaean Palaeoproterozoic Hamersley Basin. The exploration properties are centred on areas containing extensive and relatively complete lower Fortescue Group successions, in comparison to other parts of the north Pilbara Craton. Although up to 5Ma older, the ca Ga Fortescue Group is commonly compared to the Ventersdorp Supergroup of the Witwatersrand Basin, South Africa which is similar in both composition and tectono-stratigraphic setting (Nelson et al., 992, 999; Martin et al., 998; Thorne and Trendall, 2). Gold-bearing conglomerates have been identified at several stratigraphic levels in the Fortescue Group within the Nullagine sub-basin. In the Nullagine sub-basin, auriferous conglomerates at Beatons Creek occur in the (mid to) upper Hardey Formation. Mineralisation occurs at Beatons Creek in 23 individual reefs, as part of three domains; on the basis of structural orientation and separation by the Grants Hill Fault zone in the case of domains one and two. Domain 3 is the Golden Crown area. The largest reef, which occurs in domain, has lateral extents ranging up to about km.. 2 C O N C L U S I O N S.2. NULLAGINE (B EATONS CREEK) PR OPERTY As of April 23, the Nullagine Property has been tested by 78 RC holes for an aggregated length of 6,663m, all of which have been drilled by Novo Resources. A further 99 RC holes for 2,729m, 445 Rotary Air blast (RAB) holes for 9,9m and Diamond holes for,62m have been completed in the past by previous owners and are noted in Section 6 of this report. Documentation of data collection practices and data quality for the historical drilling by earlier operators is sparse, while the data collection practices employed by Novo is somewhat better understood. None of the pre-novo drilling was used in the compilation of this current resource estimate, as no verification of this data was deemed possible. Novo have also completed eight (8) diamond drill holes for an aggregated length of 475m, twinning some of the RC holes, for metallurgical, geotechnical and density test work respectively. Resources were estimated by Ordinary Kriging (OK), Inverse Distance Squared (ID 2 ) and Nearest Neighbour (NN) methods. The result obtained by OK is taken to be the most credible, as the best linear unbiased estimator. A threshold of.5g/t was applied to the resources assuming an open-pit mining methodology. 2 39RZ4A
66 The expected open-pit kriged resource at a.5g/t threshold for gold contains approximately 8.9Mt of Inferred Resources with an average grade of.47g/t gold. The estimate is summarised in Table -. Note that the numbers may differ from previous resource statements due to rounding. Table -: Beatons Creek Resource as of May 23 (Ordinary Kriging) Resource Category Domain Tonnes Au (g/t) Au (Oz) Inferred Note: troy ounce = 3.348g.. 3 R E C O M M E N D A T I O N S Beatons Creek D 4,886, ,23 Beatons Creek D2,65, ,4 Beatons Creek D3 2,396, ,58 Total 8,899, ,6 Exploration on the Project is proposed as two separate programs, which are independent of each other and can be run concurrently, as the result of one program does not affect the work proposed in the second program..3. PHASE BEAT ON S CR EEK RESOURC E E XPAN SION Phase is designed to investigate the north-to-northeast dip extension of the current resource for the Grants Hill reefs. This will entail a reverse circulation (RC) drilling program. The drilling campaigns should be designed to target the northwest-to-northeast dip extensions of the Grants Hill reefs to a depth of about 6m vertical. The proposed budget for Phase is AUD 6, PHASE 2 BEAT ON S CR EEK RESOURC E DELIN EATION Phase 2 is designed to investigate the known resource in order to improve the understanding of the geometry and potentially increase the resource category of the Grants Hill reefs. This will entail an RC drilling program. This Phase 2 program does not depend on the successful results from the Phase program. Drilling will target Grants Hill reefs on an approximately 7m grid to a depth of about 7m vertical. This will reduce the current average drill spacing from about xm to about 7x7m in most instances, which will be necessary for improving the resource categories for higher levels of studies within the agreed whittle pit shell (pit 46 revenue factor.2 pit). 3 39RZ4A
67 The proposed budget for Phase 2 is AUD 62, RZ4A
68 2. I N T R O D U C T I O N 2. I N T R O D U C T I O N Novo Resources is a Vancouver-based mineral exploration Company, listed on the Canadian National Stock Exchange (CSNX) in Canada. In January 23, Novo Resources retained Tetra Tech to provide a Technical Report and Resource estimate to accompany the results of the latest drilling campaigns completed on the Beatons Creek Project in 22. Data necessary for the execution of this work was obtained by Tetra Tech from Novo in a mostly digital format. This included all drilling data modern and historical, and previous technical reports from Novo and its predecessors. These and other sources of information are documented in references. The primary author of this report is Mr. Pat Huxtable, RPGeo MAIG who is a Professional Geologist with about 8 years of experience in exploration and operations, several years working in Archaean gold deposits. Mr. Huxtable visited the Nullagine property and examined exploration operations on the 22 January RZ4A
69 3. R E L I A N C E O N O T H E R E X P E R T S Tetra Tech has relied upon Novo and the Western Australian Government (DMP) Mineral Titles Online website for information pertaining to ownership of the Property, permitting requirements and status, and legal and financial liabilities pertaining to the Property. This information is contained in section 4. of this report. 6 39RZ4A
70 4. P R O P E R T Y D E S C R I P T I O N A N D L O C A T I O N 4. L O C A T I O N The Nullagine Project area is located in East Pilbara Shire, between the major regional centres of Newman and Port Hedland, in northwestern Western Australia (Figure 4-). The Nullagine Project area is centred on the intersection of four :25, map sheets (Figure 4-2), namely Marble Bar (SE ¼), Roy Hill (SF 5-2, NE ¼), Balfour Downs (SF 5-9, NW ¼) and Nullagine (SF 5-5, SW ¼). The Nullagine Project area consists of 24 predominantly contiguous tenements totalling ca. 569km²; tenements are a mixture of Exploration Licences, Prospecting Licences and Mining Leases (Table 4-). Outlines of the project area are shown in relation to the outcropping Fortescue Group in Figure 6-2. Locations and details of the constituent tenements are given in Figure S T A T U S O F T H E M I N I N G T I T L E S The status of tenements indicated in Table 4- is as listed on the Western Australian DMP website at the time of writing. The Nullagine Project area consists of a mixture of Creasy Group, BC Iron and Millennium Minerals tenements (Table 4- and Figure 4-3). On 7 August 2 Novo Resources announced that its Australian subsidiary Beatons Creek Gold Pty Ltd. ( Beatons Creek ) had signed a Farm-in and Joint Venture agreement (the Agreement ) with Millennium Minerals that provides Novo with the exclusive right to earn a 7% interest (as to gold and minerals associated with and normally mined with gold) in the tenements comprising Mining Leases 46/9, 46/ and 46/ ( Beatons Creek Tenements ) covering the Beatons Creek goldfield within the Nullagine Project area. To earn a 7% interest in the Beatons Creek tenements, Novo must issue to Millennium such number of common shares of Novo having a value of AUD 5, (as determined in accordance with the Agreement), incur expenditures on the Beatons Creek Tenements of not less than AUD,, by the second anniversary of the Effective Date (as defined in the Agreement), not less than AUD 5, by the first anniversary of the Effective Date, and procuring (at its cost) a bankable feasibility study in respect of the gold rights before the fifth anniversary of the Effective Date. Novo will solely fund all expenditures on the Beatons Creek Tenements required under the Mining Act 978 (Western Australia) in relation to gold rights, and Millennium will not be required to fund any such expenditures on the Beatons Creek 7 39RZ4A


71 Tenements during the farm-in period. Millennium will bear costs associated with exploring for and recovering minerals other than gold. Figure 4-: Nullagine and Marble bar Properties location map (Modified after Blewett et al, 2) 8 39RZ4A
 in the Pilbara Craton. The locations of :25, Geological Sheet covering the Pilbara region and locations of the Marble Bar and Nullagine sub-basins are also shown.")
72 N 2º 22º 23º Younger Rocks Hamersley Group Fortescue Group Greenstones Granitoid Rocks 7º 8º3 9º3 2º3 Figure 4-2: Extent of outcropping Fortescue Group (purple) and overlying Hamersley Group (stipple) in the Pilbara Craton. The locations of :25, Geological Sheet covering the Pilbara region and locations of the Marble Bar and Nullagine sub-basins are also shown. Marble Bar and Nullagine sub-basin and locations of two other areas containing conglomerate-hosted Au placer deposits (see 7.4.) are indicated. Modified after Thorne and Trendall (2) 9 39RZ4A
73 Table 4-: Tenements comprising the Nullagine Project area Likely legal area excludes area of overlapping existing tenements or prior tenement applications. Access to Department of Indigenous Affairs (DIA) registered (Aboriginal Heritage) sites will be restricted Tenement Number Tenement Status Area km² Expenditure Commitment Rent Grant Date E46/797 Granted $7, $2,7.5 22/4/2 Term 5 years Registered Holder WITX Pty Ltd -% DIA Registered Sites Yes E46/946 Granted 24.2 $39, $4,55.3 7/6/2 5 WITX Pty Ltd years -% No E46/953 Pending M46/9 Granted 2.5 $24,8 $3,89.2 6/3/85 M46/ Granted.2 $2,2 $, /2/84 M46/ Granted 4.7 $46,5 $7,6. 7//985 M46/257 Pending P46/577 Granted.9 $7,76 $436.5 /2/2 WITX Pty Ltd -% 2 Millennium Minerals Ltd years (%) 2 years 2 years 4 Millennium Minerals Ltd (%) Millennium Minerals Ltd (%) Tantalumx Pty Ltd -% Mark Gareth Creasy years -% No Yes No No Yes No P46/643 Granted.8 $7,8 $ // 4 WITX Pty Ltd Years -% No P46/743 Pending 2 $8, $45. 6/2/3 4 Years WITX Pty Ltd -% Yes P46/744 Pending 2 $8, $45. 6/2/3 4 Years WITX Pty Ltd -% Yes P46/784 Pending P46/785 Pending P46/786 Pending P46/787 Pending WITX Pty Ltd -% WITX Pty Ltd -% WITX Pty Ltd -% WITX Pty Ltd -% Yes Yes Yes Yes P46/788 Pending WITX Pty Ltd Yes 39RZ4A
74 Tenement Number Tenement Status Area km² Expenditure Commitment Rent Grant Date Term Registered Holder DIA Registered Sites -% P46/789 Pending P46/79 Pending P46/79 Pending P46/792 Pending P46/86 Pending P46/88 Pending P46/89 Pending P46/8 Pending TOTAL 569. $223,34 $3,846 WITX Pty Ltd -% WITX Pty Ltd -% WITX Pty Ltd -% WITX Pty Ltd -% Grant s Hill Gold Pty Ltd (%) WITX Pty Ltd % WITX Pty Ltd % WITX Pty Ltd % Yes Yes Yes Yes Yes Yes Yes Yes On 26 June 22, Novo s Australian subsidiary Grant s Hill Gold Pty Ltd. (Grant s Hill) entered into a sale and purchase agreement (the Sale and Purchase Agreement ) with Welcome Stranger Mining Ltd. ( Welcome Stranger ). As consideration for the prospecting licence, mining information and title transfer of the P46/747 tenement, Novo paid AUD 6, plus GST to Welcome Stranger. On 9 January 22, Novo announced that it signed four farm-in and joint venture agreements (each a JVA ) with the Creasy Group of Western Australia whereby Nullagine Gold Pty Ltd ( Nullagine Gold ), an Australian subsidiary of Novo, is entitled to earn a 7% interest (as to gold and minerals associated with and normally mined with gold, being Gold Rights ) in the prospecting, exploration and mining tenements and applications related to Creasy's % controlled Pilbara Palaeo- Placer project (i.e. Creasy Lands all tenements listed in Table 4-, other than M46/9, Figure 4-3). This project covers ground in the Nullagine embayment located in Western Australia. Nullagine Gold is held % by Conglomerate Gold Exploration Pty Limited ( CGE ), an Australian subsidiary of Novo. CGE and Creasy have also entered into a CGE Shareholders Agreement and a CGE Share Issue Agreement. CGE is already a participant in the nearby Beatons Creek project with the Australian Stock Exchange ( ASX ) - listed Millennium Minerals Ltd. Beatons Creek Gold Pty Ltd ( Beatons Creek Gold ), a % subsidiary of CGE, is entitled to earn a 7% interest in three tenements covering the Beatons Creek conglomerates. Key details of the JVA terms are as follows: 39RZ4A
75 . Four JVA s (and related documents) have been signed with companies controlled by Mark Creasy covering 3 tenements or applications for tenements (the "Properties"). 2. Nullagine Gold will acquire a 7% interest in all Gold Rights with respect to the Properties by spending AUD million on exploration expenditure across the Properties. Nullagine Gold will also become a registered holder of a 7% legal interest in 29 of the 3 tenements. 3. Creasy s interests under each JV will be free carried for all exploration related expenditures. Upon completion of the joint venture, Creasy will retain a 3% interest in all Gold Rights with respect to the Properties, as well as % of rights to all other minerals. Creasy will then hold a 3% legal interest in 29 of the 3 tenements and % of the remaining 2 tenements (but subject to Nullagine Gold s Gold Rights). 4. CGE will reimburse past exploration expenditure on the Properties by Creasy, as verified by CGE, up to a maximum of AUD 5.5 million. Reimbursement is contingent on CGE achieving a listing on a recognised stock exchange (an IPO ) within 4 years of the execution of the JVA s. Reimbursement will be paid from net funds raised in an IPO (if completed) and subsequent funding rounds (if completed), capped at % of net funds from each round, until the verified expenditure is reimbursed. 5. If CGE has not achieved an IPO within 4 years, the Properties will be returned to % ownership by Creasy at no cost, unless otherwise agreed. 6. If a mining decision is made under any of the JVA s following a bankable feasibility study but Creasy elects not to participate, its interest under that JVA and the underlying properties will be transferred to Nullagine Gold and converted to a % net smelter royalty. 7. Nullagine Gold will manage all four joint ventures as if they were a single joint venture. Key details of the CGE Shareholders Agreement and CGE Share Issue Agreement are as follows: 8. Novo will initially control 5% of the issued shares in CGE and Creasy will control 49%. 9. CGE is required to spend (via Nullagine Gold and Beatons Creek Gold) up to a further AUD 3.5 million in aggregate on the Properties and the Beatons Creek tenements to increase its shareholding in CGE to 8% (and reducing Creasy s interest to 9%), subject to a maximum included expenditure on Beatons Creek of $2 million.. Creasy is obliged to use its best endeavours to negotiate a right for Nullagine Gold to participate in an existing Vaalbara Joint Venture between ASX-listed BC 2 39RZ4A
76 Iron Limited and Creasy, bringing certain ground within the Vaalbara Joint Venture. In return Creasy s and BC Iron s interests under that JV with respect to exploration expenditure will be free carried by Nullagine Gold and CGE will reimburse $25, to Creasy. If CGE achieves an IPO it will also issue AUD 5, of shares in CGE to a former tenement holder.. If Creasy does not satisfy the obligation referred to in item () above prior to an IPO of CGE (if completed) then Creasy will forfeit 23.3% of its shareholding in CGE. Prior to an IPO of CGE (if completed) that 23.3% of CGE shares shall have no voting or dividend rights. 2. If the obligation referred to in item () is satisfied then the Vaalbara JV ground will be included within the minimum expenditure commitments and additional expenditure entitlements referred to in items (2) and (9) above. Novo has entered into loan agreements with its subsidiaries to fund their obligations under the JVA s. Novo has also guaranteed performance of those obligations. Novo is entitled to be reimbursed up to AUD 5, for IPO related costs of CGE (if completed). Tetra Tech s search of the DMP records found that 5 of the 24 tenements comprising the Creasy Lands have not yet been granted, although none appear to be subject to any threat of refusal from the DMP for non-compliance with the Mining Act 978 and Mining Regulations 98. The earliest of the pending Creasy tenement applications was made in March, 2. Some of the Creasy Lands tenement applications encroach over existing (live) tenements or current (pending) applications. As both existing tenements and the earliest tenement applications have priority unless withdrawn, boundaries for the Marble Bar and Nullagine Project areas shown in this report exclude all parts of the Creasy tenement applications that overlap either competitor live tenements or priority tenement applications. All pending tenements require signed Native Title agreements with local indigenous groups (i.e., Palyku, Njamal peoples) prior to the commencement of exploration activities. At least seventeen tenements contain or partially overlap registered Aboriginal Heritage sites and access to the ground will be restricted. Guidelines for marking out and applying for minerals tenements in Western Australia are given in the pamphlets Marking Out and Applying for Mining Tenements and Exploration Licences Graticular Boundary System, available from the Government of Western Australia Department of Mines and Petroleum website. Exploration Licences do not need to be marked out on the ground. Mining and Prospecting Leases, not on prescribed land, are marked out as follows: A post projecting at least m above the ground is fixed firmly in the ground as close as practicable to each corner or angle of the land. Two clearly identifiable trenches or rows of stones at least m long must extend from each post in the general direction of the boundary lines. 3 39RZ4A
77 The notice of marking out in the Form No. 2 in the First Schedule is fixed firmly to one of the posts, selected as the datum post. Where the land adjoins other land in respect of which the same person or company is seeking or holds a mining tenement, common posts and trenches or rows of stones may be used for marking out each parcel of land. Applications for mining tenements must be made in the Form No. 2 Application for Mining Tenement and lodged at the office of the Mining Registrar of the mineral field in which the land is situated within days of marking out. Application fees together with the first years rent are payable on lodgement of a mining tenement application. Additionally, a security in the sum of AUD 5, in the Form No. 32 must be lodged with the mining registrar within 28 days of lodging the application. Additionally, applications for Exploration Leases must be accompanied by a statement specifying: The proposed method of exploration. Details of the proposed work programme. Estimate of proposed expenditure on the licence. The applicant s technical and financial resources. Applications for Mining Leases must be accompanied by either: A mining proposal. A mineralisation report containing the details in Section 74(7) and be accompanied by a supporting statement to include details in Section 74(a). Additional requirements of the applicant are described in the DMP pamphlets mentioned previously. 4 39RZ4A
 5")
78 Figure 4-3: Nullagine Tenements Map (Provided by Novo Resources) 5 39RZ4A
79 5. A C C E S S I B I L I T Y, C L I M A T E, L O C A L R E S O U R C E S, I N F R A S T R U C T U R E A N D P H Y S I O G R A P H Y 5. A C C E S S I B I L I T Y Primary access to the project areas is by road from either Port Hedland (population 4,) or the iron ore mining town of Newman (population >42) in northwestern Western Australia and (Figure 4-). The Nullagine Project area is just west of the town of Nullagine (population 2, 364km NNE of Perth). By road Nullagine is 296km SE of Port Hedland and 7km N of Newman. Both tenements are located 6 9km west of the (privately-owned) railroad used to transport iron ore from Newman to Port Hedland (Figure 4-) S I T E T O P O G R A P H Y, E L E V A T I O N A N D V E G E T A T I O N The East Pilbara region has an arid climate, rugged topography and complex geomorphology. The Fortescue Group, which dominates the project areas, is generally well exposed. Most constituent formations of the Fortescue Group give rise to rough terrain of high relief throughout their outcrop area (Thorne and Trendall, 2). This is especially true for basaltic rocks, which characteristically form steep, irregular, boulder-strewn hill slopes. Shale-rich portions of the Jeerinah Formation, at the top of the Fortescue Group, locally give rise to smooth intervening, flat-bottomed valleys (Thorne and Trendall, 2). There are a few minor (unsealed) roads and 4WD tracks in both project areas, but vehicular access is generally poor and hampered by the rugged topography. Elevations range from ca. 5 to 4m and 4 and 55m above sea-level in the Nullagine project areas (Figure 4-). Average annual evaporation of the Pilbara region is about 36mm, over ten times the annual rainfall (Thorne and Trendall, 2). Away from the few major rivers with permanent surface pools or shallow groundwater, vegetation is relatively sparse. Both project areas are lightly vegetated, with a ubiquitous ground cover of spinifex grass and scattered shrubs of Hakea, Acacia and Grevillea. Larger trees, Eucalyptus and Melaleuca spp. are confined to the immediate vicinity of drainage lines (e.g. Thorne and Trendall, 2) C L I M A T E The East Pilbara region has an arid continental climate characterised by very high summer temperatures and large diurnal temperature variations (>3.2 C) throughout the year. December and January the hottest months with average maximum temperatures above 4 C and record highs over 48 C. From October to February the 6 39RZ4A
80 average monthly maximum temperature exceeds 36 C. Maximum temperatures above normal body temperature occur for 6 months of the year. The lowest temperatures occur in the winter months of June August when average maximum temperatures are below 3 C and average minimum temperatures are 2 3 C. The East Pilbara region is influenced by both northern (tropical cyclone) and southern (temperate) rainfall systems, which bring rains in the summer and winter months, respectively. However rainfall in the region is generally light and infrequent. Nullagine has average annual rainfalls of 362mm and 334mm, respectively, mostly falling between January and March. Little rain usually falls between July and November with September and October the driest months. Except for a few isolated pools, creeks are generally dry throughout most of the year, but can rise rapidly and flood large areas after heavy rains (predominantly during the summer months). Because a high proportion of the rainfall can be from a small number of large storms, flooding in the vicinity major river and creek systems is not unusual. The Nullagine River is subject to flooding and the town of Nullagine is located in a Floodplain Management Area I N F R A S T R U C T U R E Particularly in for work in the more remote parts of the project areas, field work is best conducted between late autumn and early Spring (i.e. April September), when temperatures and the likelihood of heavy rains are both lowest. Existing infrastructure in Marble Bar and Nullagine (e.g. airstrips, medical centres, shops, accommodation, etc.) is sufficient to support an early-stage exploration program. Internet access is available onsite; however telephonic communications are currently restricted to a satellite phone or the Telstra 3G Mobile network. The Property has sufficient appropriate sites to accommodate mining, waste rock disposal and accommodation infrastructure, however it is likely that future mining personnel will be accommodated in Nullagine, and processing is likely to be done on a toll basis at one of the nearby plants such as Millennium Minerals Golden Eagle plant. It is possible that workforce requirements could be filled from either Newman or Port Headland and other nearby towns, or by fly-in/fly-out arrangements from Perth via Newman or Port Headland. 7 39RZ4A
81 6. H I S T O R Y 6. P R E V I O U S E X P L O R A T I O N Although the major focus of Fortescue Group U ± Au exploration between 968 and 982, and sporadic gold and diamond exploration subsequently, the Nullagine subbasin also remains very under-explored. A chronological summary of significant past exploration activities in the Nullagine Project area is given in Table 6-. The approximate locations of tenements for the various reconnaissance U ± Au exploration programs conducted between 968 and 984 are shown in Figure 6- (locations in figure correspond to numbers in brackets after the year of the exploration program in Table 6-). The following table contains a historical JORC Inferred resource of koz for the Beatons Creek area estimated in 2 for Wedgetail Exploration/Mining. The current Author considers the preceding historical estimate to be relevant and reliable. The estimate uses the Inferred JORC resource category. It is believed that there is no material difference between this and the inferred CIM category. This historic estimate would require a verification programme of drill hole twinning, and re-sampling to upgrade or verify the historical estimate as a current mineral resource. A qualified person has not done sufficient work to classify the historical estimate as a current mineral resource and the issuer is not treating the historical estimate as current. Figure 6-2 describes the Fortescue geology of the Nullagine sub-basin with respect to tenement boundaries and noteworthy gold deposits in the region. 8 39RZ4A


82 Figure 6-: Map of the northern Pilbara terrane showing the locations of uranium ±gold exploration programs in the Fortescue Group. Numbers in blue (after Carter and Gee, 988) correspond to reference numbers in Table 6-. Outline of the Marble Bar and Nullagine sub-basin project areas shown in red. Modified after Carter and Gee (988) 9 39RZ4A
83 Table 6-: Chronological summary of past exploration and key events relevant to the Nullagine Project area. Colour-coding denotes related programs Year Program Results / Highlights Company / Leader Various U (± Au) exploration programs in Fortescue Group, Nullagine sub-basin (8) 974 (9) () () U exploration in Hardey Fmn, central Nullagine Sub-basin. Program included airborne and ground radiometrics, and followup drilling (4 DDH for 85m) U exploration in Hardey Fmn, central Nullagine Sub-basin. Program included airborne and ground radiometrics, and followup shallow percussion drilling ( holes (depths <2m) for 29m) U and Au exploration in Hardey Fmn, Nullagine sub-basin, centred on Beatons Creek area. Program included size analysis of Au from Beatons Creek Conglomerate and older Archaean (source) rocks. U exploration in Hardey Fmn, central Nullagine Sub-basin. Program included 23 core and percussion holes for 887m) Strip mining and treatment of colluvial and alluvial deposits adjacent to hard-rock conglomerate-hosted gold deposits at Beatons Creek. Exploration of Beatons Creek conglomerate involved geological mapping, sampling, diamond and RC drilling. 983 Beatons Creek drilling WW series (DDH): 2 holes, 5 & 66 m on M46/ ca Beatons Creek drilling CDH-series (DDH): 9 holes totalling 35m on M46/ U up to 4ppm and Au up to 6ppm in surface rock samples (attributed to surface enrichment) Uraninite inclusions in carbonaceous pellets in conglomerate matrix. Best 425 ppm U 3O 8 Holes not deep enough to intercept lateral equivalents to auriferous conglomerates at Beatons Creek (e.g. Farrell and Blake, 984). Best 24 ppm U 3O 8 Best result 3 ppm U 3O 8, <. ppm Au Uranium mineralized zones thin, low-grade and discontinuous. Best 85 ppm U 3O ppm Au Drilling results established subsurface continuity of historically mined reefs. However despite a number of significant mineralised intercepts (see below), the hardrock gold deposits were considered sub-economic Best intersections WW: g/t, 7.23 g/t, 4.83 g/t Results for DDH WW2 (66m) suggest auriferous conglomerates restricted to top 2m of >8 m thick alluvial fan succession. Unconformable contact with 97m Best intersections: 2.89 g/t Au Cominco Exploration, Esso Australia, Essex Minerals, Otter Exploration Marathon Petroleum Cominco Exploration Pty Ltd (e.g. Simpson, 969) Esso Australia Ltd (e.g. Harrison, 974) Essex Minerals Co (e.g. Wilson, 979) Otter Exploration NL / Marathon Petroleum Australia Metana Minerals NL Metana Minerals NL Metana Minerals NL 984 Beatons Creek B-series (RC): 77 holes, 7-38m, total 982m on M46/ 984 District-scale geological mapping (T.S. Blake) and 2 diamond drill holes (total 9m) in Hardey Formation W and SW of Nullagine 984 Two DDH (total 592m) test subsurface continuity of Best intersections: 4.63,., 5.2 g/t DDH BCD-2: 36m weakly auriferous pyritic conglomeratic sandstone at similar stratigraphic level to auriferous conglomerates at Beatons Creek. Gold values d.l. for remainder of Hardey Formation. Both holes intersected ca. 2m thick package of pyritic Metana Minerals NL AMB-JV (Australis Mining / Bass Strait Oil & Gas) Ivanhoe Gold 2 39RZ4A
84 Year Program Results / Highlights Company / Leader auriferous package beneath upper Hardey Fmn cover, km SW of Beatons Creek historic workings. conglomerate with multiple > m.g/t Au intersections. Variability of repeat assays (max: 44.6 g/t Au) suggests nuggety gold. Best results: 4 x 6 g/t Au 984 Surface & down-hole (DDH IN2) IP (DDH IN3-A). Down hole IP delineates main auriferous (pyritic) horizon in DDH IN2. Surface IP: narrow chargeability anomaly -5m depth in vicinity of IN3-A, but possibly terrane effect. Scintrex (for Ivanhoe Gold) Year Program Results / Highlights Company / Leader 984 Single 549m DDH, 7km SW of Nullagine 986 Two DDH (total 2m) as followup earlier Ivanhoe drill holes Geological mapping and data compilation, costeans, shallow RAB drilling at Beatons Creek Short-lived continuation of alluvial gold mining operations at Beatons Creek Single 6.5m inclined RC/DDH in lower Kylena Basalt, upper Hardey Formation 993 Diamond (± Au) exploration western limb of Nullagine syncline 27/3/2 /2/2 May 2 Creasy Group tenements comprising Nullagine Project area staked Wedgetail acquire significant package of tenements in Nullagine area previously held under option 2 Beatons Creek workings, COMseries RAB holes: 2 x 2m RAB holes on M46/9. Pre-22 Geological compilation, soil sampling on M46/ and ). 26 (April) Prospecting / rock sampling at Beatons Creek 26 (post June) Beatons Creek (M46/, ) soil sampling DDH ZD- intersected 55m interval of pyritic conglomeratic sandstone at similar stratigraphic level to auriferous conglomerates at Beatons Creek. Both holes intersect thick auriferous conglomerate package with numerous thin (<m) low-grade Au intercepts. Best 6.6 g/t Au. Auriferous horizons to 5m in BCD- Best RAB/costean results RAB: 27.4 g/t Au from surface Drill hole did not penetrate to stratigraphic level equivalent to auriferous conglomerates at Beatons Creek Gold particles found all 8 >4kg loam and stream sediment samples from area draining probable continuation of auriferous conglomerate package at Beatons Creek Tenement package largely based in older Mosquito Creek Belt to the east, but includes M46/ covering historic Au workings at Beatons Creek COM3 intersected 3.73 g/t and g/t Au in Recent alluvium east of historic hard-rock workings JORC-compliant Inferred 2.5 g/t Au (,oz) at Beatons Creek tenement (M46/ and ) announced to Australian Stock Exchange (ASX) Best results: 34 g/t Au rock sample, Grants Hill workings, Beatons Creek 3km 2 gold-in-soil anomaly (Au>5 ppb) delineated. Maximum value 6.28 g/t Au BC-JV (South Eastern Petroleum NL / Zanex Ltd / Western Resource Projects NL) Minsaco (JV with Ivanhoe Gold) Sons of Gwalia Black Horse Mining Alkane Ocean Resources Mark Creasy (MC) Wedgetail Exploration Wedgetail Wedgetail Exploration/Mining Quinton Hennigh (QH) Newmont Wedgetail Exploration/Mining 2 39RZ4A
85 Year Program Results / Highlights Company / Leader Beatons Creek ( M46/) RC check drilling, 2 hole BCRB BCRC2 Best results: 2.88 g/t, g/t Au. Results suggest results for earlier (Metana) RC drilling in same area underestimate grade and Wedgetail Exploration/Mining 27 Beatons Creek ( M46/) RAB scout drilling: 73 holes, depths 5 4m, TD 5 m below base of oxidation 2 In-loop EM surveys on Creasy ground. Four lines (total 4.9 km) across eastern margin of subbasin Nov, 2 Millennium Minerals (formerly Wedgetail Mining) announce 25% increase in ore reserve for Nullagine Gold Project (Late Archaean Mosquito Creek Belt, immediately east of Nullagine Project area) 28 3 Dec, Site visit 2 8 Feb, 2 MOU for Galliard 7% interest in Creasy Group tenements comprising the Nullagine Project area 4 5/4/2 Galliard Resources / Millennium Minerals announce binding letter agreement providing Galliard with exclusive right to earn 7% interest (as to gold and minerals associated with gold) in Beatons Creek Mining Leases 46/9, 46/ and 46/ width of reefs Best results: BCRB4: 6 g/t, 4.57 BCRB5: 7.27 g/t BCRB22: 6. g/t BCRB28: g/t BCRB3: 2.98 g/t See Section 6..2 Updated ore g/t Au (567,8 oz Au) Updated total Mineral Resource*: g/t Au (.247 Moz Au). *NB. resource spread across 5 project areas, not Beatons Creek tenements Wedgetail Exploration/Mining QH, Galliard Resources Millennium Minerals QH, Robert Scott QH,MC QH, Brian Rear (Millennium) 22 39RZ4A

86 Figure 6-2: Tenement outline for Nullagine Sub-basin project area. Outline of Fortescue Group defining the sub-basin is shown in purple (Scott, 2) 23 39RZ4A
87 6.. GALLIARD IN-LOOP EM SURVEYS 2 In 2, Galliard Resources (now Novo) commissioned a series of trial In-Loop EM surveys over parts of the Nullagine project areas to assess the utility of this technique for resolving the sub-surface geometry of the Fortescue Group (e.g. depth to basement), this comprised the four lines (total length 4.9km) across the eastern margin of the Nullagine sub-basin (Figure 6-3). A more detailed description of this work can be found in the Independent NI43- Technical Report on the Pilbara Palaeoplacer Project, Huxtable (23) Figure 6-3: Location of In-loop EM survey lines for Nullagine sub-basin project area with the property outline shown in red. Small blue arrows denote direction of increasing station number for each survey line. Outline of Fortescue Group defining the sub-basin is shown in purple. From Scott (2) 24 39RZ4A
88 6.2 PREVIOUS METALLURGICAL TEST WORK The only mineral processing or metallurgical investigations reported for the project area are as follows: a) Investigations of Au particle size distributions in auriferous conglomerates from Beatons Creek (e.g. Essex Minerals, Wilson, 979); Semi-quantitative results obtained suggest gold particles in auriferous conglomerates from Beatons Creek average.4mm (Wilson, 979; Farrell and Blake, 984). b) In 27, Wedgetail announced to the ASX its intention to conduct metallurgical test work to determine the most economical method of extracting gold from near-surface oxide material. It was noted that oxidation primarily affected the matrix of the conglomerate (which also contains most of the gold), and that the intervening cobbles and boulders of quartz, chert and granite are largely un-weathered. Accordingly, Wedgetail suggested that breaking and selectively screening the finer grained matrix from cobbles and boulders (waste rock) may enable mechanical beneficiation of ROM feed, prior to treatment in a gravity and/or heap-leach circuit. This could significantly lower processing unit costs as well as lowering effective mining cut-off grades and the cost of establishing the processing circuit. It is not known, however, whether this metallurgical test work was ever undertaken, and if so, what results were obtained. Furthermore, given the relatively shallow base of oxidation in this area (~2m), the applicability of these processing methods to larger scale mining operations, targeting ores in fresh rock, is open to question. No metallurgical testing of fresh (sulfide-bearing) mineralised samples in either of the project areas has been undertaken. c) Metana Minerals reportedly recovered dominantly coarse gold during strip-mining of recent alluvial/colluvial deposits at Beatons Creek. Metana used a wet-gravity plant to extract gold, and the tails consistently assayed.3 g/t Au (7 % of the head grade, Farrell and Blake, 984). 6.3 PREVIOUS PRODUCTION FOR BEATONS CREEK AREA There are no official records of gold production at Beatons Creek prior to the establishment of the Western Australian Mines Department in 897 (Maitland, 95; Finucane, 935), and individual accounts of official production post-897 also vary. However, most estimates suggest total production was <, tonnes of material for <4,oz at average grades of 5 2 g/t Au (e.g. Maitland, 95; Finucane, 935; Wedgetail Exploration, 27a). Post-897 production records indicate abrupt decreases in grade within the first few years of operation at most of the mines. Although local rich pockets of ore were mined between 97 and 92 (Finucane, 935) organised mining at Beatons Creek had largely ceased by 94 (Maitland, 95). Most of the adits at Beatons Creek are only about m high, with no present 25 39RZ4A
89 day standards ground in place. Figure 6-4 depicts the narrow nature of the adits at Beatons Creek. Figure 6-5 is a historical map illustrating the spatial extents of the historical workings at Beatons Creek. The author is satisfied that the extent and nature of the historical workings is not material to the resource stated later in this report RZ4A


90 Figure 6-4: Photo provided by Novo depicting some of the historical workings at Beatons Creek 27 39RZ4A
91 Figure 6-5: Historical map depicting historical workings (hatched areas) at Beatons Creek (Provided by Novo) 28 39RZ4A
.")
92 7. 7. GEOLOGICAL SETTING AND MINERALISATION REGIONAL GEOLOGICAL SETTING The Nullagine project area is located in the East Pilbara granite greenstone terrane of the Early to Late Archaean Pilbara Craton of north-western Western Australia (Figure 4- and Figure 4-2). The sub-basins formed on the older granite greenstone basement during the initial stages of Late Archaean continental rifting and formation of the Late Archaean Palaeoproterozoic Hamersley Basin. The exploration properties are centred on areas containing extensive and relatively complete lower Fortescue Group successions, in comparison to other parts of the north Pilbara Craton (Figure 4-2 and Figure 7-). Although up to 5 Ma older, the ca Ga Fortescue Group is commonly compared to the Ventersdorp Supergroup of the Witwatersrand Basin, South Africa which is similar in both composition and tectonostratigraphic setting (Figure 7-2; Nelson et al., 992, 999; Martin et al., 998; Thorne and Trendall, 2). Figure 7-: Geological map of the Hamersley Basin Showing the burial metamorphism zones of Smith et al (982). Zone prehnitepumpellyite zone, Zone 2 - prehnite-pumpellyite-epidote zone, Zone 3 - prehnite-pumpellyite-epidote-actinolite zone; Zone 4 - actinolite zone. Adapted after Trendall and Thorne (2) 29 39RZ4A
 The lowest part of the regional succession is comprised of granitic and greenstone rocks that are between 366 and 284Ma; these")
.")
93 Figure 7-2: Comparison between Hamersley Basin and Witwatersrand Basin tectono-stratigraphy (after Nelson et al., 992, 999; Martin et al., 998; Thorne and Trendall, 2) The lowest part of the regional succession is comprised of granitic and greenstone rocks that are between 366 and 284Ma; these are moderately to strongly deformed mafic volcanics and intercalated felsic volcanic and sedimentary rocks, which comprise the greenstone sequences, now occupy a series of arcuate synclinorial belts between generally less deformed ovoid granitoid complexes (Figure 7-3; Huston et al., 2, 22a). The granite batholiths are 25 km in diameter, 3 39RZ4A
94 have centres spaced, on average, 6 km apart, and were largely emplaced prior to 2.92Ga, however some were also intruded by small, highly reduced, post-tectonic, tin-bearing granites between 2.88 and 2.84Ga (Figure 7-3). These basement rocks are overlain by four sequences of Archaean sedimentary and volcanic rocks; from oldest to youngest these sequences are: the Ga George Creek Group, the 3.2Ga Cleaverville Formation, the Ga DeGrey Group and finally the Ga Hamersley Basin succession (Mt Bruce Supergroup), which consists of the Fortescue and overlying Hamersley groups (Figure 7-, Figure 7-2 and Figure 7-3). The Mosquito creek formation which correlates with the DeGrey group is interpreted based on Geophysical data to extend for at least 2km beneath the Fortescue Group cover, and hosts a number of small to moderate sized disseminated, vein- and shear-hosted mesothermal Au deposits, interpreted to have formed at ca. 295Ma (Figure 7-2, Pb-Pb model age, Huston et al., 22a). Gold eroded from these deposits during the Late Archaean has long been considered a likely source for auriferous placer deposits hosted in the Fortescue Group near Nullagine (Maitland, 95; Finucane, 935; Noldart and Wyatt, 962; Hickman, 983; Thorne and Trendall, 2). Part of the Hamersley Basin succession is the late Archaean ( Ma) Fortescue Group; a sequence of mafic and felsic volcanics and sedimentary rocks up to 6.5km thick (Thorne and Trendall, 2; Blake, 993, 2) and is exposed over a wide area in the Pilbara Craton (Figure 4-2). Thorne and Trendall (2) divide the Fortescue Group into four major tectono-stratigraphic units and seven formations. The entire sequence is interpreted to reflect increasing amounts of subsidence in an overall extensional setting. These four units are summarised as follows: a) Unit (basal) Consists primarily of the 2.5km thick Mount Roe Basalt which consists of sub aerial and subaqueous (<2%) basaltic lavas and locally intercalated subaqueous volcaniclastics (<5%). Subaqueous units in the Mount Roe Basalt are interpreted to have been deposited in a lacustrine, rather than marine, setting (Thorne and Trendall, 2). Widespread NNEtrending medium- to coarse-grained, dolerite and gabbro dykes mafic dykes of the Black Range Suite in the East Pilbara terrane, are interpreted feeders to the Mount Roe Basalt (Williams, 998; Thorne and Trendall, 2). b) Unit 2 Primarily the Hardey Formation which unconformably overlies Unit and is up to 3km thick, and consists of a diverse association of sedimentary, mafic and felsic volcanic rocks (and high-level intrusions), which were deposited in continental to shallow-marine settings. This unit hosts the Gold mineralisation at Nullagine and Marble Bar. c) Unit 3 consists of the basal Kylena (sub aerial basalt), Tumbiana (marginal to shallow marine sedimentary rocks), and uppermost Maddina (sub aerial basalt) formations. Although deposited in a largely sub aerial environment, Unit 3 marks a widespread coalescence of individual sub-basins across the Pilbara craton (Thorne and Trendall, 2). Where the Fortescue Group 3 39RZ4A
95 directly overlies granitic basement the Kylena (Basalt) Formation is typically the lowermost unit (Figure 7-; Hickman, 983; Thorne and Trendall, 2). d) Unit 4 The Jeerinah Formation marked the onset of a major marine transgression across the Hamersley Basin (which continued into deposition of the overlying Hamersley Group). In the north Pilbara Craton, the Jeerinah Formation predominantly consists of argillaceous rocks; however basaltic lavas and volcaniclastic rocks dominate in the south. The Fortescue Group is disconformably overlain by marine sedimentary sequences (shale, banded iron formation and carbonate) of the Ga Hamersley Group (Figure 7- and Figure 7-2). High-precision geochronological data obtained in the last decade for the Fortescue Group in the Nullagine sub-basin has enabled further refinement of the sequence (Blake, 2; Blake et al., 24). This data shows that the base of the Kylena Formation is of similar age to the underlying Hardey Formation and Mount Roe Basalt, whereas the overlying Tumbiana and Maddina formations are significantly younger (Fig. 4; Blake et al., 24). Blake (2) and Blake et al. (24) place the Kylena Basalt, Hardey Formation and Mount Roe Basalt in their Nullagine Supersequence, which is interpreted to reflect initial deposition into fault-controlled rift-basins during the early stages of continental break-up. Overlying Fortescue Group formations are interpreted to have been deposited during a more complex second phase of rifting. Blake (2) and Blake et al. (24) assign the Tumbiana Formation and lower part of the Maddina Formation to their Mount Jope () Supersequence (Figs. 4 6). They interpret this succession to record a change to regional subsidence and burial. The upper part of the Maddina Formation and most of the overlying Jeerinah Formation are assigned to the Mount Jope (2) Supersequence (Blake, 2; Blake et al., 24). A major shift in palaeomagnetic pole positions occurs across the boundary between the Mount Jope () and (2) Supersequences (Blake 2; Blake et al. 24) RZ4A
 AN D M ET AM OR PH I SM Although the Pilbara Craton is one of the best preserved and least dismembered Archaean terranes in the world, it nonetheless had a complex structural evolution")
.")
96 Figure 7-3: 7.. STRUCTURE Summary map showing the age and distribution of the granites, greenstone successions and sedimentary basins in the north Pilbara Craton. (From Huston et al., 22a) AN D M ET AM OR PH I SM Although the Pilbara Craton is one of the best preserved and least dismembered Archaean terranes in the world, it nonetheless had a complex structural evolution involving at least thirteen deformation events between ca. 346Ma to and 275Ma (Huston et al., 2, 22a). However, in the north Pilbara Craton, the Fortescue Group has only undergone minor deformation and low grade metamorphism (Figure 7-2). In the Nullagine project area, the Fortescue Group is gently folded by two generations of folds, and cut by a complex array of mostly small displacement normal faults (Figure 7-5; Blake, 2). Fortescue Group strata generally dip at <2, although steeper dips (up to ~45 ) occur locally along the eastern margin of the Nullagine sub-basin (Farrell and Blake, 984). In the Nullagine sub-basin assemblages reach prehnite pumpellyite epidote facies (Figure 7-2). These assemblages indicate maximum temperatures <3 C (Smith et al., 982; Thorne and Trendall, 2) RZ4A
97 7..2 R E GI ON A L E XP L O R AT I ON Alluvial Gold was first discovered in Nullagine in 886 (Maitland, 95) and by 893 Nullagine had become the principal alluvial gold field in the region. A hard-rock source for alluvial deposits at Nullagine was identified in 895, in the same year that the township was formerly declared. The mineral potential of the Pilbara Craton has been generally down-played by the minerals industry and as a result the region has been much less extensively explored than many other Archaean cratons throughout the world, the Yilgarn Craton to the south (Blewett et al., 2). Organised exploration of the Fortescue Group in the north Pilbara region began in the late 96s. In the early years of exploration ( ) uranium, rather than gold, was the primary target. The first exploration programs to target parts of the Nullagine project area were conducted between 968 and 982. The basis for these programs was interpreted similarities between pyritic conglomerates in the Fortescue Group and auriferous and/or uraniferous Archaean conglomerates in South Africa and Canada. Exploration generally involved initial airborne radiometric surveys, followed ground radiometrics and rock sampling. In some cases limited shallow drilling programs were also undertaken, the most significant of which a 4 hole diamond (total 85m) and hole diamond and percussion (total 29m) drilling programs by Cominco and Esso, respectively, in the Nullagine sub-basin (Carter and Gee, 988). The deepest hole drilled in the project area was a,66m diamond hole drilled by Metana Minerals NL in 983 (see Table 6-). Results of the early exploration programs suggest uranium in the Hardey Formation principally occurs as fine uraninite grains in thucholite pellets and an uraniferous phase, interpreted to be brannerite, in detrital anatase (Carter and Gee, 988). High uranium (>4,ppm U3O8) and gold (up to 6ppm Au) from surface rock chip samples were reported locally (Carter and Gee, 988). However assays for drill core intercepts of these horizons revealed much lower concentrations of U3O8 (<5ppm) and trace amounts of gold, at best. Elevated gold and uranium values in rock chip samples where interpreted to reflect near-surface enrichment due to the action of acidic ground waters generated by oxidation of pyritic conglomerates (Carter and Gee, 988). Since 983, exploration activities have largely concentrated on the Nullagine subbasin, principally in the immediate area of the Beatons Creek goldfield near Nullagine. Several deeper diamond holes were drilled in adjacent parts of the Nullagine sub-basin during the mid-98s RZ4A


98 Figure 7-4: Litho-stratigraphy, package boundaries and geochronology of the Fortescue Group in the Nullagine sub-basin from Blake et al. (24) 35 39RZ4A
, fold axial traces and major faults. The solid red line is the outline of the project area.")
99 Figure 7-5: Simplified geological map of the Nullagine sub-basin showing package and major lithological boundaries (thin lines), fold axial traces and major faults. The solid red line is the outline of the project area. Modified from Blake (2) 36 39RZ4A
100 LOCAL GEOLOGICAL SETTING N U L L A GI N E S U B -B AS I N The Nullagine sub-basin (Blake, 984a, b, 993; Farrell and Blake, 984; Carter and Gee, 988) or Nullagine Synclinorium (Blake, 2, Blake et al., 24) is a >6km long, NNE-trending half-graben formed in response to WNW ESE directed extension during the early stages of continental break-up (Figure 7-6, Figure 7-7; Blake, 993, 2). Widespread mafic dykes of the Black Range Suite (interpreted feeders to the Mount Roe Basalt) mostly trend NNE also implying WNW ESE-directed extension during lower Fortescue Group deposition (Williams, 998; Thorne and Trendall, 2; Blake, 2; Blake et al., 24). The Nullagine sub-basin opens into the Hamersley Basin to the south, and is partly bound by syn-depositional normal faults along its eastern margin (Farrell and Blake, 984, Blake, 993). Progressively younger Fortescue Group strata on-lap basement rocks towards the south (Figure 7-6, Figure 7-7; Hickman, 983; Farrell and Blake, 984; Blake 984a, 993, 2). Palaeocurrent data from the Hardey Formation suggests the Nullagine sub-basin drained towards the north during initial basin development (Farrell and Blake, 984; Blight, 985, p. 9). By contrast, in the south of the Hamersley Basin, westward thickening of the Hardey Formation and westerly-directed palaeocurrents are interpreted by Blight, (985) to indicate deposition in a broad E W-trending basin that opened towards an ocean in the west. Greater thicknesses and continuity of Mt Jope () and (2) Supersequences towards the Hamersley Basin (Figure 7-, Figure 7-6, and Figure 7-7) suggest a reversal in net drainage direction along the Nullagine sub-basin occurred during or after deposition of the Kylena (Basalt) Formation (Package 6; Figure 7-4, and Figure 7-6). The Fortescue Group unconformably overlies a wide variety of older Archaean rocks around the perimeter to the Nullagine sub-basin (Figure 7-3). However, along much of the NE margin to the sub-basin the Fortescue Group unconformably overlies the Mosquito Creek Formation, which occupies a 3 x 65km ENE-trending belt east of Nullagine (Figure 7-3) RZ4A


101 Figure 7-6: Simplified geological map of the Nullagine sub-basin showing distribution of major litho-stratigraphic packages comprising the Fortescue Group. Solid red line is the outline of the project area. Modified from Blake (2) 38 39RZ4A

102 Figure 7-7: Simplified geological map of the Nullagine sub-basin showing dominant lithologies and package boundaries. Solid red line is the outline of the project area. Modified from Blake (2) 39 39RZ4A
103 S T R A T I GR A PH I C D EV EL O PM EN T The stratigraphic development of the Fortescue Group in the Nullagine sub-basin is better understood than anywhere else in the Pilbara region, largely due to over two decades of mapping, stratigraphic and geochronological studies by T. S. Blake, (e.g. Figure 7-4, Figure 7-5 to Figure 7-7). The basal unit of the Fortescue Group, the Mount Roe Basalt, is discontinuously exposed in the north, and along the north western margin of the Nullagine sub-basin, where it is up to 5m thick (Hickman, 979; Blake, 2). Although the Mount Roe Basalt is not exposed at surface in the project area (Figure 7-6) it may occur locally at depth beneath the Hardey Formation cover. In the Nullagine sub-basin, the Hardey Formation either unconformably overlies the Mount Roe Basalt or older Archaean basement and consists of up to 7m of mostly terrigenous clastic sedimentary rocks deposited in braided fluvial, lacustrine and alluvial fan settings (Blake, 993; Blake et al., 24). In the north of the project area, the base of the Hardey Formation is intruded by the up to 5m thick, 2766 ± 2Ma dacitic Spinaway Porphyry (Figure 7-6 and Figure 7-7; Blake et al., 24). The upper contact of the Spinaway Porphyry is erosional, however Hardey Formation sandstones immediately above this contact are intruded by rhyolite of identical age to the Spinaway Porphyry indicating the time-break across the unconformity was small (Figure 7-4; Blake et al., 24). Blake (2) subdivides the Hardey Formation above the Spinaway Porphyry in the Nullagine sub-basin into two unconformable packages, P3 and P4 (Figure 7-4 and Figure 7-6). Blake previously called these sequences Units 3a and 3b of the Taylor Creek Sequence, and the former terminology was widely used in exploration reports for tenements in the present project area during the 98s and 99s (Figure 7-9). Auriferous conglomerates exposed in the Beatons Creek area near Nullagine (Figure 7-8) occur in Package P4 of the Fortescue Group (Figure 7-4, Figure 7-6; Blake, 2; Blake et al., 24, i.e. Taylor Creek Sequence Unit 3b), not at the base of the Hardey Formation as stated in some earlier Mines Department and Geological Survey reports (e.g. Hickman, 983). A felsic tuff near the base of a relatively well stratified sequence immediately overlying the auriferous conglomerates (ca. 3m below the top of Package 4) is dated 2752 ± 5Ma (Figure 7-8; U-Pb zircon, Blake et al., 24) and provides a minimum age constraint on their formation (Figure 7-4). The host rocks to the gold deposits at Beatons Creek occur towards the top of a >8m thick sequence of poorly-stratified, poorly-sorted, polymictic, pebble to boulder conglomerate and lesser conglomeratic sandstone, which is apparently restricted to an area within a few kilometres of Beatons Creek (Figure 7- and Figure 7-). These deposits are much coarser grained, less well stratified and probably much thicker than time-equivalent (Hardey Formation) sequences further west in the Nullagine sub-basin. For example, based on pre-984 exploration drilling results from the western and central parts of the Nullagine sub-basin, Carter and Gee (988) estimate the Hardey Formation is ca. 3m thick in the Nullagine sub-basin; 4 39RZ4A
104 less than one quarter of its total thickness in the Beatons Creek area. The thick, poorly-stratified conglomerate succession at Beatons Creek is interpreted to have been deposited in an alluvial fan adjacent to the then-active, fault-bounded, eastern margin of the Nullagine sub-basin (Figure 7- and Figure 7-; Farrell and Blake, 984a, b). Geochronological constraints for this part of the Hardey Formation (Figure 7-4) suggest a minimum average sedimentation rate of m/ma for the 4m of Hardey Formation above the Spinaway Porphyry in the eastern part of the sub-basin, similar to sedimentation rates in comparable Phanerozoic extensional basins (Blake et al., 24). Four diamond drill holes collared immediately southwest of the area of historic workings at Beatons Creek (Figure 7-8 and Figure 7-) all intercept the fault contact with the underlying (i.e. footwall) Mosquito Creek Formation, confirming that the basin-bounding fault is a normal fault, which dips 6 65 W in this area. Two kilometres further southwest the fault is on-lapped by sandstones and tuffaceous sediments of the upper Hardey Formation (Figure 7-8, Figure 7-9 and Figure 7-). This relationship both demonstrates that the fault was active during Hardey Formation sedimentation and that major movement on it ceased during the final stages of Package 4 deposition. Blake s mapping in the Beatons Creek area demonstrates a net decrease in the grain-size of laterally-sourced (= lithic-rich) sediment component above the Beatons Creek fan (e.g. transition from unit C3bL to mixed S3bL/C3bL, where C denotes conglomerate, S denotes sandstone and L denotes supply by lateral drainage systems, Figure 7-8). This transition was followed by an increase in lateral extent of arkosic sandstones interpreted to have been deposited by NNE-flowing axial drainage systems (e.g. unit S3bA, where S denotes sandstone and A denotes axial drainage system, Figure 7-8). Collectively these transitions suggest a progressive reduction in topography across the original basin-bounding fault at Beatons Creek. This could have been caused by a decrease in displacement-rate on the basinbounding fault, and/or transfer of displacement onto newly formed faults further to the east. 4 39RZ4A
 and unpublished maps produced by Ivanhoe Gold, Metana, and Sons of")

105 N Figure 7-8: Geological map of the Beatons Creek area, Nullagine compiled by Scott (2) from various sources Farrell and Blake (984a, b) and unpublished maps produced by Ivanhoe Gold, Metana, and Sons of Gwalia. Positions of existing diamond drill holes in this area are indicated by pink dots. Outcrop of main historically worked auriferous horizons shown in yellow. For legend please see Figure 7-9 below RZ4A

 43")
106 N km Figure 7-9: Geological Map of Beatons Creek area from Scott (2) 43 39RZ4A
, and probable surface (blue shading) and subsurface (olive green shading) extents of the auriferous portion of the Beatons Creek alluvial fan.")
.")
107 Figure 7-: Map of the central part of the Nullagine sub-basin project area showing main basin-architectural features, existing diamond drill holes (red dots), current mapped extent of auriferous reefs at Beatons Creek (yellow), and probable surface (blue shading) and subsurface (olive green shading) extents of the auriferous portion of the Beatons Creek alluvial fan. Red dashed lines denote the positions of the major mineralized trends in the Mosquito Creek Belt, to the east of the Nullagine sub-basin (position of Golden Eagle deposit also indicated). Heavy grey shading denotes area of discontinuous outcrop of chert-pebble conglomerate and interbedded sandstone overlying the Mosquito Creek Formation (e.g. Blake, 987). Other labelled features discussed in text, Scott (2) 44 39RZ4A
 in the vicinity of the eastern margin of the Nullagine")

108 Figure 7-: Interpretive cross-sections by T.S. Blake (ca. 984) in the vicinity of the eastern margin of the Nullagine sub-basin near Nullagine. Based on correlation of sequences in DDH BD-, BD-2 and BD-3 and ZD-. See Figure 7- for drillhole locations. From Scott (2) 45 39RZ4A
109 S T R A T I GR A PH I C D I ST R I B U T I ON N U L L A GI N E SU B - B A SI N OF A U R I F ER O U S C O N GL O M ER A T E S IN THE To date, auriferous conglomerates in the Nullagine sub-basin have only been identified in the Beatons Creek area, within Package 4 (upper Hardey Formation) of the Fortescue Group. Assay data for drill holes within 5km of Beatons Creek, which collectively traverse the entire thickness of Hardey Formation, provide no evidence for further anomalous enrichment in gold at other levels in the formation, at least in this part of the sub-basin (e.g. Figure 7-). Marginal to shallow marine sedimentary rocks occur in the Tumbiana Formation overlying the Kylena Formation (Thorne and Trendall, 2), however in the project area this succession is dominated by mafic tuff (Figure 7-6 and Figure 7-7; Blake, 2). The potential for auriferous conglomerates at this level in the sequence is unknown because the succession has not previously been explored. STRUCTURE The structure of the Nullagine sub-basin is comparatively simple, and bedding dips are generally low (<2 ) except adjacent to faults, particularly along the eastern margin of the sub-basin. The gross structure is dominated by two NE-trending, gently SW- plunging synforms adjacent and sub-parallel to the eastern and western margins of the sub-basin, separated by a central antiformal zone (Figure 7-5; Blake, 2). The central antiform coincides with an original palaeo-high within the subbasin (e.g. note reduced thickness of Hardey Formation (Packages 3 and 4) above the Spinaway Porphyry in this area (Figure 7-6 and Figure 7-). 7.3 POST-ARCHAEAN COVER SEQUENCES Post-Archaean cover sequences are generally insignificant in both project areas. Most of the Pilbara region has been above sea level since the late Mesozoic. The area was deeply weathered in the Late Cretaceous Early Eocene with wide spread development of ferruginous duricrust. The area has been deeply incised in response to falling sea level since the Eocene however remnants of the duricrust still cap some of the higher hills in the Nullagine Project area (Blake, 994) RZ4A
110 7.4 MINERALISATION The main zones of mineralisation defined at Beatons Creek occur as narrow,.4 3.5m thick, with most.9.2m thick, reefs within; (i) thin topographic-hollow or palaeochannel fill, (ii) laterally extensive (up to km) braided fluvial or sheet-wash deposits, and (iii) stacked horizons in thick, laterally-extensive alluvial fan sequences, within poorly-sorted, matrix-supported conglomerates and finer grained, moderately well sorted, conglomerates with high proportions of quartzose clasts (i.e. quartz pebble conglomerates, Ivanhoe Gold Pty Ltd, 984; Menzies, undated report). Most of the gold occurs as fine grains, larger flakes and rounded particles up to several millimetres across (Finucane, 935; Ivanhoe Gold Pty Ltd, 984; Menzies, undated report) within the matrix of these conglomerates in close association with so-called buck-shot pyrite nodules, 2 65mm in diameter, which are interpreted to be of detrital origins. The likely source for this detrital gold is likely to be the greenstone hosted gold deposits of the Mosquito Creek formation, for which there is significant evidence in the nature of the polymictic conglomerate clasts at Beatons Creek. Conglomerates exposed in the area of historic workings at Beatons Creek are commonly moderately to strongly kaolinised (alteration affects lithic clasts and argillaceous matrix material) and locally this occurs along grossly stratabound zones (Figure 7-6 and Figure 7-7). It is not clear however, whether this is a result of modern weathering (e.g. acidity generated by pyrite dissolution), local interaction with acidic ground waters during deposition of the sequence or some other event. The Mosquito Creek fault, a NE-SW striking, steeply dipping structure is interpreted to be the sub-basin bounding structure which separates the older mosquito creek rocks from the mineralised Hardey formation conglomerates. Three domains based on structure and orientation have been defined at Beatons Creek (Figure 7-2) with the Grants Hill Fault zone, a steeply dipping structure that strikes NW-SE, that separates and offsets the two domains at Grants Hill (Domains one and two). The third domain is the Golden Crown domain which sits to the NE of domain one. These domains are described in further detail below RZ4A
 D O M A I N (G R A N T S H I L L NE OF T H E G R AN T S H I L L F AU L T ) The reefs in Domain are dipping at about 4º to")
111 Domain 3 Golden Crown Domain Grants Hill Mosquito Creek Fault Grants Hill Fault Domain 2 Grants Hill Figure 7-2: 7.4. Oblique plan view of the Beatons Creek reefs with grid for scale (m x m grid) D O M A I N (G R A N T S H I L L NE OF T H E G R AN T S H I L L F AU L T ) The reefs in Domain are dipping at about 4º to the northwest (Figure 7-3), with the largest reef (red) being the most laterally extensive at about km down-dip and about 4m along strike to the northeast. Eleven individual reefs have been modelled for this domain, which is truncated to the southeast by the Mosquito Creek Fault and to the southwest by the Grants Hill Fault (Figure 7-2). The modelled reefs vary from about to 6m in thickness, and are all hosted by the polymictic conglomerates. Some un-modelled, small scale (displacement-wise), normal faults parallel to the Grants Hill Fault, gradually step the reefs down to the northwest RZ4A
 D O M A I N 2 (G R A N T S H I L L SW OF T H E G R AN")


112 Figure 7-3: Section view of Domain looking NE (Grid for scale) D O M A I N 2 (G R A N T S H I L L SW OF T H E G R AN T S H I L L F AU L T ) The reefs in Domain 2 are dipping at about 2º to the northwest (Figure 7-4), with the largest reef being the most laterally extensive to about 465m down-dip and about 25m along strike to the Northeast. Nine individual reefs have been modelled for this domain, which is truncated to the southeast by the Mosquito Creek Fault and to the northeast by the Grants Hill Fault (Figure 7-2). The modelled reefs vary from about to 6m in thickness, and are all hosted by the polymictic conglomerates. Some unmodelled, small scale (displacement-wise), normal faults parallel to the Grants Hill Fault, gradually step the reefs down to the northwest. Figure 7-4: Section view of Domain 2 looking NE (Grid for scale) 49 39RZ4A


113 7.4.3 D O M A I N 3 (G O L D EN C R O WN ) The reefs in Domain 3 are dipping at about º to the northwest (Figure 7-5), with the largest reef being the most laterally extensive to about 67m down-dip and about 44m along strike to the Northeast. Three individual reefs have been modelled for this domain, (Figure 7-2). The modelled reefs vary from about -5m in thickness, and are all hosted by the polymictic conglomerates. Figure 7-5: Section view of Domain 3 looking NE (Grid for scale) 5 39RZ4A
 are typical of the auriferous package.")
 occur locally.")
114 Figure 7-6: Outcrop of Hardey Formation immediately south of the area of historic gold mining at Beatons Creek (RJS locality A, GDA94: 5 K m E, m N). Poorly-sorted, poorly-stratified cobble, kaolinitic, polymictic cobble conglomerates visible in the foreground of B (also F) are typical of the auriferous package. Thin, fine grained tuffaceous horizons (E) occur at the top of this sequence and throughout the overlying (orange-brown weathering in A, B) well stratified, apparently un-mineralized conglomerate, conglomeratic sandstone and sandstone sequence. Thin quartzrich gravel sand quartz-pebble conglomerates (D) occur locally. 5 39RZ4A
.")
.")
115 Figure 7-7: Figures A to E A) Stratabound zone of kaolinite-altered conglomerate in Golden Crown area, Beatons Creek (Photo from Deans Hill, RJS locality A4D, GDA94: 5 K 2422 m E, m N). (B) Haematitic, kaolinite altered polymictic conglomerate in old mine adit, main line of historic workings, Grants Hill (RJS locality A3, GDA94: 5 K m E, m N). A sample of adjacent, similar material collected by the author assayed g/t Au (see 9.4). (C) Entrance to 52 39RZ4A
116 mine adit, mainline of historic workings, Grants Hill (RJS locality A, GDA94: 5 K m E, m N). Note gently dipping bedding parallel fabric in conglomerate. (D) Discontinuous cm wide horizon containing sparse, Fe-oxide replaced buckshot pyrite grains to cm (dark purple-grey), located just inside the adit pictured in (C). The interval sampled by Scott (2) assayed at nearly 7 g/t Au. (E) Clast of older (Dromedary-type) chert-pebble conglomerate from the auriferous conglomerate package at Beatons Creek RZ4A
117 8. DEPOSIT TYPES The mineralisation model employed by Novo for the Nullagine property is based on; Similarities between placer deposits hosted by conglomerates in the late Archaean Fortescue Group and auriferous reefs in the Witwatersrand basin, South Africa which were first noted over a century ago. Although the similarity in the age of the host rocks between these two areas was not recognised for many years, the development of locally high grade gold in conglomerates containing significant concentrations of rounded detrital pyrite, and apparent lateral continuity over at least s of meters in the case of some of the Beatons Creek reefs drew immediate comparisons with the South African deposits (Maitland, 95; Finucane, 935). The identification of these similar rocks at Beatons Creek in the Hardey Formation of the Fortescue Group, where auriferous reefs were identified from rigorous grab sampling of the outcropping reefs as well as historical adits (at Beatons Creek in particular) lent credence to the mineralisation model used. The presence of significant concentrations of rounded detrital pyrite was also a factor in reef and model identification. The drilling done by Novo in 2 and 22 was specifically designed to target this model, with significant success in delineating the relatively shallow and shallowly dipping (<2º) reefs, at Beatons Creek in particular, over s of meters. The mineralisation at the properties on face value certainly appears to be of placer type origins, with gold occurring as fine grains and larger flakes and rounded particles up to several millimetres across in the conglomerate matrix (Finucane, 935; Ivanhoe Gold Pty Ltd, 984; Menzies, undated report), and as linings around the detrital pyrite grains and in particular along unconformity boundaries. 8. GOLD DEPOSITS OF THE WITWATERSRAND BASIN The late Archaean Witwatersrand basin in South Africa has produced almost 4% of the gold mined during recorded history (ca. 5, t (>6Moz) Au, Frimmel et al., 25). In 22, the remaining reserves in the Witwatersrand Basin were estimated to be about 38, t Au. Despite the large amount of academic and mining company research conducted since their discovery in 886, there is still no consensus on how and when the giant Witwatersrand gold deposits formed. Debate centres on the relative importance of three distinct processes in controlling the present distribution of gold; namely () sedimentary introduction of detrital (particulate) gold (Mellor, 96; Minter 978), (2) organic or microbially-mediated, syn-sedimentary gold precipitation (or entrapment) (Hallbauer, 975a, b; Mossman et al., 28) and (3) gold introduction during post-depositional hydrothermal alteration (e.g. Phillips and Meyers, 989; Phillips and Law, 994, 25; Barnicoat et al., 997). According to 54 39RZ4A
118 Frimmel et al. (25), geologists who have studied Witwatersrand geology at the macroscale have generally been persuaded by the strong sedimentological controls on gold distribution and favoured (palaeo) placer models for gold mineralisation. These models have been successfully used in mining and exploration over a century (Frimmel et al., 25). 8.. P AL AE O PL AC ER M OD E L F OR T H E W I T W AT ER S R AN D B A SI N G OL D D E P O SI T S The majority of Witwatersrand gold occurs, along with concentrations of rounded pyrite and uraninite grains and commonly abundant carbonaceous matter (typically described as bitumen or pyrobitumen in the literature), on laterally extensive degradational surfaces (many tens hundreds of km2) of fluvial conglomerate. Reefs are typically hosted by thin conglomerates or conglomeratic sandstones (less commonly sandstones) and concentrated around the preserved northern, western and southern margins of the Witwatersrand Basin (Figure 8-). They occur at multiple stratigraphic levels through the >km thick sedimentary and volcanic succession, but are best developed in the Ga Central Rand Group, and (Figure 7-2; Frimmel et al., 25). Individual reefs typically consist of one or more auriferous horizons concentrated at the base (most common), top, and/or interior (e.g. along cross-bed foreset laminations) of well defined, laterally-persistent (i.e. up to s of kilometres) beds. Most reefs are <2m thick and payable portions of the beds are commonly <cm and not uncommonly <2cm thick (Jolley et al., 24; Frimmel et al., 25). Lateral persistence of the reefs is attributed to deposition in a distal alluvial fan to fan-delta setting. These environments have also been regarded as most favourable to placer development, due to greater degrees of sedimentary reworking. However in the Sun-Target area (i.e. northern extension to Free State (Welkom) Goldfield, Figure 8-), numerous low to high grade reefs of limited lateral extent occur within a ca. interval in the Central Rand Group (e.g. Eldorado Fan Delta complex), and are interpreted to reflect deposition in a fan head position (Figure 8-2). The most economically important and laterally persistent reefs in the Central Rand Group occur immediately above unconformable formation boundaries. Furthermore, the two most economically significant reefs in younger strata also occur immediately above major unconformities, at the base of the Ventersdorp and Transvaal super groups, respectively (Figure 7-2 and Figure 8-2). Along the northern, western and southwestern margins of the Witwatersrand Basin auriferous reefs in the upper Central Rand Group were deformed and locally exhumed during late- to post-central Rand Group compressional deformation. The thin Venterspost (Conglomerate) Formation at the base of the Ventersdorp Supergroup was deposited over wide areas across the post-central Rand Group unconformity surface. In the north, west and southwest of the basin, the Venterspost Conglomerate hosts the 4t Au Ventersdorp Contact Reef (VCR, Figure 7-2 and Figure 8-2) at its base. However, in the southernmost Welkom goldfield (Fig. 23), where the Venterspost Formation rests para-conformably on the Central Rand Group, the Ventersdorp Contact Reef is not 55 39RZ4A
119 developed (see also Figure 8-2). Frimmel et al. (25) interpret this to reflect the lack of an immediate detrital gold source (i.e. eroded reefs in the Witwatersrand Supergroup) in the southern-most part of the basin. Gold grains preserving definitive detrital morphologies (e.g. smooth abraded surfaces and folded grain edges) are rare in the Witwatersrand Basin (Frimmel et al., 25). The paucity of such grains has been interpreted to indicate either () small-scale remobilisation and/or recrystallization of detrital gold during metamorphism (e.g. Frimmel et al., 25) or (2) evidence that Au enrichment of the reefs was not solely (or principally) due to detrital inputs (see below) O T H ER M OD EL S F OR T H E W I T W AT E R SR AN D D E PO SI T S The other postulated models for the Witwatersrand are the; a) Hydrothermal model as evidenced from the presence of gold in post depositional sites such as; () inter-granular fractures, (2) concentrations in metamorphic/hydrothermal minerals, (3) linings to corrosion pits in detrital and metamorphic/hydrothermal mineral grains and (4) in thin seams of carbonaceous matter interpreted to be remnants of migrated hydrocarbons (Phillips and Law, 994, 25; Barnicoat et al., 997), and the presence of metamorphic mineral assemblages. While there is now general acceptance that, at least on the grain-scale, significant mobilisation of gold occurred during metamorphism and/or hydrothermal alteration, erosional truncation of reefs in the Central Rand Group defies all but a syn-sedimentary origin (Frimmel et al., 25; Mossman et al., 28). b) The microbially-mediated gold precipitation model The presence of the carbonaceous matter or carbon leader material in the reefs is foremost in the genesis of this model, suggesting that this material was derived from microbial or algal mats that assisted in the stabilisation of the palaeosurfaces and also played an important part in the entrapment and concentration of gold particles. Some carbon seams preserve minute tubules or filaments of carbon oriented perpendicular to bedding. These locally encapsulate small detrital sand grains and in some cases are intricately intergrown with fine grained gold (Hallbauer, 975a, b; Mossman, 28). For further reading about these models the author would direct the reader to the papers mentioned above and in the references section of this report RZ4A


120 Figure 8-: Distribution of goldfields around the margin of the Witwatersrand Basin from Scott (2) 57 39RZ4A
 goldfield (see Figure 8- for")
 and")
121 Figure 8-2: Sections through (fan head) stacked reef complexes of Eldorado Fan Delta Sun-Target area, north of Free State (Welkom) goldfield (see Figure 8- for location). In top diagram, note contrasting lateral extents of VCR (base Ventersdorp) and VS5, Sun and Bird Reefs(lower Central Rand Group) from Scott (2) 58 39RZ4A
122 8.2 COMPARISONS WITH HAMERSLEY BASIN While not identical, there are strong similarities in the geological developments of the Witwatersrand Basin/Kaapvaal Craton and Hamersley Basin/Pilbara Craton (Figure 7-2). The Archaean granite-greenstone basement is similar in age and composition in both areas, although older greenstone sequences also occur in the east of the Pilbara Craton (Figure 7-2 and Figure 7-3). In both regions, the greenstone belts host numerous small mesothermal (shear-zone-hosted/lode-type) gold deposits formed prior to deposition of the Witwatersrand and Hamersley basin successions (e.g. Frimmel et al., 25; Huston et al., 22a). Previous workers (e.g. Nelson et al., 992, 999; Thorne and Trendall, 2) have noted strong similarities in the composition and tectonic setting of the Ventersdorp Supergroup (Witwatersrand Basin) and Fortescue group (Hamersley basin). Both sequences contain voluminous basaltic andesite lavas interspersed with terrestrial to shallow marine sedimentary rocks and lesser felsic volcanics and/or high-level intrusions. Although commonly described as continental flood basalts, the mafic lavas were more likely emplaced in continental rift settings (Thorne and Trendall, 2; Frimmel et al., 25). Although the Fortescue succession is up to 5m.y. older than the Ventersdorp Supergroup, both were both deposited after protracted depositional hiatuses (>m.y.), during which compressional deformation, metamorphism and exhumation of older rocks occurred. Additionally, deposition of the Fortescue Group and Ventersdorp Supergroup sequences were both followed by major marine transgression events, involving deposition of thick sequences of chemical sediments (carbonate, banded iron formation) and lesser marine clastics (i.e. Cluniespoort Group, Kaapvaal Craton and Hamersley Group, Pilbara Craton, Figure 7-2). For further reading on comparisons between the Witwatersrand deposit settings and the Pilbara deposits the author would direct the reader to the papers mentioned above and in the references section of this report RZ4A
123 9. EXPLORATION Novo has not conducted any exploration other than the reverse circulation and diamond drilling conducted in 2, 22 and 23 which is discussed in Section of this report. 6 39RZ4A
124 . DRILLING... NULLAGINE T Y PE AND E XT E N T From late 2 and into 22 Novo drilled 78 reverse circulation (RC) drill holes for a total of 6,663m. The purpose of this drilling was to improve the Resource definition of the narrow auriferous reefs in the Beatons Creek formation, particularly in the vicinity of Grant s Hill, Golden Crown or Dean s Hill and Ronkies Reef. All drilling was completed by Orbit drilling Ltd with a Hydco 35 DR4 Rig in 2 and McKay drilling Ltd with a Schramm T685W rig in 22. All holes drilled were RC drilled with 5.5 bit for the first (collar) section in the regolith zone, and then by 5.25 bit. All samples were taken at.m intervals down the hole, although 4m composites were initially taken with a spear to determine where more definition was required. In 23 Novo completed eight PQ size diamond drill holes for an aggregated length of 475m for the purposes of metallurgical, geotechnical and density test work respectively; these twinned some of the RC holes. Novo s geologist s reported that core recoveries were good, although only the density data is material for the purposes of this report. None of these holes were used for the estimate. The 2/2 drilling is summarised in Table - below. Table -: 2/2 RC Drilling Collars Hole ID GDA Easting GDA Northing GDA Elevation Depth (m) Azimuth Dip Target BCRC BCRC2* BCRC BCRC BCRC BCRC BCRC BCRC BCRC BCRC BCRC RZ4A
125 Hole ID GDA Easting GDA Northing GDA Elevation Depth (m) Azimuth Dip Target BCRC BCRC BCRC BCRC5* BCRC BCRC2* BCRC BCRC BCRC BCRC BCRC BCRC BCRC BCRC BCRC BCRC BCRC BCRC BCRC BCRC BCRC BCRC BCRC BCRC BCRC BCRC BCRC BCRC BCRC BCRC BCRC BCRC BCRC BCRC BCRC RZ4A
126 Hole ID GDA Easting GDA Northing GDA Elevation Depth (m) Azimuth Dip Target BCRC BCRC BCRC BCRC BCRC BCRC BCRC237* BCRC BCRC BCRC BCRC BCRC BCRC BCRC BCRC BCRC BCRC BCRC BCRC BCRC BCRC BCRC BCRC BCRC BCRC254A BCRC BCRC BCRC BCRC BCRC BCRC BCRC BCRC BCRC BCRC RZ4A
127 Hole ID GDA Easting GDA Northing GDA Elevation Depth (m) Azimuth Dip Target BCRC BCRC BCRC BCRC BCRC BCRC BCRC BCRC BCRC BCRC BCRC BCRC BCRC BCRC BCRC BCRC BCRC BCRC BCRC BCRC BCRC BCRC BCRC BCRC BCRC BCRC BCRC BCRC BCRC BCRC BCRC BCRC BCRC BCRC BCRC RZ4A
128 Hole ID GDA Easting GDA Northing GDA Elevation Depth (m) Azimuth Dip Target BCRC BCRC BCRC BCRC BCRC BCRC BCRC BCRC27* BCRC BCRC BCRC BCRC2* BCRC BCRC BCRC BCRC BCRC BCRC BCRC BCRC BCRC BCRC BCRC BCRC BCRC BCRC BCRC226* BCRC BCRC BCRC BCRC BCRC BCRC232* BCRC BCRC RZ4A
129 Hole ID GDA Easting GDA Northing GDA Elevation Depth (m) Azimuth Dip Target GCRC Golden Crown GCRC Golden Crown GCRC Golden Crown GCRC Golden Crown GCRC Golden Crown GCRC Golden Crown GCRC Golden Crown GCRC Golden Crown GCRC Golden Crown GCRC Golden Crown GCRC Golden Crown GCRC Golden Crown GCRC Golden Crown GCRC Golden Crown GCRC Golden Crown GCRC Golden Crown GCRC Golden Crown GCRC Golden Crown GCRC Golden Crown RRRC Ronkies Reef RRRC Ronkies Reef RRRC Ronkies Reef RRRC Ronkies Reef RRRC Ronkies Reef RRRC Ronkies Reef RRRC Ronkies Reef RRRC Ronkies Reef Note: Denotes holes that were twinned by PQ Diamond drill holes in D R I L L C OL L AR S The procedure used by Novo for surveying drill collars has been consistent throughout all of their campaigns. All collar coordinates are with reference to the MGA94_5 Grid Datum which is consistently used throughout Australia when a mine grid has not been established, which is the case at this property. Hence all holes are set out using a hand-held GPS device by the Novo field staff, or by using a suitable measure and a compass from a known and surveyed collar position RZ4A
130 The azimuths are usually set out using a compass and flagging tape/pickets for the rig to line up with as foresights and backsights. The dip is then set by the driller using a clinometer, and all this is usually confirmed by the Geologist or Field staff onsite at the time to ensure quality control is maintained. Ultimately all collars have been re-surveyed by Survey Group, a contract surveyor from Osborne Park in Perth, with a differential GPS (DGPS) device, at various stages during the campaign...3 D O WN H O L E S U R VE Y S Due to the vertical nature of the drill holes down-hole surveys were not collected during 2 or 22. The average hole length was about 94m, and the longest hole was 234m. This is not a particularly good practice and Tetra Tech recommends that downhole surveys be collected for all future drilling, and if possible conduct gyroscopic surveys of the current holes particularly the ones greater than about m in length...4 G E OL O GI C AL L O GG I N G All logging was done by a Professional Geologist familiar with the project onsite who closely monitored the drilling and sampling procedures. Geological logs were recorded directly onto paper logging sheets. This information was then transcribed into digital format by the Novo data entry staff. The drill logs recorded major lithological units, alteration, oxidation, some minor structure, mineralisation, veining, textures and minor lithological units as well and the sample intervals. The chips were usually logged next to the collar site from wet sieved chips collected in the chip trays...5 D R I L L H OL E C AS I N G All collar casings are left in the ground with a plug in each stating hole name, coordinates and orientation, there is often a wooden stake with the above information next each collar point too, for ease of identification at a later time (Figure -). Collars are also plugged to prevent local fauna from becoming trapped in them RZ4A
.")
131 Figure -:..6 Collar Point at Beatons Creek 2/2 RC D R I L L I N G R ESU L T S Drilling continued to establish continuity between past mineralised intercepts on the mineralisation trends. Low to high grade mineralisation ranging from ~.5g/t to ~74g/t was encountered over some wide intersections ranging up to about 36m in length (down-hole). In some holes, multiple wide low-high grade zones were encountered (Table -2, LW in this table refers to LeachWELL assays). Table -2: 2/2 RC Drilling Results as at 4 February 23 Hole From (Meters) To (Meters) Length (Meters) Gold(LW) (ppm) BCRC BCRC BCRC-2 BCRC-3 BCRC-4 BCRC RZ4A
132 Hole BCRC-8 From (Meters) To (Meters) Length (Meters) Gold(LW) (ppm) BCRC BCRC BCRC-9 BCRC- BCRC- BCRC-2 BCRC-3 BCRC-4 BCRC BCRC BCRC BCRC2-4 BCRC2-5 BCRC RZ4A
133 Hole From (Meters) To (Meters) Length (Meters) Gold(LW) (ppm) BCRC BCRC BCRC BCRC BCRC BCRC BCRC BCRC BCRC BCRC BCRC BCRC BCRC BCRC2-26 BCRC BCRC BCRC BCRC2 3 BCRC RZ4A
134 Hole BCRC2 35 BCRC2 36 From (Meters) To (Meters) Length (Meters) Gold(LW) (ppm) BCRC BCRC BCRC2 37 BCRC BCRC BCRC BCRC BCRC2 42 BCRC2 48 BCRC2 49 BCRC RZ4A
135 Hole From (Meters) To (Meters) Length (Meters) Gold(LW) (ppm) BCRC BCRC BCRC2 55 BCRC BCRC BCRC BCRC2 59 BCRC BCRC BCRC BCRC RZ4A
136 Hole BCRC2 64 BCRC2 65 BCRC2 66 BCRC2 67 BCRC2 69 BCRC2 7 BCRC2 7 From (Meters) To (Meters) Length (Meters) Gold(LW) (ppm) BCRC BCRC BCRC2 72 BCRC2 73 BCRC RZ4A
137 Hole BCRC2 77 BCRC2 78 BCRC2 79 BCRC2 8 BCRC2 8 BCRC2-82 BCRC2-83 BCRC2-84 BCRC2-85 BCRC2-86 From (Meters) To (Meters) Length (Meters) Gold(LW) (ppm) BCRC BCRC BCRC2-87 BCRC RZ4A
138 Hole BCRC2-94 BCRC2-95 BCRC2-96 BCRC2-97 BCRC2-98 BCRC2-99 From (Meters) To (Meters) Length (Meters) Gold(LW) (ppm) BCRC BCRC BCRC2- BCRC2- BCRC RZ4A
139 Hole BCRC2-8 BCRC2-9 From (Meters) To (Meters) Length (Meters) Gold(LW) (ppm) BCRC BCRC BCRC BCRC BCRC BCRC BCRC2- BCRC2- BCRC2-2 BCRC2-23 BCRC2-24 BCRC2-25 BCRC RZ4A
140 Hole BCRC2-27 From (Meters) To (Meters) Length (Meters) Gold(LW) (ppm) BCRC BCRC BCRC2-28 BCRC2-29 BCRC GCRC GCRC GCRC GCRC GCRC GCRC GCRC GCRC BCRC2-36 GCRC RZ4A
141 Hole..7 From (Meters) To (Meters) Length (Meters) Gold(LW) (ppm) GCRC GCRC GCRC RRRC S AM PL I N G M ET H OD The following summary description of sampling methods employed by Novo is from information provided by Novo s Senior Geologist to Tetra Tech: RC chips are collected at regular m intervals via a cyclone and fixed conesplitter arrangement attached to the side of the rig. This arrangement is aircleaned on a regular basis by the drill crew to limit cross sample contamination. This is closely monitored by the qualified logging geologist. Samples are collected into 3 parts, the bulk part is collected in green plastic bags and the other two parts are collected in pre-numbered calico bags, one of which is the primary sample and the other a field duplicate for QA/QC purposes. Duplicates were collected at a rate of about in 2 for most of the holes drilled. For all holes up to and BCRC2-28 (excluding BCRC2-22) 4m composites were created by spear sampling for preliminary assay test work, after this hole; this method was abandoned in favour of assaying all the m samples instead. All logging of the RC chips was done using wet sieving techniques and samples of each interval are retained in chipping trays which are stored on site. All logging was done by a professional geologist familiar with the project onsite who closely monitored the drilling and sampling procedures. Geological logs were recorded directly onto paper logging sheets. This information was then transcribed into digital format by the Novo data entry staff. All relevant items such as interval, lithology s, structure, texture, grain-size, alteration, oxidation, mineralisation, quartz percentage and sulphide types and percentages are recorded in the geological logs. The primary samples (calico bags) are collected into polywoven bags and all bags are sealed by either draw-strings or cable ties. These are then 78 39RZ4A
142 transported by road and submitted to the Intertek-Genalysis Laboratory in Perth for sample preparation and analysis...8 QA/QC samples are inserted at regular intervals into the sample stream (see Section. Sample Preparation, Analyses and Security for details). DRILL PLAN - NULLAGINE Figure -2 and Figure -3 provides the locations of Novo drill holes that were drilled between 2 and RZ4A
 8")
143 Figure -2: Collar Plan for Beatons Creek Area (Provided by Novo Resources) 8 39RZ4A
 8")
144 Figure -3: Collar Plan for the Golden Crown holes Area (Provided by Novo Resources) 8 39RZ4A
145 . SAMPLE PREPARATION, ANALYSES, AND SECURITY. SAMPLE PREPARATION The sealed poly-weave bags containing the sealed samples in calico bags are submitted after transportation from site to the Genalysis Laboratory in Perth. This method sufficiently reduces the possibility of any sample tampering. Genalysis is an accredited facility, conforming to the standards listed below: The ISO/IEC 725 accreditation ensures international standards are maintained in the laboratories procedures, methodology, validation, QA/QC, reporting and record keeping. National Association of Testing Authorities Australia (NATA) has accredited Genalysis Laboratory Services Pty Ltd, following demonstration of its technical competence, to operate in accordance with ISO/IEC 725 which includes the management requirements of ISO9:2. This facility is accredited in the field of Chemical Testing for the tests, calibrations and measurements shown in the Scope of Accreditation issued by NATA (Accreditation No. 3244). Genalysis also participates in a number of regular international, national and internal proficiency round robins and client specific proficiency programs. Samples received by lab are processed using the following sample preparation packages: Samples are sorted and weighed (Record and report weights). Standard preparation dry. Crush the original ~kg sample to about -2mm. Pulverize (~3 kilograms (kg)) in a Mixer mill to 9% passing 75µm. A wet sieve is performed to confirm the grind size. Riffle Split pulp of 3kg down to a kg charge for LeachWELL analysis RZ4A
146 Pulps stored for QA in lab pulp storage area for repeat analysis. Pulp and residues are stored at the lab facility. Initial 4m composites were split down to 5g charges for Fire Assay analyses for determination of where the m samples should be taken. All sample pulps, laboratory-inserted Standards, are then assayed by the same laboratory stated above SAMPLE ANALYSES N U L L A GI N E PR O P ER T Y The gold assay methodology uses a standard LeachWELL with AAS finish technique on a kg aliquot taken from the 3kg split of the original samples. Samples pulps are re-assayed by the lab at the discretion of the laboratories QC officer when assay results look out of the ordinary, for example a 5 ppb Au in a sequence of < ppb would be re-analysed. The Au2 repeat is due when there is a significant difference between Au and Au. All batches, regardless of size, have a minimum of one Laboratory Standard, and pulp check inserted, however they are usually inserted at a rate of about in 3 for standards and in 2 for pulp checks. Altogether during the 2/2 drill campaign at Nullagine, a total of 5,78 samples were submitted for gold analysis; 4,634 samples were assayed by LeachWELL (kg) with atomic absorption spectroscopy (AAS) finish and 544 samples by Fire Assay (5g) with AAS finish, this includes some 4m composites of non-mineralised zones. Some samples were also re-assayed by Fire Assay (5g) and Screen Fire assays (kg) for comparison purposes. At no time was a Novo employee or designate involved in the preparation or analysis of the samples..3 NOVO QA/QC PROGRAM (NULLAGINE PROPERTY). Novo s Quality Assurance/Quality Control (QA/QC) programs consisted of the insertion of Laboratory Reference Material (LRM) samples by Genalysis into the sample stream at regular intervals; these are LW, LW3 and LW5 for the LeachWELL samples. Standard reference materials (SRM) were also inserted by Genalysis at regular intervals where Fire Assays were being conducted; these are OREAS5f, OREAS5a and OREAS52a. SRM s OxC88, OxG84, Oxi96 and OxP9 were inserted by Genalysis when Screen Fire Assays were being conducted RZ4A
147 Novo inserted field duplicates at a rate of about in 2. In addition to the fieldinserted QA/QC program, the laboratory operates an internal QA/QC system, which involves duplication of samples (check samples) at a rate of about in 2. Novo did not monitor grind checks as part of its QA/QC regime. The results of the various QA/QC samples are examined further below..3. L AB OR AT OR Y S T AN D AR D LW For the 4 analyses of the laboratory (LeachWELL ) standard labelled LW, an average value of.967ppm was returned with only one analysis occurring outside the Lower Confidence Limit (LCL) as shown in Figure -; however the magnitude of this failure is not of concern. Some variation is evident but it is within acceptable tolerances. Figure -:.3.2 LW Performance Chart L AB OR AT OR Y S T AN D AR D LW3 For the 96 analyses of the laboratory (LeachWELL ) standard labelled LW3, an average value of 2.9ppm was returned with only analyses occurring outside the Upper or Lower Confidence Limits as shown in Figure -2. The magnitude of these failures is low and even though some variation is evident, it is within acceptable tolerances RZ4A
148 Figure -2:.3.3 LW3 Performance Chart L AB OR AT OR Y S T AN D AR D LW5 For the 87 analyses of the laboratory (LeachWELL ) standard labelled LW5, an average value of 5.5ppm was returned with 7 analyses occurring outside the Upper or Lower Confidence Limits as shown in Figure -3. The magnitude of these failures is not of concern and while there is some variance in the data, it is generally within acceptable tolerances RZ4A
149 Figure -3:.3.4 LW5 Performance Chart L OW -G R AD E F I R E A S SA Y S T AN D AR D OREAS5 F This low-grade SRM OREAS5f has an accepted value of.334g/t with a between lab s 95th confidence of.8g/t. The mean grade of the QA/QC samples submitted was.38g/t, just slightly lower than the accepted value and just outside the confidence level set for between labs. There were no failures within the QA/QC sample suite submitted (Figure -4) RZ4A
150 Figure -4:.3.5 OREAS5f Performance Chart L OW G R AD E F I R E A SS A Y S T AN D AR D OREAS5 A This low grade SRM OREAS5a has an accepted value of 43ppb with a between lab s 95th confidence of ppb. The mean grade of the QA/QC samples submitted was 4.74ppb, just slightly lower than the accepted value and just outside the confidence level set for between labs. There were no failures within the QA/QC sample suite submitted (Figure -5) RZ4A
151 Figure -5:.3.6 OREAS5a Performance Chart L OW G R AD E F I R E A SS A Y S T AN D AR D OREAS52 A This low grade SRM OREAS52a has an accepted value of 6ppb with a between lab s 95th confidence of 2ppb. The mean grade of the QA/QC samples submitted was.246ppb, just slightly lower than the accepted value and just outside the confidence level set for between labs. There were four failures within the QA/QC sample suite submitted. The magnitude of these failures is not of concern and while there is some variance in the data, it is generally within acceptable tolerances..3.7 L OW G R AD E (S C R EEN ) F I R E A S S AY S T AN D AR D O X C88 This low grade SRM OxC88 has an accepted value of.23ppm with a between lab s 95th confidence of.3ppm. The mean grade of the QA/QC samples submitted was.2ppm, just slightly lower than the accepted value and just within the confidence level set for between labs. There were no failures within the QA/QC sample suite submitted (Figure -6) RZ4A
152 Figure -6:.3.8 OxC88 Performance Chart M OD E R AT E G R AD E (S C R EEN ) F I R E A S SA Y S T AN D AR D O X G84 This moderate grade SRM OxG84 has an accepted value of.922ppm with a between lab s 95th confidence of.ppm. The mean grade of the QA/QC samples submitted was.896ppm, just slightly lower than the accepted value and just outside the confidence level set for between labs. There was one failure within the QA/QC sample suite submitted (Figure -7). The magnitude of this failure is not of concern and while there is some variance in the data, it is generally within acceptable tolerances RZ4A
153 Figure -7:.3.9 OxG84 Performance Chart M OD E R AT E G R AD E (S C R EEN ) F I R E A S SA Y S T AN D AR D O X I 96 This moderate grade SRM Oxi96 has an accepted value of.82ppm with a between lab s 95th confidence of.2ppm. The mean grade of the QA/QC samples submitted was.788ppm, just slightly lower than the accepted value and just outside the confidence level set for between labs. There were no failures within the QA/QC sample suite submitted (Figure -8). 9 39RZ4A
154 Figure -8:.3. Oxi96 Performance Chart H I GH G R A D E (S C R E EN ) F I R E A SS A Y S T AN D AR D O X P9 This moderate grade SRM Oxi96 has an accepted value of 4.82ppm with a between lab s 95th confidence of.ppm. The mean grade of the QA/QC samples submitted was 4.622ppm, just slightly lower than the accepted value and just outside the confidence level set for between labs. There were no failures within the QA/QC sample suite submitted (Figure -9). 9 39RZ4A
155 Figure -9:.3. OxP9 Performance Chart N O V O L EA C H WELL F I E L D D U P L I C AT ES During the 2/2 campaign Novo collect approximately 55 field duplicate samples at the time of drilling with a dual cone splitter attached to the drill rig. Two, approximately kg, samples were collected in separate calico bags per 2m of drilling. The results of the LeachWELL duplicate samples analyses showed a correlation coefficient of ~ 93%. This result shows extremely good duplication of results considering that material from the drill rig is coarse and significant variation in duplicate samples would be ordinarily be expected. Figure - illustrates this in more detail. Tetra Tech has reviewed the data using relative differences (RD) where: RD = (A-A2) / (A+A2) expressed as a percentage. This is the equivalent of the difference of each value from their mean divided by their mean which is a measurement of the error relatively independent of the grade. An estimate of precision at a specific confidence level can be derived from the mean of these relative differences. Analysis of the duplicates shows that sampling and assaying repeatability (precision) is relatively stable particularly for grades >.g/t, and not so good for grades <.g/t, this is illustrated in Figure - and Table - below. The calculated precision for 92 39RZ4A
156 grades >.g/t and <.5g/t is 94% which is certainly reasonable for a gold deposit such as this. The precision increases to 4% for grades >.5g/t. Figure -: LeachWELL Analyses of Field Duplicates Table -: Bin Range (ppm Au) All pairs..5 >.5 Analysis of Novo 2/2 Field Duplicates No. of Pairs Mean of Rel Diffs % 6% -% St Dev of Rel Diffs 36% 4% 49% Precision at 9% conf. +/-83% +/-94% +/-4% 39RZ4A
157 .3.2 G EN AL YS I S I N T ER N AL C H EC K S AM PL ES F OR L EA C H WELL D AT A All samples were analysed by Genalysis-Intertek laboratories in Perth, a fully accredited facility. The laboratory conducted repeat analyses on approximately 662 samples, that in addition to the field duplicates account for ~ 8% of the LeachWELL assay dataset as a whole. The results for these analyses were again very encouraging with a correlation coefficient of about 95% and an R² of about 9%. This result also gives a great deal of comfort as to the veracity of the LeachWELL assay data in terms of repeatability of samples. Figure - illustrates this in more detail. Analysis via Relative Differences (as per Section.3.) of the repeats shows that sampling and assaying repeatability (precision) is relatively stable particularly for grades >.g/t, and not so good for grades <.g/t, this is illustrated in Figure - and Table -2 below. The calculated precision for grades >.g/t and <.5g/t is 66% which is certainly reasonable for a gold deposit such as this. The precision increases to 67% for grades >.5g/t. Figure -: LeachWELL Laboratory Repeats Plot 94 39RZ4A
158 Table -2: Analysis of Genalysis 2/2 LeachWELL Repeats Bin Range (ppm Au) All pairs..5 > No. of Pairs Mean of Rel Diffs 4% % 4% G EN AL YS I S I N T ER N AL C H EC K S AM PL ES F OR St Dev of Rel Diffs 27% 28% 29% Precision at 9% conf. +/-63% +/-66% +/-67% F I R E A S SA Y D AT A All samples were analysed by Genalysis-Intertek laboratories in Perth, a fully accredited facility. The laboratory conducted repeat analyses on approximately 5 samples. The results for these analyses were again very encouraging with a correlation coefficient of about 99.9% and an R² of about 99.82%. Figure -2 illustrates this in more detail. Analysis via Relative Differences (as per Section.3.) of the repeats shows that sampling and assaying repeatability (precision) is relatively stable particularly for grades >.g/t, and not so good for grades <.g/t, this is illustrated in Figure -2 and below. The calculated precision for grades >.g/t and <.5g/t is 64% which is certainly reasonable for a gold deposit such as this. The precision increases to 37% for grades >.5g/t. Figure -2: Fire Assay Laboratory Repeats Plot 95 39RZ4A
159 Table -3: Bin Range (ppm Au) All pairs..5 >.5.4 QUALIFIED Analysis of Genalysis 2/2 Fire Assay Repeats No. of Pairs PERSON S Mean of Rel Diffs -.4% 6% 2% St Dev of Rel Diffs 36% 28% 59% Precision at 9% conf. +/-83% +/-64% +/-37% OPINION The author is satisfied that the sample preparation, security and analytical procedures are adequate for the purposes of this report. Despite some minor variability outside the standard limits, Tetra Tech is satisfied that there is no significant bias in the laboratory analyses for LeachWELL, Fire Assay and Screen Fire Assay Analyses. More discussion on the veracity of the LeachWELL data can be found in Section 2. Observations made on the site visit on the 22 January suggest that sampling methods and recoveries are adequate to support a resource estimate RZ4A
160 2. DATA VERIFICATION Tetra Tech carried out several internal validations of RC drill holes data files against the original drill logs and assay certificates. The Assay file was filtered for all Novo BCRC* holes, GCRC* holes and RRRC* holes where Au ppm was greater than.3g/t, only these holes were checked because they were the only holes that had assay certificates available for checking. There were,823 gold assay records available after the filter was applied and the certificate data agreed % with the digital data file. This equates to about 2% of the dataset as a whole, excluding the historical data for which there was no verification data available at all. Approximately 8 of the drill logs were verified with the database as well, and there was a % match between these records too, this equates to about % of the dataset. Data verification was completed on collar co-ordinates, end-of-hole depths, downhole survey measurements, from and to intervals, measurements of assay sampling intervals, and gold grades. No errors were identified in the collar, assay or lithology files. When the assay data file was imported into VULCAN 8..4, which has its own error checking routines for overlapping intervals, and intervals beyond the end of hole, there were no overlapping interval errors found in the dataset. Tetra Tech confirmed the locations of 2 surface drillhole collars during the site visit. Tetra Tech collected the collar locations using a Garmin GPS 6 handheld GPS unit. Table 2- displays the results of the collar validation. The accepted error for the Garmin 6 GPS is typically +/- 5m range. None of the holes collar coordinates differed by more than fifteen (5) meters. The biggest differences were primarily in a RL direction. Although the hand-held GPS is not deemed to be truly accurate, it is recommended that Novo continue to have all new collars accurately surveyed on a regular basis to verify their locations. No check samples were taken during the site visit. The Project is an advanced exploration property, explored by a number of operators, and check sampling was deemed unnecessary. However during the site visit a number of mineralised zones were noted in outcrops and historical adits (Figure 2- and Figure 2-2); with noteworthy occurrences of so-called buck-shot pyrite (Figure 2-3) and also carbonaceous material in the Beatons Creek formation RZ4A
; located at")

161 Figure 2-: Historical Adit in the Beatons Creek Formation The mineralised horizon is just below the geopick (for scale); located at MGA94 grid coordinates 99,848mE, 7,577,648mN and 46mRL Figure 2-2: Unconformity mineralised horizon with nearby Adit, with Notebook for scale 98 39RZ4A

162 Figure 2-3: Remnant buckshot pyrite voids in mineralised specimen Table 2-: Drill Collar Checks Hole ID GDA E GDA N GDA RL 4.78 Garmin E 26 Garmin N Garmin RL 44 BCRC BCRC BCRC BCRC BCRC BCRC BCRC BCRC BCRC BCRC BCRC BCRC Net Diff 39RZ4A
163 2. LEACHWELL ASSAY METHODS VALIDATION Analyses of 276 samples were conducted by all three methods for comparison of LeachWELL with screen fire and fire assay. The correlation coefficient for LeachWELL and screen fire assay data was 5%, while the LeachWELL and fire assay data had a correlation coefficient of about 39% for the purposes of comparison, the correlation coefficient between screen fire and fire assay was also calculated at 5%. This poor correlation between methods is to be expected as there is a large difference in sample volumes and recoveries. In order to compare the different methods, Q-Q (quantile-quantile) plots were generated for the histograms of the populations of LeachWELL data against the distributions of screen fire and fire assay data. Figure 2-4 shows the populations of 565 samples that were sent for LeachWELL and screen fire assay plotted against each other with a coefficient of determination (R²) of 98.4%. This indicates that the assay methods are sampling the same population even taking sample volume variance effects into account. Figure 2-5 shows the populations of 276 samples that were sent for LeachWELL and fire assay plotted against each other with a coefficient of determination (R²) of 98.3%. This indicates that the assay methods are sampling the same population even taking sample volume variance effects into account. The sample sizes for LeachWELL and screen fire assays are kg while the fire assays are conducted on a 5 g sample. 2.2 QUALIFIED PERSON S OPINION No limitations were placed on the data verification of the property either on site, or with respect to the dataset. Based on the verification of the dataset, the current author considers the dataset adequate for the purposes used in this technical report. 39RZ4A


")
")
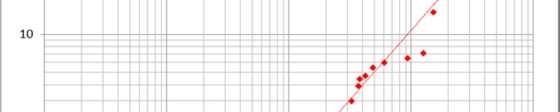
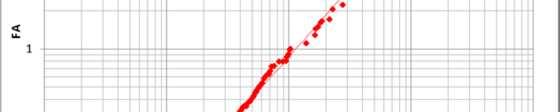
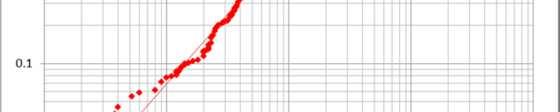
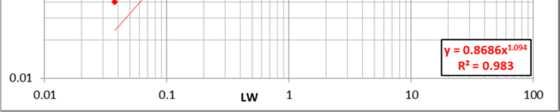
164 Figure 2-4: QQ plot for LeachWELL vs. Screen Fire Assay data (n=565) Figure 2-5: QQ plot for LeachWELL vs. Fire Assay data (n=276) 39RZ4A
165 3. MINERAL PROCESSING AND METALLURGICAL TESTING In 23 Novo drilled 8 PQ diamond drill holes (Figure 3-) at Beatons Creek for the purposes of metallurgical, geotechnical and density test work investigations, this work is currently in progress with results expected to be published in conjunction with an NI43- Preliminary Economic assessment (PEA) later in 23 or early RZ4A


166 Figure 3-: Collar Plan Showing Locations of Test Work Diamond Holes 3 39RZ4A
167 4. MINERAL RESOURCE ESTIMATES TETRA TECH 23 RESOURCE ESTIMATE D AT AB A SE Novo maintains all drill-hole data in a SQL Server based DDHTool database. The collars, survey, lithology, and assays tables were exported to CSV format and transferred to Tetra Tech. The original CSV files were created on the 3 January 23, with final updates received on the 3 March 23. The project has been drilled by a total of 7 RC drill holes. However only 49 of the drill holes are within the area of interest and had enough exploration potential to be included in this resource estimate. All resource estimations were conducted using Vulcan Version Table 4- summarises the number of drill holes used in the resource estimation for each domain. Table 4-: Drill Data Set Project Total # of holes Beatons Creek D 98 Beatons Creek D2 33 Beatons Creek D3 8 S PEC I F I C G R AV I T Y A total of 8 samples were tested by Intertek Genalysis laboratory for Specific Gravity (SG) from a total 8 diamond drill holes, all of these samples were coincident with mineralized intervals used in the resource estimation process. Fifty-two samples came from the Fresh rock zone, seven from the Transitional zone and 2 from the Oxide zone. Table 4-2 summarises the SG data from the Novo database. Tetra Tech applied an SG factor of 2.75 for the Fresh zone, 2.52 for the Transitional zone and 2.4 for the Oxide zone for the mineral resource estimate. Standard immersion methods were used to determine all SG s for the Property. Tetra Tech would recommend that Novo continue to collect SG measurements from the weathering zones and various rock types in order to extend their existing dataset. To date Novo has a dataset of 8 samples that are coincident with mineralised zones, this equates to about 6% of the mineralised zone samples. At a minimum, 2% of the dataset should have an SG measurement. This would mean that Novo s current SG dataset should have a minimum of 25 samples. 4 39RZ4A
168 Table 4-2: Specific Gravity Data Set Summary Domain 4..3 Totals SG in Estimate Oxide Trans Fresh No SG Samples 8 E XP L OR AT OR Y D AT A A N AL YS I S A S SA YS The three domains, which are part of the Mineral Resource, were sampled by a total of,276 assays (Table 4-3). Complete assay information was provided for gold. Table 4-3: DDH Assay Statistics Zone Field Beatons Creek D AU N Samples 97 Beatons Creek D2 AU Beatons Creek D3 AU Min Max Mean Std Dev G R A D E C A P PI N G Raw Assay Data was examined to assess the amount of metal that is at risk from high-grade assays. Histograms and log-probability plots were generated with the raw data per domain and the disintegration method applied to determine what top cut should be applied to each domain. Given the nuggety nature of the gold at this project it was decided that a threshold method of restricting the higher-grade assays searches be applied based on the nominal capping value. A search equal to half the determined variogram ranges was applied to the restricted searches. Table 4-4 shows a summary of the capping thresholds applied to the three domains in the dataset, no capping was deemed required for domain three. Table 4-4: Grade Capping by Threshold Summary 97 # Threshold Samples Threshold Grade (g/t) 2 Threshold Grade Range (g/t) %> Threshold.% Beatons Creek D % Beatons Creek D % Zone # Sample Beatons Creek D 5 39RZ4A
169 C O M P O SI T E S Gold assay data were composited at m downhole intervals honouring the interpreted geological solids. A m composite length was selected as a majority of the assays are in the m range for length, and it corresponds to approximately a fifth of the cell size to be used in the modelling process. Table 4-5 summarises the statistics of the drill holes after compositing. The sample data was also declustered for comparisons with the block estimates, and these statistics are also summarised in Table 4-6. Table 4-5: Zone Field Beatons Creek D AU N Samples 97 Beatons Creek D2 AU Beatons Creek D3 AU Table 4-6: 4..4 DDH Composite Statistics Min Max Mean Std Dev Max Mean Std Dev. Declustered DDH Composite Statistics Zone Field Beatons Creek D AU N Samples Beatons Creek D2 AU Beatons Creek D3 AU Min G E OL O GI C AL I N T ER PR ET AT I ON Three-dimensional wireframe models of the mineralization were developed for the 23 zones based on an Au cut-off of greater than.3g/t and a minimum of 2m vertical width, given the flat dipping nature of the reefs. Weathering zones and Bedrock subsurfaces were also created using information based on data provided in the geological logging part of the drill-hole database. Sectional interpretations; generally by the point methodology, where hanging-wall and foot-wall points for the same horizons were digitized in Vulcan 8..4 software, and these interpretations were then triangulated using the in-built Vulcan triangulation algorithm to build three dimensional solids. Table 4-7 tabulates the solids and associated volumes. The solids were validated in Vulcan and no errors were found. 6 39RZ4A
170 The zones of mineralisation interpreted for each area were generally contiguous; however, due to the nature of the mineralisation there are portions of the wireframes that have grades less than.3g/t, yet are still within the mineralising trend. The non-assayed intervals were assigned a value of -99, and these were ignored during the compositing routine so they would not be used during the estimations. The Author believes that non-assayed material should not be assigned a zero value as this does not reflect the true value of the material. Table 4-7: Wireframe Statistics Wireframe Dimensions Minimum X Maximum X Minimum Y Maximum Y Minimum Z Maximum Z Volume (m ) bc_min_new_final.t ,3,9.89 bc_min2_new_final.t ,952.4 bc_min3_new_final.t ,55.87 bc_min4_new_final.t ,43.7 bc_min5_new_final.t ,44.26 bc_min6_new_final.t ,282.6 bc_min7_new_final.t ,27.39 bc_min8_new_final.t ,44.62 bc_min2_new_final.t , bc_min2_new_final.t ,58.88 bc_min22_new_final.t ,554.6 bc_min9_new_final.t ,9.4 bc_min_new_final.t , bc_min_new_final.t , bc_min2_new_final.t , bc_min3_new_final.t , bc_min4_new_final.t ,23.84 bc_min5_new_final.t ,332.5 bc_min6_new_final.t ,533.7 bc_min23_new_final.t , bc_min7_new_final.t ,699.3 bc_min8_new_final.t ,945.6 bc_min9_new_final.t , Beatons Creek D Beatons Creek D2 Beatons Creek D3 7 39RZ4A
171 4..5 S PAT I A L A N AL Y SI S Variography, using Vulcan version 8..3 software, was completed for gold for all three domains, where mineralised bodies were combined if they fell in the same domain. Downhole variograms were used to determine the nugget effect and then correlograms were modelled to determine spatial continuity in the domains. Table 4-8 Summarises results of the variography Table 4-8: ZONE Beatons Creek D Beatons Creek D2 Beatons Creek D Variography Results VDESC AZ PL DIP VAXIS VAXIS2 VAXIS3 NUGGET ST STIPAR STIPAR 2 STIPAR 3 AU MAJ SEMI MINOR AU MAJ SEMI MINOR AU 4 3 MAJ SEMI MINOR R E S OU R C E B L OC K M OD E L Individual block models were established in Vulcan for all 23 zones using one parent model as the origin. The model was not rotated. Drill-hole spacing varies with the majority of the drilling spaced at about 5m. A block size of 25 x 25 x 5m was selected in order to accommodate the more closely spaced drilling and the narrow nature of the mineralisation. Sub-celling of the block model on x xm spacing allows the parent block to be split 25, 25 and 5 time in each direction to more accurately fill the volume of the wireframes, and thus more accurately estimate the tonnes in the resource. Table 4-9 summarises details of the parent block model. Table 4-9: Parent Block Model Origin Cell Size Block Extents X Origin Y Origin Z Origin XINC YINC ZINC NX NY NZ Parent Sunblocks RZ4A
172 The interpolations for gold for the 23 zones were completed using the estimation methods: Nearest Neighbour (NN), Inverse Distance Squared (ID2) and Ordinary Kriging (OK). The estimations were designed for one pass. In the pass a minimum and maximum number of samples were required as well as a maximum number of samples from a borehole in order to satisfy the estimation criteria. Different search distances were also required to be satisfied based on the variography data. As mentioned previously in section 4..3, a threshold value was applied for the search parameters for domains and 2 respectively, where a restricted search equal to half the variogram range was applied to value above the nominally calculated capping value, which was 2g/t Au for domain one and g/t for domain two, no such restrictions were applied for domain three estimations. Quantitative Kriging Neighbourhood Analysis (QKNA) was used to determine and optimize; the minimum and maximum number of samples used per block estimate per domain, as well as the discretization values. Test models were estimated with Slope and Kriging Variance values closely monitored in order to determine which parameters lead to the most accurate estimation. Table 4-, Table 4- and Table 4-2 summarise the interpolation criteria for the 23 zones 9 39RZ4A
173 Table 4-: ZONE Beatons Creek D Beatons Creek D2 Beatons Creek D3 Est Estimation Criteria VALUE_ EREFNUM VALUE_IN NUMSAM_F NHOLES_F DISTAV_F SREFNUM IMETHOD POWER OK linf to l2inf AU AU_OK NSAMP_AU NHOLES_AU DIST_AV_AU to 2 OK N/A ID linf to l2inf AU AU_ID to 2 ID 2 NN linf to l2inf AU AU_NN to 2 NN OK l22inf to l3inf AU AU_OK 22 to 3 OK N/A ID l22inf to l3inf AU AU_ID 22 to 3 ID 2 NN l22inf to l3inf AU AU_NN 22 to 3 NN OK l3inf to l33inf AU AU_OK 3 to 33 OK N/A ID l3inf to l33inf AU AU_ID 3 to 33 ID 2 NN l3inf to l33inf AU AU_NN 3 to 33 NN Type OUT NSAMP_AU NHOLES_AU NSAMP_AU NHOLES_AU DIST_AV_AU DIST_AV_AU VREFNUM ugdbc_d_au_prm.vrg ugdbc_d2_au_prm.vrg ugdbc_d3_au_prm.vrg 39RZ4A
174 Table 4-: ZONE Beatons Creek D Beatons Creek D2 Beatons Creek D3 SREFNUM SMETHOD SDIST_MAJ SDIST2_SMAJ SDIST_MINOR SAZIMUTH SPLUNGE SDIP MIN SAMP linf to l2inf OK linf to l2inf ID linf to l2inf NN l22inf to l3inf OK l22inf to l3inf ID l22inf to l3inf NN l3inf to l33inf OK l3inf to l33inf ID l3inf to l33inf NN Table 4-2: ZONE Beatons Creek D Beatons Creek D2 Beatons Creek D3 Search Criteria MAX SAMP Search Criteria for Thresholds SREFNUM SMETHOD THRES_MAJ THRES_SMAJ THRES_MINOR Threshold Au linf to l2inf OK linf to l2inf ID linf to l2inf NN l22inf to l3inf OK l22inf to l3inf ID l22inf to l3inf NN l3inf to l33inf OK NA NA NA NA l3inf to l33inf ID NA NA NA NA l3inf to l33inf NN NA NA NA NA 39RZ4A MAX HOLES
175 4..7 R E S OU R C E C L AS SI F I C AT I ON Several factors are considered in the definition of a resource classification: National Instrument 43- requirements Canadian Institute of Mining, Metallurgy and Petroleum guidelines. Authors experience with Archean and Proterozoic gold deposits. Spatial continuity based on variography of the assays within the drill-holes. No environmental, permitting, legal, title, taxation, socio-economic, marketing or other relevant issues are known to the author that may affect the estimate of mineral resources. Mineral reserves can only be estimated on the basis of an economic evaluation that is used in a Preliminary Feasibility Study or a Feasibility Study of a mineral project; thus, no reserves have been estimated. As NI 43-, mineral resources, which are not mineral reserves, do not have to demonstrate economic viability M I N ER AL R ES OU R C E T AB U L AT I ON The resource reported as of May 23 has been tabulated in terms of a gold cut-off grade. The Mineral Resources for the three domains at the Beatons Creek Deposit are tabulated in Table 4-3 to Table 4-6 for the Inferred resources respectively. The resources are tabulated using various cut-off grades for gold up to an upper bound of greater than 3.g/t gold. Figure 4- illustrates the grade tonnage curve for the Beatons Creek deposit. The base case values are in bold. Table 4-3: Beatons Creek Domain (Grants Hill) Tonnes & Grade Resource Category INFERRED OK Cut-off Tonnes Au (g/t) Au (Oz).2 5,26, ,4.3 5,2, ,8.5 4,886, ,23.6 4,774, ,37.8 4,396, ,39. 4,5, ,52.5 2,659, ,33 2.,456, , , , , 4. 62, RZ4A
176 Table 4-4: Beatons Creek Domain 2 (Grants Hill) Tonnes & Grade Resource Category INFERRED Table 4-5: Tonnes Au (g/t) Au (Oz).2,639,9.34 7,65.3,639,9.34 7,65.5,65, ,4.6,525,2.4 68,64.8,67,82.6 6, , , , , , , , , , ,2 Beatons Creek Domain 3 (Golden Crown) Tonnes & Grade Resource Category INFERRED OK Cut-off OK Cut-off Tonnes Au (g/t) Au (Oz).2 2,397, ,6.3 2,397, ,6.5 2,396, ,58.6 2,39, ,56.8,53,3. 49,23. 6, ,6.5 6, RZ4A
177 Table 4-6: Beatons Creek Deposit Tonnes & Grade Resource Category OK Cut-off Tonnes Au (g/t) Au (Oz).2 9,63, ,25.3 9,57, ,96.5 8,899, ,6.6 8,68,7.5 45,6.8 7,95, ,97. 5,53, ,43.5 3,6, ,66 2.,647, , , , , ,6 INFERRED Figure 4-: Grade-Tonnage Curve for Beatons Creek Deposit Based on the results of similar gold projects in the Pilbara Goldfields of Western Australia, a.5g/t cut-off has been applied as the base-case cut-off, assuming an open-pit mining method (Table 4-7) the totals for the Inferred categories are tabulated below. This is based on the following parameters: 6: stripping ratio Operating cost of AUD 2./tonnes at,tpd Gold price of USD,39/troy oz 4 39RZ4A
178 USD to AUD conversion of.3 Gold Recovery of 9%. Table 4-7: Beatons Creek Resources as of May 23 Resource Category Domain Tonnes Au (g/t) Au (Oz) Beatons Creek D 4,886, ,23 Beatons Creek D2,65, ,4 Beatons Creek D3 2,396, ,58 Inferred 8,899, ,6 Note: OK cut-off. Figures may vary due to rounding Total 4..9 V AL I D AT I ON The Beatons Creek deposit gold grade models were validated by three methods: () Visual comparison of colour-coded block model grades with borehole grades on section and plan (2) Comparisons of the overall mean block grades for the ordinary kriging, inverse distance squared and nearest neighbour estimates and the declustered composites (3) Swath plots comparing OK grades with ID2 and NN estimates. V I SU A L C O M PA R I SO N The visual comparisons of block model grades with composite/borehole grades for each of the 23 zones show a reasonable correlation between the values. No significant discrepancies were apparent from the sections and plans reviewed, yet grade smoothing is apparent (Figure 4-2). 5 39RZ4A


 OK Tonnes OK Grade ID Tonnes ID Grade NN Tonnes NN Grade AU.75 5,26,495.728 5,26,495.")
179 Figure 4-2: Cross Section NW/SE section looking North East 99,9E (grid for scale) O VE R A L L S T A T I ST I C A L C O M P A R I S ON The global block model statistics for the ordinary kriging model were compared to the global inverse distance squared and nearest neighbour model values as well as the declustered composite drill-hole data. Table 4-8 shows this comparison of the mineral resource between the three interpolation methods. In general, there is agreement between the ordinary kriging model, the inverse distance squared model and the nearest neighbour model. Larger discrepancies are reflected as a result of lower drill density in some portions of the model. There is a degree of smoothing apparent when compared to the RC drilling statistics. Comparisons were made using all blocks at a g/t cut-off. Table 4-8: DH Composite (Declustered) OK Tonnes OK Grade ID Tonnes ID Grade NN Tonnes NN Grade AU.75 5,26, ,26, ,263, AU.69,639,9.34,639,9.393,648, AU.947 2,397, ,397, ,397,28.3 Domain Beatons Creek D Beatons Creek D2 Beatons Creek D3 Overall Mean Statistics 6 39RZ4A
Disclosures - IFFCO TOKIO General Insurance Co. Ltd. for the period 1st April, st December, 2018 S.No. Form No Description
 Disclosures - IFFCO TOKIO General Insurance Co. Ltd. for the period 1st April, 2018-31st December, 2018 S.No. Form No Description 1 NL-1-B-RA Revenue Account 2 NL-2-B-PL Profit & Loss Account 3 NL-3-B-BS
Summary of Main Checking Account
 December 31, 2014 Summary of Main Checking Account Cash In Cash Out Net Change Prior Month Current Pre-Paid Sub Total Current Pre-Paid Sub Total Current Pre-Paid Total Year October 34,667.52 20,265.00
Convergence with International Financial Reporting Standards: The Experience of Taiwan
 Convergence with International Financial Reporting Standards: The Experience of Taiwan Dr. Rong-Ruey Duh Chairman, Accounting Research and Development Foundation Professor, National Taiwan University 2006
The financial reports included in your board packet represent IHLS Financial Activities through July 31, 2018.
 Attachment 5.1 To: From: Date: RE: IHLS Board of Directors Adrienne L. Elam August 28, 2018 IHLS Financial Reports as of July 31, 2018 FY2017-18 System Area & Per Capita Grant (SAPG) Status As of July
Junior Uranium explorer in the Athabasca Basin. Patterson Claims
 Junior Uranium explorer in the Athabasca Basin Patterson Claims Cautionary Note Regarding Forward-Looking Statements This Presentation and the exhibits attached herein contain forward-looking statements
Samostalna Liberalna Stranka
 Annual Financial Statements with Independent Auditors Report thereon 01 January 2013-31 December 2013 Table of Contents: Independent Auditors report..... 3 Statement of financial position....... 7 Statement
SECTION DESCRIPTION PAGE I. BUDGET INTRODUCTION... 1 II. FISCAL YEAR 2017 BUDGET ANALYSIS... 2 III. PROPOSED OPERATING BUDGET... 3
 2018 SECTION DESCRIPTION PAGE I. BUDGET INTRODUCTION... 1 II. FISCAL YEAR 2017 BUDGET ANALYSIS... 2 III. PROPOSED OPERATING BUDGET... 3 IV. GENERAL FUND 001 DESCRIPTIONS... 4 V. DEBT SERVICE FUNDS... 6
MILLENNIUM MINERALS LIMITED
 2 May 2013 Manager Company Announcements Company Announcements Office Australian Securities Exchange Limited Level 4, 20 Bridge Street SYDNEY NSW 2000 ABN 85 003 257 556 Dear Sir/Madam Please find attached
GASB 34. Basic Financial Statements M D & A
 GASB 34 Basic Financial Statements M D & A In June 1999, the Governmental Accounting Standards Board issued Statement No. 34 (GASB 34) which fundamentally changed the financial reporting model for state
Kelly Creek Basin. EXPLORATION UPDATE June 23, Reno Office 10 Greg Street, Suite 170 Sparks, Nevada
 Kelly Creek Basin EXPLORATION UPDATE June 23, 2016 Reno Office 10 Greg Street, Suite 170 Sparks, Nevada 89431 775-359-7740 Vancouver Office 1500 885 West Georgia Street Vancouver, B.C. V6C 3E8 604-601-2006
RESOLUTION NOW, THEREFORE, BE IT RESOLVED BY THE BOARD OF SUPERVISORS OF THE CORKSCREW FARMS COMMUNITY DEVELOPMENT DISTRICT:
 RESOLUTION 2017-08 A RESOLUTION OF THE BOARD OF SUPERVISORS OF THE CORKSCREW FARMS COMMUNITY DEVELOPMENT DISTRICT APPROVING PROPOSED BUDGET(S) FOR FISCAL YEAR 2017/2018 AND SETTING A PUBLIC HEARING THEREON
$2.5 Million Resource Drilling Program Commences at Siberia Mining Centre
 ASX ANNOUNCEMENT 14 June 2016 $2.5 Million Resource Drilling Program Commences at Siberia Mining Centre Eastern Goldfields Limited (ASX: EGS) (Eastern Goldfields or the Company) is pleased to announce
FINANCIAL STATEMENTS OF THE COMPANY
 FINANCIAL STATEMENTS OF THE COMPANY getback Spółka Akcyjna for the period between 01.01.2014 and 31.12.2014 which include: 1. INTRODUCTION TO THE FINANCIAL STATEMENTS 2. BALANCE SHEET 3. PROFIT AND LOSS
HOW TO USE THE SBDC FINANCIAL TEMPLATE
 HOW TO USE THE SBDC FINANCIAL TEMPLATE It is strongly suggested that, if you are not well acquainted with Financial Statements and their interrelationships, that you seek the assistance of the Small Business
NEWS RELEASE. Mountain Province Diamonds Reports Additional Kimberlite Identified in Gahcho Kué Exploration Program
 NEWS RELEASE September 17, 2018 TSX and NASDAQ: MPVD Mountain Province Diamonds Reports Additional Kimberlite Identified in Gahcho Kué Exploration Program Toronto and New York, September 17, 2018 Mountain
12:45 PM Phoenix Bioinformatics Corporation. 03/27/15 Statement of Financial Income and Expense Accrual Basis January through December 2014
 12:45 PM Phoenix Bioinformatics Corporation 03/27/15 Statement of Financial Income and Expense Jan - Dec 14 Ordinary Income/Expense Income 43400 Direct Public Support 980.00 45000 Investments 1.12 46400
Sierra Rutile Limited. Sierra Rutile to start Gangama Dry Mine Project
 Sierra Rutile Limited Sierra Rutile to start Gangama Dry Mine Project London, UK, 21 April 2015: Sierra Rutile Limited (AIM: SRX) ( Sierra Rutile ) is pleased to announce that it has commenced the construction
The Talking Farm Treasurer's Report and Financial Statements (for internal use only) June 30, 2016
 June 30, 2016") Treasurer's Report and Financial Statements (for internal use only) June 30, 2016 Table of Contents: Treasurer's Report 1 Page: Financial Statements: Statements of Financial Position 2 Statements of Activities
Treasurer's Report and Financial Statements (for internal use only) June 30, 2016 Table of Contents: Treasurer's Report 1 Page: Financial Statements: Statements of Financial Position 2 Statements of Activities
Name of Bank BASEL III LEVERAGE RATIO REPORT As of 30 Sep 2018
 PART I. CALCULATION OF BASEL III LEVERAGE RATIO Item Nature of Item Reference Account Code Amount A. CAPITAL MEASURE 300000000000900000 741,513,309.86 A.1 Tier 1 Capital Basel III CAR Report (Version 3)
NEWS RELEASE. Mountain Province Diamonds Completes the Kennady North Winter Exploration Program
 NEWS RELEASE May 23, 2018 TSX and NASDAQ: MPVD Mountain Province Diamonds Completes the Kennady North Winter Exploration Program Toronto and New York, May 23, 2018 Mountain Province Diamonds Inc. ( Mountain
Rebate Report. $15,990,000 Public Finance Authority Charter School Revenue Bonds (Voyager Foundation, Inc. Project) Series 2012A
 Series 2012A") Rebate Report $15,990,000 Delivery Date: October 9, 2012 Installment Computation Period Ending Date: October 8, 2017 The Bank of New York Mellon Trust Company, N.A. Corporate Trust 5050 Poplar Avenue,
Rebate Report $15,990,000 Delivery Date: October 9, 2012 Installment Computation Period Ending Date: October 8, 2017 The Bank of New York Mellon Trust Company, N.A. Corporate Trust 5050 Poplar Avenue,
Department Mission: Mandated Services: Department Overview:
 Department: Treasurer FY 2019 Proposed Budget Department Mission: Our mission is to provide financial stewardship for Klamath County by safeguarding financial resources while maximizing investment return
UNITED STATES SECURITIES AND EXCHANGE COMMISSION Washington, D.C FORM 8-K
 9/3/2014 8-K 081814 8-K 1 a8-k081814.htm 8-K UNITED STATES SECURITIES AND EXCHANGE COMMISSION Washington, D.C. 20549 FORM 8-K CURRENT REPORT Pursuant to Section 13 or 15(d) of the Securities Exchange Act
GoviEx completes acquisition of African Energy s Zambian uranium assets
 October 30, 2017 GoviEx completes acquisition of African Energy s Zambian uranium assets VANCOUVER, CANADA GoviEx Uranium Inc. (TSX-V: GXU; OTCQB: GVXXF) ( GoviEx ) announced today the completion of its
June 2017 Quarterly Report
 ASX ANNOUNCEMENT Date: 31 July 2017 June 2017 Quarterly Report Victory Mines Limited (ASX:VIC) ( Victory or the Company ) provides a review of its activities during the June 2017 quarter. Exploration Western
2017 ANNUAL REPORT OF SOUTHERN CALIFORNIA EDISON COMPANY (U 338-E)
") ANNUAL REPORT OF ON SUBSIDIARY, AFFILIATE, AND HOLDING COMPANY TRANSACTIONS IN COMPLIANCE WITH R.92-08-008, ORDERING PARAGRAPH NO. 2 VOLUME III II.B. Requirement B, Part 2 - PROCEDURAL & ACCOUNTING SAFEGUARDS
ANNUAL REPORT OF ON SUBSIDIARY, AFFILIATE, AND HOLDING COMPANY TRANSACTIONS IN COMPLIANCE WITH R.92-08-008, ORDERING PARAGRAPH NO. 2 VOLUME III II.B. Requirement B, Part 2 - PROCEDURAL & ACCOUNTING SAFEGUARDS
IN THE MATTER OF THE SECURITIES ACT R.S.O. 1990, c. S.5, AS AMENDED. - and -
 Ontario Commission des P.O. Box 55, 19 th Floor CP 55, 19e étage Securities valeurs mobilières 20 Queen Street West 20, rue queen ouest Commission de l Ontario Toronto ON M5H 3S8 Toronto ON M5H 3S8 IN
QUARTERLY ACTIVITIES REPORT. For the period ended 30 June 2014
 31 July 2014 QUARTERLY ACTIVITIES REPORT For the period ended 30 June 2014 COMPANY OVERVIEW Regalpoint Resources Limited was formed to utilise the best available science to explore the Australian continent
Jupiter lnfomeclia. 2. We hereby declare that the Audit Reports mentioned above have unmodified opinion.
 Jupiter lnfomeclia Limited Date: May 30th, 2018 JM/592/2018 To, The Listing Operation Department BSE Limited Phiroze Jeejeebhoy Towers, Dalal Street, Mumbai - 400001 Dear Sifs, Sub.: Outcome of the Board
For personal use only
 Ground-breaking exploration in one of Australia s last underexplored greenstone belts Corporate Presentation 29 November 2018 ASX: MZN Simon Lawson, Managing Director Page I 1 Disclaimer General Disclaimer
Interval (meters) To (meters)
 To (meters)") 200 Burrard Street, Suite 650 Tel: 604.801.5432 Vancouver, BC V6C 3L6 Fax: 604.662.8829 TSX-V: VG NEWS RELEASE Shallow RC drilling at the WAMA property returns intervals of 4m @ 30.57 g/t Au, 3m @ 19.39
200 Burrard Street, Suite 650 Tel: 604.801.5432 Vancouver, BC V6C 3L6 Fax: 604.662.8829 TSX-V: VG NEWS RELEASE Shallow RC drilling at the WAMA property returns intervals of 4m @ 30.57 g/t Au, 3m @ 19.39
Acknowledgment of Aramco Asia. Supplier Code of Conduct
 Acknowledgment of Aramco Asia Supplier Code of Conduct (Applicable to Vendors, Manufacturers, and Contractors) Aramco Asia is committed to the highest ethical and legal standards in the conduct of its
Tax Return Transcript
 This Product Contains Sensitive Taxpayer Data Request Date: 01-23-2008 Response Date: 01-23-2008 Tax Return Transcript IRS Employee Number: QCW-- Tracking Number: 10002281XXXX EIN Provided: 75-2XXXXXX
City of Eagleville Budget Presentation Fiscal Year 2018
 City of Eagleville Budget Presentation Fiscal Year 2018 Work Sessions: March 9, 2017: March 23, 2017: April 13, 2017: General Fund Revenue Estimates Parks & Recreation State Street Aid Revenue and Expenses
How to Calculate Form Line 15
 How to Calculate Form 8621 - Line 15 2013-2015 Comprehensive Example Mary Beth Lougen EA USTCP Chief Operating Officer Expat Tax Tools B.Lougen@f8621.com 1 (844) 312-8670 ext. 402 www.f8621.com www.expattaxtools.com
MACRO-PRUDENTIAL RULES AND REGULATION (2015): DISCLOSURE REQUIREMENTS ANNEXURE I: FORMAT FOR ANNUAL DISCLOSURES DRUK PNB BANK LTD.
: DISCLOSURE REQUIREMENTS ANNEXURE I: FORMAT FOR ANNUAL DISCLOSURES DRUK PNB BANK LTD.") MACRO-PRUDENTIAL RULES AND REGULATION (2015): DISCLOSURE REQUIREMENTS ANNEXURE I: FORMAT FOR ANNUAL DISCLOSURES DRUK PNB BANK LTD. For the Year ended December 31, 2016 Item 1: Tier I Capital and its Sub-components
MACRO-PRUDENTIAL RULES AND REGULATION (2015): DISCLOSURE REQUIREMENTS ANNEXURE I: FORMAT FOR ANNUAL DISCLOSURES DRUK PNB BANK LTD. For the Year ended December 31, 2016 Item 1: Tier I Capital and its Sub-components
QUARTERLY ACTIVITIES REPORT FOR THE PERIOD ENDING 31 DECEMBER 2017
 ASX Release 30 January 2018 HIGHLIGHTS QUARTERLY ACTIVITIES REPORT FOR THE PERIOD ENDING 31 DECEMBER 2017 Resource announced for Elan South JORC-compliant Resource Estimate released for Elan South Project.
SCHOOLING FOR LIFE FOUNDATION FINANCIAL STATEMENT FOR THE MONTH OF
 SCHOOLING FOR LIFE FOUNDATION FINANCIAL STATEMENT FOR THE MONTH OF MAY 2014 TO JUNE 2015 SCHOOLING FOR LIFE FOUNDATION CONTENTS: PAGE GENERAL INFORMATION 3 REPORT ON THE ACCOUNT DEPT. 4 FINANCIAL STATEMENT
Adopted Budget Presented for Board Approval June 21, 2017
 2017-2018 Adopted Presented for Board Approval June 21, 2017 Prepared by Candace Reines, Assistant Superintendent Business Services Christopher Rabing, Director of Fiscal Services FINANCIAL REPORTS School
AMUNDI-ACBA ASSET MANAGEMENT CJSC Balanced Pension Fund ANNUAL FINANCIAL STATEMENTS DECEMBER 31, 2015
 AMUNDI-ACBA ASSET MANAGEMENT CJSC Balanced Pension Fund ANNUAL FINANCIAL STATEMENTS DECEMBER 31, 2015 CONTENTS INDEPENDENT AUDITOR S REPORT... 3 BALANCE SHEET AS OF DECEMBER 31, 2015... 4 OFF BALANCE SHEET
Woods of Perth Limited (in Administration) Court of Session Case No. PB584 of 2010
 Court of Session Case No. PB584 of 2010") Woods of Perth Limited (in Administration) Court of Session Case No. PB584 of 2010 Joint Administrators progress report for the six month period from 21 April 2011 to 20 October 2011 and final progress
Woods of Perth Limited (in Administration) Court of Session Case No. PB584 of 2010 Joint Administrators progress report for the six month period from 21 April 2011 to 20 October 2011 and final progress
Kenneth Shelton, Assistant Superintendent, Business Services Los Angeles County Office of Education 9300 Imperial Highway Downey, CA 90242
 April 17, 2009 Kenneth Shelton, Assistant Superintendent, Business Services Los Angeles County Office of Education 9300 Imperial Highway Downey, CA 90242 Dear Assistant Superintendent Shelton: The purpose
CEDAR CREST MUTUAL DOMESTIC WATER CONSUMERS & SEWAGE WORKS ASSOCIATION. December 31, 2016
 CEDAR CREST MUTUAL DOMESTIC WATER CONSUMERS Table of Contents Page Official Roster i Independent Accountants Report on Applying Agreed Upon Procedures 1 Schedule of Revenues and Expenditures Budget and
Florida Alliance for Assistive Services and Tec
 Florida Alliance for Assistive Services and Tec 5:09 PM Balance Sheet 08/09/2016 As of June 30, 2016 Accrual Basis ASSETS Current Assets Checking/Savings 1000 Cash - Unrestricted Jun 30, 16 1011 Regions
Date: June 14, IHLS Finance Committee IHLS Board of Directors. Adrienne L. Elam. Subject: IHLS Financial Reports as of May 31, 2017
 Attachment 5.1 Date: June 14, 2017 To: From: IHLS Finance Committee IHLS Board of Directors Adrienne L. Elam Subject: IHLS Financial Reports as of May 31, 2017 The financial reports included represent
DELAWARE COMPENSATION RATING BUREAU, INC. Internal Rate Of Return Model
 Exhibit 9 As Filed DELAWARE COMPENSATION RATING BUREAU, INC. Internal Rate Of Return Model The attached pages present exhibits and a description of the internal rate of return model used in deriving the
Adopted Budget Presented for Board Approval June 15, 2016
 2016-2017 Adopted Presented for Board Approval June 15, 2016 Prepared by Candace Reines, Assistant Superintendent Business Services Christopher Rabing, Director of Fiscal Services FINANCIAL REPORTS School
Minsud to recommence resource outline diamond drilling at the Chita Valley Cu- Au-Ag-Mo Project, San Juan, Argentina
 TSX-V: MSR August 17, 2016 Minsud to recommence resource outline diamond drilling at the Chita Valley Cu- Au-Ag-Mo Project, San Juan, Argentina Program features preliminary test of Epithermal Au-Ag Vein
For personal use only
 Alloy Regains Control of the Horse Well Gold Project ASX Release 29 January 2018 Capital Structure ABN 20 109 361 195 ASX Code AYR Issued Shares 1,266,993,360 Unlisted Options 29,000,000 Corporate Directory
acuitas, inc. s survey of fair value audit deficiencies April 2012 audit deficiency trends pcaob inspections methodology description of a deficiency
 April 2012 acuitas, inc. s survey of fair value audit deficiencies home executive summary audit deficiencies increase in difficult times pcaob inspections methodology description of a deficiency audit
Orange County Public Schools Orlando, Florida
 Orange County Public Schools Orlando, Florida Annual Financial Report 2015-2016 ORANGE COUNTY PUBLIC SCHOOLS MANAGEMENT S DISCUSSION AND ANALYSIS Exhibit A-1 Page 1a As management of the District School
LIBET S.A. Financial statements for the period of 12 months ended on 31 December 2014
 Financial statements A. Introduction B. Balance sheet C. Profit and loss statement D. Statement on changes in equity E. Cash flow statement F. Additional information and clarifications 1 A. INTRODUCTION
BMG SECURES LOW COST OPTION TO ACQUIRE ADVANCED HEAVY MINERAL SANDS PROJECT IN AUSTRALIA
 24 September 2014 BMG SECURES LOW COST OPTION TO ACQUIRE ADVANCED HEAVY MINERAL SANDS PROJECT IN AUSTRALIA BMG Resources Limited (ASX: BMG) (BMG or the Company) is pleased to announce that it has entered
Texas Tech University Health Sciences Center (739) Statement of Net Position August 31, 2017 and 2016
 Statement of Net Position August 31, 2017 and 2016") Statement of Net Position August 31, 2017 and 2016 Restated 2017 2016 ASSETS Current Assets: Cash and Cash Equivalents $ 55,910,167.26 $ 58,852,794.43 Restricted Cash and Cash Equivalents 76,001,967.30
Statement of Net Position August 31, 2017 and 2016 Restated 2017 2016 ASSETS Current Assets: Cash and Cash Equivalents $ 55,910,167.26 $ 58,852,794.43 Restricted Cash and Cash Equivalents 76,001,967.30
Saville Resources Inc. Completes Review of Work on the Niobium Claim Group, Quebec
 Saville Resources Inc. Completes Review of Work on the Niobium Claim Group, Quebec April 5, 2018 Saville Resources Inc. (TSXv: SRE, FSE: S0J) (the Company or Saville ) is pleased to provide an overview
ASX Release. 16 December 2010 LIMITED. EXPLORATION UPDATE Highlights
 ASX Release EXPLORATION UPDATE Highlights Bonsiega Joint Venture tenements minimum expenditure commitment met by 30 November 2010 Commencement of power auger bedrock drilling program at Fouli Prospect
FLORIDA DEPARTMENT OF EDUCATION SUPERINTENDENT S ANNUAL FINANCIAL REPORT (ESE 145) DISTRICT SCHOOL BOARD OF SANTA ROSA COUNTY
 DISTRICT SCHOOL BOARD OF SANTA ROSA COUNTY") CONTENTS: Return completed form to: Department of Education Office of Funding and Financial Reporting 325 W. Gaines St., Room 824 Tallahassee, FL 32399-0400 FLORIDA DEPARTMENT OF EDUCATION SUPERINTENDENT
CONTENTS: Return completed form to: Department of Education Office of Funding and Financial Reporting 325 W. Gaines St., Room 824 Tallahassee, FL 32399-0400 FLORIDA DEPARTMENT OF EDUCATION SUPERINTENDENT
FINANCIAL MANAGEMENT FOR GEORGIA LOCAL UNITS OF ADMINISTRATION
 FINANCIAL MANAGEMENT FOR GEORGIA LOCAL UNITS OF ADMINISTRATION Date Issued Effective Date Section Title: August 2008 August 2008 V Financial Reporting Revision No. Date Revised Chapter Title: N/A N/A 4
CROCODILE GOLD FILES TECHNICAL REPORTS FOR FOSTERVILLE AND COSMO GOLD MINES AND PROVIDES ANNUAL GENERAL MEETING INFORMATION
 65 Queen Street West Suite 825, P.O. Box 75 Toronto, Ontario M5H 2M5 Canada CROCODILE GOLD FILES TECHNICAL REPORTS FOR FOSTERVILLE AND COSMO GOLD MINES AND PROVIDES ANNUAL GENERAL MEETING INFORMATION May
TABLE OF CONTENTS. Page. Statistical Bulletin, June 2011 INTRODUCTORY NOTES SUMMARISED ACCOUNTS OF THE BANKING SYSTEM
 TABLE OF CONTENTS Page INTRODUCTORY NOTES... 3 1. SUMMARISED ACCOUNTS OF THE BANKING SYSTEM 1.1 CENTRAL BANK OF KENYA 1.1.1 Assets... 10 1.1.2 Liabilities... 11 1.2 OFFICIAL RESERVES 1.2.1 Foreign Assets...
The Board. Total 23,512,844.21
 Macon County BOE, AL 1 County Board of Education of Macon County, Alabama, Capital Outlay School Warrants, Series 2016, $18,015,000, Dated: February 1, 2016 2 County Board of Education of Macon County,
Orange County Public Schools Orlando, Florida
 Orange County Public Schools Orlando, Florida Annual Financial Report 2013-2014 ORANGE COUNTY PUBLIC SCHOOLS MANAGEMENT S DISCUSSION AND ANALYSIS June 30, 2014 Exhibit A-1 Page 1a As management of the
PENNSYLVANIA COMPENSATION RATING BUREAU F CLASS FILING INTERNAL RATE OF RETURN MODEL
 F Class Exhibit 4 Proposed 10/1/16 PENNSYLVANIA COMPENSATION RATING BUREAU F CLASS FILING INTERNAL RATE OF RETURN MODEL The attached pages present exhibits and a description of the internal rate of return
Probe Metals Intersects 3.2 g/t Gold Over 45.5 Metres At Val-d Or East
 NEWS RELEASE 11/2018 Symbol: TSX-V: PRB Shares Issued: 110,584,945 Highlights: Probe Metals Intersects 3.2 g/t Gold Over 45.5 Metres At Val-d Or East Near-surface intercept grading 3.2 g/t Au over 45.5
MEDIA RELEASE. Calibre Follow-up Reverse Circulation Drilling Programme scheduled to commence 20 October October 2015
 MEDIA RELEASE 16 October 2015 www.antipaminerals.com.au ASX: AZY Calibre Follow-up Reverse Circulation Drilling Programme scheduled to commence 20 October 2015 Antipa Minerals Ltd ( Antipa or the Company
REVISED UPDATED PREPARED DIRECT SAFETY ENHANCEMENT COST ALLOCATION TESTIMONY OF GARY LENART SAN DIEGO GAS & ELECTRIC COMPANY AND
 Application No: Exhibit No.: Witness: A.--00 ) In the Matter of the Application of San Diego Gas & ) Electric Company (U 0 G) and Southern California ) Gas Company (U 0 G) for Authority to Revise ) Their
Assay Results Highlights (as of November 16, 2017) representing approximately 4,500 metres ( m ) of drilling:
 representing approximately 4,500 metres ( m ) of drilling:") TSX: RMX OTCQX: RBYCF Rubicon Minerals Provides Additional Drill Results and Observations from its 2017 Exploration Program and Commences Exploratory Underground Development TORONTO, Ontario, November
TSX: RMX OTCQX: RBYCF Rubicon Minerals Provides Additional Drill Results and Observations from its 2017 Exploration Program and Commences Exploratory Underground Development TORONTO, Ontario, November
April Exploring for Canadian Gold in the Rainy River District of Ontario
 April 2013 Exploring for Canadian Gold in the Rainy River District of Ontario 1 Forward Looking Statements This presentation may contain forward-looking statements including but not limited to comments
Total Contribution Income a or 1c subtotal -1f 8 1
 Treasurer's Report Revenue Prior Year 2007 Form 990 -Pt. VIII - Revenue Revenue Current Year Budget Actual 2009 Budget Part A. Income 1. Contributions A. Meeting Grants 5500.00 9000.00 2000.00 1a or 1c
QUARTERLY ACTIVITIES REPORT For the period ended 31 March 2014
 29 April 2014 QUARTERLY ACTIVITIES REPORT For the period ended 31 March 2014 COMPANY OVERVIEW Regalpoint Resources Limited was formed to utilise the best available science to explore the Australian continent
SECTION DESCRIPTION PAGE I. BUDGET INTRODUCTION... 1 II. FISCAL YEAR 2016 BUDGET ANALYSIS... 2 III. FINAL OPERATING BUDGET FUND
 2017 SECTION DESCRIPTION PAGE I. BUDGET INTRODUCTION... 1 II. FISCAL YEAR 2016 BUDGET ANALYSIS... 2 III. FINAL OPERATING BUDGET FUND 001... 3 IV. GENERAL FUND 001 DESCRIPTIONS... 4 V. DEBT SERVICE FUND...
Suite 1800 Two Bentall Centre 555 Burrard Street Vancouver, BC V7X 1M9 Tel: (604) Tel: (888) April 8, 2018 SBB NR SBB TSX
 Tel: (888) April 8, 2018 SBB NR SBB TSX") Suite 1800 Two Bentall Centre 555 Burrard Street Vancouver, BC V7X 1M9 Tel: (604) 998-4175 Tel: (888) 648-4218 www.sabinagoldsilver.com April 8, 2018 SBB NR 18-10 SBB TSX Sabina Gold & Silver continues
Suite 1800 Two Bentall Centre 555 Burrard Street Vancouver, BC V7X 1M9 Tel: (604) 998-4175 Tel: (888) 648-4218 www.sabinagoldsilver.com April 8, 2018 SBB NR 18-10 SBB TSX Sabina Gold & Silver continues
UNITED STATES SECURITIES AND EXCHANGE COMMISSION Washington, D.C FORM 10-D
 UNITED STATES SECURITIES AND EXCHANGE COMMISSION Washington, D.C. 20549 FORM 10-D ASSET-BACKED ISSUER DISTRIBUTION REPORT PURSUANT TO SECTION 13 OR 15(d) OF THE SECURITIES EXCHANGE ACT OF 1934 For the
SECTION DESCRIPTION PAGE I. BUDGET INTRODUCTION... 1 II. FISCAL YEAR 2017 BUDGET ANALYSIS... 2 III. PROPOSED OPERATING BUDGET... 4
 2018 SECTION DESCRIPTION PAGE I. BUDGET INTRODUCTION... 1 II. FISCAL YEAR 2017 BUDGET ANALYSIS... 2 III. PROPOSED OPERATING BUDGET... 4 IV. GENERAL FUND 001 DESCRIPTIONS... 6 V. DEBT SERVICE FUNDS... 9
Information Bulletin 12/2003
 Information Bulletin 12/2003 Warsaw, April 2003 Compiled from NBP materials by the Department of Statistics as at March 15, 2004. Design: Oliwka s.c. Cover photo: Corbis/Free Layout and print: NBP Printshop
E-Community Check Request Checklist
 E-Community Check Request Checklist The E-Community must complete the following information on each business approved for a loan or grant in order for the Kansas Center of Entrepreneurship (KCFE) to disburse
Illinois Heartland Library System Statement of Revenues and Expenditures Fund #10 - General Fund. YTD Budget (07/01/ /31/2019)
") Fund #10 - General Fund Attachment 5.1 - IHLS Percentage b State Grants 549,978.11 1,209,700.32 2,550,525.21 (1,340,824.89) 3,400,700.32 (2,191,000.00) (64.43)% 3,400,700.32 Fees for Services and Materials
Fund #10 - General Fund Attachment 5.1 - IHLS Percentage b State Grants 549,978.11 1,209,700.32 2,550,525.21 (1,340,824.89) 3,400,700.32 (2,191,000.00) (64.43)% 3,400,700.32 Fees for Services and Materials
Penarth Master Issuer plc - Monthly Report November 2012 Combined Series Report For IPD Ending: 18 December 2012
 Combined Series Report For IPD Ending: 18 December 2012 Reporting Date 17 December 2012 Reporting Period 01 November 2012-30 November 2012 Interest Payment Date 18 December 2012 Contact Details Name Telephone
ANNUAL INFORMATION FORM
 Columbus Gold Corp. Suite 307 475 Howe Street Vancouver, BC V6C 2B3 ANNUAL INFORMATION FORM For the Year Ended September 30, 2011 Dated February 23, 2012 TABLE OF CONTENTS ITEM 1: CAUTIONARY NOTE ON FORWARD
TSX.V: TR. Drilling in the Shadow of World-Class Deposits. TR: TSX.V January 2019
 TSX.V: TR Drilling in the Shadow of World-Class Deposits TR: TSX.V January 2019 1 Looking Forward Statement Investors are cautioned that, except for statements of historical fact certain information contained
BURACOPPIN EXPLORATION UPDATE
 BURACOPPIN EXPLORATION UPDATE Exploration program underway at Burracoppin Gold Project in WA 6 December 2018 Airborne EM survey completed over E70/4688 Grant of adjoining E70/5154 significantly increases
July 12, IHLS Finance Committee IHLS Board of Directors. Adrienne L. Elam. Subject: IHLS Financial Reports as of June 30, 2017
 Attachment 7.1 Date: July 12, 2017 To: IHLS Finance Committee IHLS Board of Directors From: Adrienne L. Elam Subject: IHLS Financial Reports as of June 30, 2017 The financial reports included represent
1) Standards and Methodology for the Evaluation of Financial Statements 2) Letter of Credit Instructions
 Standards and Methodology for the Evaluation of Financial Statements 2) Letter of Credit Instructions") TO: IATA Travel Agencies DATE: 29 th January 2016 REFERENCE: Annual Financial Review Preparation - Agency Risk Management Guideline About In preparation for your agency s upcoming annual financial review,
TO: IATA Travel Agencies DATE: 29 th January 2016 REFERENCE: Annual Financial Review Preparation - Agency Risk Management Guideline About In preparation for your agency s upcoming annual financial review,
PARTICIPATING ORGANISATIONS CIRCULAR
 PARTICIPATING ORGANISATIONS CIRCULAR Date : 24 November 2011 R/R No. : 10 of 2011 DIRECTIVES ON SUBMISSION BY PARTICIPATING ORGANISATIONS OF PERIODIC REPORTS BY ELECTRONIC TRANSMISSION TO BURSA MALAYSIA
Sabina Gold & Silver Reports 2018 Drilling has Commenced at Back River Gold Project
 Suite 1800 Two Bentall Centre 555 Burrard Street Vancouver, BC V7X 1M9 Tel: (604) 998-4175 Tel: (888) 648-4218 www.sabinagoldsilver.com March 6, 2018 SBB NR 18-05 SBB TSX Sabina Gold & Silver Reports 2018
Information Bulletin 2/2011
 Information Bulletin 2/2011 Warsaw, 2011 Compiled from NBP materials by the Department of Statistics as at April 13, 2011. Design: Oliwka s.c. Cover photo: Corbis/Free Layout and print: NBP Printshop Published
School Board of Brevard County
 School Board of Brevard County Annual Financial Report For the Year End June 30, 2014 DISTRICT SCHOOL BOARD OF BREVARD COUNTY STATEMENT OF REVENUES, EXPENDITURES AND Exhibit K-1 CHANGES IN FUND BALANCE
PRESS RELEASE NEW MINERAL RESOURCE UPDATE AT PRAIRIE CREEK MINE. Measured + Indicated and Inferred Resource Tonnages Increased
 PRESS RELEASE CZN-TSX CZICF-OTCQB FOR IMMEDIATE RELEASE March 26, 2015 NEW MINERAL RESOURCE UPDATE AT PRAIRIE CREEK MINE Measured + Indicated and Inferred Resource Tonnages Increased Underground Exploration
Orange County Public Schools Orlando, Florida
 Orange County Public Schools Orlando, Florida Annual Financial Report 2016-2017 ORANGE COUNTY PUBLIC SCHOOLS MANAGEMENT S DISCUSSION AND ANALYSIS Exhibit A-1 Page 1a As management of the District School
Novo Resources Corp. Suite West Georgia Street Vancouver, BC V6E 3C9
 Novo Resources Corp. Suite 1980 1075 West Georgia Street Vancouver, BC V6E 3C9 SAMPLING RETURNS HIGH GRADES AT NOVO RESOURCES BLUE SPEC GOLD-ANTIMONY PROJECT VANCOUVER, BC, January 21, 2016 - Novo Resources
Penarth Master Issuer plc - Monthly Report October 2012 Combined Series Report For IPD Ending: 19 November 2012
 Combined Series Report For IPD Ending: 19 November 2012 Reporting Date 17 November 2012 Reporting Period 01 October 2012-31 October 2012 Interest Payment Date 19 November 2012 Contact Details Name Telephone
For personal use only OZ MINERALS CARRAPATEENA COPPER GOLD PROJECT SOUTH AUSTRALIA 27 MARCH 2012
 OZ MINERALS CARRAPATEENA COPPER GOLD PROJECT SOUTH AUSTRALIA 27 MARCH 2012 WWW.OZMINERALS.COM DISCLAIMER This presentation has been prepared by OZ Minerals Limited ( OZ Minerals ) and consists of written
RHODE ISLAND EMPLOYER S INCOME TAX WITHHOLDING TABLES DRAFT 11/27/2018.
 2018 RHODE ISLAND EMPLOYER S INCOME TAX WITHHOLDING TABLES www.tax.ri.gov CONTENTS Page Employer s Tax Calendar... 3 Instructions... 4-5 WITHHOLDING METHODS AND TABLES Withholding Percentage Method...
 Wausau Community Development Authority Balance Sheet September 30, 2017 Low Rent (46 Scattered Sites) Voucher (Sec 8) Riverview Terrace Business Activity ** Business Activity II Redevelopment (Fund 01)
July Exploring for Canadian Gold in the Rainy River District of Ontario
 July 2013 Exploring for Canadian Gold in the Rainy River District of Ontario 1 Forward Looking Statements Some of the statements in this document may be deemed to be "forward-looking statements". All statements
Information Bulletin 9/2011
 Information Bulletin 9/2011 Warsaw, 2011 Compiled from NBP materials by the Department of Statistics as at November 1, 2011. Design: Oliwka s.c. Cover photo: Corbis/Free Layout and print: NBP Printshop
Sample Statements and Charts
 Sample Statements and Charts Write-Up CS or Trial Balance CS version 2007.x.x TL17346 (04/24/07) Copyright Information Text copyright 1998-2007 by Thomson Tax & Accounting. All rights reserved. Video display
GOLDEN MINERALS DISCOVERS ADDITIONAL HIGH GRADE VEINS AT SANTA MARIA RESULTS UP TO 1.88 g/t Au and 648 g/t Ag
 GOLDEN MINERALS DISCOVERS ADDITIONAL HIGH GRADE VEINS AT SANTA MARIA RESULTS UP TO 1.88 g/t Au and 648 g/t Ag Golden, Colorado /Globe Newswire/ July 12, 2018 Golden Minerals Company (NYSE American and
For personal use only
 ORION METALS LIMITED (ASX: ORM) ACTIVITIES REPORT FOR QUARTER ENDING 28 TH FEBRUARY 2014. EXPLORATION ACTIVITIES Following senior management changes late 2013, a new highly experienced exploration team
Information Bulletin 11/2011
 Information Bulletin 11/2011 Warsaw, 2012 Compiled from NBP materials by the Department of Statistics as at January 13, 2012. Design: Oliwka s.c. Cover photo: Corbis/Free Layout and print: NBP Printshop