The Subglacial Hydrology of the Laurentide Ice Sheet in Northern New Jersey
|
|
|
- Lynette Chambers
- 6 years ago
- Views:
Transcription
1 The Subglacial Hydrology of the Laurentide Ice Sheet in Northern New Jersey Christopher Olsen Advisor: Dr. Karen Prestegaard April 27 th, 2015 University of Maryland Geology 394
2 ABSTRACT During the last glacial maximum the Laurentide Ice Sheet covered much of Northern New Jersey. As the ice sheet began to melt, melt-water would have infiltrated the aquifers beneath the glacier and may have significantly affected hydraulic heads and gradients. Previous studies have suggested that the groundwater head distributions and thus flow velocities are significantly impacted by the presence of sub-glacial water drainage systems. The problem that I am addressing in this paper is whether or not the presence of a subglacial water film would have had an effect on the groundwater flow in the aquifers of New Jersey. To understand the effects the Laurentide Ice Sheet had on the aquifers of New Jersey, I used the groundwater modeling software MODFLOW to simulate the groundwater flow along a two-dimensional representation of the central flow line of a glacial lobe in North Eastern New Jersey. The groundwater model can be manipulated to evaluate the effects of various parameters such as water film thickness, glacier basal melt rate, and glacier thickness. The model results indicate that the presence of a sub-glacial water film reduced the hydraulic gradient in the aquifers whereas the absence of a sub-glacial film resulted in significantly higher gradients in hydraulic head within the aquifers. These results suggest that the presence of a subglacial water film had a significant effect on the groundwater flow regime in the sub-glacial aquifers. 1
3 TABLE OF CONTENTS I. INTRODUCTION AND PREVIOUS WORKS... 6 Figure Figure Hypotheses Study Site: The Quaternary and Bedrock Geology of the LGM New Jersey Lobe Figure Pre-Pleistocene Geology Figure II. METHOD OF ANALYSIS Numerical Groundwater Flow Modeling Modeling Groundwater Flow Figure Table I: Parameters used in model runs Model Domain Figure Hydrostratigraphic Model and Boundary Conditions Figure GIS Compilation of Glacial and Subglacial Geological Maps Figure Figure Figure Glacial Parameters that Constrain the Hydraulic Boundary Conditions Sensitivity Analysis and Hypothesis Testing III. RESULTS AND ANALYSIS OF UNCERTAINTY Model Results Figure Figure Uncertainty Analysis Model Limitations
4 IV. CONCLUSIONS Discussion and Conclusions Figure Figure V. ACKNOWLEDGMENTS VI. BIBLIOGRAPHY VII. APPENDIX

5 I. INTRODUCTION AND PREVIOUS WORKS During the Last Glacial Maximum (LGM), the Laurentide Ice Sheet covered much of North America. The Laurentide Ice Sheet extended as far south as Missouri in the west and New Jersey in the east leaving prominent moraines situated in the North Central and North Eastern United States (Dyke and Prest, 1987). The Last Glacial Maximum extended from approximately 50,000 to 10,000 years ago with glacial declines beginning as early as 20,000 years ago (Clark et al. 2009). The Wisconsonian Glaciation was the last major glaciation event to occur in North America. During this period much of Northern New Jersey was covered by an ice sheet (Dyke and Prest, 1987). Approximately 16,000 years ago during this glacial period much of the South-Eastern Laurentide Ice Sheet rapidly began to recede (Dyke, 2004). Figure 1. The previous studies (Carlson et al. 2007, Breemer et al. 2002) are outline in orange over a map of the Laurentide Ice Sheet provided by Dyke et al Outlined in red is the area of study for this project. 4
6 The ice sheets covered much of North America, but little is known about the glacial mechanics at the base of these ice sheets. Previous studies have noted that glacial advance and melting phases of glaciers may have resulted in significant recharge of the aquifers (Breemer et al. 2002, Carlson et al. 2007). The amount of recharge would be influenced by head distributions in the aquifers, which in turn are affected by the presence or absence of water films at the base of the glacier. If the regional aquifer beneath the glacier cannot accommodate the meltwater then drainage systems may form at the ice-till interface (Alley, 1989). The formation of subglacial drainage systems would reduce the thickness of the subglacial water film, which would have affected basal sliding by the glacier (Alley, 1989). Previous studies have shown that if the aquifer beneath of a glacier cannot accommodate all of the meltwater flowing into the system than other forms of drainage may form at the ice till interface to distribute water pressure (Alley 1989). The types of basal drainage systems that may develop are laminar films (Alley 1989, Breemer et al. 2002), channelized flow (Brown et al. 1987, Walder and Fowler 1994, Ng 2000), and channelized flow that may be associated with periodic outburst floods (Piotrowski 1997a,b., Shaw 1988). Laminar films are unstable under normal conditions as water tends to collect in channels (Breemer et al. 2002, Walder 1986). Due to lack of drumlin formations and streamlined till features in the New Jersey region, there is little evidence for subglacial floods. There are significant glacial outwash deposits found at the front of the glacial margin suggest subglacial drainage systems may have formed (Fig. 3). Therefore, the water under the ice sheets probably evolved from laminar films to basal drainage systems. Ice located between the basal drainage channels likely had thin laminar films that fed water into the channels. Therefore, most of the ice sheet that contributed to recharge of the subglacial aquifers would likely have thin laminar films. This influx of water from the glacier would affect head distributions and water flow in the aquifers. Previous studies have shown that groundwater velocities in underlying aquifers were influenced by Pleistocene ice sheets (Carlson et al. 2007, Breemer et al. 2002, Boulton et al a,b.) (Fig. 2). 5
7 Figure 2. This figure from Breemer et al shows the modeled groundwater flow vectors from three different model runs along a single flow line of the Lake Michigan lobe. The top model represents modern conditions. The middle model represents Pleistocene conditions with modern K values and no subglacial drainage systems. The bottom model represents Pleistocene conditions with modern K values and a 7 mm thick water film at the ice-bed interface. During the Last Glacial Maximum the glacial margin of the Laurentide Ice Sheet was located in Northern New Jersey. As the ice sheet receded it left behind three distance moraines that overlie three distance geologic regions. The terminal moraine associated with each lobe has a distinct morphology that may be related to the basal water, the underlying geology the ability of the subglacial aquifer to transmit glacial meltwater. Therefore, the purpose of this study is to use groundwater flow models to explore the relationship between regional geology and glacier flow dynamics for a time period near the end of the Last Glacial Maximum. Although this study is similar to previous studies by Breemer et al. (2002) and Carlson et al. (2007), the configuration of the aquifer is significantly different. In particular the aquifer system 6
8 underlying the glacier is in a basin, therefore the groundwater flow would move out of a basin rather than into a basin as it did near the mid-continent lobes. Ice internal deformation is caused by ice crystals deforming and sliding past one another. This deformation rate is a function of temperature and is summarized by Glenn s Flow Law (Glenn 1958): Strain = Aτ n (1), where τ is the basal shear stress (kn m -2 ) and both A and N are functions of temperature. Glacier shear stresses are observed to be in a narrow range, kn m -2 for internal deformation to occur. Glacial thickness reconstructions use evidence for the presence and absence of basal water and threshold shear stress values (e.g. 150 kn m -2 ) to reconstruct ice sheet thickness. To calculate the thickness of the glacier above the aquifer the Orowan and Perutz (1949) equation is used: (2), where x is the distance from the glacial margin. When liquid water is present, glaciers can also move by basal sliding, which the sliding of the glaciers along the base and represents movement in addition to internal deformation. A mountain glacier for example, moves by internal deformation during the winter months and then by basal sliding as meltwater accumulates at the glacier base. Therefore, we can determine the thickness of the glacier by estimating the critical shear stress and position from the glacier snout (thickness = 0) and other known points of the glacier thickness. The ice thickness produces that overburden stress that the glacier exerts on the aquifer. Therefore, the local ice sheet thickness is used to determine hydrostatic pressure: 7
9 (3), where P i is the overburden stress, ρ i is the density of ice (900 kg m -3 ), g is the acceleration from gravity (9.81 m s- 2 ), and H i is the glacier thickness above a given point within the aquifer. The presence of water beneath the ice sheet affects two important parameters, the critical shear stress of the glacier and the recharge rate of the aquifers beneath the glacier. Observations of basal melt rates of modern ice sheets in Greenland and Antarctica range from 1 to 7 mm yr -1 (Bell 2008). Given these melt rates the water could accumulate at the base of the glaciers. The basal water layer is likely to be thin, but given the basal water layer is to be included in a groundwater flow model, it needs to be thin enough to still act as a laminar flow layer. Groundwater flow velocities in fractures or gaps are proportional to the gap or fracture diameter (D) squared. Fractures with diameters below 1 cm in thickness maintain laminar flow and thus meet the criterion for Darcian flow: V = ad 2 (4). Therefore, the basal water later is modeled with a thickness less than 10 mm (Breemer et al. 2002). Hypotheses 1. The presence of a subglacial water film would create a low hydraulic gradient in New Jersey aquifers near the LGM glacial margin in New Jersey, whereas absence of a subglacial water film in the same New Jersey aquifer system would result in a high hydraulic gradient localized beneath the ice sheet. 2. Thicker overlying ice sheets will produce a steeper hydraulic gradient, but this effect will be less significant than the presence of a basal water film. 8
10 3. Therefore, the lowest hydraulic gradient in the aquifer would be associated with a thin ice sheet thickness and the presence of a subglacial water film; conditions that would be associated with warm, wet ice streams prior to glacial retreat. These hypotheses can be evaluated with the MODFLOW groundwater flow model applied to the hydrostratigraphic characteristics of the New Jersey aquifers. Study Site: The Quaternary and Bedrock Geology of the LGM New Jersey Lobe The study site is located in Northern New Jersey. The glacial moraines of the New Jersey lobe show three distinctive surface profiles (Fig. 3). These moraines establish the glacial margins of the three major glacial lobes in Northern New Jersey. The eastern sub-lobe has a prominent moraine and significant glacial meltwater deposits parallel to the Hudson River. To the west the moraines front is located further north and there is also evidence of glacial meltwater in front of the terminal moraine. The western lobe has less well-defined moraines and more localized glacial meltwater deposits. 9
 define the margin of the Laurentide Ice Sheet during the Wisconsonian glacial period.")
11 Figure 3. Generalized map of glacial sediments (New Jersey Department of Environmental Protection and the New Jersey Geological Survey; 2002). Terminal moraines (red) define the margin of the Laurentide Ice Sheet during the Wisconsonian glacial period. Pre-Pleistocene Geology The aquifer systems of New Jersey occupy three distinct geologic regions separated by faults and distinctive changes of lithology. These three regions are the Atlantic Coastal Plain, the Piedmont and the New Jersey Highlands (Fig. 4). The Atlantic Coastal Plain forms the eastern margin of the North Atlantic United States. The formations in the Atlantic Coastal Plain dip gently to the east and achieve maximum depths of about 2000m. The lithologies consist mostly of Tertiary and Cretaceous sandstones and 10
.")
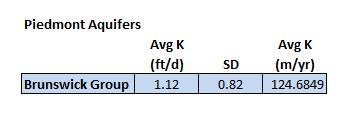
12 unconsolidated sands, silts, and clays (Owens et al. 1998). In contrast to its neighboring aquifers, the Atlantic Coastal Plain has the most permeable aquifers of the surrounding regions (Mannel et al. 2012). The Piedmont region forms the boundary between the Highlands and the Atlantic Coastal Plain. The units dip towards the west and is separated by two normal faults along the eastern and western boundaries (Drake et al. 1997, Owens et al. 1998). The most prominent geologic feature of the Piedmont region in New Jersey is the Newark Basin which consists mostly of Mesozoic claystone and siltstone to the east and basaltic sills to the west. Many of the aquifers in the Piedmont have poor hydraulic conductivity and much of the fluid is transmitted through fractured rock (Serfes 1994). Figure 4. The three geological provinces of New Jersey: The Coastal Plain, Piedmont, and Highlands/Valley and Ridge Provinces New Jersey Department of Environmental Protection and the New Jersey Geological Survey (2002). 11
. MODFLOW is a three-dimensional finitedifference groundwater modeling program (Harbaugh 2005).")
13 II. METHOD OF ANALYSIS Numerical Groundwater Flow Modeling Steady-state groundwater flow beneath the Laurentide Ice Sheet is modeled with the USGS ground water modeling program MODFLOW (Harbaugh, 2005). MODFLOW is a three-dimensional finitedifference groundwater modeling program (Harbaugh 2005). To calculate the hydraulic gradient, MODFLOW uses a modified version of Laplace s partial differential equation, which is a combination of Darcy s Law and the continuity equation. MODFLOW modifies Laplace s original equation by accounting for the recharge and pumping rates and storativity of the aquifer: (5), where K xx,yy,zz is the directional hydraulic conductivity (m yr -1 ), h is the hydraulic head (m), W is the volumetric flux (yr -1 ) where W>0 represents a recharge event and W<0 represents a drawdown event, S s is the specific storage of an aquifer (m -1 ), and t is the time interval (yr). MODFLOW applies this equation over a three-dimensional aquifer system with the finite-difference equation: (6), where Q i is the flowrate of the cell (m 3 yr -1 ), ΔV is the volume of the cell (m 3 ), Δh is the change in head (m), and Δt is the time interval (yr) (Harbaugh 2005). 12
.")
14 Modeling Groundwater Flow Applying this model to the subglacial aquifers will involve a series of steps of data compilation and establishment of boundary conditions to develop a functional model that can be run for the sets of conditions that will test the hypotheses (Fig. 5). For each glacial lobe modeled, I created a hydrostratigraphic model, defined the boundary conditions, and built a numerical model. The model is a two-dimensional representation of the aquifers along the central flow line of the glacier. The hydrostratigraphic model was developed by compiling relevant field data to establish hydraulic conductivities (K), unit thicknesses (z) and boundary conditions in and around the aquifers. The numerical model is designed around the hydrostratigraphic model with the addition of known head boundaries and recharge rates provided by the overlying glacier. The purpose of the conceptual model is to establish the boundary conditions and aquifer properties used by the numerical model. I have developed several scenarios of glacier thickness to constrain the hydraulic head values in the top of the aquifer. Simulations from the numerical model provide quantitative values of head along the glacier flow line for different scenarios of glacial thickness and water film thickness. Figure 5. The flow chart outlines the processes involved for modeling subglacial hydrology. On the right side there are the compilation tasks of data collection, establishing boundary conditions, and ice sheet reconstruction. To the left are modeling tasks that use the compiled data. 13

15 The model is run with multiple sets of parameters designed to test the original hypotheses. Model runs are designed to evaluate different combinations of glacial thickness and water film thickness. These combinations are outlined below: Table I: Parameters used in model runs Model Domain Northern New Jersey has three terminal moraines that establish the margins of the glacial lobes. These terminal moraines were deposited between the Hudson and Delaware Rivers during the Wisconsonian glacial period (Stone et al. 2002). During the Wisconsonian glacial period the glacial lobes flowed approximately 45⁰ SW based on the assumptions made on the geomorphology of the moraines. For identification purposes the glacial lobes are labeled Lobe #1, #2, and #3 (Fig. 6). 14

16 Figure 6. The pink corresponds to the terminal moraines, #1, #2, and #3 correspond to the different lobe of Northern New Jersey separated by black lines. The red A A line represents the central flow line profile for Lobe #1 and the boundary for the first hydrostratigraphic model. Lobe #1 is the easternmost lobe bounded by the Hudson River. The moraine formed by Lobe #1 has the furthest southern extend among all of the moraines which suggests that it was the fastest moving glacier relative to the other neighboring lobes at the time. It rests above the Piedmont Provinces on a formation known as the Newark Basin and stops at about 8 km over the Coastal Plain Province. The moraine of Lobe #1 the most arcuate and best defined of the three lobes which suggests that it was the most erosive among the three glaciers and may have had basal water films (Boulton et al. 1995b). Similarly Lobe #2 has a well-defined arcuate moraine that overlies the columnar basalts of the Piedmont Provinces. The moraine does not extend as far south as its eastern neighbor and is not as well 15
17 defined. This suggests that the glacier was moving slower and was less erosive than Lobe #1 (Boulton et al. 1995b). In contrast Lobe #3 is the least defined and has the least arcuate moraine among the three lobes in the study area. Unlike Lobes #1 and #2, the underlying aquifers offer very poor conditions for groundwater accommodation and flow. In this region much of the flow is accommodated through fractured bedrock which loses permeability with increased overburden stress that can close fractures. Therefore, using modern fractured rock aquifer properties would likely be an overestimate of groundwater flow conditions during the Late Wisconsonian Glacial period without considering the fracture compression at a depth determined by the ice sheet. Hydrostratigraphic Model and Boundary Conditions The hydrostratigraphic model is a two-dimensional representation of the aquifer along the central flow line of the glacier. To construct the hydrostratigraphic model, a combination of geological cross sections, hydrological databases, and previous groundwater hydrology studies are compiled (Drake et al. 1997, Owens et al. 1999, Martin 1998, Mannel et al. 2012, Vyas et al. 2004). The Delaware River forms the southern boundary as a boundary of a known hydraulic head of zero. The presence of glacial striae suggests a decrease in basal water pressure that establishes the northern boundary as a no-flow boundary (Dyke and Prest 1987) (Fig.7). The rationale is that the glacial striations from where basal pore-water pressure is low, which implies that this is part of the accumulation zone of the glacier, north of the equilibrium line (Glasser and Bennett 2004). The glacial profile forms a known head boundary based on ice thickness. The ice sheet itself is treated as an impermeable boundary at the top of the hydrostratigraphic units that comprise of the model. Finally, the Precambrian basement rocks forms a near-impermeable boundary at the base of the aquifer. 16
18 Figure 7. A map compiled by Dyke and Prest (1987) showing the profile of the Laurentide Ice Sheet. Zone 1 is characterized by terminal moraines and hummocky terrain and Zone 2 is characterized by glacial striae and esker formation. The study area is outlined in red with the blue line highlighting the Zone 2 boundary which forms the northern no-flow boundary condition. GIS Compilation of Glacial and Subglacial Geological Maps To produce a map and a cross section of the study area I compiled geologic and hydrostratigraphic data from Drake et al. 1997, Owens et al. 1998, Martin 1998, and Stone et al The map displayed in Figure 8 is a compilation of surface geology (Drake et al. 1997, Owens et al. 1998) and sediments (Stone et al. 2002). This map outlines the glacier margin and the boundaries of the regional geology which provides the upper boundary for the conceptual model. To produce a hydrostratigraphic model of the Coastal Plain aquifer along the A A flow line I use hydrostratigraphic cross section data from Martin 1998 (Fig. 9). For modeling purposes the Coastal Plain aquifer is grouped into a series of a top and bottom aquifers and a central aquitard. The K values of these aquifers are the mean K values for all of the grouped aquifers/aquitards. The data processed in Figures 8 and 9 is used along with geologic cross sections by Owens et al to produce a two dimensional cross section of the hydrostratigraphy of the A A flow line (Fig. 10). 17

, and Stone et al.")
19 Figure 8. Map compiled from GIS data from Drake et al. (1997), Owens et al. (1998), and Stone et al. (2002) showing the surface glacial deposits and related bedrock geology. 18


20 Figure 9. Using hydrostratigraphic data from Martin 1998 I modeled the Coastal Plain hydrostratigraphy along the A-A flow line shown in Figure 6 to produce the image on the right. Aquifers are shown in blue and aquitards are shown in gray. To simplify the model aquitards were grouped together where they are at high abundance in the middle of the model and the average hydraulic conductivity of the grouped units are used. Figure 10. Two-dimensional cross section compiled with hydrostratigraphic data from Martin 1998 and Geologic data from Owens et al This model corresponds to the flow line shown in figure 6. The cross section forms the boundary conditions of the conceptual model and subsequently the numerical model. The green represents the Piedmont aquifers with K values from Mennel (2002) (Appendix D). The yellow and light brown represents the Coastal Plain aquifers and aquitards respectively with K values from 19
21 Martin (1998) (Appendix A-C). The gray represents bedrock with K values of 3.16E-5 that extends 1 km below the the Piedmont and Coastal Plain. Glacial Parameters that Constrain the Hydraulic Boundary Conditions The purpose of the numerical model is to provide quantitative values of hydraulic head along the glacial flow line. The numerical model uses MODFLOW to calculate the groundwater flow. MODFLOW fundamentally relies on solving equation (5), therefore, the values for hydraulic conductivity (K xx,yy,zz ) and storativity (S s ) become essential variables required for solving the flow equations. The boundaries and aquifer properties of the numerical models are based on the conceptual hydrostratigraphic models of the Atlantic Coastal Plain, and Piedmont aquifers. A two-dimensional rectangular grid is fit to the hydrostratigraphic model along the central flow line of the glacier. To calculate the overburden stress, the ice sheet thickness is determined from the shear stress-distance relationship (2), where τ is the basal shear stress (kn m -2 ) and x is the distance from the glacial margin. The values for shear stresses are 20 and 150 kn m -2 which model a wet and relatively dry glacier. The values for shear stresses is constrained between 20 and 150 kn m -2 as a range of shear stress values based on observed in modern environments for a glacier sliding at its base. values based on observed in modern environments for a glacier sliding at its base. The recharge rate beneath the glacier is also varied, and the minimum and maximum values of basal melt, based on the basal melt rates of modern observations of ice sheets in Greenland and Antarctica of 1 to 7 mm yr -1 (Bell 2008). This calculation will be used in a series of horizontal cells relative to the length and position of the glacier to establish a known head domain boundary. Directly beneath the known head domain established by the glacier is the subglacial drainage layer which acts as a source of recharge for the system. This layer is simulated by the Romm (1966) fluid in fracture flow equation: K = ρ w gb 2 / 12μ (7), where ρ w is the density of water at 0 o c (1000 kg m -3 ), μ is the viscosity of water at 0 o c (5.67 E+4 m 2 yr -1 ) b is the subglacial film width (0 7 mm). 20
22 Sensitivity Analysis and Hypothesis Testing To test the hypotheses, I evaluate the response of the model to three different parameters in various combinations (Table. I). The parameters are subglacial film thickness (mm) which relates to the amount of water at the glacier base, basal shear stress (knm -2 ) which relates to the ice sheet thickness, and the basal melt rate (mm yr -1 ). To test the first hypothesis, all of the variables are initially set to their lowest reasonable values and each variable is tested individually. To test the second hypothesis, all of the variables are initially set to their highest reasonable values and each variable is tested individually. To test the hypothesis, the models are compared using the Wilcoxon rank-sum test. III. RESULTS AND ANALYSIS OF UNCERTAINTY Model Results I ran the model to simulate eight different scenarios, which model basal shear stresses of 20 to 150 kn m -2, subglacial water film thickness from 0 to 7 mm, and a basal melt rate of 0 to 7 mm yr -1. The model runs are designed to simulate steady state conditions beneath the glacier over a one year period. I also ran the model to simulate modern non-glaciated conditions (fig. 11) by deactivating the top two layers that were used to simulate the thickness of the glacier and the thickness of the subglacial water film and by setting a constant infiltration rate of 0.13 m yr -1 for the Piedmont and m yr -1 for the Coastal Plain based on assumptions made by Daniel 2002 using the methods outlined by Charles et al
23 Figure 11. A model run of present, non-glaciated conditions (no overlying glacier or subglacial water film). This model was given a constant recharge rate of 0.13 m yr -1 for the Piedmont and m yr -1 for the Coastal Plain at the surface. The model has the highest head measurements in the center of the. The present day simulation produced the largest head values at the center of the basin (Fig. 11). The highest head values were only slightly larger than the thick glacier (150 kn m -2 ) simulations. The model runs which had 150 kn m -2 for the basal shear stress produced higher overall heads with a proportionally increasing hydraulic gradient compared to the model runs with 20 kn m -2 as the basal shear stress value. Basal melt rates between 0 and 7 mm had no apparent effect on the hydrology of the model. The presence of a 7 mm subglacial water film produced lower hydraulic gradients than models run without the presence of a subglacial water film (Fig. 12). 22
24 Series 1, Trial 1: Film = 7mm, τ = 20kNm -2, Melt Rate = 0 mm yr -1 Series 1, Trial 2: Film = 7mm, τ = 150kNm -2, Melt Rate = 0 mm yr -1 Series 1, Trial 3: Film = 7mm, τ = 20kNm -2, Melt Rate = 7 mm yr -1 Series 1, Trial 4: Film = 7mm, τ = 150kNm -2, Melt Rate = 7 mm yr -1 23

25 Series 2, Trial 1: Film = 0mm, τ = 20kNm -2, Melt Rate = 0 mm yr -1 Series 2, Trial 2: Film = 0mm, τ = 150kNm -2, Melt Rate = 0 mm yr -1 Series 2, Trial 3: Film = 0mm, τ = 20kNm -2, Melt Rate = 7 mm yr -1 Series 2, Trial 4: Film = 0mm, τ = 150kNm -2, Melt Rate = 7 mm yr -1 24

26 Figure 12. The model results from Trials 1 4 of both Series 1 and 2 (Table I). The scale of the model is relative to the modeled results and each contour represents hydraulic head increments of 0.1 m. All of these models are modeling steady state conditions of the New Jersey aquifers along the A A' flowline under the effects of a glacier over a one year period of time. Uncertainty Analysis Uncertainty is assessed through the data collected and the sensitivity analysis of the model. All of the aquifer property data is the result of field testing and therefore has quantifiable error associated with it. In addition, hydraulic conductivity values are highly variable in both fractured rock and sedimentary rocks. Some reports also do not report error and only provide the mean values. In these cases, the error associated with similar aquifers is used. The numerical model constructed in MODFLOW also has error associated with fitting and truncation. Generally with longer time-steps and larger grid spacing the more truncation error will be introduced. Fitting cells to the geologic bedding also induces error since a cubic grid will not fully conform to the slope of the geologic unit. Fitted grid lines may not follow the fundamental equations that MODFLOW uses which may result in misaligned hydraulic conductivities (Harbaugh 2005). MODFLOW has a feature for calculating discrepancy between in-flow and out-flow of the model given by the equation: where D is the percent discrepancy, IN is the volume of flow into the model, and OUT is the volume of flow out of the model. If the volume of in-flow does not match the volume of out-flow then the mass balance requirements of a steady state model is not met and the amount of discrepancy can be reported as a feature of the model test. (8) 25
27 To evaluate the response of the numerical model to input variables, various sensitivity tests are performed. The variables that are tested are: the hydraulic conductivity of subglacial till, the basal shear stress of the glacier for values between 20 and 150 (kn m -2 ), and the meltwater discharge rates for values between 1 to 7 mm yr -1. Values greater than 7 mm yr -1 may be possible but that would produce a layer of water that would violate the assumptions of Darcian flow. For further validation the model is applied to modern boundary conditions. Therefore the glacier properties and confining unit on the top layer are replaced with a constant recharge along the entire top of the model based on modern infiltration rates of the aquifer. Model Limitations This model is a two-dimensional representation of what is essentially a three-dimensional problem. This model runs almost parallel to the general strike direction of the aquifers (Fig. 9). Therefore, some of the water pressure may be driven out of the system as gravity should drive flows towards the dip direction which this model does not account for. This could result in lower than expected head values especially near the glacial margin. As noted in Figure 9, the geology of this region is very complex with many heterogeneous aquifers stacked in rapid succession over a relatively shallow depth of approximately 500 m. This model does not take into account the heterogeneity of the aquifers and simplifies the numerous aquifer-aquitard bands into three distinct bands with averaged K values. The model also does not take into account the effects on aquifer compression from the glacier and the effects of permafrost which would decrease present day measurements of hydraulic conductivity and alter the available pore space of the aquifers. Another limitation of this model is the lack of modern analogs. The only comparable ice sheets in terms of mass are the Greenland and Antarctic ice sheets. However, these ice sheets overlay impermeable bed rock and flow directly out to sea. Therefore, the only potentially comparable analog to this system in the present day is the southwestern tongue of the Vatnajökull glacier in Iceland. 26
28 IV. DISCUSSION AND CONCLUSIONS Discussion and Conclusions The presence of a subglacial water film decreases the hydraulic gradient which supports the first hypothesis. However the thickness of the ice sheet does have a greater effect on the hydraulic gradient than expected in hypothesis two. This could be because the relatively short distance from the glacial margin to the Delaware River and the shallow depth of the Coastal Plain aquifer are not enough to accommodate the heads produced by a thick glacier. Basal melt rate seemed to have an insignificant role in determining head distribution for the glaciated systems. However, surface recharge rate of the present non-glaciated system had a significant role in determining head magnitude and distribution of the system. This suggests that the thickness of the glacier and the subglacial water film thickness are the determining variables for the subglacial hydrology of New Jersey. With the presence of a subglacial water film, the aquifers are able to distribute water pressures more evenly throughout the system beneath the glacier (Fig. 13). This produces higher heads directly beneath the glacier but allow for a shallower hydraulic gradient whereras the lack of a subglacial water film produces a high hydraulic gradient especially beneath the glacial margin. 27
 shown in blue features a 7 mm subglacial water film whereas Series 2 (S2) shown in red has no subglacial water film.")
29 Figure 13. A series of boxplots representing each model trial using the variables outlined on Table I. Series 1 (S1) shown in blue features a 7 mm subglacial water film whereas Series 2 (S2) shown in red has no subglacial water film. Trial 1 of both series models a glacier with a shear stress of 20 kn m -2 while trial 2 of both series models a glacier with a shear stress of 150 kn m -2. Trials 1 through 4 of their respective series share the same distribution geometry but on a different scale which suggests a linear relationship between head distribution and glacial thickness. Series 2 however is highly positively skewed while series 1 is more negatively skewed with trials 2 and 3 more resembling present conditions. As the glacier forms and melts, the groundwater response would have most likely followed a specific series of head distributions over time as depicted in figure 14 where prior to glaciation the 28
30 groundwater system would most have likely resembled the model of the present day conditions (Fig. 11) with the highest heads near the center of the basin and the lowest heads at the Hudson and Delaware Rivers. The most likely system that would have existed during the Last Glacial Maximum may have been a thick glacier, dry at the base glacier similar to what is modeled in Series 2 Trial 2 (Fig. 12). During the melting period of the glacier the likely system that existed may have been a low profile glacier which was wet at the base such as the system modeled in Series 1 Trial 3 (Fig. 12). Figure 14. The significant trial boxplots from figure 13 placed in a time series resembling pre-glacial conditions (Present), glacial maximum conditions (Series 2 Trial 2), melting conditions (Series 1 Trial 3), and present day conditions (Present). However, present day conditions may be altered by glaciated conditions where transient flow models are required to model such a response. 29
31 V. ACKNOWLEDGMENTS I would like to thank Dr. Karen Prestegaard for her guidance on research, writing, and development of this thesis. I would also like to thank Dr. Richard Winston for his advice and input on my MODFLOW constructed model. VI. BIBLIOGRAPHY Alley, R.B., (1989), Water-pressure Coupling of Sliding and Bed Deformation: Journal of Glaciology, Number 119, 1989, pp (11) Bell, R. E. (May 01, 2008). The role of subglacial water in ice-sheet mass balance. Nature Geoscience, 1, 5, Boulton, G.S., Caban, P. E., Van Gijssel, K., (1995a), Groundwater flow beneath ice sheets: Part I - Large scale patterns, Quaternary Science Reviews Volume 14, Issue 6, 1995, Pages Boulton, G.S., Caban, P. E., (1995b), Groundwater flow beneath ice sheets: Part II - Its impact on glacier tectonic structures and moraine formation, Quaternary Science Reviews Volume 14, Issue 6, 1995, Pages Breemer, C. W., Clark, P. U., & Haggerty, R. (June 01, 2002). Modeling the subglacial hydrology of the late Pleistocene Lake Michigan Lobe, Laurentide Ice Sheet. Geological Society of America Bulletin, 114, 6, Carlson, A. E., Anslow, F. S., Obbink, E. A., LeGrande, A. N., Ullman, D. J., & Licciardi, J. M. (December 01, 2009). Surface-melt driven Laurentide Ice Sheet retreat during the early Holocene. Geophysical Research Letters, 36, 24.) 30
32 Carlson, A. E., Jenson, J. W., & Clark, P. U. (January 01, 2007). Modeling the subglacial hydrology of the James Lobe of the Laurentide Ice Sheet. Quaternary Science Reviews, 26, Charles G. Emmanuel, Behroozi Cyrus, Shooley Jack, Hoffman L. Jeffrey, (1993). A Method for Evaluating Ground-Water-Recharge Areas in New Jersey. Watershed Protection Programs, NJ Water Supply Authority Clark, P. U., Licciardi, J. M., MacAyeal, D. R., & Jenson, J. W. (January 01, 1996). Numerical reconstruction of a soft-bedded Laurentide Ice Sheet during the last glacial maximum. Geology, 24, 8, 679. Daniel J. Van Abs. (September 2000) Water Budget in the Raritan River Basin, NJ Water Supply Authority. Drake, Avery A. Jr.,Volkert, Richard, A., Monteverde, Donald H., Herman,Gregory C., Houghton,Hugh F., Parker, Ronald A., and Dalton, Richard F., Bedrock Geologic Map of Northern New Jersey, (1997), The U.S. Geological Survey, Map I-2540-A, scale 1:100,000 Dyke, A. S. (2004), "An outline of North American Deglaciation with emphasis on central and northern Canada" in Quaternary Glaciations- Extent and Chronology, Part II, p , J. Ehlers and P. L. Gibbard, eds, Elsevier Dyke, A.S., Andrews, J.T., Clark, P.U., England, J.H., Miller, G.H., Shaw, J. and Veillette, J.J The Laurentide and Innuitian ice sheets during the Last Glacial Maximum. Quaternary Science Reviews, 21, Dyke, A. S., & Prest, V. K. (1987). Late Wisconsinan and Holocene history of the Laurentide ice sheet. Géographie physique et Quaternaire, 41(2),
33 Glasser, N. F., & Bennett, M. R. (March 01, 2004). Glacial erosional landforms: origins and significance for palaeoglaciology. Progress in Physical Geography, 28, 1, Glenn, J. W., (1958). The Flow Law of Ice, The Physics Dept. Birmingham University, England. Harbaugh, Arlen W.,MODFLOW-2005, The U.S. Geological Survey Modular Ground- Water Model the Ground-Water Flow Process, (2005), The U.S. Geological Survey, Techniques and Methods 6-A16 Martin, M. M., & Geological Survey (U.S.). (1998). Ground-water flow in the New Jersey coastal plain. Reston, VA: U.S. Geological Survey. Mennel, William J.,Canace, Robert (ed.), Department of Environmental Protection (NJDEP), Division of Land Use Management, New Jersey, Geological Survey (NJGS), New Jersey Geological Survey Hydro Database, (January, 01, 2002), New Jersey Geological Survey, Trenton, New Jersey, Ed. 6.0 (2012) New Jersey Department of Environmental Protection (NJDEP), New Jersey Geologic Survey (NJGS), (1990, Revised 1991, 1995, 2002, 2005), Glacial Sediments of New Jersey, NJDEP/NJGS, Trenton, NJ, Digital Geologic Series DGS 96-1 New Jersey Department of Environmental Protection (NJDEP), New Jersey Geologic Survey (NJGS), Pristas, R.S. (ed.), (June, 30, 2002), Physiographic Provinces of New Jersey, NJDEP/NJGS, Trenton, NJ, Digital Geologic Series DGS02-7 Orowan, E., and H. F. Perutz, (1949). The flow of ice and other solids. Journal of Glaciology, 1,
34 Owens, J.P.; Sugarman, P.J.; Sohl, N.F.; Parker, R.A.; Houghton, H.F.; Volkert, R.A.; Drake, A.A., Jr.; Orndorff, R.C.; Bybell, L.M.; Andrews, G.W.; Bukry, David; Zapeecza, O.S.; Paulachok, G.N.; Mullikin, Lloyd, Bedrock geologic map of central and southern New Jersey, 1998, The U.S. Geological Survey, Map I-2540-B, scale 1:100,000 Piotrowski, J. A. (January 01, 1997). Subglacial groundwater flow during the last glaciation in northwestern Germany. Sedimentary Geology, 111, Romm, E.S., 1966, Flow characteristics of fractured rocks: Moscow, USSR, Nedra. Serfes, M. E., Natural ground-water quality in bedrock of the Newark Basin, New Jersey (1994), New Jersey Geological Survey, Report GSR-35, 28 p. Serfes, M. E., Natural ground-water quality in the Middle Proterozoic and lower Paleozoic bedrock aquifers of the Highlands and Valley Physiographic Provinces of New Jersey, (2004), New Jersey Geological Survey, Report GSR-39. Shaw, J., Kvill, D., & Rains, B. (May 01, 1989). Drumlins and catastrophic subglacial floods. Sedimentary Geology, 62,

35 VII. APPENDIX Appendix A 34

36 Appendix B 35

37 Appendix C Appendix D 36

38 Appendix E 37
Glacial Modification of Terrain
 Glacial Modification Part I Stupendous glaciers and crystal snowflakes -- every form of animate or inanimate existence leaves its impress upon the soul of man. 1 -Orison Swett Marden Glacial Modification
Prentice Hall EARTH SCIENCE
 Prentice Hall EARTH SCIENCE Tarbuck Lutgens Chapter 7 Glaciers, Desert, and Wind 7.1 Glaciers Types of Glaciers A glacier is a thick ice mass that forms above the snowline over hundreds or thousands of
Glaciers. (Shaping Earth s Surface, Part 6) Science 330 Summer 2005
 Science 330 Summer 2005") Glaciers (Shaping Earth s Surface, Part 6) Science 330 Summer 2005 1 Glaciers Glaciers are parts of two basic cycles Hydrologic cycle Rock cycle Glacier a thick mass of ice that originates on land from
Glaciers (Shaping Earth s Surface, Part 6) Science 330 Summer 2005 1 Glaciers Glaciers are parts of two basic cycles Hydrologic cycle Rock cycle Glacier a thick mass of ice that originates on land from
Glaciers Earth 9th Edition Chapter 18 Glaciers: summary in haiku form Key Concepts Glaciers Glaciers Glaciers Glaciers
 1 2 3 4 5 6 7 8 9 10 11 12 13 14 Earth 9 th Edition Chapter 18 : summary in haiku form Ten thousand years thence big glaciers began to melt - called "global warming." Key Concepts and types of glaciers.
Michigan s Geology and Groundwater
 Michigan s Geology and Groundwater Ralph J. Haefner Deputy Director U.S. Geological Survey Michigan-Ohio Water Science Center Lansing, Michigan Outline About the USGS Geology 101 Michigan s geology Bedrock
4. The map below shows a meandering stream. Points A, B, C, and D represent locations along the stream bottom.
 1. Sediment is deposited as a river enters a lake because the A) velocity of the river decreases B) force of gravity decreases C) volume of water increases D) slope of the river increases 2. Which diagram
Lecture Outlines PowerPoint. Chapter 6 Earth Science 11e Tarbuck/Lutgens
 Lecture Outlines PowerPoint Chapter 6 Earth Science 11e Tarbuck/Lutgens 2006 Pearson Prentice Hall This work is protected by United States copyright laws and is provided solely for the use of instructors
Geology and New England Landscapes
 Geology and New England Landscapes Jim Turenne, CPSS USDA-NRCS Warwick, RI. http://nesoil.com Why Geology? Provides the big picture of site conditions. Major part of soil formation (parent material and
Landscape. Review Note Cards
 Landscape Review Note Cards Last Ice Age Pleistocene Epoch that occurred about 22,000 Years ago Glacier A large, long lasting mass of ice which forms on land and moves downhill because of gravity. Continental
T. Perron Glaciers 1. Glaciers
 T. Perron 12.001 Glaciers 1 Glaciers I. Why study glaciers? [PPT: Perito Moreno glacier, Argentina] Role in freshwater budget o Fraction of earth s water that is fresh (non-saline): 3% o Fraction of earth
4. What type of glacier forms in a sloping valley between rock walls? a. firn glacier b. ice sheet c. cirque d. alpine glacier
 Multiple Choice Questions 1. The term means the loss of snow and ice by evaporation and melting. a. sublimation b. ablation c. erosion d. abrasion 2. What condition must be met for a glacier to begin flowing
Soils, Hydrogeology, and Aquifer Properties. Philip B. Bedient 2006 Rice University
 Soils, Hydrogeology, and Aquifer Properties Philip B. Bedient 2006 Rice University Charbeneau, 2000. Basin Hydrologic Cycle Global Water Supply Distribution 3% of earth s water is fresh - 97% oceans 1%
1.72, Groundwater Hydrology Prof. Charles Harvey Lecture Packet #5: Groundwater Flow Patterns. Local Flow System. Intermediate Flow System
 1.72, Groundwater Hydrology Prof. Charles Harvey Lecture Packet #5: Groundwater Flow Patterns c Local Flow System 10,000 feet Intermediate Flow System Regional Flow System 20,000 feet Hydrologic section
Ice Cap Glaciers in the Arctic Region. John Evans Glacier, Ellesmere Island (Robert Bingham, U. Aberdeen)
") Ice Cap Glaciers in the Arctic Region John Evans Glacier, Ellesmere Island (Robert Bingham, U. Aberdeen) Iceland Svalbard Ellesmere and Baffin Islands Severny and Anzhu Islands Topics: Temperate vs non-temperate
Ice Cap Glaciers in the Arctic Region John Evans Glacier, Ellesmere Island (Robert Bingham, U. Aberdeen) Iceland Svalbard Ellesmere and Baffin Islands Severny and Anzhu Islands Topics: Temperate vs non-temperate
11/22/2010. Groundwater in Unconsolidated Deposits. Alluvial (fluvial) deposits. - consist of gravel, sand, silt and clay
 deposits. - consist of gravel, sand, silt and clay") Groundwater in Unconsolidated Deposits Alluvial (fluvial) deposits - consist of gravel, sand, silt and clay - laid down by physical processes in rivers and flood plains - major sources for water supplies
Groundwater in Unconsolidated Deposits Alluvial (fluvial) deposits - consist of gravel, sand, silt and clay - laid down by physical processes in rivers and flood plains - major sources for water supplies
GEOL.3250 Geology for Engineers Glacial Geology
 GEOL.3250 Geology for Engineers Glacial Geology NAME Part I: Continental Glaciation Continental glaciers are large ice sheets that cover substantial portions of the land area. In the region of accumulation
Chapter 5: Glaciers and Deserts
 I. Glaciers and Glaciation Chapter 5: Glaciers and Deserts A. A thick mass of ice that forms over land from the compaction and recrystallization of snow and shows evidence of past or present flow B. Types
1. Any process that causes rock to crack or break into pieces is called physical weathering. Initial product = final product
 Weathering 1. Any process that causes rock to crack or break into pieces is called physical weathering. Initial product = final product End Result of physical weathering is increased surface area. 2. Physical
Name: Mid-Year Review #2 SAR
 Name: Mid-Year Review #2 SAR Base your answers to questions 1 through 3 on on the diagram below, which shows laboratory materials used for an investigation of the effects of sediment size on permeability,
PHYSICAL GEOGRAPHY. By Brett Lucas
 PHYSICAL GEOGRAPHY By Brett Lucas GLACIAL PROCESSES Glacial Processes The Impact of Glaciers on the Landscape Glaciations Past and Present Types of Glaciers Glacier Formation and Movement The Effects of
Foundations of Earth Science, 6e Lutgens, Tarbuck, & Tasa
 Foundations of Earth Science, 6e Lutgens, Tarbuck, & Tasa Glacial and Arid Landscapes Foundations, 6e - Chapter 4 Stan Hatfield Southwestern Illinois College Glaciers Glaciers are parts of two basic cycles
Name: Which rock layers appear to be most resistant to weathering? A) A, C, and E B) B and D
 A, C, and E B) B and D") Name: 1) The formation of soil is primarily the result of A) stream deposition and runoff B) precipitation and wind erosion C) stream erosion and mass movement D) weathering and biological activity 2)
Name: 1) The formation of soil is primarily the result of A) stream deposition and runoff B) precipitation and wind erosion C) stream erosion and mass movement D) weathering and biological activity 2)
The Building of the NYC Region
 The Building of the NYC Region Definitions Fall Line marks the area where an upland region (continental bedrock) and a coastal plain meet Piedmont the plateau region of the eastern United States which
Lecture Outline Lecture Outline Monday April 9-16, 2018 Questions? Announcements:
 Lecture Outline Lecture Outline Monday April 9-16, 2018 Questions? Announcements: Geology 101 Night Video: The Day After Tomorrow Hollywood disaster movie about the onset of a glacial period When: Monday
Glacial processes and landforms NGEA01, 2014
 Glacial processes and landforms NGEA01, 2014 Cecilia Akselsson Department of Physical Geography and Ecosystem Science Lund University Geomorphological processes and landforms all over the world Periglacial
Bell Ringer. Are soil and dirt the same material? In your explanation be sure to talk about plants.
 Bell Ringer Are soil and dirt the same material? In your explanation be sure to talk about plants. 5.3 Mass Movements Triggers of Mass Movements The transfer of rock and soil downslope due to gravity is
Name. 4. The diagram below shows a soil profile formed in an area of granite bedrock. Four different soil horizons, A, B, C, and D, are shown.
 Name 1. In the cross section of the hill shown below, which rock units are probably most resistant to weathering? 4. The diagram below shows a soil profile formed in an area of granite bedrock. Four different
How do glaciers form?
 Glaciers What is a Glacier? A large mass of moving ice that exists year round is called a glacier. Glaciers are formed when snowfall exceeds snow melt year after year Snow and ice remain on the ground
EPS 50 - Lab 10: Groundwater Flow and Glaciers
 Name: EPS 50 - Lab 10: Groundwater Flow and Glaciers Part 1: Groundwater Flow Part 2: Darcy s Law Part 3: Glacial Deposits and Flow -Chapter 17, p. 478-492: Hydrology of Groundwater -Chapter 17, p. 485-486:
CARD #1 The Shape of the Land: Effects of Crustal Tilting
 CARD #1 The Shape of the Land: Effects of Crustal Tilting When we look at a birds-eye view of the Great Lakes, it is easy to assume the lakes are all at a similar elevation, but viewed in this way, we
Surface Processes Focus on Mass Wasting (Chapter 10)
") Surface Processes Focus on Mass Wasting (Chapter 10) 1. What is the distinction between weathering, mass wasting, and erosion? 2. What is the controlling force in mass wasting? What force provides resistance?
Surface Processes Focus on Mass Wasting (Chapter 10) 1. What is the distinction between weathering, mass wasting, and erosion? 2. What is the controlling force in mass wasting? What force provides resistance?
Which landscape best represents the shape of the valleys occupied by glaciers? A) B) C) D)
 B) C) D)") 1. Glaciers often form parallel scratches and grooves in bedrock because glaciers A) deposit sediment in unsorted piles B) deposit rounded sand in V-shaped valleys C) continually melt and refreeze D) drag
1. Glaciers often form parallel scratches and grooves in bedrock because glaciers A) deposit sediment in unsorted piles B) deposit rounded sand in V-shaped valleys C) continually melt and refreeze D) drag
Continental Landscapes
 Continental Landscapes Landscape influenced by tectonics, climate & differential weathering Most landforms developed within the last 2 million years System moves toward an equilibrium Continental Landscapes
,Baynes Lake. TO...?&.?...A 2...KO.?'!!&... Sr. *logical Engineer
 > i evernment OF BRITISH COLUMBIA a TO...?&.?...A 2....KO.?'!!&... Sr. *logical Engineer... Grou,,water. Section Hydrology Division Wat.er... In~.~s.tiga.ti.On.s..Branck.... 5 u BJECT...C;.roun.dw.ater...Snve
Class Notes: Surface Processes
 Name: Date: Period: Surface Processes The Physical Setting: Earth Science Class Notes: Surface Processes I. Weathering and Soils Weathering -! Sediments -! Weathering occurs when rocks are exposed to:
The Geology of Sebago Lake State Park
 Maine Geologic Facts and Localities September, 2002 43 55 17.46 N, 70 34 13.07 W Text by Robert Johnston, Department of Agriculture, Conservation & Forestry 1 Map by Robert Johnston Introduction Sebago
Jim Turenne. Soils on Social Media
 Jim Turenne USDA-NRCS 60 Quaker Lane, Suite 46 Warwick, RI. 02886 401-822-8832 Jim.turenne@ri.usda.gov Soils on Social Media www.twitter.com/soilsne www.fb.com/soilsne www.nesoil.com U.S. Department of
Chapter 2. Wearing Down Landforms: Rivers and Ice. Physical Weathering
 Chapter 2 Wearing Down Landforms: Rivers and Ice Physical Weathering Weathering vs. Erosion Weathering is the breakdown of rock and minerals. Erosion is a two fold process that starts with 1) breakdown
What is a Glacier? Types of Glaciers
 Alpine & Continental Glaciers Glacial Mass Balance Glacial Ice Formation Glacial Movement & Erosion Erosional and Depositional Landforms The Pleistocene Epoch Geomorphology of SW Manitoba Chapter 17 1
Land subsidence due to groundwater withdrawal in Hanoi, Vietnam
 Land Subsidence (Proceedings of the Fifth International Symposium on Land Subsidence, The Hague, October 1995). 1AHS Publ. no. 234, 1995. 55 Land subsidence due to groundwater withdrawal in Hanoi, Vietnam
Glaciers form wherever snow and ice can accumulate High latitudes High mountains at low latitudes Ice temperatures vary among glaciers Warm
 The Cryosphere Glaciers form wherever snow and ice can accumulate High latitudes High mountains at low latitudes Ice temperatures vary among glaciers Warm (temperate) glaciers: at pressure melting point,
Basin Analysis Applied to Modelling Buried Valleys in the Great Lakes Basin
 EARTH SCIENCES SECTOR GENERAL INFORMATION PRODUCT 35 Basin Analysis Applied to Modelling Buried Valleys in the Great Lakes Basin Sharpe, D R; Russell, H A J 2004 Originally released as: Basin Analysis
mountain rivers fixed channel boundaries (bedrock banks and bed) high transport capacity low storage input output
 high transport capacity low storage input output") mountain rivers fixed channel boundaries (bedrock banks and bed) high transport capacity low storage input output strong interaction between streams & hillslopes Sediment Budgets for Mountain Rivers Little
mountain rivers fixed channel boundaries (bedrock banks and bed) high transport capacity low storage input output strong interaction between streams & hillslopes Sediment Budgets for Mountain Rivers Little
AWRA PMAS Engineers Club of Philadelphia. A Geologic Perspective on Stormwater
 AWRA PMAS Engineers Club of Philadelphia A Geologic Perspective on Stormwater Toby J. Kessler, P.G. Hydrogeologist Trevor G. Woodward, P.G. Engineering Geologist September 10, 2014 Gilmore & Associates,
Changing Landscapes: Glaciated Landscapes. How do glaciers move?
 Changing Landscapes: Glaciated Landscapes How do glaciers move? What you need to know Differences between cold-and warm-based glaciers, their locations and rates of movement Glacier ice movement including
Chapter 2. Denudation: Rivers and Ice
 Chapter 2. Denudation: Rivers and Ice DENUDATION: process that lowers level of land - caused by rivers, glaciers, waves & wind - involves processes of WEATHERING & EROSION Weathering Def: breakdown of
What are the different ways rocks can be weathered?
 Romano - 223 What are the different ways rocks can be weathered? Weathering - the breakdown of rocks and minerals at the Earth s surface 1. 2. PHYSICAL WEATHERING Rock is broken into smaller pieces with
Impact of the Danube River on the groundwater dynamics in the Kozloduy Lowland
 GEOLOGICA BALCANICA, 46 (2), Sofia, Nov. 2017, pp. 33 39. Impact of the Danube River on the groundwater dynamics in the Kozloduy Lowland Peter Gerginov Geological Institute, Bulgarian Academy of Sciences,
Lake Levels and Climate Change in Maine and Eastern North America during the last 12,000 years
 Maine Geologic Facts and Localities December, 2000 Lake Levels and Climate Change in Maine and Eastern North America during the last 12,000 years Text by Robert A. Johnston, Department of Agriculture,
Ice on Earth: An overview and examples on physical properties
 Ice on Earth: An overview and examples on physical properties - Ice on Earth during the Pleistocene - Present-day polar and temperate ice masses - Transformation of snow to ice - Mass balance, ice deformation,
Maximum Extent of Pleistocene Glaciation - 1/3 of land surface Most recent glacial maximum peaked 18,000 years ago and is considered to have ended
 Glaciers Maximum Extent of Pleistocene Glaciation - 1/3 of land surface Most recent glacial maximum peaked 18,000 years ago and is considered to have ended 10,000 B.P. Current Extent of Glaciation - about
Guided Notes Surface Processes. Erosion & Deposition By: Glaciers
 Guided Notes Surface Processes Erosion & Deposition By: Glaciers K. Coder 2015 26) How does moving ice erode and deposit sediments? Glaciers (Movement of Ice): a naturally formed mass of ice and snow that
Landslides and Ground Water Permeability with Respect to the. Contact Point of Glacial Lake Vermont and the Champlain Sea
 Landslides and Ground Water Permeability with Respect to the Contact Point of Glacial Lake Vermont and the Champlain Sea Sediments at Town Line Brook, Winooski, VT Michala Peabody Lara Vowles Abstract:
Chapter 3 Erosion and Deposition. The Big Question:
 Chapter 3 Erosion and Deposition The Big Question: 1 Design a way to represent and describe the 4 types of mass movement. You may use pictures, diagrams, list, web, chart, etc 2 Chapter 3: Erosion and
Which map shows the stream drainage pattern that most likely formed on the surface of this volcano? A) B)
 B)") 1. When snow cover on the land melts, the water will most likely become surface runoff if the land surface is A) frozen B) porous C) grass covered D) unconsolidated gravel Base your answers to questions
1. When snow cover on the land melts, the water will most likely become surface runoff if the land surface is A) frozen B) porous C) grass covered D) unconsolidated gravel Base your answers to questions
4 Formation of glacial ice 3. 5 Formation of glacial ice (cont.) 3. 6 Glacier economy and general flow structure 4
 3. 6 Glacier economy and general flow structure 4") Contents 1 Glacier Flow 2 2 Definition 2 3 Amount 3 4 Formation of glacial ice 3 5 Formation of glacial ice (cont.) 3 6 Glacier economy and general flow structure 4 7 Example 5 8 Examples 6 9 Ice movement
Contents 1 Glacier Flow 2 2 Definition 2 3 Amount 3 4 Formation of glacial ice 3 5 Formation of glacial ice (cont.) 3 6 Glacier economy and general flow structure 4 7 Example 5 8 Examples 6 9 Ice movement
2/23/2009. Visualizing Earth Science. Chapter Overview. Deserts and Drylands. Glaciers and Ice Sheets
 Visualizing Earth Science By Z. Merali and B. F. Skinner Chapter 6 Deserts, Glaciers and Ice Sheets Chapter Overview Deserts and Drylands Glaciers and Ice Sheets Deserts Geography Categorization of deserts
Chapter 8 Fetter, Applied Hydrology 4 th Edition, Geology of Groundwater Occurrence
 Chapter 8 Fetter, Applied Hydrology 4 th Edition, 2001 Geology of Groundwater Occurrence Figure 8.42. Alluvial Valleys ground-water region. Fetter, Applied Hydrology 4 th Edition, 2001 Fetter, Applied
Supplementary Fig. 1. Locations of thinning transects and photos of example samples. Mt Suess/Gondola Ridge transects extended metres above
 Supplementary Fig. 1. Locations of thinning transects and photos of example samples. Mt Suess/Gondola Ridge transects extended 260 24 metres above the modern surface of Mackay Glacier, and included 16
Neogene Uplift of The Barents Sea
 Neogene Uplift of The Barents Sea W. Fjeldskaar A. Amantov Tectonor/UiS, Stavanger, Norway FORCE seminar April 4, 2013 The project (2010-2012) Funding companies Flat Objective The objective of the work
The Geology of Two Lights State Park. Cape Elizabeth, Maine
 Maine Geologic Facts and Localities June, 2002 Cape Elizabeth, Maine 43 33 33.48 N, 70 12 13.32 W Text by Henry N. Berry IV and Robert G. Marvinney, Department of Agriculture, Conservation & Forestry 1
Lecture 10 Glaciers and glaciation
 Lecture 10 Glaciers and glaciation Outline Importance of ice to people! Basics of glaciers formation, classification, mechanisms of movement Glacial landscapes erosion and deposition by glaciers and the
STREAM SYSTEMS and FLOODS
 STREAM SYSTEMS and FLOODS The Hydrologic Cycle Precipitation Evaporation Infiltration Runoff Transpiration Earth s Water and the Hydrologic Cycle The Hydrologic Cycle The Hydrologic Cycle Oceans not filling
Precipitation Evaporation Infiltration Earth s Water and the Hydrologic Cycle. Runoff Transpiration
 STREAM SYSTEMS and FLOODS The Hydrologic Cycle Precipitation Evaporation Infiltration Earth s Water and the Hydrologic Cycle Runoff Transpiration The Hydrologic Cycle The Hydrologic Cycle Oceans not filling
Glacier Hydrology. Why should you care?
 Glacier Hydrology Why should you care? Climate Local Meteorology Surface Mass And Energy Exchange Net Mass Balance Dynamic Response Effect on Landscape Changes In Geometry Water Flow PRACTICAL MATTERS:
Name: Class: Date: Multiple Choice Identify the letter of the choice that best completes the statement or answers the question.
 Name: Class: Date: geology ch 7 test 2008 Multiple Choice Identify the letter of the choice that best completes the statement or answers the question. 1. Which of the following is true about ice sheets?
HYDROGEOLOGIC FRAMEWORK OF LONG ISLAND'S NORTH FORK, SUFFOLK COUNTY, NEW YORK
 HYDROGEOLOGIC FRAMEWORK OF LONG ISLAND'S NORTH FORK, SUFFOLK COUNTY, NEW YORK Christopher E. Schubert 1, Richard E. Bova 2, and Paul E. Misut 1 1 U.S. Geological Survey, 2045 Route 112, Building 4, Coram,
Waterways from glaciers to coastal waters in Iceland. Jórunn Harðardóttir, IMO Nordic WFD conference September 26, 2012
 Waterways from glaciers to coastal waters in Iceland Jórunn Harðardóttir, IMO Nordic WFD conference September 26, 2012 What to include and what not to include? Hydrology of Iceland Much on glaciers and
Unit 3 Review - Surface Processes
 Unit 3 Review - Surface Processes 1. Why is the surface of Mercury covered with meteor impact craters, while Earth s surface has relatively few craters? A) Mercury is larger than Earth, so it gets hit
Summer School in Glaciology, Fairbanks/McCarthy, Exercises: Glacial geology
 Bob Anderson Summer School in Glaciology, Fairbanks/McCarthy, 2010 Exercises: Glacial geology 1. Glacier thickness. We wish to estimate the local thickness of a glacier given only a topographic map of
IPMO2-1. Groundwater Modelling of Chiang Rai Basin, Northern Thailand. Sattaya Intanum* Dr.Schradh Saenton**
 IPMO2-1 Groundwater Modelling of Chiang Rai Basin, Northern Thailand Sattaya Intanum* Dr.Schradh Saenton** ABSTRACT Chiang Rai basin, situated in Chiang Rai and Phayao provinces covering an area of 11,000
Geophysical Surveys for Groundwater Modelling of Coastal Golf Courses
 1 Geophysical Surveys for Groundwater Modelling of Coastal Golf Courses C. RICHARD BATES and RUTH ROBINSON Sedimentary Systems Research Group, University of St. Andrews, St. Andrews, Scotland Abstract
1. Base your answer to the following question on the map below, which shows the generalized bedrock of a part of western New York State.
 1. Base your answer to the following question on the map below, which shows the generalized bedrock of a part of western New York State. 3. The table below describes the deposits that an observer saw while
HYDROGEOLOGICAL CONCEPTUAL MODEL OF A COMPLEX AQUIFER SYSTEM CENTRAL KALAHARI BASIN (BOTSWANA) DATE: 27 OCTOBER 2016 VENUE: GICC
 DATE: 27 OCTOBER 2016 VENUE: GICC") HYDROGEOLOGICAL CONCEPTUAL MODEL OF A COMPLEX AQUIFER SYSTEM CENTRAL KALAHARI BASIN (BOTSWANA) DATE: 27 OCTOBER 2016 VENUE: GICC MR. M. LEKULA DR. M.W. LUBCZYNSKI PROF. E.M. SHEMANG PRESENTATION OUTLINE
HYDROGEOLOGICAL CONCEPTUAL MODEL OF A COMPLEX AQUIFER SYSTEM CENTRAL KALAHARI BASIN (BOTSWANA) DATE: 27 OCTOBER 2016 VENUE: GICC MR. M. LEKULA DR. M.W. LUBCZYNSKI PROF. E.M. SHEMANG PRESENTATION OUTLINE
Page 1. Name:
 Name: 1) Which property would best distinguish sediment deposited by a river from sediment deposited by a glacier? thickness of sediment layers age of fossils found in the sediment mineral composition
Glacial Deposition and Groundwater in Dutchess County
 Glacial Deposition and Groundwater in Dutchess County Name: Period: Thousands of years ago an enormous ice sheet blanketed the Hudson Valley in what was called the Wisconsinan Glaciation. The ice reshaped
Maggie Payne Jim Turenne
 Maggie Payne Jim Turenne USDA-NRCS 60 Quaker Lane, Suite 46 Warwick, RI. 02886 401-822-8832 maggie.payne@ri.usda.gov U.S. Department of Agriculture 1935: Soil Conservation Service (SCS) Natural Resources
Assessing Groundwater Vulnerability and Contaminant Pathways at MCAS Beaufort, SC
 Assessing Groundwater Vulnerability and Contaminant Pathways at MCAS Beaufort, SC James M. Rine, John M. Shafer, Elzbieta Covington Abstract A project to assess the vulnerability of groundwater resources
3/5/05 Dr. Stewart 1
 I. Physiography of Appalachian Mountains A. Introduction 1. These mountains extend from NE Canada to Georgia 2. They are the remains of a deeply eroded, ancient mountain chain once larger than the Himalayans
Description DESCRIPTION
 DESCRIPTION The location of the Upper James Watershed is located in northeastern South Dakota as well as southeastern North Dakota. It includes the following counties located in North Dakota Barnes, Dickey,
39 Mars Ice: Intermediate and Distant Past. James W. Head Brown University Providence, RI
 39 Mars Ice: Intermediate and Distant Past James W. Head Brown University Providence, RI james_head@brown.edu 37 Follow the Water on Mars: 1. Introduction: Current Environments and the Traditional View
Groundwater Hydrology
 EXERCISE 12 Groundwater Hydrology INTRODUCTION Groundwater is an important component of the hydrologic cycle. It feeds lakes, rivers, wetlands, and reservoirs; it supplies water for domestic, municipal,
The Palmer Hill Glacial-Marine Delta, Whitefield, Maine
 Maine Geologic Facts and Localities December, 2010, Maine 44 o 10 12.16 N, 69 o 37 18.93 W Text by Woodrow Thompson, Department of Agriculture, Conservation & Forestry 1 Introduction The most recent continental
Glacial Geomorphology Lecture 1: Glaciers & Glacial Environments. GGY 166: Geomorphology of Southern Africa
 Glacial Geomorphology Lecture 1: Glaciers & Glacial Environments GGY 166: Geomorphology of Southern Africa Relevance in Southern African Context South African landscape has been influenced by glacial action
3. GEOLOGY. 3.1 Introduction. 3.2 Results and Discussion Regional Geology Surficial Geology Mine Study Area
 3. GEOLOGY 3.1 Introduction This chapter discusses the baseline study of the geology and mineralization characteristics of the mine study area. The study consolidates existing geological data and exploration
GEOLOGY CURRICULUM. Unit 1: Introduction to Geology
 Chariho Regional School District - Science Curriculum September, 2016 GEOLOGY CURRICULUM Unit 1: Introduction to Geology OVERVIEW Summary In this unit students will be introduced to the field of geology.
GEOL Introductory Geology: Exploring Planet Earth Fall 2010 Test #2 October 18, 2010
 GEOL 101 - Introductory Geology: Exploring Planet Earth Fall 2010 Test #2 October 18, 2010 Name KEY ID# KEY Multiple choice questions (2 points each). 1. What type of metamorphic rock is formed over large
Chapter 9 Notes: Ice and Glaciers, Wind and Deserts
 Chapter 9 Notes: Ice and Glaciers, Wind and Deserts *Glaciers and Glacial Features glacier is a mass of ice that moves over land under its own weight through the action of gravity Glacier Formation must
Mark S. Nordberg Geology and Groundwater Investigations Section North Central Region Office California Department of Water Resources
 Mark S. Nordberg Geology and Groundwater Investigations Section North Central Region Office California Department of Water Resources Ukiah Drought Workshop July 29, 2009 Groundwater 101 Groundwater is
Answers: Internal Processes and Structures (Isostasy)
") Answers: Internal Processes and Structures (Isostasy) 1. Analyse the adjustment of the crust to changes in loads associated with volcanism, mountain building, erosion, and glaciation by using the concept
Answers: Internal Processes and Structures (Isostasy) 1. Analyse the adjustment of the crust to changes in loads associated with volcanism, mountain building, erosion, and glaciation by using the concept
INDEX_Glaciers.pdf. mountain (alpine) glacier NLG Test bank: [Glaciers01-03.jpg] High Quality: [Moraine_med-lat_Haines_AK_.jpg]
![INDEX_Glaciers.pdf. mountain (alpine) glacier NLG Test bank: [Glaciers01-03.jpg] High Quality: [Moraine_med-lat_Haines_AK_.jpg]](/thumbs/83/88580835.jpg "INDEX_Glaciers.pdf. mountain (alpine) glacier NLG Test bank: [Glaciers01-03.jpg] High Quality: [Moraine_med-lat_Haines_AK_.jpg]") Glaciers_INDEX.pdf This is an index of all terms/ideas in this question bank. Question banks are organized into topics containing related terms/ideas. Each term/idea has at least one related question,
Glaciers_INDEX.pdf This is an index of all terms/ideas in this question bank. Question banks are organized into topics containing related terms/ideas. Each term/idea has at least one related question,
Streams. Water. Hydrologic Cycle. Geol 104: Streams
 Streams Why study streams? Running water is the most important geologic agent in erosion, transportation and deposition of sediments. Water The unique physical and chemical properties of water make it
Mass Movements, Wind, and Glaciers
 Mass Movements,, and Glaciers SECTION 8.1 Mass Movement at Earth s Surface In your textbook, read about mass movement. Use each of the terms below just once to complete the passage. avalanche creep landslide
Site 4.7. Thornhill Drumlin Jane K. Hart
 Site 4.7. Thornhill Drumlin Jane K. Hart Introduction The drumlins in the West of Ireland represent some of the best exposured features in the whole of Britain and Ireland, and have been studied by numerous
RIVERS, GROUNDWATER, AND GLACIERS
 RIVERS, GROUNDWATER, AND GLACIERS Delta A fan-shaped deposit that forms when a river flows into a quiet or large body of water, such as a lake, an ocean, or an inland sea. Alluvial Fan A sloping triangle
The boulder was most likely moved to this location by A) glacial ice B) prevailing wind C) streamfiow D) volcanic action
 glacial ice B) prevailing wind C) streamfiow D) volcanic action") 1. Which rock material was most likely transported to its present location by a glacier? A) rounded sand grains found in a river delta B) rounded grains found in a sand dune C) residual soil found on a
1. Which rock material was most likely transported to its present location by a glacier? A) rounded sand grains found in a river delta B) rounded grains found in a sand dune C) residual soil found on a
Lowland Glaciation North Wales
 Lowland Glaciation North Wales Background Although there have been many glaciations and advances in ice, the most significant for this are was the Dimlington Stadial which was a period of glacial advance
MASS MOVEMENTS, WIND, AND GLACIERS
 Date Period Name MASS MOVEMENTS, WIND, AND GLACIERS SECTION.1 Mass Movements In your textbook, read about mass movements. Use each of the terms below just once to complete the passage. avalanche creep
Lecture 21: Glaciers and Paleoclimate Read: Chapter 15 Homework due Thursday Nov. 12. What we ll learn today:! Learning Objectives (LO)
") Learning Objectives (LO) Lecture 21: Glaciers and Paleoclimate Read: Chapter 15 Homework due Thursday Nov. 12 What we ll learn today:! 1. 1. Glaciers and where they occur! 2. 2. Compare depositional and
Learning Objectives (LO) Lecture 21: Glaciers and Paleoclimate Read: Chapter 15 Homework due Thursday Nov. 12 What we ll learn today:! 1. 1. Glaciers and where they occur! 2. 2. Compare depositional and
FORMATION OF GROUNDWATER IN SEDIMENTARY BASINS: TRADITIONAL AND ALTERNATIVE MODELS
 FORMATION OF GROUNDWATER IN SEDIMENTARY BASINS: TRADITIONAL AND ALTERNATIVE MODELS Albertas Bitinas Klaipėda University, Coastal Research and Planning Institute, H. Manto St. 84, Klaipėda, Lithuania, albertas.bitinas@corpi.ku.lt