Norway Grants. Activity 2. Building a 3D static geological model of the storage site and storage complex
|
|
|
- Dominick Eaton
- 6 years ago
- Views:
Transcription

1 Preparation for a pilot project of CO2 geological storage in the Czech Republic Activity 2 Norway Grants Juraj Francu Oldřich Krejčí Czech Geological Survey Brno Building a 3D static geological model of the storage site and storage complex Miroslav Pereszlényi Ondřej Prokop Lukáš Jurenka Fridtjof Riis IRIS Stavanger Praha, 8th November, 2016
2 Principle steps in building the 3D Model 1. Revised well logs and seismic data 2. Reservoir, seal, and faults 3. Preparation of data for Dynamic Modeling - Well tests and pressure data - Production history from individual wells 4. Data for Risk Analysis - Well completion after abandonment - Perforations, casings and cement plugs 5. Proposal of injection and monitoring wells


3 LBr-1 CO 2 -Storage Complex Well locations and 3D seismics Seismic data


4 Br-63 Well log presentation Whole profile Zoomed-in Badenian

5 Litofacies analysis of well logs LA 7 BR 35 BR 7 BR 60 BR 84 BR 90 BR 83 BR 87 Constant sandstones base of U. Badenian Shales of M. Badenian Seal Transgression of Lab hor. SEAL RESERVOIR Pinchout of Lab horizon Lower Badenian shales
6 Partial layers of the Lab reservoir SW NE Fault 1 L1 L2 L3 L4

7 Integration of seismics and well log data


8 Seismic Stratigraphy + Well logs Map of the Sarm. channel BR 71 BR 61 BR 83 Target CZ SVK


9 Mapping the surfaces and faults in time and depth domains Fault 3 Fault 1 Fault 4 Fault 2 Fault 2 Fault 3 Fault 1 N Eastern pinchout of the Lab reservoir N Fault 4

10 Seismic attribute analysis

11 3D Model in Petrel of the CO 2 Storage Complex 4 tops of the partial layers of the Lab reservoir Fault 1 L1 L2 L3 L4 Base of the Lab reservoir

12 3D Model of LBr-1 viewed from NW Colors show lithologies shale sand

13 3D LBr-1 Model viewed from NW intervals with properties Top Middle Badenian SEAL Partial reservoirs Top Lower Badenian

14 Strip off 3D Model of LBr-1 Slupkový 3D model LBr-1 Partial layers of the Lab reservoir with permeability

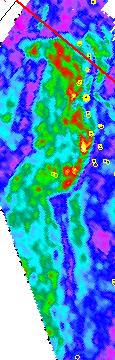
15 Average absolute amplitude of the Lab horizon Application of seismic attribute analysis made it possible to visualize more details in the architecture of the storage complex. The average absolute amplitude shows the residual hydrocarbon saturation of the reservoir = probable initial extent of the oil and gas field.


16 Analýza seismických atributů Povrch lábského obzorus atributem průměrná absolutní amplituda 3D pohled na povrch lábského obzoru s atributem průměrná absolutní amplituda

17 Net-to-Gross maps in the four partial horizons of the Lab reservoir N/G = sand thickness / reservoir layer thickness

18 Porosity of the partial reservoir layers Grey area = shale seal, blue contours = porosity of L1-L2-L3-L4
19 Tops (SSL) of the partial reservoir layers with Gas Cap Oil zone Aquifer Possible spill point Production data suggest partial communication among L1-L2-L3-L4
20 Summary of the 3D Model results: new and the archival reserves estimation Oil and Gas reserves estimated using the new 3D model OIL in place GAS in place Recoverable OIL Recoverable GAS thous. sm 3 mil. sm 3 thous. sm 3 mil. sm Oil and Gas reserves based on archival report (Šele 1960) OIL in place GAS in place Recoverable OIL Recoverable GAS thous. sm 3 mil. sm 3 thous. sm 3 mil. sm Cumulative production of Oil and Gas Archival report (Káňa 1998) Cumulative OIL Cumulative GAS thous. sm 3 mil. sm
 with measured depth (m) based on measurements in wells in the LBr1 Time: Sep 1957 Sep")
21 Add on properties Pressure and Temperature Formation Pressure (Mpa) Formation pressure evolution throughout the production history in LBr-1 Limited data during the main production interval Steady State Temperature ( C) with measured depth (m) based on measurements in wells in the LBr1 Time: Sep 1957 Sep 1997


22 Hydrogeochemical Model of saline and freshwater zones Map of the brines freshwater transition zone Sarmatian Karpatian Upper Badenian Middle Badenian Lab Horizon Lower Badenian BR71 BR69 BR70 BR64 BR88 BR27 BR87 brackish water closed structures freshwater opened structures

23 Hydrogeochemical zones with brines and freshwater in the LBr-1 overburden BR71 BR69 BR70 BR64 BR88 BR27 BR87 brackish water - closed structures Total salinity: freshwater to mg.l -1, transition zone from to mg.l -1, brackish water over mg.l -1
24 Data for Dynamic modeling and History Matching
25 Production, pressure and test data - individual wells Well Date Average Gas Daily Production per Month [thous. m 3 ] Number of Production Days BR64 1-Apr BR64 1-May-1966 BR64 1-Jun-1966 BR64 1-Jul-1966 BR64 1-Aug-1966 BR64 1-Sep-1966 BR64 1-Oct-1966 BR64 1-Nov-1966 BR64 1-Dec-1966 BR64 1-Jan-1967 BR64 1-Feb-1967 BR64 1-Mar-1967 BR64 1-Apr BR64 1-May BR64 1-Jun BR64 1-Jul BR64 1-Aug-1967 BR64 1-Sep-1967 BR64 1-Oct-1967 BR64 1-Nov-1967 BR64 1-Dec-1967 BR64 1-Jan-1968 BR64 1-Feb BR64 1-Mar BR64 1-Apr BR64 1-May BR64 1-Jun BR64 1-Jul BR64 1-Aug BR64 1-Sep BR64 1-Oct BR64 1-Nov BR64 1-Dec BR64 1-Jan BR64 1-Feb Gas [thous. m 3 ] BR64 Average Daily Production per Month - Gas
26 Pressure - individual well data with time Perforation depth m, 11 Nov 1957 Casing pressure 110 atm, Tubing pressure 120 atm 15 Sep Jul 1969
27 Average daily production per month - well Br-89 Natur. inflow Perforation m pumping Production of gas not registered Perforation m, pumping Production of gas is not registered Sep 1960 Perforation m natural inflow Oct 1965

28 Cummulative production well BR 89 Perf m Natural inflow Perforation m pumping Production of gas is not registered Perforation m, pumping Production of gas is not registered Gas Oil Water Sep 1960 Oct 1965


29 Proposal for injection and monitoring Návrh vtlačných (injektážních) vrtů Proposed injection wells


30 Proposal for injection and monitoring at reservoir level Návrh monitorovacích vrtů na úrovni lábského obzoru Proposed monitoring wells at the Láb reservoir level

31 Proposal for injection and monitoring above the seal Návrh monitorovacích vrtů v bazálním obzoru svrchního badenu Proposed monitoring wells with perforation in the Basal sand of the Upper Badenian

32 Proposal for injection and monitoring Komplexní návrh vtlačných, hlubokých a mělkých monitorovacích vrtů Proposed system of injection and deep & shallow monitoring wells


33 Conclusions 1. New stratigraphy 2. 3D Reservoir & seal properties 3. Database on gas pressure & Production history from individual wells for Dynamic Modeling 4. Well completion after abandonment in GIS for Risk Analysis 5. Proposal of injection and monitoring wells

34 Thank you for your attention REPP-CO2 team
Available online at ScienceDirect. Energy Procedia 114 (2017 )
") Available online at www.sciencedirect.com ScienceDirect Energy Procedia 114 (2017 ) 2772 2780 13th International Conference on Greenhouse Gas Control Technologies, GHGT-13, 14-18 November 2016, Lausanne,
Available online at www.sciencedirect.com ScienceDirect Energy Procedia 114 (2017 ) 2772 2780 13th International Conference on Greenhouse Gas Control Technologies, GHGT-13, 14-18 November 2016, Lausanne,
REPP-CO2 Czech-Norwegian project towards a research CO2 storage pilot in the Czech Republic
 REPP-CO2 Czech-Norwegian project towards a research CO2 storage pilot in the Czech Republic V. Hladík, O. Krejčí, J. Franců, V. Kolejka (Czech Geological Survey), R. Berenblyum (IRIS) REPP-CO2 Preparation
REPP-CO2 project overview. V. Hladík, O. Krejčí, J. Franců, V. Kolejka (Czech Geological Survey), R. Berenblyum (IRIS)
, R. Berenblyum (IRIS)") REPP-CO2 project overview V. Hladík, O. Krejčí, J. Franců, V. Kolejka (Czech Geological Survey), R. Berenblyum (IRIS) REPP-CO2 Preparation of a REsearch Pilot Project on CO2 Geological Storage in the Czech
REPP-CO2 project overview V. Hladík, O. Krejčí, J. Franců, V. Kolejka (Czech Geological Survey), R. Berenblyum (IRIS) REPP-CO2 Preparation of a REsearch Pilot Project on CO2 Geological Storage in the Czech
GAMINGRE 8/1/ of 7
 FYE 09/30/92 JULY 92 0.00 254,550.00 0.00 0 0 0 0 0 0 0 0 0 254,550.00 0.00 0.00 0.00 0.00 254,550.00 AUG 10,616,710.31 5,299.95 845,656.83 84,565.68 61,084.86 23,480.82 339,734.73 135,893.89 67,946.95
PREPARATION OF A RESEARCH PILOT PROJECT ON CO 2 GEOLOGICAL STORAGE IN THE CZECH REPUBLIC (REPP-CO 2 )
") ZACHYTÁVÁNÍ A UKLÁDÁNÍ CO2 V PODMÍNKÁCH ČR SPOLUPRÁCE ČESKÉ REPUBLIKY A NORSKA Praha 8. 11. 2016 PREPARATION OF A RESEARCH PILOT PROJECT ON CO 2 GEOLOGICAL STORAGE IN THE CZECH REPUBLIC (REPP-CO 2 ) INPUT
ZACHYTÁVÁNÍ A UKLÁDÁNÍ CO2 V PODMÍNKÁCH ČR SPOLUPRÁCE ČESKÉ REPUBLIKY A NORSKA Praha 8. 11. 2016 PREPARATION OF A RESEARCH PILOT PROJECT ON CO 2 GEOLOGICAL STORAGE IN THE CZECH REPUBLIC (REPP-CO 2 ) INPUT
Project Information system (Geodatabase) Norway Grants
 Norway Grants") Project Information system (Geodatabase) Norway Grants Lucie Kondrová Lenka Kociánová Zuzana Krejčí Martin Paleček Czech Geological Survey, Department of Information Systems 8.11. 2016 CZECH GEOLOGICAL
Project Information system (Geodatabase) Norway Grants Lucie Kondrová Lenka Kociánová Zuzana Krejčí Martin Paleček Czech Geological Survey, Department of Information Systems 8.11. 2016 CZECH GEOLOGICAL
Annual Average NYMEX Strip Comparison 7/03/2017
 Annual Average NYMEX Strip Comparison 7/03/2017 To Year to Year Oil Price Deck ($/bbl) change Year change 7/3/2017 6/1/2017 5/1/2017 4/3/2017 3/1/2017 2/1/2017-2.7% 2017 Average -10.4% 47.52 48.84 49.58
How fast can a falcon fly?
 How fast can a falcon fly? DEVEX 9 th May 2012 Peter Brand Overview Overview Timeline Appraisal Development Performance Potential Summary / Conclusions Overview - Location Falcon Tern Kestrel Shetland
Fr CO2 02 Fault Leakage Detection From Pressure Transient Analysis
 Fr CO2 2 Fault Detection From Pressure Transient Analysis A. Shchipanov *, L. Kollbotn, R. Berenblyum IRIS Summary of reservoir fluids from injection site, e.g. through faults, is one of the key risks
EUOGA First result from the EU shale gas assessment project
 1st Annual Conference of the European Science and Technology Network on UH Extraction EUOGA First result from the EU shale gas assessment project By Peter Britze GEUS 40 Years Listening to the Beat of
Development and Implementation of a Monitoring Plan at a 1-million Tonne CCS Demonstration: Decatur, Illinois USA
 Development and Implementation of a Monitoring Plan at a 1-million Tonne CCS Demonstration: Decatur, Illinois USA Robert J. Finley, Principal Investigator Midwest Geological Sequestration Consortium Director,
Serica Energy (UK) Limited. P.1840 Relinquishment Report. Blocks 210/19a & 210/20a. UK Northern North Sea
 Limited. P.1840 Relinquishment Report. Blocks 210/19a & 210/20a. UK Northern North Sea") Serica Energy (UK) Limited P.1840 Relinquishment Report Blocks 210/19a & 210/20a UK Northern North Sea January 2013 1 Header Licence: P.1840 Round: Licence Type: 26th Round Traditional "Drill-or-Drop"
Serica Energy (UK) Limited P.1840 Relinquishment Report Blocks 210/19a & 210/20a UK Northern North Sea January 2013 1 Header Licence: P.1840 Round: Licence Type: 26th Round Traditional "Drill-or-Drop"
Jayalath Ekanayake Jonas Tappolet Harald Gall Abraham Bernstein. Time variance and defect prediction in software projects: additional figures
 Jayalath Ekanayake Jonas Tappolet Harald Gall Abraham Bernstein TECHNICAL REPORT No. IFI-2.4 Time variance and defect prediction in software projects: additional figures 2 University of Zurich Department
Salem Economic Outlook
 Salem Economic Outlook November 2012 Tim Duy, PHD Prepared for the Salem City Council November 7, 2012 Roadmap US Economic Update Slow and steady Positives: Housing/monetary policy Negatives: Rest of world/fiscal
Time-lapse well logging to monitor injected CO 2 in an aquifer at Nagaoka
 Nagaoka Project Time-lapse well logging to monitor injected CO 2 in an aquifer at Nagaoka Daiji Tanase 1), Jiro Watanabe 2), Ziqiu Xue 3), Hiroyuki Azuma 4) 1: Engineering Advancement Association of Japan
An Overview of the Tapia Canyon Field Static Geocellular Model and Simulation Study
 An Overview of the Tapia Canyon Field Static Geocellular Model and Simulation Study Prepared for Sefton Resources Inc. Jennifer Dunn, Chief Geologist Petrel Robertson Consulting Ltd. Outline Background
Jackson County 2013 Weather Data
 Jackson County 2013 Weather Data 61 Years of Weather Data Recorded at the UF/IFAS Marianna North Florida Research and Education Center Doug Mayo Jackson County Extension Director 1952-2008 Rainfall Data
Reservoir Modeling for Wabamun Area CO2 Sequestration Project (WASP) Davood Nowroozi
 Davood Nowroozi") Reservoir Modeling for Wabamun Area CO2 Sequestration Project (WASP) Davood Nowroozi Don Lawton 1 Effect of production/injection on Geophysical parameters Production or injection makes change in fluid
Reservoir Modeling for Wabamun Area CO2 Sequestration Project (WASP) Davood Nowroozi Don Lawton 1 Effect of production/injection on Geophysical parameters Production or injection makes change in fluid
3D Time-lapse Seismic Modeling for CO2 Sequestration
 3D Time-lapse Seismic Modeling for CO2 Sequestration Jintan Li Advisor: Dr. Christopher Liner April 29 th, 2011 1 Outline Background/Introduction Methods Preliminary Results Future Work 2 Goal Flow simulation
Long-term Water Quality Monitoring in Estero Bay
 Long-term Water Quality Monitoring in Estero Bay Keith Kibbey Laboratory Director Lee County Environmental Laboratory Division of Natural Resource Management Estero Bay Monitoring Programs Three significant
Relinquishment Report
 Relinquishment Report Licence P.089 Block 22/15a 2 nd Round Traditional Licence Award (Operator): 100.0% Disclaimer No representation or warranty, express or implied, is or will be made in relation to
Opportunities in Oil and Gas Fields Questions TABLE OF CONTENTS
 TABLE OF CONTENTS A. Asset... 3 1. What is the size of the opportunity (size the prize)?... 3 2. Volumetric Evaluation... 3 3. Probabilistic Volume Estimates... 3 4. Material Balance Application... 3 5.
Reservoir Rock Properties COPYRIGHT. Sources and Seals Porosity and Permeability. This section will cover the following learning objectives:
 Learning Objectives Reservoir Rock Properties Core Sources and Seals Porosity and Permeability This section will cover the following learning objectives: Explain why petroleum fluids are found in underground
WHEN IS IT EVER GOING TO RAIN? Table of Average Annual Rainfall and Rainfall For Selected Arizona Cities
 WHEN IS IT EVER GOING TO RAIN? Table of Average Annual Rainfall and 2001-2002 Rainfall For Selected Arizona Cities Phoenix Tucson Flagstaff Avg. 2001-2002 Avg. 2001-2002 Avg. 2001-2002 October 0.7 0.0
Borehole Seismic Monitoring of Injected CO 2 at the Frio Site
 Borehole Seismic Monitoring of Injected CO 2 at the Frio Site * Daley, T M (tmdaley@lbl.gov), Lawrence Berkeley National Lab., 1 Cyclotron Rd, Berkeley, CA 94720 Myer, L (lrmyer@lbl.gov), Lawrence Berkeley
Relinquishment Report
 Relinquishment Report Licence P1403 Block 13/22d Chevron North Sea Limited Korean National Oil Company Chevron North Sea Limited December 2009 1 SYNOPSIS... 3 2 INTRODUCTION. 3 2.1 Licence Terms.. 3 2.2
Jackson County 2018 Weather Data 67 Years of Weather Data Recorded at the UF/IFAS Marianna North Florida Research and Education Center
 Jackson County 2018 Weather Data 67 Years of Weather Data Recorded at the UF/IFAS Marianna North Florida Research and Education Center Doug Mayo Jackson County Extension Director 1952-2008 Rainfall Data
Hydrogeology and Simulated Effects of Future Water Use and Drought in the North Fork Red River Alluvial Aquifer: Progress Report
 Hydrogeology and Simulated Effects of Future Water Use and Drought in the North Fork Red River Alluvial Aquifer: Progress Report Developed in partnership with the Oklahoma Water Resources Board S. Jerrod
Climatography of the United States No
 Climate Division: AK 5 NWS Call Sign: ANC Month (1) Min (2) Month(1) Extremes Lowest (2) Temperature ( F) Lowest Month(1) Degree s (1) Base Temp 65 Heating Cooling 90 Number of s (3) Jan 22.2 9.3 15.8
Pros and Cons against Reasonable Development of Unconventional Energy Resources
 Pros and Cons against Reasonable Development of Unconventional Energy Resources Associate Professor Shteryo LYOMOV, Ph.D. Presentation outline Energy resources; Conventional and Unconventional energy resources;
Know Before You Go. Steve O Connor. Bryony Youngs. How GeoPrediction helps with Production Optimization and Assessing the Size of the Prize
 Know Before You Go How GeoPrediction helps with Production Optimization and Assessing the Size of the Prize Steve O Connor Global Technical Lead, Geopressure Bryony Youngs Reservoir Portfolio Development
RELINQUISHMENT REPORT. UK Traditional Licence P Blocks 12/16b & 12/17b. First Oil Expro Limited (Operator, 46.67%)
") RELINQUISHMENT REPORT UK Traditional Licence P.1887 Blocks 12/16b & 12/17b First Oil Expro Limited (Operator, 46.67%) Nautical Petroleum Limited (26.67%) North Sea Energy (UK NO2) Limited (26.67%) February
RELINQUISHMENT REPORT UK Traditional Licence P.1887 Blocks 12/16b & 12/17b First Oil Expro Limited (Operator, 46.67%) Nautical Petroleum Limited (26.67%) North Sea Energy (UK NO2) Limited (26.67%) February
Time Series Analysis
 Time Series Analysis A time series is a sequence of observations made: 1) over a continuous time interval, 2) of successive measurements across that interval, 3) using equal spacing between consecutive
Statistical Models for Rainfall with Applications to Index Insura
 Statistical Models for Rainfall with Applications to April 21, 2008 Overview The idea: Insure farmers against the risk of crop failure, like drought, instead of crop failure itself. It reduces moral hazard
SYSTEM BRIEF DAILY SUMMARY
 SYSTEM BRIEF DAILY SUMMARY * ANNUAL MaxTemp NEL (MWH) Hr Ending Hr Ending LOAD (PEAK HOURS 7:00 AM TO 10:00 PM MON-SAT) ENERGY (MWH) INCREMENTAL COST DAY DATE Civic TOTAL MAXIMUM @Max MINIMUM @Min FACTOR
StackFRAC HD system outperforms cased hole in vertical wells
 Case Study StackFRAC HD system outperforms cased hole in vertical wells UNITED STATES, PERMIAN BASIN STACKFRAC HD SYSTEM Background The Permian Basin consists of several stacked pay zones and is one of
ENGINE SERIAL NUMBERS
 ENGINE SERIAL NUMBERS The engine number was also the serial number of the car. Engines were numbered when they were completed, and for the most part went into a chassis within a day or so. However, some
F. Bacciotti K. D Amore J. Seguin
 The Role of 4D Seismic Interpretation and Dynamic Modelling in the Successful Drilling of a Late Stage Development Well in the West Brae Field, North Sea F. Bacciotti K. D Amore J. Seguin Introduction
Licence P1667, block 43/22b, Relinquishment Report - Centrica Energy Upstream
 Licence P1667, block 43/22b, Relinquishment Report - Centrica Energy Upstream 1 General 1 2 Synopsis 2 3 Exploration Activities 2 4 Prospectivity Analysis 2 5 Reserves Summary 5 6 Clearance 5 List of figures
Petroleum Geology and Exploration History of the Mergui Basin, THAILAND EPPM (P1) PROJECT
 PROJECT") Petroleum Geology and Exploration History of the Mergui Basin, THAILAND EPPM (P1) PROJECT KRABI, THAILAND 12 th May 2009 Contents of Presentation 1. Exploration History 1. Exploration History 2. General
Petroleum Geology and Exploration History of the Mergui Basin, THAILAND EPPM (P1) PROJECT KRABI, THAILAND 12 th May 2009 Contents of Presentation 1. Exploration History 1. Exploration History 2. General
The Ketzin Test Site (former CO 2 Sink-project)
") The Ketzin Test Site (former CO 2 Sink-project) - Experiences and results gained during 32 months of operation - Axel Liebscher & Ketzin Team The Ketzin Test Site ~ 25 km west of Berlin located in the
The Ketzin Test Site (former CO 2 Sink-project) - Experiences and results gained during 32 months of operation - Axel Liebscher & Ketzin Team The Ketzin Test Site ~ 25 km west of Berlin located in the
Corporate Presentation September Coastal Energy Company 2013 All Rights Reserved
 Corporate Presentation September 2013 Coastal Energy Company 2013 All Rights Reserved Forward Looking Statements This presentation contains forward-looking statements as defined by the applicable securities
SPECIMEN. Date Morning/Afternoon. A Level Geography H481/01 Physical systems Sample Question Paper. Time allowed: 1 hour 30 minutes PMT
 Oxford Cambridge and RSA A Level Geography H481/01 Physical systems Sample Question Paper Date Morning/Afternoon Time allowed: 1 hour 30 minutes You must have: the Resource Booklet the OCR 12-page Answer
Storage 6 - Modeling for CO 2 Storage. Professor John Kaldi Chief Scientist, CO2CRC Australian School of Petroleum, University of Adelaide, Australia
 Storage 6 - Modeling for CO 2 Storage Professor John Kaldi Chief Scientist, CO2CRC Australian School of Petroleum, University of Adelaide, Australia Regina, Sask., Canada, 17-22 July, 2016 Modeling 2 What
Risk Factors in Reservoir Simulation
 Risk Factors in Reservoir Simulation Dr. Helmy Sayyouh Petroleum Engineering Cairo University 12/26/2017 1 Sources Of Data Petro-physical Data Water saturation may be estimated from log analysis, capillary
SYSTEM BRIEF DAILY SUMMARY
 SYSTEM BRIEF DAILY SUMMARY * ANNUAL MaxTemp NEL (MWH) Hr Ending Hr Ending LOAD (PEAK HOURS 7:00 AM TO 10:00 PM MON-SAT) ENERGY (MWH) INCREMENTAL COST DAY DATE Civic TOTAL MAXIMUM @Max MINIMUM @Min FACTOR
Storage 4 - Modeling for CO 2 Storage. Professor John Kaldi Chief Scientist, CO2CRC Australian School of Petroleum, University of Adelaide, Australia
 Storage 4 - Modeling for CO 2 Storage Professor John Kaldi Chief Scientist, CO2CRC Australian School of Petroleum, University of Adelaide, Australia 1 Modelling 2 On Models. All models are wrong. some
5 IEAGHG CCS Summer School. Geological storage of carbon dioxide (a simple solution)
") Storage 1- Reservoirs, Traps, Seals and Storage Capacity for Storage Geological storage of carbon dioxide (a simple solution) Professor John Kaldi Chief Scientist, CO2CRC Australian School of Petroleum,
Storage 1- Reservoirs, Traps, Seals and Storage Capacity for Storage Geological storage of carbon dioxide (a simple solution) Professor John Kaldi Chief Scientist, CO2CRC Australian School of Petroleum,
2003 Water Year Wrap-Up and Look Ahead
 2003 Water Year Wrap-Up and Look Ahead Nolan Doesken Colorado Climate Center Prepared by Odie Bliss http://ccc.atmos.colostate.edu Colorado Average Annual Precipitation Map South Platte Average Precipitation
Integrated Study Leading to Discovery of Thin Pay Sands and Challenges Associated with Development. Shaikh Abdul Azim
 Integrated Study Leading to Discovery of Thin Pay Sands and Challenges Associated with Development Shaikh Abdul Azim February 10, 2014 Outline Location and Geological Setting Zubair in RA and SA Fields
PROGRESS ACCOMPLISHED THIS PERIOD
 Semi-Annual Report Period Covered: September 1, 21 through February 28, 217 Prepared By: Richard Radigan Title: Monitoring of a Constructed Oyster Reef in the St. Lucie Estuary Agency: Florida Fish & Wildlife
We P2 04 Rock Property Volume Estimation Using the Multiattribute Rotation Scheme (MARS) - Case Study in the South Falkland Basin
 - Case Study in the South Falkland Basin") We P2 04 Rock Property Volume Estimation Using the Multiattribute Rotation Scheme (MARS) - Case Study in the South Falkland Basin P.K. Alvarez* (Rock Solid Images), B. Farrer (Borders & Southern Petroleum),
We P2 04 Rock Property Volume Estimation Using the Multiattribute Rotation Scheme (MARS) - Case Study in the South Falkland Basin P.K. Alvarez* (Rock Solid Images), B. Farrer (Borders & Southern Petroleum),
Power situation Sweden, english text
 , english text Estimated inflow in Sweden (not spill corrected) 1%, median and 9% probability 196-216 TWh/week 7 6 5 4 3 Past 6 weeks Prior period 1 resp 9% probability, 196-216 2 1 Apr Jun Aug Oct Dec
Technical note on seasonal adjustment for M0
 Technical note on seasonal adjustment for M0 July 1, 2013 Contents 1 M0 2 2 Steps in the seasonal adjustment procedure 3 2.1 Pre-adjustment analysis............................... 3 2.2 Seasonal adjustment.................................
monitoring data for the CO2CRC Otway
 Calibration of simulation models to monitoring data for the CO2CRC Otway project. Jonathan Ennis-King 1, T. Dance 1, J. Xu 2, C. Boreham 3, B. Freifeld 6, J. Gunning 1, B. Gurevich 4, C.Jenkins 1, L. Paterson
Climatography of the United States No
 Climate Division: CA 4 NWS Call Sign: Month (1) Min (2) Month(1) Extremes Lowest (2) Temperature ( F) Lowest Month(1) Degree s (1) Base Temp 65 Heating Cooling 100 Number of s (3) Jan 55.6 39.3 47.5 77
Climatography of the United States No
 Climate Division: CA 1 NWS Call Sign: Month (1) Min (2) Month(1) Extremes Lowest (2) Temperature ( F) Lowest Month(1) Degree s (1) Base Temp 65 Heating Cooling 100 Number of s (3) Jan 57.9 38.9 48.4 85
Climatography of the United States No
 Climate Division: CA 5 NWS Call Sign: Month (1) Min (2) Month(1) Extremes Lowest (2) Temperature ( F) Lowest Month(1) Degree s (1) Base Temp 65 Heating Cooling 100 Number of s (3) Jan 56.6 36.5 46.6 81
Climatography of the United States No
 Climate Division: CA 5 NWS Call Sign: Month (1) Min (2) Month(1) Extremes Lowest (2) Temperature ( F) Lowest Month(1) Degree s (1) Base Temp 65 Heating Cooling 100 Number of s (3) Jan 44.8 25.4 35.1 72
Climatography of the United States No
 Climate Division: CA 4 NWS Call Sign: Month (1) Min (2) Month(1) Extremes Lowest (2) Temperature ( F) Lowest Month(1) Degree s (1) Base Temp 65 Heating Cooling 100 Number of s (3) Jan 49.4 37.5 43.5 73
Climatography of the United States No
 Climate Division: CA 6 NWS Call Sign: Month (1) Min (2) Month(1) Extremes Lowest (2) Temperature ( F) Lowest Month(1) Degree s (1) Base Temp 65 Heating Cooling 100 Number of s (3) Jan 69.4 46.6 58.0 92
Climatography of the United States No
 Climate Division: CA 4 NWS Call Sign: Month (1) Min (2) Month(1) Extremes Lowest (2) Temperature ( F) Lowest Month(1) Degree s (1) Base Temp 65 Heating Cooling 1 Number of s (3) Jan 58.5 38.8 48.7 79 1962
Climatography of the United States No
 Climate Division: CA 6 NWS Call Sign: Month (1) Min (2) Month(1) Extremes Lowest (2) Temperature ( F) Lowest Month(1) Degree s (1) Base Temp 65 Heating Cooling 1 Number of s (3) Jan 67.5 42. 54.8 92 1971
Climatography of the United States No
 Climate Division: CA 1 NWS Call Sign: Month (1) Min (2) Month(1) Extremes Lowest (2) Temperature ( F) Lowest Month(1) Degree s (1) Base Temp 65 Heating Cooling 1 Number of s (3) Jan 57.8 39.5 48.7 85 1962
The Alba Field: Improved Reservoir Characterisation using 4D Seismic Data. Elaine Campbell Oliver Hermann Steve Dobbs Andrew Warnock John Hampson
 The Alba Field: Improved Reservoir Characterisation using 4D Seismic Data Elaine Campbell Oliver Hermann Steve Dobbs Andrew Warnock John Hampson Chevron 2005 Alba Field Location Equity: Chevron 23% (operator)
SECARB Phase III ANTHROPOGENIC TEST: Risk Management through Detailed Geologic Characterization and Modeling
 SECARB Phase III ANTHROPOGENIC TEST: Risk Management through Detailed Geologic Characterization and Modeling Prepared by: David Riestenberg, George Koperna, and Vello Kuuskraa, Advanced Resources International,
Climatography of the United States No
 Climate Division: ND 8 NWS Call Sign: BIS Month (1) Min (2) Month(1) Extremes Lowest (2) Temperature ( F) Lowest Month(1) Degree s (1) Base Temp 65 Heating Cooling 100 Number of s (3) Jan 21.1 -.6 10.2
How are adding integers and subtracting integers related? Work with a partner. Use integer counters to find 4 2. Remove 2 positive counters.
 . How are adding integers and subtracting integers related? ACTIVITY: Work with a partner. Use integer counters to find 4. Start with 4 positive counters. Remove positive counters. What is the total number
Climatography of the United States No
 Climate Division: TN 1 NWS Call Sign: Month (1) Min (2) Month(1) Extremes Lowest (2) Temperature ( F) Lowest Month(1) Degree s (1) Base Temp 65 Heating Cooling 100 Number of s (3) Jan 47.6 24.9 36.3 81
Climatography of the United States No
 Climate Division: CA 5 NWS Call Sign: FAT Month (1) Min (2) Month(1) Extremes Lowest (2) Temperature ( F) Lowest Month(1) Degree s (1) Base Temp 65 Heating Cooling 1 Number of s (3) Jan 53.6 38.4 46. 78
Climatography of the United States No
 Climate Division: CA 6 NWS Call Sign: 1L2 N Lon: 118 3W Month (1) Min (2) Month(1) Extremes Lowest (2) Temperature ( F) Lowest Month(1) Degree s (1) Base Temp 65 Heating Cooling 1 Number of s (3) Jan 63.7
Climatography of the United States No
 Climate Division: CA 5 NWS Call Sign: BFL Month (1) Min (2) Month(1) Extremes Lowest (2) Temperature ( F) Lowest Month(1) Degree s (1) Base Temp 65 Heating Cooling 1 Number of s (3) Jan 56.3 39.3 47.8
Atlantic Rim Coalbed Methane Play: The Newest SuccessfulCBM Play in the Rockies
 Atlantic Rim Coalbed Methane Play: The Newest SuccessfulCBM Play in the Rockies Robert A. Lamarre Lamarre Geological, Denver, Colorado Stephen K. Ruhl Anadarko Petroleum Corporation, The Woodlands, Texas
National Integrated Drought Information System. Southeast US Pilot for Apalachicola- Flint-Chattahoochee River Basin 20-March-2012
 National Integrated Drought Information System Southeast US Pilot for Apalachicola- Flint-Chattahoochee River Basin 20-March-2012 Current drought status from Drought Monitor http://www.drought.unl.edu/dm/monitor.html
P7.7 A CLIMATOLOGICAL STUDY OF CLOUD TO GROUND LIGHTNING STRIKES IN THE VICINITY OF KENNEDY SPACE CENTER, FLORIDA
 P7.7 A CLIMATOLOGICAL STUDY OF CLOUD TO GROUND LIGHTNING STRIKES IN THE VICINITY OF KENNEDY SPACE CENTER, FLORIDA K. Lee Burns* Raytheon, Huntsville, Alabama Ryan K. Decker NASA, Marshall Space Flight
July 2017 LOGISTICAL HARMONY
 Li s&staging(wpedestriansidewalkprot.) (4/18/through7/18/2017) July2017 101BelvidereEastFaçadeWorkPipeStaging (4/18/through7/18/2017) 101BelvidereEastFaçadeWork (through8/31/2017) Legend RampaccesstoTMCX
Life Cycle of Convective Systems over Western Colombia
 Life Cycle of Convective Systems over Western Colombia Meiry Sakamoto Uiversidade de São Paulo, São Paulo, Brazil Colombia Life Cycle of Convective Systems over Western Colombia Convective System (CS)
Jackson County 2014 Weather Data
 Jackson County 2014 Weather Data 62 Years of Weather Data Recorded at the UF/IFAS Marianna North Florida Research and Education Center Doug Mayo Jackson County Extension Director 1952-2008 Rainfall Data
MIDDLE DEVONIAN PLAY MICHIGAN BASIN OF ONTARIO. Duncan Hamilton
 MIDDLE DEVONIAN PLAY MICHIGAN BASIN OF ONTARIO Duncan Hamilton 1 Middle Devonian Pools of the Michigan Basin 375+ Million Barrels Michigan 45+ million Barrels Ontario 2 Outline of Presentation History
Climatography of the United States No
 Climate Division: TN 3 NWS Call Sign: BNA Month (1) Min (2) Month(1) Extremes Lowest (2) Temperature ( F) Lowest Month(1) Degree s (1) Base Temp 65 Heating Cooling 100 Number of s (3) Jan 45.6 27.9 36.8
CO2 storage modelling and capacity estimates for the Trøndelag Platform a basin modelling approach
 CO2 storage modelling and capacity estimates for the Trøndelag Platform a basin modelling approach Ane E. Lothe, Benjamin U. Emmel & Per Bergmo NORDICCS Conference Contribution D 6.1.1407 (4) August 2014
Integrating Weather Forecasts into Folsom Reservoir Operations
 Integrating Weather Forecasts into Folsom Reservoir Operations California Extreme Precipitation Symposium September 6, 2016 Brad Moore, PE US Army Corps of Engineers Biography Brad Moore is a Lead Civil
Climatography of the United States No
 Climate Division: CA 5 NWS Call Sign: Elevation: 6 Feet Lat: 37 Month (1) Min (2) Month(1) Extremes Lowest (2) Temperature ( F) Lowest Month(1) Degree s (1) Base Temp 65 Heating Cooling 1 Number of s (3)
Climatography of the United States No
 Climate Division: CA 4 NWS Call Sign: Elevation: 2 Feet Lat: 37 Month (1) Min (2) Month(1) Extremes Lowest (2) Temperature ( F) Lowest Month(1) Degree s (1) Base Temp 65 Heating Cooling 1 Number of s (3)
Climatography of the United States No
 Climate Division: CA 4 NWS Call Sign: Elevation: 13 Feet Lat: 36 Month (1) Min (2) Month(1) Extremes Lowest (2) Temperature ( F) Lowest Month(1) Degree s (1) Base Temp 65 Heating Cooling 1 Number of s
Climatography of the United States No
 Climate Division: CA 5 NWS Call Sign: Elevation: 1,14 Feet Lat: 36 Month (1) Min (2) Month(1) Extremes Lowest (2) Temperature ( F) Lowest Month(1) Degree s (1) Base Temp 65 Heating Cooling 1 Number of
Climatography of the United States No
 Climate Division: CA 6 NWS Call Sign: LAX Elevation: 1 Feet Lat: 33 Month (1) Min (2) Month(1) Extremes Lowest (2) Temperature ( F) Lowest Month(1) Degree s (1) Base Temp 65 Heating Cooling 1 Number of
The Oyster Bayou CO 2 Flood Case History. Alton Ahrens, Denbury Resources
 The Oyster Bayou CO 2 Flood Case History Alton Ahrens, Denbury Resources N Y S E : D N R w w w. d e n b u r y. c o m Table of Contents o Highlights of the CO2 Flood o Pre-CO 2 History o o o Location and
Climatography of the United States No
 Climate Division: CA 6 NWS Call Sign: TOA Elevation: 11 Feet Lat: 33 2W Temperature ( F) Month (1) Min (2) Month(1) Extremes Lowest (2) Lowest Month(1) Degree s (1) Base Temp 65 Heating Cooling 1 Number
Current challenges at CO 2 Sites
 Current challenges at CO 2 Sites Ola Eiken et al., Statoil R&D Force seminar on injection safety 4 th December 2013 Offshore Sleipner Onshore In Salah Sub-sea Snøhvit 1 - Classification: External 2010-09-23
Folsom Dam Water Control Manual Update Joint Federal Project, Folsom Dam
 Folsom Dam Water Control Manual Update Joint Federal Project, Folsom Dam Public Workshop May 28, 2015 Library Galleria 828 I Street, Sacramento, CA US Army Corps of Engineers BUILDING STRONG WELCOME &
ISO Lead Auditor Lean Six Sigma PMP Business Process Improvement Enterprise Risk Management IT Sales Training
 Training Calendar 2014 Public s (ISO LSS PMP BPI ERM IT Sales Training) www.excelledia.com (ISO, LSS, PMP, BPI, ERM, IT, Sales Public s) 1 Schedule Registration JANUARY FEBRUARY 2 days 26 JAN 27 JAN 3
Climatography of the United States No
 No. 2 1971-2 Asheville, North Carolina 2881 COOP ID: 46646 Climate Division: CA 4 NWS Call Sign: 8W Month (1) Min (2) Month(1) Extremes Lowest (2) Temperature ( F) Lowest Month(1) Degree s (1) Base Temp
Climatography of the United States No
 No. 2 1971-2 Asheville, North Carolina 2881 COOP ID: 4792 Climate Division: CA 6 NWS Call Sign: Month (1) Min (2) Month(1) Extremes Lowest (2) Temperature ( F) Lowest Month(1) Degree s (1) Base Temp 65
Western Kentucky CO 2 Storage Test
 Western Kentucky CO 2 Storage Test Principal Investigators: Rick Bowersox - Lexington Dave Williams - Henderson KGS First Friday Seminar Lexington, Kentucky March 4, 2011 The project proceeded in two phases:
Geological Modeling and Material Balance Study of Multilayer Heavy-Oil Reservoirs in Dalimo Field
 Geological Modeling and Material Balance Study of Multilayer Heavy-Oil Reservoirs in Dalimo Field EDO PRATAMA* and MOHD SUHAILI ISMAIL** *Postgraduate student of Geosciences Department, Universiti Teknologi
FRIO BRINE SEQUESTRATION PILOT IN THE TEXAS GULF COAST
 I1-2 FRIO BRINE SEQUESTRATION PILOT IN THE TEXAS GULF COAST Susan D. Hovorka and Paul R. Knox Bureau of Economic Geology, John A. and Katherine G. Jackson School of Geosciences, The University of Texas
Average 175, , , , , , ,046 YTD Total 1,098,649 1,509,593 1,868,795 1,418, ,169 1,977,225 2,065,321
 AGRICULTURE 01-Agriculture JUL 2,944-4,465 1,783-146 102 AUG 2,753 6,497 5,321 1,233 1,678 744 1,469 SEP - 4,274 4,183 1,596 - - 238 OCT 2,694 - - 1,032 340-276 NOV 1,979-5,822 637 3,221 1,923 1,532 DEC
Average 175, , , , , , ,940 YTD Total 944,460 1,284,944 1,635,177 1,183, ,954 1,744,134 1,565,640
 AGRICULTURE 01-Agriculture JUL 2,944-4,465 1,783-146 102 AUG 2,753 6,497 5,321 1,233 1,678 744 1,469 SEP - 4,274 4,183 1,596 - - 238 OCT 2,694 - - 1,032 340-276 NOV 1,979-5,822 637 3,221 1,923 1,532 DEC
Climatography of the United States No
 No. 2 1971-2 Asheville, North Carolina 2881 COOP ID: 43417 Climate Division: CA 4 NWS Call Sign: N Lon: 121 Month (1) Min (2) Month(1) Extremes Lowest (2) Temperature ( F) Lowest Month(1) Degree s (1)