TECHNICAL REPORT ON THE
|
|
|
- Jordan Sullivan
- 6 years ago
- Views:
Transcription

1 TECHNICAL REPORT ON THE HYLAND GOLD PROJECT, YUKON TERRITORY, CANADA Located in the Watson Lake Mining District NTS: 95D/05 & 95D/12 60 o N Latitude 127 o W Longitude Prepared for: Banyan Gold Corp. Suite 5600, One First Canadian Place, 100 King Street West, Toronto ON, M5X 1C9 Prepared By: Robert C. Carne, M.Sc., P.Geo., Carvest Holdings Ltd. Allan Armitage, Ph. D., P. Geol., GeoVector Management Inc. August 4, 2016 i
2 Table of Contents Page 1.0 SUMMARY INTRODUCTION Introduction and Overview Terms of Reference Units of Measure and Abbreviations RELIANCE ON OTHER EXPERTS PROPERTY DESCRIPTION Description Royalty Agreements Environmental Liabilities and Permits ACCESSIBILITY, CLIMATE, LOCAL RESOURCES, INFRASTRUCTURE AND PHYSIOGRAPHY Project Access Climate Local Resources and Infrastructure Physiography, Elevation and Vegetation HISTORY GEOLOGICAL SETTING AND MINERALIZATION Regional Geology Regional Mineralization and Metallogeny Property Geology and Mineralization Geology Alteration Mineralization Introduction Main Zone Mineralization Camp Zone Mineralization Cuz Zone Mineralization Unnamed Area of Mineralization Montrose Ridge Zone Mineralization Hyland South Zone Pyrite Creek Showing DEPOSIT TYPES Overview of Hyland Gold Mineralization Styles Sediment-hosted Gold Occurrences Elsewhere in Selwyn Basin Distal-disseminated Sediment-hosted Gold Deposits at the Marigold Mine, Nevada EXPLORATION Geological Mapping Geochemical Sampling Introduction Main Zone-Camp Zone Anomaly Southeast Anomaly East Anomaly Cuz Anomaly Montrose Ridge Anomaly Discussion of Geochemical Survey Results...56 ii
3 9.3 Geophysical Surveys Mechanized Trenching DRILLING Drilling Completed by Previous Operators Diamond Drilling Reverse Circulation (RC) Percussion Drilling and 2005 Diamond Drilling Programs and 2011 Diamond Drilling Programs Diamond Drilling Completed by Banyan Gold Corp SAMPLE PREPARATION, ANALYSES AND SECURITY Surface Soil and Rock Sampling Diamond Drill Core and 2011 Diamond Drilling Programs Diamond Drilling Program Reverse Circulation Drill Cuttings DATA VERIFICATION Quality Assurance and Quality Control (QA/QC) Program MINERAL PROCESSING AND METALLURGICAL TESTING MINERAL RESOURCE ESTIMATE Introduction Historical Resource Estimate Drill File Preparation Resource Modelling and Wireframing Composites Grade Capping Specific Gravity Block Modelling Model Validation Resource Classification Resource Reporting Disclosure ADJACENT PROPERTIES MacMillan Occurrence Mel Deposit OTHER RELEVANT DATA AND INFORMATION INTERPRETATION AND CONCLUSIONS RECOMMENDATIONS REFERENCES...98 CERTIFICATES OF QUALIFIED PERSONS iii
4 List of Figures Page Figure 4.1: Yukon-Scale Project Location Map...5 Figure 4.2: Project Regional Location Map...6 Figure 4.3: Hyland Gold Project Mineral Claims Location Map North Sheet...7 Figure 4.4: Hyland Gold Project Mineral Claims Location Map South Sheet 8 Figure 5.1: Property Infrastructure Map...31 Figure 7.1: Regional Geology Map..35 Figure 7.2: Property Scale Geology Map Figure 7.3: Property Scale Structural Geology Map on Shaded Topography...41 Figure 8.1: Conceptual Model for Hyland Gold Project Mineralization.48 Figure 9.1: Soil Sampling Compilation Map Gold Geochemistry 53 Figure 9.2: Soil Sampling Compilation Map Arsenic Geochemistry...54 Figure 9.3: Stream Sediment Sample Compilation Map Gold Geochemistry..57 Figure 9.4: Stream Sediment Sample Compilation Map Arsenic Geochemistry..58 Figure 9.5: Geophysical Work Compilation Map 60 Figure 9.6: Total Field Airborne Magnetic Map.. 61 Figure 10.1: Drilling Compilation Map 67 Figure 10.2: Main Zone and Camp Zone Drilling Compilation Map 69 Figure 12.1: Performance Summary for Gold by Fire Assay of Standard CDN GS P7B.78 Figure 12.2: Performance Summary for Silver by Aqua Regia digestion of Standard CDN GS P7B..79 Figure 12.3: Performance Summary for Gold by Fire Assay of Standard CDN GS 1P5D...79 Figure 12.4: Performance Summary for Gold by Fire Assay of Standard CDN GS 5F 80 Figure 12.5: Summary of Gold Fire Assay Data for Pulp Blanks Inserted in Drill Core Sample Streams...81 Figure 14.1: Isometric View Looking North Showing Drill Hole Distribution and Topography in the Main Zone..84 Figure 14.2: Isometric View Looking North Showing the Main Zone Resource Block Model, Drill Hole Distribution and Topography Figure 14.3: Isometric View Looking West Showing the Main Zone Resource Block Model, Drill Hole Distribution and Topography 85 Figure 14.4: Isometric View Looking Northwest Showing the Main Zone Resource Block Model, Drill Hole Distribution and Search Ellipse 88 Figure 14.5: Isometric View Looking Northwest Showing the Main Zone Gold Resource Blocks.89 Figure 14.6: Isometric View Looking Northwest Showing the Main Zone Silver Resource Blocks 90 List of Tables Page Table 1.1: Hyland Gold Project 2012 Resource Estimates...2 Table 4-1: Hyland Gold Project Tenure Data (downloaded from Yukon Mining Recorder web site Feb. 15, 2016) 11 Table 9.1: Background and Threshold Values for Important Elements.52 Table 9-2: Hyland Gold Project Selected Main Zone Trenching Results...64 Table 10.1: Summary of Significant Main Zone Drill Intersections ( ) 70 Table 13.1: 1989 Bottle Roll Test Results 81 Table 14.1: Summary of the Drill Hole Composite Data from Within the Main Zone Resource Model.86 Table 14.2: Block Model Geometry and Search Ellipse Orientation...87 Table 14.3: Resource Estimate for the Main Zone...91 Table 18.1: Recommended Budget..96 iv
5 Appendices Appendix 1: Appendix 2: Hyland Gold Project Royalties Review Listing of Drill Holes Completed on the Hyland Gold Project v
6 1.0 SUMMARY This report summarizes exploration work performed on the Hyland Gold Project in southeast Yukon. It is an update of an independent National Instrument Technical Report written for Banyan Coast Capital Corp., now Banyan Gold Corp., by Armitage and Gray (2012b) dated November 2, 2012 and filed on SEDAR. It incorporates a previously reported mineral resource estimate from the 2012 Technical Report, a revised and updated summary of geochemical, geological, geophysical exploration and drilling conducted on the property, an updated review of the exploration history, a discussion of the Deposit Model and its significance for exploration potential of the Project, and Recommendations for further work. Hyland Gold Project is an advanced gold prospect located in the Watson Lake Mining District of southeast Yukon, approximately 74 kilometres northeast of the community of Watson Lake. It consists of 927 claims totaling 18,620 hectares and contains two areas of noteworthy gold mineralization, the Main Zone and the Cuz Zone as well as two other areas of significant exploration interest termed the Camp Zone and the Montrose Ridge Zone. Banyan Gold Corp. has earned a 100% interest in the property subject to various NSR agreements in favour of previous operators. Work on and around the Hyland Gold Project has been ongoing since the late 1800 s, however most work prior to the early 1980 s was focused on base metal exploration. The potential for gold mineralization was first recognized in 1981 when anomalous arsenic-bismuth-gold soil geochemistry was documented at the Main Zone and the Cuz anomaly areas. Exploration for gold through the 1980 s, 1990 s and into the early 2000 s consisted of extensive soil and rock geochemical sampling, airborne and ground-based geophysical surveys, diamond drilling, reverse circulation drilling and bulldozer trenching that discovered bedrock mineralization at the Main Zone and Cuz Zone and culminated in the definition of a Resource Estimate for the Main Zone in Since Banyan Gold Corp. acquired the property in 2013 it has carried out geochemical sampling, road building, excavator trenching and diamond drilling in 2013, 2014 and This work has refined the knowledge of the north trending Main Zone gold-silver deposit and the east-southeast trending Cuz Zone as well as outlining a promising new exploration prospect at the Montrose Ridge Zone. Gold mineralization has been discovered in several areas on the Hyland Gold Project. The Main Zone has received the most exploration and it is the best known example: It occurs within a slightly recumbent anticline developed along a regional structural corridor of faulting and folding known as the Quartz Lake Lineament. There is a strong coincidence with other less well explored areas of gold mineralization and untested geochemical targets with the Quartz Lake Lineament or cross-cutting structures; Gold occurs in quartz veins and breccias in quartzite, to a lesser degree in silicified (jasperoid altered) zones in phyllite intervals and, as a minor constituent of iron sulphide or iron carbonate replacement zones in limestone; Mineralization is both stratabound and structurally controlled; There is no direct evidence of an igneous association for mineralizing fluids although the pathfinder element suite of arsenic-bismuth-tungsten and the association of hydrothermal tourmaline suggests involvement of granitic fluids, at least in part; Highly fractured zones of better grade gold mineralization can be oxidized to a much greater depth than relatively unfractured, but silicified, flanking zones of lower grade mineralization; and Gold mineralization at Hyland Gold bears some similarity to other sediment-hosted gold mineralization elsewhere in Yukon. However, closest similarity with other occurrences is with a cluster of deposits that form the Marigold Mine in the Battle Mountain-Eureka Trend of north-central Nevada. 1
7 The Hyland Gold Main Zone lies at the top of a small hill upon a north trending ridge located in the central part of the property. Weathering and consequent oxidation of sulphide minerals extends to depths of 60 m from surface at the top of the hill while glaciation has removed most of the oxidized profile at lower elevations. Best assays in the oxide zone are returned from samples of grey, scorodite-stained stockwork quartz veins with abundant boxwork after sulphide minerals. Moderately mineralized intervals occur within brecciated, silicaaltered, brittle quartzite intervals adjacent to the higher grade stockwork mineralization. The Main Zone at the Hyland Gold Project has been calculated to host an Inferred Resource, at a 0.6 g/t gold equivalent ( AuEq ) cutoff of 12,503,994 tonnes containing 361,692 ounces gold at 0.9 g/t and 2,248,948 ounces silver at a grade of 5.59 g/t (Armitage and Gray, 2012b) NI Main Zone Inferred Resource Estimates at various cut-off gold equivalent grades are presented below in Table 1-1. Table 1.1 Hyland Gold Project 2012 Resource Estimates AuEq* Cut-off Tonnes Au (g/t) Au Oz Ag (g/t) Ag Oz AuEq (g/t) AuEq Oz 0.4 g/t 16,820, , ,619, , g/t 14,734, , ,453, , g/t 12,503, , ,248, , g/t 9,678, , ,988, , g/t 7,038, , ,654, ,942 * Gold equivalent or AuEq is based on silver metal content valued at gold value using a $1016 US gold price and a $15.82US silver price, which approximate the average prices for these metals over the three years preceding the 2012 Mineral Resource Estimate. The results of diamond drilling to date show that the Main Zone mineralization defined by the above resource model is open for expansion to the north and east and to depth. The Cuz Zone mineralization has demonstrated continuity over 800 m on a southeast trend and is open along strike and to depth. With further drilling there is potential to expand on the resource at the Main Zone and define a maiden resource at the Cuz Zone. The Montrose Ridge Zone, a new oxide gold discovery located south of the Cuz Zone needs to be further outlined by excavator trenching and/or RAB drilling before definition by diamond drilling. The major zones of mineralization on the property are aligned along the Quartz Lake Lineament, an 18 km long zone of faulting, folding and brecciation that has been the locus of a variety of styles of gold mineralization. The Main Zone is classified an example of a sediment-hosted distal disseminated gold deposit, the best known example of which is the Marigold Mine in the Battle Mountain-Eureka Trend of north-central Nevada. Other areas of gold mineralization on the property bear similarities to carbonate replacement and manto styles of mineralization. In aggregate, the known areas of mineralization in conjunction with less well explored areas of strongly anomalous gold and pathfinder element response, are testament to a strong causative hydrothermal system giving rise to a large area of high exploration potential for a variety of sediment hosted gold exploration targets types. 2
8 A $3,102,184 two phase exploration program is recommended for the Hyland Gold Project. Phase I consists of data compilation, satellite imagery acquisition, soil sampling and excavator trenching at an estimated cost of $396,922. A$3,102,184 Phase II program of diamond drilling of 45 holes totaling 6,000 m at the Main Zone should proceed with a focus of extending the mineralized envelope to the north and east, and to depth beneath the relatively shallow drilling carried out to date. Concurrent with that, rotary air blast (RAB) or reverse circulation (RC) reconnaissance scale drilling is recommended to refine diamond drill targeting in established areas of gold potential at the Camp, Cuz and Montrose Ridge Zones, as well as any other areas of high exploration interest that are identified by the Phase I work. 2.0 INTRODUCTION 2.1 Introduction and Overview Banyan Gold Corp. ( Banyan or the Company ) is a Toronto-based mineral exploration company, listed on the TSX Venture Exchange with trading symbol TSX-V:BYN. The Company holds a 100% interest in the Hyland Gold Project ( the Project ) in southeast Yukon, subject to underlying royalties described elsewhere in this report. This report is an update to a previously reported Technical Report by Armitage and Gray (2012b). It documents: historical exploration work, description of the property, geology and nature of mineralization; a previously reported mineral resource estimate; an updated review of the Deposit Model; and recommendations for further exploration work. The Hyland Gold Project is being explored for sediment-hosted gold mineralization by Banyan and is currently in an advanced stage of exploration. 2.1 Terms of Reference Robert Carne, M.Sc., P.Geo., ( Carne ) of Carvest Holdings Ltd. and Allan Armitage Ph.D., P.Geol., ( Armitage ) of GeoVector Management Inc. were contracted by Banyan to prepare this independent National Instrument ("NI ") Technical Report to be filed with the Toronto Stock Exchange (TSX) Venture Exchange and the Canadian System for Electronic Document Analysis and Retrieval (SEDAR). The first author, Carne, is responsible for preparation of the report and compilation of historical data, with the exception of Section 14.0, Mineral Resource Estimate. This section has been adapted in whole from a previous compliant Technical Report prepared for Banyan by Armitage and Gray (2012b). The current authors Carne and Armitage are both Qualified Persons independent of Banyan Gold Corp. This report was produced for the purpose of supplying updated exploration information and recommendations for further work to the shareholders of Banyan. The report was written in compliance with disclosure and reporting requirements set forth in the Canadian Securities Administrations current Standards of Disclosure for Mineral Projects under provisions of National Instrument , Companion Policy CP and Form F1. It is a compilation of publicly-available assessment reports filed with the Yukon Mining Recorder for mineral claim tenure credit, unpublished internal company reports and property data provided by Banyan; 3
9 supplemented by publicly-available government maps and scientific publications. The supporting documents are referenced in appropriate sections of this report. Carne visited the Hyland Gold Project on June 13, 2016 accompanied by Banyan Vice-President and geologist Paul D. Gray. Carne also has extensive personal knowledge of the Project from his participation in and/or management of exploration programs on the property in 1981, 1985, 1986, 1990 and Armitage visited the Project in the company of Paul Gray on October 12, There has been no significant subsequent exploration, including drilling, on the Main Zone since Armitage visited the property that would compromise or affect the Resource calculation carried out in Units of Measure and Abbreviations Units of measure are metric. Assays and analytical results for precious metals are quoted in parts per million ( ppm ) and parts per billion ( ppb ). Parts per million are also commonly referred to as grams per tonne ( g/t ) in respect to gold and silver analytical results. Gold endowment may be referred to as ounces (Oz). Assays and analytical results for base metals are also reported in percent (%). Temperature readings are reported in degrees Celsius ( o C). Lengths are quoted in kilometres ( km ), metres ( m ) or millimetres ( mm ). Specific gravity measurements are reported in tonnes per cubic metre (t/m 3 ). All costs are in Canadian dollars. Weights of metallurgical reagents are quoted in kilograms per tonne (kg/t). 3.0 RELIANCE ON OTHER EXPERTS The Authors rely on information from reports prepared by or for Banyan which detail surface and drill results and resource calculations, as well as other historical reports about the Project. Banyan has also provided a library of historical internal company reports that are not in the public domain. The Authors have reviewed this material and believe that the relevant data has been collected in a careful and conscientious manner and in accordance with the standards set out in NI ; and when data collection precedes the implementation of NI , that it was collected in accordance with contemporary industry standards. When appropriate the Authors have relied upon information previously reported in historical reports, including text excerpts and direct reproduction of figure information to illustrate discussions in the text. Much of this report is taken from an independent Technical Report for Banyan by Armitage and Gray (2012b) dated November 2, 2012 and filed on SEDAR. Armitage is also an author of the present report. Figures that accompany this report were drafted by Banyan staff with the instruction and supervision of Carne. Mineral claim information was provided by the office of the Yukon Mining Recorder via its interactive web site. Approximate claim locations shown on government claim maps and referred to on maps that accompany this Technical Report have not been verified by accurate surveys. 4.0 PROPERTY DESCRIPTION 4.1 Description The Hyland property is located in the Watson Lake Mining District of southeast Yukon (Figure 4.1), approximately 74 km northeast of the community of Watson Lake (Figure 4.2). It consists of 3 discrete claim blocks (Figures 4.3 and 4.4). Individual claim data is given on Table


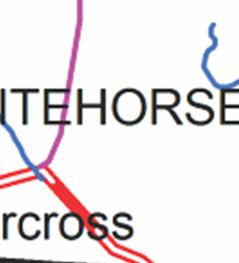
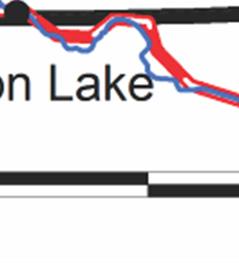
10 Figure 4.1: Yukon-Scale Project Location Map HYLAND GOLD PROJECT 5
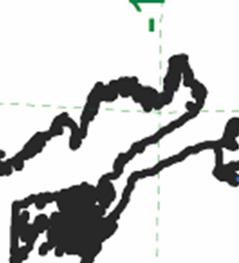
11 Figure 4.2: Project Regional Location Map 6


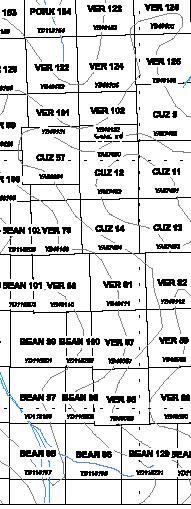
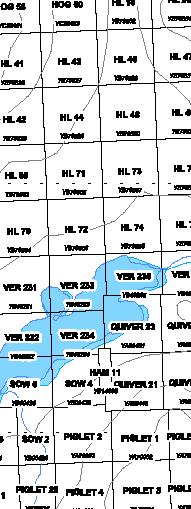
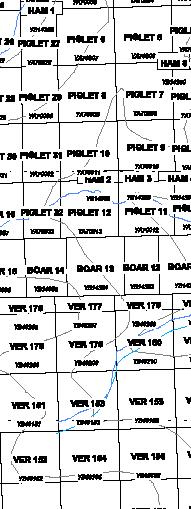
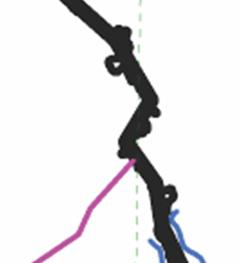
12 Figure 4.3: Hyland Gold Project Mineral Claims Location Map North Sheet 7


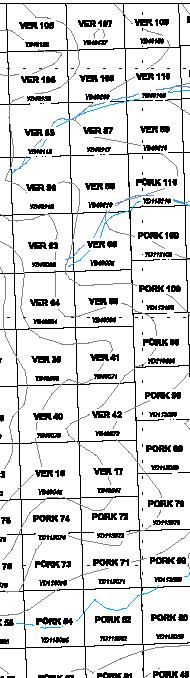
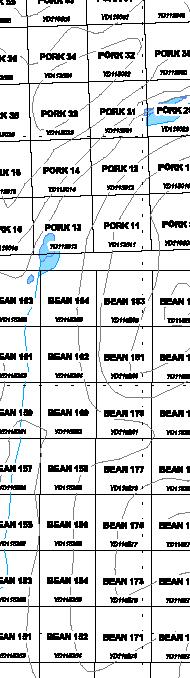
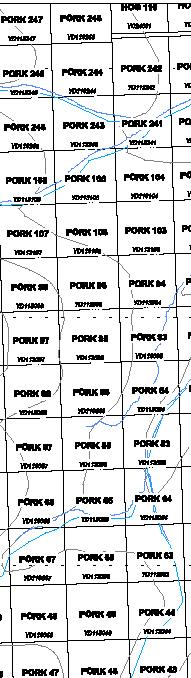
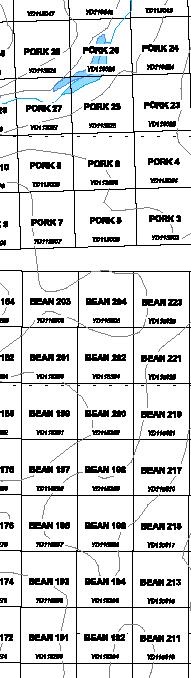
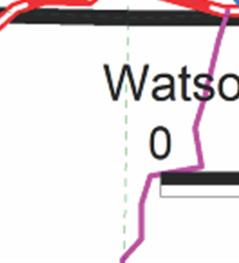
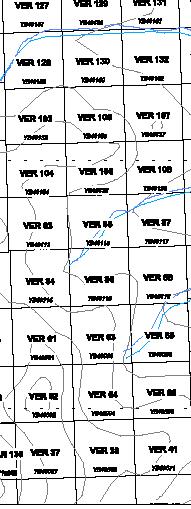
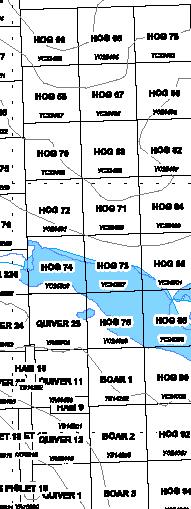
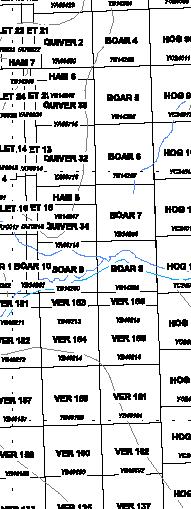
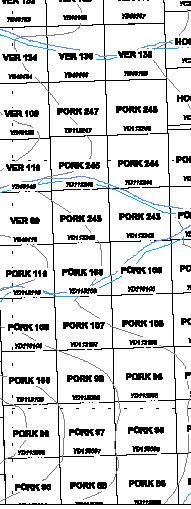
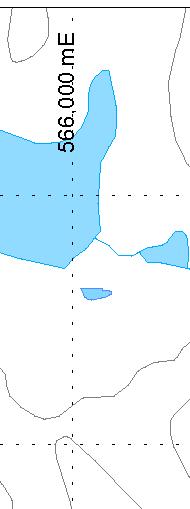
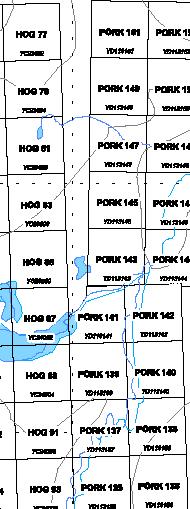
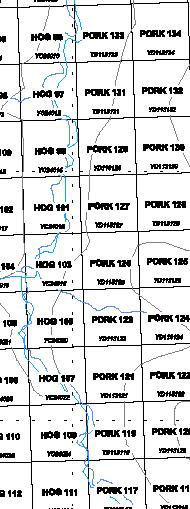
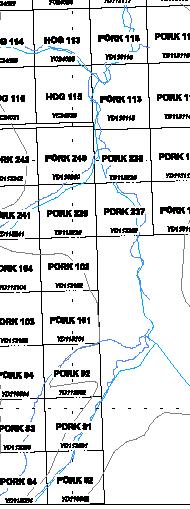
13 Figure 4.4: Hyland Gold Project Mineral Claims Location Map South Sheet 8
14 Block 1: 299 contiguous un-surveyed quartz mineral claims (~5,500 hectares), located in the Watson Lake Mining District. The registered owner of the claims is Banyan Gold Corp. Banyan s 100% ownership is subject to an assignment of an Option agreement between StrataGold Corporation ( StrataGold ) - now Victoria Gold Corp. ( Victoria Gold ), and Banyan Gold Corp. ( Banyan ) which is documented in Appendix 1. Block 2: 193 contiguous un-surveyed contiguous mineral claims (~4,030 hectares), located in the Watson Lake Mining District. The registered 100% owner of the claims is Banyan. These claims fall with the area of interest of StrataGold (now Victoria Gold) and they are subject to the Option agreement signed by StrataGold, Victoria Gold and Argus, which is documented in Appendix 1. Block 3: 435 contiguous un-surveyed quartz mineral claims (~9,090 hectares), located in the Watson Lake Mining District. The registered owner of the claims is Banyan Gold Corp., which holds an undivided 100% interest. Required work expenditures are $100 per claim for each year of assessment to be applied to the claim. A maximum of five years of assessment credit can be applied to each claim in the year of their expiry. A fee of $5 per claim per year is applied to all assessment filings. Prior to the anniversary date, a statement of proof of the required work expenditures must be provided to the Mining Recorder in order to maintain the claims in good standing. A report describing the work carried out on the claims must then be submitted to the Mining Recorder within six months of filing for assessment. The location of quartz claims in the Yukon is determined by the position of initial and final claim posts on the ground along a straight location line not exceeding 1500 feet. None of the Hyland Gold Project claims have been surveyed. The quartz claims confer rights to mineral tenure, whereas surface rights are held by the Yukon Territory. 4.2 Royalty Agreements In December 2009, Argus Metals Corp. signed an option agreement to earn a 100% interest in the Hyland Gold Project, Yukon Territory from StrataGold Corporation, a wholly owned subsidiary of Victoria Gold Corp. Under the terms of the agreement, Argus had the option to earn a 100% interest in the Hyland Gold Project, as it then existed, by incurring certain exploration expenditures, making cash payments and issuing shares (Appendix 1). As at October 31, 2011, Argus had completed $3,220,601 of exploration expenditures, thereby completing its expenditure obligations in relation to the option agreement. On February 15, 2013, Banyan (then Banyan Coast Capital) completed its Qualifying Transaction by completing a Definite Assignment and Transfer Agreement with Argus to acquire a 100% interest in the Hyland Gold project. All requirements of this option agreement have been satisfied. Victoria Gold Corp. (via its subsidiary StrataGold) has retained a capped 2.5% net smelter royalty of which 1.5% can be purchased at anytime for $1 million. The property is also subject to a 1% and 0.25% NSR on all core claims payable to historical property owners Pitchblack Resources Ltd. and Strategic Metals Ltd. respectively. Additionally, there is a 1% NSR on 88 of the current claims payable to Adrian Resources Ltd. that is capped at $1.5 million. 9
15 An area of interest of 1 km on the project in favour of Victoria Gold surrounds the original 299 mineral claims. A detailed review of underlying Hyland Gold Project Royalty Agreements and respective mineral claims is given in Appendix Environmental Liabilities and Permits Ownership of Quartz claims in Yukon confers rights to mineral tenure, whereas surface rights are held by the Crown in favour of Yukon Territory. A Quartz Mining Land Use Approval permit is required to conduct exploration in Yukon. A Class III Quartz Mining Land Use Approval permit is in place for the Hyland property (LQ00249b) and expires on April 17th of 2017, and all contemplated exploration activities will have to be in compliance with terms and conditions set out in the land use permit. A temporary exploration camp, complete with temporary buildings and wooden platforms for wall tents, is located along the south shore of Quartz Lake. This site has been used for accommodation of exploration crews since the early 1970 s. In addition to the camp facility, there is an area for storage of drill core. The camp and drill core lay down area will have to be left in a manner that satisfies conditions set out in the land use permit prior to the expiry of the permit or the expiry of consecutively succeeding land use permits. There are a medium sized bulldozer, a small excavator and a diamond drill along with associated tooling, supplies and support equipment currently stored on the property. These will have to be removed from the site prior to the expiry of the current or succeeding land use permits. Trenches and roads, whether historical or constructed under the current land use permit, will be annually required to be left in a manner that will not promote erosion under terms of the existing or anticipated succeeding land use permits. Petroleum products are stored on the property in compliance with terms of the existing land use permit. All petroleum products and storage containers for petroleum products will be required to be removed from the site prior to the expiry of the current or anticipated succeeding land use permits. 10
16 Table 4-1 Hyland Gold Project Tenure Data (downloaded from Yukon Mining Recorder web site Feb. 15, 2016) Grant Number Regulation Type Claim Name Claim Number Claim Owner Claim Expiry Date YA67489 Quartz CUZ 9 BANYAN GOLD CORP % 14/02/2021 YA67490 Quartz CUZ 10 BANYAN GOLD CORP % 14/02/2021 YA67491 Quartz CUZ 11 BANYAN GOLD CORP % 14/02/2021 YA67492 Quartz CUZ 12 BANYAN GOLD CORP % 14/02/2021 YA67493 Quartz CUZ 13 BANYAN GOLD CORP % 14/02/2021 YA67494 Quartz CUZ 14 BANYAN GOLD CORP % 14/02/2021 YA68429 Quartz QUIVER 1 BANYAN GOLD CORP % 14/02/2021 YA68430 Quartz QUIVER 2 BANYAN GOLD CORP % 14/02/2021 YA68439 Quartz QUIVER 11 BANYAN GOLD CORP % 14/02/2021 YA68440 Quartz QUIVER 12 BANYAN GOLD CORP % 14/02/2021 YA68449 Quartz QUIVER 21 BANYAN GOLD CORP % 14/02/2021 YA68450 Quartz QUIVER 22 BANYAN GOLD CORP % 14/02/2021 YA68451 Quartz QUIVER 23 BANYAN GOLD CORP % 14/02/2021 YA68452 Quartz QUIVER 24 BANYAN GOLD CORP % 14/02/2021 YA68709 Quartz QUIVER 25 BANYAN GOLD CORP % 14/02/2021 YA68714 Quartz QUIVER 30 BANYAN GOLD CORP % 14/02/2021 YA68716 Quartz QUIVER 32 BANYAN GOLD CORP % 14/02/2021 YA68718 Quartz QUIVER 34 BANYAN GOLD CORP % 14/02/2021 YA68994 Quartz CUZ 57 BANYAN GOLD CORP % 14/02/2021 YA70902 Quartz PIGLET 1 BANYAN GOLD CORP % 14/02/2021 YA70903 Quartz PIGLET 2 BANYAN GOLD CORP % 14/02/2021 YA70904 Quartz PIGLET 3 BANYAN GOLD CORP % 14/02/2021 YA70905 Quartz PIGLET 4 BANYAN GOLD CORP % 14/02/2021 YA70906 Quartz PIGLET 5 BANYAN GOLD CORP % 14/02/2021 YA70907 Quartz PIGLET 6 BANYAN GOLD CORP % 14/02/2021 YA70908 Quartz PIGLET 7 BANYAN GOLD CORP % 14/02/2021 YA70909 Quartz PIGLET 8 BANYAN GOLD CORP % 14/02/2021 YA70910 Quartz PIGLET 9 BANYAN GOLD CORP % 14/02/2021 YA70911 Quartz PIGLET 10 BANYAN GOLD CORP % 14/02/2021 YA70912 Quartz PIGLET 11 BANYAN GOLD CORP % 14/02/2021 YA70913 Quartz PIGLET 12 BANYAN GOLD CORP % 14/02/2021 YA70914 Quartz PIGLET 13 BANYAN GOLD CORP % 14/02/2021 YA70915 Quartz PIGLET 14 BANYAN GOLD CORP % 14/02/2021 YA70916 Quartz PIGLET 15 BANYAN GOLD CORP % 14/02/2021 YA70917 Quartz PIGLET 16 BANYAN GOLD CORP % 14/02/
17 Grant Number Regulation Type Claim Name Claim Number Claim Owner Claim Expiry Date YA70918 Quartz PIGLET 17 BANYAN GOLD CORP % 14/02/2021 YA70919 Quartz PIGLET 18 BANYAN GOLD CORP % 14/02/2021 YA70920 Quartz PIGLET 19 BANYAN GOLD CORP % 14/02/2021 YA70921 Quartz PIGLET 20 BANYAN GOLD CORP % 14/02/2021 YA70922 Quartz PIGLET 21 BANYAN GOLD CORP % 14/02/2021 YA70923 Quartz PIGLET 22 BANYAN GOLD CORP % 14/02/2021 YA70924 Quartz PIGLET 23 BANYAN GOLD CORP % 14/02/2021 YA70925 Quartz PIGLET 24 BANYAN GOLD CORP % 14/02/2021 YA70926 Quartz PIGLET 25 BANYAN GOLD CORP % 14/02/2021 YA70927 Quartz PIGLET 26 BANYAN GOLD CORP % 14/02/2021 YA70928 Quartz PIGLET 27 BANYAN GOLD CORP % 14/02/2021 YA70929 Quartz PIGLET 28 BANYAN GOLD CORP % 14/02/2021 YA70930 Quartz PIGLET 29 BANYAN GOLD CORP % 14/02/2021 YA70931 Quartz PIGLET 30 BANYAN GOLD CORP % 14/02/2021 YA70932 Quartz PIGLET 31 BANYAN GOLD CORP % 14/02/2021 YA70933 Quartz PIGLET 32 BANYAN GOLD CORP % 14/02/2021 YB00422 Quartz SOW 1 BANYAN GOLD CORP % 14/02/2021 YB00423 Quartz SOW 2 BANYAN GOLD CORP % 14/02/2021 YB00424 Quartz SOW 3 BANYAN GOLD CORP % 14/02/2021 YB00425 Quartz SOW 4 BANYAN GOLD CORP % 14/02/2021 YB00426 Quartz SOW 5 BANYAN GOLD CORP % 14/02/2021 YB14247 Quartz HAM 5 BANYAN GOLD CORP % 14/02/2021 YB14248 Quartz HAM 6 BANYAN GOLD CORP % 14/02/2021 YB14249 Quartz HAM 7 BANYAN GOLD CORP % 14/02/2021 YB14250 Quartz HAM 8 BANYAN GOLD CORP % 14/02/2021 YB14251 Quartz HAM 9 BANYAN GOLD CORP % 14/02/2021 YB14252 Quartz BOAR 1 BANYAN GOLD CORP % 14/02/2021 YB14253 Quartz BOAR 2 BANYAN GOLD CORP % 14/02/2021 YB14254 Quartz BOAR 3 BANYAN GOLD CORP % 14/02/2021 YB14255 Quartz BOAR 4 BANYAN GOLD CORP % 14/02/2021 YB14256 Quartz BOAR 5 BANYAN GOLD CORP % 14/02/2021 YB14257 Quartz BOAR 6 BANYAN GOLD CORP % 14/02/2021 YB14258 Quartz BOAR 7 BANYAN GOLD CORP % 14/02/2021 YB14259 Quartz BOAR 8 BANYAN GOLD CORP % 14/02/2021 YB14260 Quartz BOAR 9 BANYAN GOLD CORP % 14/02/2021 YB14261 Quartz BOAR 10 BANYAN GOLD CORP % 14/02/2021 YB14262 Quartz BOAR 11 BANYAN GOLD CORP % 14/02/2021 YB14383 Quartz BOAR 12 BANYAN GOLD CORP % 14/02/
18 Grant Number Regulation Type Claim Name Claim Number Claim Owner Claim Expiry Date YB14384 Quartz BOAR 13 BANYAN GOLD CORP % 14/02/2021 YB14385 Quartz BOAR 14 BANYAN GOLD CORP % 14/02/2021 YB14386 Quartz BOAR 15 BANYAN GOLD CORP % 14/02/2021 YB14387 Quartz BOAR 16 BANYAN GOLD CORP % 14/02/2021 YB14388 Quartz HAM 1 BANYAN GOLD CORP % 14/02/2021 YB14389 Quartz HAM 2 BANYAN GOLD CORP % 14/02/2021 YB14390 Quartz HAM 3 BANYAN GOLD CORP % 14/02/2021 YB14391 Quartz HAM 4 BANYAN GOLD CORP % 14/02/2021 YB14392 Quartz HAM 10 BANYAN GOLD CORP % 14/02/2021 YB14393 Quartz HAM 11 BANYAN GOLD CORP % 14/02/2021 YB15352 Quartz BOAR 17 BANYAN GOLD CORP % 14/02/2021 YB15353 Quartz BOAR 18 BANYAN GOLD CORP % 14/02/2021 YB15354 Quartz BOAR 19 BANYAN GOLD CORP % 14/02/2021 YB15355 Quartz BOAR 20 BANYAN GOLD CORP % 14/02/2021 YB15356 Quartz BOAR 21 BANYAN GOLD CORP % 14/02/2021 YB15357 Quartz BOAR 22 BANYAN GOLD CORP % 14/02/2021 YB15358 Quartz BOAR 23 BANYAN GOLD CORP % 14/02/2021 YB15359 Quartz BOAR 24 BANYAN GOLD CORP % 14/02/2021 YB15360 Quartz BOAR 25 BANYAN GOLD CORP % 14/02/2021 YB15361 Quartz BOAR 26 BANYAN GOLD CORP % 14/02/2021 YB15362 Quartz BOAR 27 BANYAN GOLD CORP % 14/02/2021 YB15363 Quartz BOAR 28 BANYAN GOLD CORP % 14/02/2021 YB49043 Quartz VER 13 BANYAN GOLD CORP % 14/02/2021 YB49045 Quartz VER 15 BANYAN GOLD CORP % 14/02/2021 YB49047 Quartz VER 17 BANYAN GOLD CORP % 14/02/2021 YB49067 Quartz VER 37 BANYAN GOLD CORP % 14/02/2021 YB49068 Quartz VER 38 BANYAN GOLD CORP % 14/02/2021 YB49069 Quartz VER 39 BANYAN GOLD CORP % 14/02/2021 YB49070 Quartz VER 40 BANYAN GOLD CORP % 14/02/2021 YB49071 Quartz VER 41 BANYAN GOLD CORP % 14/02/2021 YB49072 Quartz VER 42 BANYAN GOLD CORP % 14/02/2021 YD Quartz PORK 1 BANYAN GOLD CORP % 11/16/2019 YD Quartz PORK 2 BANYAN GOLD CORP % 11/16/2019 YD Quartz PORK 3 BANYAN GOLD CORP % 11/16/2019 YD Quartz PORK 4 BANYAN GOLD CORP % 11/16/2019 YD Quartz PORK 5 BANYAN GOLD CORP % 11/16/2019 YD Quartz PORK 6 BANYAN GOLD CORP % 11/16/2019 YD Quartz PORK 7 BANYAN GOLD CORP % 11/16/2019 YD Quartz PORK 8 BANYAN GOLD CORP % 11/16/2019 YD Quartz PORK 9 BANYAN GOLD CORP % 11/16/
19 Grant Number Regulation Type Claim Name Claim Number Claim Owner Claim Expiry Date YD Quartz PORK 10 BANYAN GOLD CORP % 11/16/2019 YD Quartz PORK 11 BANYAN GOLD CORP % 11/16/2019 YD Quartz PORK 12 BANYAN GOLD CORP % 11/16/2019 YD Quartz PORK 13 BANYAN GOLD CORP % 11/16/2019 YD Quartz PORK 14 BANYAN GOLD CORP % 11/16/2019 YD Quartz PORK 15 BANYAN GOLD CORP % 11/16/2019 YD Quartz PORK 16 BANYAN GOLD CORP % 11/16/2019 YD Quartz PORK 17 BANYAN GOLD CORP % 11/16/2019 YD Quartz PORK 18 BANYAN GOLD CORP % 11/16/2019 YD Quartz PORK 19 BANYAN GOLD CORP % 11/16/2019 YD Quartz PORK 20 BANYAN GOLD CORP % 11/16/2019 YD Quartz PORK 21 BANYAN GOLD CORP % 11/16/2019 YD Quartz PORK 22 BANYAN GOLD CORP % 11/16/2019 YD Quartz PORK 23 BANYAN GOLD CORP % 11/16/2019 YD Quartz PORK 24 BANYAN GOLD CORP % 11/16/2019 YD Quartz PORK 25 BANYAN GOLD CORP % 11/16/2019 YD Quartz PORK 26 BANYAN GOLD CORP % 11/16/2019 YD Quartz PORK 27 BANYAN GOLD CORP % 11/16/2019 YD Quartz PORK 28 BANYAN GOLD CORP % 11/16/2019 YD Quartz PORK 29 BANYAN GOLD CORP % 11/16/2019 YD Quartz PORK 30 BANYAN GOLD CORP % 11/16/2019 YD Quartz PORK 31 BANYAN GOLD CORP % 11/16/2019 YD Quartz PORK 32 BANYAN GOLD CORP % 11/16/2019 YD Quartz PORK 33 BANYAN GOLD CORP % 11/16/2019 YD Quartz PORK 34 BANYAN GOLD CORP % 11/16/2019 YD Quartz PORK 35 BANYAN GOLD CORP % 11/16/2019 YD Quartz PORK 36 BANYAN GOLD CORP % 11/16/2019 YD Quartz PORK 37 BANYAN GOLD CORP % 11/16/2019 YD Quartz PORK 38 BANYAN GOLD CORP % 11/16/2019 YD Quartz PORK 39 BANYAN GOLD CORP % 11/16/2019 YD Quartz PORK 40 BANYAN GOLD CORP % 11/16/2019 YD Quartz PORK 41 BANYAN GOLD CORP % 11/16/2019 YD Quartz PORK 42 BANYAN GOLD CORP % 11/16/2019 YD Quartz PORK 43 BANYAN GOLD CORP % 11/16/2019 YD Quartz PORK 44 BANYAN GOLD CORP % 11/16/2019 YD Quartz PORK 45 BANYAN GOLD CORP % 11/16/2019 YD Quartz PORK 46 BANYAN GOLD CORP % 11/16/2019 YD Quartz PORK 47 BANYAN GOLD CORP % 11/16/2019 YD Quartz PORK 48 BANYAN GOLD CORP % 11/16/2019 YD Quartz PORK 49 BANYAN GOLD CORP % 11/16/
20 Grant Number Regulation Type Claim Name Claim Number Claim Owner Claim Expiry Date YD Quartz PORK 50 BANYAN GOLD CORP % 11/16/2019 YD Quartz PORK 51 BANYAN GOLD CORP % 11/16/2019 YD Quartz PORK 52 BANYAN GOLD CORP % 11/16/2019 YD Quartz PORK 53 BANYAN GOLD CORP % 11/16/2019 YD Quartz PORK 54 BANYAN GOLD CORP % 11/16/2019 YD Quartz PORK 55 BANYAN GOLD CORP % 11/16/2019 YD Quartz PORK 56 BANYAN GOLD CORP % 11/16/2019 YD Quartz PORK 57 BANYAN GOLD CORP % 11/16/2019 YD Quartz PORK 58 BANYAN GOLD CORP % 11/16/2019 YD Quartz PORK 59 BANYAN GOLD CORP % 11/16/2019 YD Quartz PORK 60 BANYAN GOLD CORP % 11/16/2019 YD Quartz PORK 61 BANYAN GOLD CORP % 11/16/2019 YD Quartz PORK 62 BANYAN GOLD CORP % 11/16/2019 YD Quartz PORK 63 BANYAN GOLD CORP % 11/16/2019 YD Quartz PORK 64 BANYAN GOLD CORP % 11/16/2019 YD Quartz PORK 65 BANYAN GOLD CORP % 11/16/2019 YD Quartz PORK 66 BANYAN GOLD CORP % 11/16/2019 YD Quartz PORK 67 BANYAN GOLD CORP % 11/16/2019 YD Quartz PORK 68 BANYAN GOLD CORP % 11/16/2019 YD Quartz PORK 69 BANYAN GOLD CORP % 11/16/2019 YD Quartz PORK 70 BANYAN GOLD CORP % 11/16/2019 YD Quartz PORK 71 BANYAN GOLD CORP % 11/16/2019 YD Quartz PORK 72 BANYAN GOLD CORP % 11/16/2019 YD Quartz PORK 73 BANYAN GOLD CORP % 11/16/2019 YD Quartz PORK 74 BANYAN GOLD CORP % 11/16/2019 YD Quartz PORK 75 BANYAN GOLD CORP % 11/16/2019 YD Quartz PORK 76 BANYAN GOLD CORP % 11/16/2019 YD Quartz PORK 77 BANYAN GOLD CORP % 11/16/2019 YD Quartz PORK 78 BANYAN GOLD CORP % 11/16/2019 YD Quartz PORK 79 BANYAN GOLD CORP % 11/16/2019 YD Quartz PORK 80 BANYAN GOLD CORP % 11/16/2019 YD Quartz PORK 81 BANYAN GOLD CORP % 11/16/2019 YD Quartz PORK 82 BANYAN GOLD CORP % 11/16/2019 YD Quartz PORK 83 BANYAN GOLD CORP % 11/16/2019 YD Quartz PORK 84 BANYAN GOLD CORP % 11/16/2019 YD Quartz PORK 85 BANYAN GOLD CORP % 11/16/2019 YD Quartz PORK 86 BANYAN GOLD CORP % 11/16/2019 YD Quartz PORK 87 BANYAN GOLD CORP % 11/16/2019 YD Quartz PORK 88 BANYAN GOLD CORP % 11/16/2019 YD Quartz PORK 89 BANYAN GOLD CORP % 11/16/
21 Grant Number Regulation Type Claim Name Claim Number Claim Owner Claim Expiry Date YD Quartz PORK 90 BANYAN GOLD CORP % 11/16/2019 YD Quartz PORK 91 BANYAN GOLD CORP % 11/16/2019 YD Quartz PORK 92 BANYAN GOLD CORP % 11/16/2019 YD Quartz PORK 93 BANYAN GOLD CORP % 11/16/2019 YD Quartz PORK 94 BANYAN GOLD CORP % 11/16/2019 YD Quartz PORK 95 BANYAN GOLD CORP % 11/16/2019 YD Quartz PORK 96 BANYAN GOLD CORP % 11/16/2019 YD Quartz PORK 97 BANYAN GOLD CORP % 11/16/2019 YD Quartz PORK 98 BANYAN GOLD CORP % 11/16/2019 YD Quartz PORK 99 BANYAN GOLD CORP % 11/16/2019 YD Quartz PORK 100 BANYAN GOLD CORP % 11/16/2019 YD Quartz PORK 101 BANYAN GOLD CORP % 11/16/2019 YD Quartz PORK 102 BANYAN GOLD CORP % 11/16/2019 YD Quartz PORK 103 BANYAN GOLD CORP % 11/16/2019 YD Quartz PORK 104 BANYAN GOLD CORP % 11/16/2019 YD Quartz PORK 105 BANYAN GOLD CORP % 11/16/2019 YD Quartz PORK 106 BANYAN GOLD CORP % 11/16/2019 YD Quartz PORK 107 BANYAN GOLD CORP % 11/16/2019 YD Quartz PORK 108 BANYAN GOLD CORP % 11/16/2019 YD Quartz PORK 109 BANYAN GOLD CORP % 11/16/2019 YD Quartz PORK 110 BANYAN GOLD CORP % 11/16/2019 YD Quartz PORK 111 BANYAN GOLD CORP % 11/16/2019 YD Quartz PORK 112 BANYAN GOLD CORP % 11/16/2019 YD Quartz PORK 113 BANYAN GOLD CORP % 11/16/2019 YD Quartz PORK 114 BANYAN GOLD CORP % 11/16/2019 YD Quartz PORK 115 BANYAN GOLD CORP % 11/16/2019 YD Quartz PORK 116 BANYAN GOLD CORP % 11/16/2019 YD Quartz PORK 117 BANYAN GOLD CORP % 11/16/2019 YD Quartz PORK 118 BANYAN GOLD CORP % 11/16/2019 YD Quartz PORK 119 BANYAN GOLD CORP % 11/16/2019 YD Quartz PORK 120 BANYAN GOLD CORP % 11/16/2019 YD Quartz PORK 121 BANYAN GOLD CORP % 11/16/2019 YD Quartz PORK 122 BANYAN GOLD CORP % 11/16/2019 YD Quartz PORK 123 BANYAN GOLD CORP % 11/16/2019 YD Quartz PORK 124 BANYAN GOLD CORP % 11/16/2019 YD Quartz PORK 125 BANYAN GOLD CORP % 11/16/2019 YD Quartz PORK 126 BANYAN GOLD CORP % 11/16/2019 YD Quartz PORK 127 BANYAN GOLD CORP % 11/16/2019 YD Quartz PORK 128 BANYAN GOLD CORP % 11/16/2019 YD Quartz PORK 129 BANYAN GOLD CORP % 11/16/
22 Grant Number Regulation Type Claim Name Claim Number Claim Owner Claim Expiry Date YD Quartz PORK 130 BANYAN GOLD CORP % 11/16/2019 YD Quartz PORK 131 BANYAN GOLD CORP % 11/16/2019 YD Quartz PORK 132 BANYAN GOLD CORP % 11/16/2019 YD Quartz PORK 133 BANYAN GOLD CORP % 11/16/2019 YD Quartz PORK 134 BANYAN GOLD CORP % 11/16/2019 YD Quartz PORK 135 BANYAN GOLD CORP % 11/16/2019 YD Quartz PORK 136 BANYAN GOLD CORP % 11/16/2019 YD Quartz PORK 137 BANYAN GOLD CORP % 11/16/2019 YD Quartz PORK 138 BANYAN GOLD CORP % 11/16/2019 YD Quartz PORK 139 BANYAN GOLD CORP % 11/16/2019 YD Quartz PORK 140 BANYAN GOLD CORP % 11/16/2019 YD Quartz PORK 141 BANYAN GOLD CORP % 11/16/2019 YD Quartz PORK 142 BANYAN GOLD CORP % 11/16/2019 YD Quartz PORK 143 BANYAN GOLD CORP % 11/16/2019 YD Quartz PORK 144 BANYAN GOLD CORP % 11/16/2019 YD Quartz PORK 145 BANYAN GOLD CORP % 11/16/2019 YD Quartz PORK 146 BANYAN GOLD CORP % 11/16/2019 YD Quartz PORK 147 BANYAN GOLD CORP % 11/16/2019 YD Quartz PORK 148 BANYAN GOLD CORP % 11/16/2019 YD Quartz PORK 149 BANYAN GOLD CORP % 11/16/2019 YD Quartz PORK 150 BANYAN GOLD CORP % 11/16/2019 YD Quartz PORK 151 BANYAN GOLD CORP % 11/16/2019 YD Quartz PORK 152 BANYAN GOLD CORP % 11/16/2019 YD Quartz PORK 153 BANYAN GOLD CORP % 11/16/2019 YD Quartz PORK 154 BANYAN GOLD CORP % 11/16/2019 YD Quartz PORK 155 BANYAN GOLD CORP % 11/16/2019 YD Quartz PORK 156 BANYAN GOLD CORP % 11/16/2019 YD Quartz PORK 157 BANYAN GOLD CORP % 11/16/2019 YD Quartz PORK 158 BANYAN GOLD CORP % 11/16/2019 YD Quartz PORK 159 BANYAN GOLD CORP % 11/16/2019 YD Quartz PORK 160 BANYAN GOLD CORP % 11/16/2019 YD Quartz PORK 161 BANYAN GOLD CORP % 11/16/2019 YD Quartz PORK 162 BANYAN GOLD CORP % 11/16/2019 YD Quartz PORK 163 BANYAN GOLD CORP % 11/16/2019 YD Quartz PORK 164 BANYAN GOLD CORP % 11/16/2019 YD Quartz PORK 165 BANYAN GOLD CORP % 11/16/2019 YD Quartz PORK 166 BANYAN GOLD CORP % 11/16/2019 YD Quartz PORK 167 BANYAN GOLD CORP % 11/16/2019 YD Quartz PORK 168 BANYAN GOLD CORP % 11/16/2019 YD Quartz PORK 169 BANYAN GOLD CORP % 11/16/
23 Grant Number Regulation Type Claim Name Claim Number Claim Owner Claim Expiry Date YD Quartz PORK 170 BANYAN GOLD CORP % 11/16/2019 YD Quartz PORK 171 BANYAN GOLD CORP % 11/16/2019 YD Quartz PORK 172 BANYAN GOLD CORP % 11/16/2019 YD Quartz PORK 173 BANYAN GOLD CORP % 11/16/2019 YD Quartz PORK 174 BANYAN GOLD CORP % 11/16/2019 YD Quartz PORK 175 BANYAN GOLD CORP % 11/16/2019 YD Quartz PORK 176 BANYAN GOLD CORP % 11/16/2019 YD Quartz PORK 177 BANYAN GOLD CORP % 11/16/2019 YD Quartz PORK 178 BANYAN GOLD CORP % 11/16/2019 YD Quartz PORK 179 BANYAN GOLD CORP % 11/16/2019 YD Quartz PORK 180 BANYAN GOLD CORP % 11/16/2019 YD Quartz PORK 181 BANYAN GOLD CORP % 11/16/2019 YD Quartz PORK 182 BANYAN GOLD CORP % 11/16/2019 YD Quartz PORK 183 BANYAN GOLD CORP % 11/16/2019 YD Quartz PORK 184 BANYAN GOLD CORP % 11/16/2019 YD Quartz PORK 185 BANYAN GOLD CORP % 11/16/2019 YD Quartz PORK 186 BANYAN GOLD CORP % 11/16/2019 YD Quartz PORK 187 BANYAN GOLD CORP % 11/16/2019 YD Quartz PORK 188 BANYAN GOLD CORP % 11/16/2019 YD Quartz PORK 189 BANYAN GOLD CORP % 11/16/2019 YD Quartz PORK 190 BANYAN GOLD CORP % 11/16/2019 YD Quartz PORK 191 BANYAN GOLD CORP % 11/16/2019 YD Quartz PORK 192 BANYAN GOLD CORP % 11/16/2019 YD Quartz PORK 193 BANYAN GOLD CORP % 11/16/2019 YD Quartz PORK 194 BANYAN GOLD CORP % 11/16/2019 YD Quartz PORK 195 BANYAN GOLD CORP % 11/16/2019 YD Quartz PORK 196 BANYAN GOLD CORP % 11/16/2019 YD Quartz PORK 197 BANYAN GOLD CORP % 11/16/2019 YD Quartz PORK 198 BANYAN GOLD CORP % 11/16/2019 YD Quartz PORK 199 BANYAN GOLD CORP % 11/16/2019 YD Quartz PORK 200 BANYAN GOLD CORP % 11/16/2019 YD Quartz PORK 201 BANYAN GOLD CORP % 11/16/2019 YD Quartz PORK 202 BANYAN GOLD CORP % 11/16/2019 YD Quartz PORK 203 BANYAN GOLD CORP % 11/16/2019 YD Quartz PORK 204 BANYAN GOLD CORP % 11/16/2019 YD Quartz PORK 205 BANYAN GOLD CORP % 11/16/2019 YD Quartz PORK 206 BANYAN GOLD CORP % 11/16/2019 YD Quartz PORK 207 BANYAN GOLD CORP % 11/16/2019 YD Quartz PORK 208 BANYAN GOLD CORP % 11/16/2019 YD Quartz PORK 209 BANYAN GOLD CORP % 11/16/
24 Grant Number Regulation Type Claim Name Claim Number Claim Owner Claim Expiry Date YD Quartz PORK 210 BANYAN GOLD CORP % 11/16/2019 YD Quartz PORK 211 BANYAN GOLD CORP % 11/16/2019 YD Quartz PORK 212 BANYAN GOLD CORP % 11/16/2019 YD Quartz PORK 213 BANYAN GOLD CORP % 11/16/2019 YD Quartz PORK 214 BANYAN GOLD CORP % 11/16/2019 YD Quartz PORK 215 BANYAN GOLD CORP % 11/16/2019 YD Quartz PORK 216 BANYAN GOLD CORP % 11/16/2019 YD Quartz PORK 217 BANYAN GOLD CORP % 11/16/2019 YD Quartz PORK 218 BANYAN GOLD CORP % 11/16/2019 YD Quartz PORK 219 BANYAN GOLD CORP % 11/16/2019 YD Quartz PORK 220 BANYAN GOLD CORP % 11/16/2019 YD Quartz PORK 221 BANYAN GOLD CORP % 11/16/2019 YD Quartz PORK 222 BANYAN GOLD CORP % 11/16/2019 YD Quartz PORK 223 BANYAN GOLD CORP % 11/16/2019 YD Quartz PORK 224 BANYAN GOLD CORP % 11/16/2019 YD Quartz PORK 225 BANYAN GOLD CORP % 11/16/2019 YD Quartz PORK 226 BANYAN GOLD CORP % 11/16/2019 YD Quartz PORK 227 BANYAN GOLD CORP % 11/16/2019 YD Quartz PORK 228 BANYAN GOLD CORP % 11/16/2019 YD Quartz PORK 229 BANYAN GOLD CORP % 11/16/2019 YD Quartz PORK 230 BANYAN GOLD CORP % 11/16/2019 YD Quartz PORK 231 BANYAN GOLD CORP % 11/16/2019 YD Quartz PORK 232 BANYAN GOLD CORP % 11/16/2019 YD Quartz PORK 233 BANYAN GOLD CORP % 11/16/2019 YD Quartz PORK 234 BANYAN GOLD CORP % 11/16/2019 YD Quartz PORK 235 BANYAN GOLD CORP % 11/16/2019 YD Quartz PORK 236 BANYAN GOLD CORP % 11/16/2019 YD Quartz PORK 237 BANYAN GOLD CORP % 11/16/2019 YD Quartz PORK 238 BANYAN GOLD CORP % 11/16/2019 YD Quartz PORK 239 BANYAN GOLD CORP % 11/16/2019 YD Quartz PORK 240 BANYAN GOLD CORP % 11/16/2019 YD Quartz PORK 241 BANYAN GOLD CORP % 11/16/2019 YD Quartz PORK 242 BANYAN GOLD CORP % 11/16/2019 YD Quartz PORK 243 BANYAN GOLD CORP % 11/16/2019 YD Quartz PORK 244 BANYAN GOLD CORP % 11/16/2019 YD Quartz PORK 245 BANYAN GOLD CORP % 11/16/2019 YD Quartz PORK 246 BANYAN GOLD CORP % 11/16/2019 YD Quartz PORK 247 BANYAN GOLD CORP % 11/16/2019 YD Quartz PORK 248 BANYAN GOLD CORP % 11/16/2019 YD Quartz ROAST 1 BANYAN GOLD CORP % 11/19/
25 Grant Number Regulation Type Claim Name Claim Number Claim Owner Claim Expiry Date YD Quartz ROAST 2 BANYAN GOLD CORP % 11/19/2019 YD Quartz ROAST 3 BANYAN GOLD CORP % 11/19/2019 YD Quartz ROAST 4 BANYAN GOLD CORP % 11/19/2019 YD Quartz ROAST 5 BANYAN GOLD CORP % 11/19/2019 YD Quartz ROAST 6 BANYAN GOLD CORP % 11/19/2019 YD Quartz ROAST 7 BANYAN GOLD CORP % 11/19/2019 YD Quartz ROAST 8 BANYAN GOLD CORP % 11/19/2019 YD Quartz ROAST 9 BANYAN GOLD CORP % 11/19/2019 YD Quartz ROAST 10 BANYAN GOLD CORP % 11/19/2019 YD Quartz ROAST 11 BANYAN GOLD CORP % 11/19/2019 YD Quartz ROAST 12 BANYAN GOLD CORP % 11/19/2019 YD Quartz ROAST 13 BANYAN GOLD CORP % 11/19/2019 YD Quartz ROAST 14 BANYAN GOLD CORP % 11/19/2019 YD Quartz ROAST 15 BANYAN GOLD CORP % 11/19/2019 YD Quartz ROAST 16 BANYAN GOLD CORP % 11/19/2019 YD Quartz ROAST 17 BANYAN GOLD CORP % 11/19/2019 YD Quartz ROAST 18 BANYAN GOLD CORP % 11/19/2019 YD Quartz ROAST 19 BANYAN GOLD CORP % 11/19/2019 YD Quartz ROAST 20 BANYAN GOLD CORP % 11/19/2019 YD Quartz ROAST 21 BANYAN GOLD CORP % 11/19/2019 YD Quartz ROAST 22 BANYAN GOLD CORP % 11/19/2019 YD Quartz ROAST 23 BANYAN GOLD CORP % 11/19/2019 YD Quartz ROAST 24 BANYAN GOLD CORP % 11/19/2019 YD Quartz ROAST 25 BANYAN GOLD CORP % 11/19/2019 YD Quartz ROAST 26 BANYAN GOLD CORP % 11/19/2019 YD Quartz ROAST 27 BANYAN GOLD CORP % 11/19/2019 YD Quartz ROAST 28 BANYAN GOLD CORP % 11/19/2019 YD Quartz ROAST 29 BANYAN GOLD CORP % 11/19/2019 YD Quartz ROAST 30 BANYAN GOLD CORP % 11/19/2019 YD Quartz ROAST 31 BANYAN GOLD CORP % 11/19/2019 YD Quartz ROAST 32 BANYAN GOLD CORP % 11/19/2019 YD Quartz ROAST 33 BANYAN GOLD CORP % 11/19/2019 YD Quartz ROAST 34 BANYAN GOLD CORP % 11/19/2019 YD Quartz ROAST 35 BANYAN GOLD CORP % 11/19/2019 YD Quartz ROAST 36 BANYAN GOLD CORP % 11/19/2019 YD Quartz ROAST 37 BANYAN GOLD CORP % 11/19/2019 YD Quartz ROAST 38 BANYAN GOLD CORP % 11/19/2019 YD Quartz ROAST 39 BANYAN GOLD CORP % 11/19/2019 YD Quartz ROAST 40 BANYAN GOLD CORP % 11/19/2019 YD Quartz ROAST 41 BANYAN GOLD CORP % 11/19/
26 Grant Number Regulation Type Claim Name Claim Number Claim Owner Claim Expiry Date YD Quartz ROAST 42 BANYAN GOLD CORP % 11/19/2019 YD Quartz ROAST 43 BANYAN GOLD CORP % 11/19/2019 YD Quartz ROAST 44 BANYAN GOLD CORP % 11/19/2019 YD Quartz ROAST 45 BANYAN GOLD CORP % 11/19/2019 YD Quartz ROAST 46 BANYAN GOLD CORP % 11/19/2019 YD Quartz ROAST 47 BANYAN GOLD CORP % 11/19/2019 YD Quartz ROAST 48 BANYAN GOLD CORP % 11/19/2019 YD Quartz ROAST 49 BANYAN GOLD CORP % 11/19/2019 YD Quartz ROAST 50 BANYAN GOLD CORP % 11/19/2019 YD Quartz ROAST 51 BANYAN GOLD CORP % 11/19/2019 YD Quartz ROAST 52 BANYAN GOLD CORP % 11/19/2019 YD Quartz ROAST 53 BANYAN GOLD CORP % 11/19/2019 YD Quartz ROAST 54 BANYAN GOLD CORP % 11/19/2019 YD Quartz ROAST 55 BANYAN GOLD CORP % 11/19/2019 YD Quartz ROAST 56 BANYAN GOLD CORP % 11/19/2019 YD Quartz BEAN 1 BANYAN GOLD CORP % 11/19/2019 YD Quartz BEAN 2 BANYAN GOLD CORP % 11/19/2019 YD Quartz BEAN 3 BANYAN GOLD CORP % 11/19/2019 YD Quartz BEAN 4 BANYAN GOLD CORP % 11/19/2019 YD Quartz BEAN 5 BANYAN GOLD CORP % 11/19/2019 YD Quartz BEAN 6 BANYAN GOLD CORP % 11/19/2019 YD Quartz BEAN 7 BANYAN GOLD CORP % 11/19/2019 YD Quartz BEAN 8 BANYAN GOLD CORP % 11/19/2019 YD Quartz BEAN 9 BANYAN GOLD CORP % 11/19/2019 YD Quartz BEAN 10 BANYAN GOLD CORP % 11/19/2019 YD Quartz BEAN 11 BANYAN GOLD CORP % 11/19/2019 YD Quartz BEAN 12 BANYAN GOLD CORP % 11/19/2019 YD Quartz BEAN 13 BANYAN GOLD CORP % 11/19/2019 YD Quartz BEAN 14 BANYAN GOLD CORP % 11/19/2019 YD Quartz BEAN 15 BANYAN GOLD CORP % 11/19/2019 YD Quartz BEAN 16 BANYAN GOLD CORP % 11/19/2019 YD Quartz BEAN 17 BANYAN GOLD CORP % 11/19/2019 YD Quartz BEAN 18 BANYAN GOLD CORP % 11/19/2019 YD Quartz BEAN 19 BANYAN GOLD CORP % 11/19/2019 YD Quartz BEAN 20 BANYAN GOLD CORP % 11/19/2019 YD Quartz BEAN 21 BANYAN GOLD CORP % 11/19/2019 YD Quartz BEAN 22 BANYAN GOLD CORP % 11/19/2019 YD Quartz BEAN 23 BANYAN GOLD CORP % 11/19/2019 YD Quartz BEAN 24 BANYAN GOLD CORP % 11/19/2019 YD Quartz BEAN 25 BANYAN GOLD CORP % 11/19/
27 Grant Number Regulation Type Claim Name Claim Number Claim Owner Claim Expiry Date YD Quartz BEAN 26 BANYAN GOLD CORP % 11/19/2019 YD Quartz BEAN 27 BANYAN GOLD CORP % 11/19/2019 YD Quartz BEAN 28 BANYAN GOLD CORP % 11/19/2019 YD Quartz BEAN 29 BANYAN GOLD CORP % 11/19/2019 YD Quartz BEAN 30 BANYAN GOLD CORP % 11/19/2019 YD Quartz BEAN 31 BANYAN GOLD CORP % 11/19/2019 YD Quartz BEAN 32 BANYAN GOLD CORP % 11/19/2019 YD Quartz BEAN 33 BANYAN GOLD CORP % 11/19/2019 YD Quartz BEAN 34 BANYAN GOLD CORP % 11/19/2019 YD Quartz BEAN 35 BANYAN GOLD CORP % 11/19/2019 YD Quartz BEAN 36 BANYAN GOLD CORP % 11/19/2019 YD Quartz BEAN 37 BANYAN GOLD CORP % 11/19/2019 YD Quartz BEAN 38 BANYAN GOLD CORP % 11/19/2019 YD Quartz BEAN 39 BANYAN GOLD CORP % 11/19/2019 YD Quartz BEAN 40 BANYAN GOLD CORP % 11/19/2019 YD Quartz BEAN 41 BANYAN GOLD CORP % 11/19/2019 YD Quartz BEAN 42 BANYAN GOLD CORP % 11/19/2019 YD Quartz BEAN 43 BANYAN GOLD CORP % 11/19/2019 YD Quartz BEAN 44 BANYAN GOLD CORP % 11/19/2019 YD Quartz BEAN 45 BANYAN GOLD CORP % 11/19/2019 YD Quartz BEAN 46 BANYAN GOLD CORP % 11/19/2019 YD Quartz BEAN 47 BANYAN GOLD CORP % 11/19/2019 YD Quartz BEAN 48 BANYAN GOLD CORP % 11/19/2019 YD Quartz BEAN 49 BANYAN GOLD CORP % 11/19/2019 YD Quartz BEAN 50 BANYAN GOLD CORP % 11/19/2019 YD Quartz BEAN 51 BANYAN GOLD CORP % 11/19/2019 YD Quartz BEAN 52 BANYAN GOLD CORP % 11/19/2019 YD Quartz BEAN 53 BANYAN GOLD CORP % 11/19/2019 YD Quartz BEAN 54 BANYAN GOLD CORP % 11/19/2019 YD Quartz BEAN 55 BANYAN GOLD CORP % 11/19/2019 YD Quartz BEAN 56 BANYAN GOLD CORP % 11/19/2019 YD Quartz BEAN 57 BANYAN GOLD CORP % 11/19/2019 YD Quartz BEAN 58 BANYAN GOLD CORP % 11/19/2019 YD Quartz BEAN 59 BANYAN GOLD CORP % 11/19/2019 YD Quartz BEAN 60 BANYAN GOLD CORP % 11/19/2019 YD Quartz BEAN 61 BANYAN GOLD CORP % 11/19/2019 YD Quartz BEAN 62 BANYAN GOLD CORP % 11/19/2019 YD Quartz BEAN 63 BANYAN GOLD CORP % 11/19/2019 YD Quartz BEAN 64 BANYAN GOLD CORP % 11/19/2019 YD Quartz BEAN 65 BANYAN GOLD CORP % 11/19/
28 Grant Number Regulation Type Claim Name Claim Number Claim Owner Claim Expiry Date YD Quartz BEAN 66 BANYAN GOLD CORP % 11/19/2019 YD Quartz BEAN 67 BANYAN GOLD CORP % 11/19/2019 YD Quartz BEAN 68 BANYAN GOLD CORP % 11/19/2019 YD Quartz BEAN 69 BANYAN GOLD CORP % 11/19/2019 YD Quartz BEAN 70 BANYAN GOLD CORP % 11/19/2019 YD Quartz BEAN 71 BANYAN GOLD CORP % 11/19/2019 YD Quartz BEAN 72 BANYAN GOLD CORP % 11/19/2019 YD Quartz BEAN 73 BANYAN GOLD CORP % 11/19/2019 YD Quartz BEAN 74 BANYAN GOLD CORP % 11/19/2019 YD Quartz BEAN 75 BANYAN GOLD CORP % 11/19/2019 YD Quartz BEAN 76 BANYAN GOLD CORP % 11/19/2019 YD Quartz BEAN 77 BANYAN GOLD CORP % 11/19/2019 YD Quartz BEAN 78 BANYAN GOLD CORP % 11/19/2019 YD Quartz BEAN 79 BANYAN GOLD CORP % 11/19/2019 YD Quartz BEAN 80 BANYAN GOLD CORP % 11/19/2019 YD Quartz BEAN 81 BANYAN GOLD CORP % 11/19/2019 YD Quartz BEAN 82 BANYAN GOLD CORP % 11/19/2019 YD Quartz BEAN 83 BANYAN GOLD CORP % 11/19/2019 YD Quartz BEAN 84 BANYAN GOLD CORP % 11/19/2019 YD Quartz BEAN 85 BANYAN GOLD CORP % 11/19/2019 YD Quartz BEAN 86 BANYAN GOLD CORP % 11/19/2019 YD Quartz BEAN 87 BANYAN GOLD CORP % 11/19/2019 YD Quartz BEAN 88 BANYAN GOLD CORP % 11/19/2019 YD Quartz BEAN 89 BANYAN GOLD CORP % 11/19/2019 YD Quartz BEAN 90 BANYAN GOLD CORP % 11/19/2019 YD Quartz BEAN 91 BANYAN GOLD CORP % 11/19/2019 YD Quartz BEAN 92 BANYAN GOLD CORP % 11/19/2019 YD Quartz BEAN 93 BANYAN GOLD CORP % 11/19/2019 YD Quartz BEAN 94 BANYAN GOLD CORP % 11/19/2019 YD Quartz BEAN 95 BANYAN GOLD CORP % 11/19/2019 YD Quartz BEAN 96 BANYAN GOLD CORP % 11/19/2019 YD Quartz BEAN 97 BANYAN GOLD CORP % 11/19/2019 YD Quartz BEAN 98 BANYAN GOLD CORP % 11/19/2019 YD Quartz BEAN 99 BANYAN GOLD CORP % 11/19/2019 YD Quartz BEAN 100 BANYAN GOLD CORP % 11/19/2019 YD Quartz BEAN 101 BANYAN GOLD CORP % 11/19/2019 YD Quartz BEAN 103 BANYAN GOLD CORP % 11/19/2019 YD Quartz BEAN 105 BANYAN GOLD CORP % 11/19/2019 YD Quartz BEAN 106 BANYAN GOLD CORP % 11/19/2019 YD Quartz BEAN 107 BANYAN GOLD CORP % 11/19/
29 Grant Number Regulation Type Claim Name Claim Number Claim Owner Claim Expiry Date YD Quartz BEAN 108 BANYAN GOLD CORP % 11/19/2019 YD Quartz BEAN 109 BANYAN GOLD CORP % 11/19/2019 YD Quartz BEAN 110 BANYAN GOLD CORP % 11/19/2019 YD Quartz BEAN 111 BANYAN GOLD CORP % 11/19/2019 YD Quartz BEAN 112 BANYAN GOLD CORP % 11/19/2019 YD Quartz BEAN 113 BANYAN GOLD CORP % 11/19/2019 YD Quartz BEAN 114 BANYAN GOLD CORP % 11/19/2019 YD Quartz BEAN 115 BANYAN GOLD CORP % 11/19/2019 YD Quartz BEAN 116 BANYAN GOLD CORP % 11/19/2019 YD Quartz BEAN 117 BANYAN GOLD CORP % 11/19/2019 YD Quartz BEAN 118 BANYAN GOLD CORP % 11/19/2019 YD Quartz BEAN 119 BANYAN GOLD CORP % 11/19/2019 YD Quartz BEAN 120 BANYAN GOLD CORP % 11/19/2019 YD Quartz BEAN 121 BANYAN GOLD CORP % 11/19/2019 YD Quartz BEAN 122 BANYAN GOLD CORP % 11/19/2019 YD Quartz BEAN 127 BANYAN GOLD CORP % 11/19/2019 YD Quartz BEAN 128 BANYAN GOLD CORP % 11/19/2019 YD Quartz BEAN 129 BANYAN GOLD CORP % 11/19/2019 YD Quartz BEAN 130 BANYAN GOLD CORP % 11/19/2019 YD Quartz BEAN 147 BANYAN GOLD CORP % 11/19/2019 YD Quartz BEAN 148 BANYAN GOLD CORP % 11/19/2019 YD Quartz BEAN 149 BANYAN GOLD CORP % 11/19/2019 YD Quartz BEAN 150 BANYAN GOLD CORP % 11/19/2019 YD Quartz BEAN 151 BANYAN GOLD CORP % 11/19/2019 YD Quartz BEAN 152 BANYAN GOLD CORP % 11/19/2019 YD Quartz BEAN 153 BANYAN GOLD CORP % 11/19/2019 YD Quartz BEAN 154 BANYAN GOLD CORP % 11/19/2019 YD Quartz BEAN 155 BANYAN GOLD CORP % 11/19/2019 YD Quartz BEAN 156 BANYAN GOLD CORP % 11/19/2019 YD Quartz BEAN 157 BANYAN GOLD CORP % 11/19/2019 YD Quartz BEAN 158 BANYAN GOLD CORP % 11/19/2019 YD Quartz BEAN 159 BANYAN GOLD CORP % 11/19/2019 YD Quartz BEAN 160 BANYAN GOLD CORP % 11/19/2019 YD Quartz BEAN 161 BANYAN GOLD CORP % 11/19/2019 YD Quartz BEAN 162 BANYAN GOLD CORP % 11/19/2019 YD Quartz BEAN 163 BANYAN GOLD CORP % 11/19/2019 YD Quartz BEAN 164 BANYAN GOLD CORP % 11/19/2019 YD Quartz BEAN 167 BANYAN GOLD CORP % 11/19/2019 YD Quartz BEAN 168 BANYAN GOLD CORP % 11/19/2019 YD Quartz BEAN 169 BANYAN GOLD CORP % 11/19/
30 Grant Number Regulation Type Claim Name Claim Number Claim Owner Claim Expiry Date YD Quartz BEAN 170 BANYAN GOLD CORP % 11/19/2019 YD Quartz BEAN 171 BANYAN GOLD CORP % 11/19/2019 YD Quartz BEAN 172 BANYAN GOLD CORP % 11/19/2019 YD Quartz BEAN 173 BANYAN GOLD CORP % 11/19/2019 YD Quartz BEAN 174 BANYAN GOLD CORP % 11/19/2019 YD Quartz BEAN 175 BANYAN GOLD CORP % 11/19/2019 YD Quartz BEAN 176 BANYAN GOLD CORP % 11/19/2019 YD Quartz BEAN 177 BANYAN GOLD CORP % 11/19/2019 YD Quartz BEAN 178 BANYAN GOLD CORP % 11/19/2019 YD Quartz BEAN 179 BANYAN GOLD CORP % 11/19/2019 YD Quartz BEAN 180 BANYAN GOLD CORP % 11/19/2019 YD Quartz BEAN 181 BANYAN GOLD CORP % 11/19/2019 YD Quartz BEAN 182 BANYAN GOLD CORP % 11/19/2019 YD Quartz BEAN 183 BANYAN GOLD CORP % 11/19/2019 YD Quartz BEAN 184 BANYAN GOLD CORP % 11/19/2019 YD Quartz BEAN 187 BANYAN GOLD CORP % 11/19/2019 YD Quartz BEAN 188 BANYAN GOLD CORP % 11/19/2019 YD Quartz BEAN 189 BANYAN GOLD CORP % 11/19/2019 YD Quartz BEAN 190 BANYAN GOLD CORP % 11/19/2019 YD Quartz BEAN 191 BANYAN GOLD CORP % 11/19/2019 YD Quartz BEAN 192 BANYAN GOLD CORP % 11/19/2019 YD Quartz BEAN 193 BANYAN GOLD CORP % 11/19/2019 YD Quartz BEAN 194 BANYAN GOLD CORP % 11/19/2019 YD Quartz BEAN 195 BANYAN GOLD CORP % 11/19/2019 YD Quartz BEAN 196 BANYAN GOLD CORP % 11/19/2019 YD Quartz BEAN 197 BANYAN GOLD CORP % 11/19/2019 YD Quartz BEAN 198 BANYAN GOLD CORP % 11/19/2019 YD Quartz BEAN 199 BANYAN GOLD CORP % 11/19/2019 YD Quartz BEAN 200 BANYAN GOLD CORP % 11/19/2019 YD Quartz BEAN 201 BANYAN GOLD CORP % 11/19/2019 YD Quartz BEAN 202 BANYAN GOLD CORP % 11/19/2019 YD Quartz BEAN 203 BANYAN GOLD CORP % 11/19/2019 YD Quartz BEAN 204 BANYAN GOLD CORP % 11/19/2019 YD Quartz BEAN 207 BANYAN GOLD CORP % 11/19/2019 YD Quartz BEAN 208 BANYAN GOLD CORP % 11/19/2019 YD Quartz BEAN 209 BANYAN GOLD CORP % 11/19/2019 YD Quartz BEAN 210 BANYAN GOLD CORP % 11/19/2019 YD Quartz BEAN 211 BANYAN GOLD CORP % 11/19/2019 YD Quartz BEAN 212 BANYAN GOLD CORP % 11/19/2019 YD Quartz BEAN 213 BANYAN GOLD CORP % 11/19/
31 Grant Number Regulation Type Claim Name Claim Number Claim Owner Claim Expiry Date YD Quartz BEAN 214 BANYAN GOLD CORP % 11/19/2019 YD Quartz BEAN 215 BANYAN GOLD CORP % 11/19/2019 YD Quartz BEAN 216 BANYAN GOLD CORP % 11/19/2019 YD Quartz BEAN 217 BANYAN GOLD CORP % 11/19/2019 YD Quartz BEAN 218 BANYAN GOLD CORP % 11/19/2019 YD Quartz BEAN 219 BANYAN GOLD CORP % 11/19/2019 YD Quartz BEAN 220 BANYAN GOLD CORP % 11/19/2019 YD Quartz BEAN 221 BANYAN GOLD CORP % 11/19/2019 YD Quartz BEAN 222 BANYAN GOLD CORP % 11/19/2019 YD Quartz BEAN 223 BANYAN GOLD CORP % 11/19/2019 YD Quartz BEAN 224 BANYAN GOLD CORP % 11/19/2019 YD Quartz BEAN 227 BANYAN GOLD CORP % 11/19/2019 YD Quartz BEAN 228 BANYAN GOLD CORP % 11/19/2019 YD Quartz BEAN 229 BANYAN GOLD CORP % 11/19/2019 YD Quartz BEAN 230 BANYAN GOLD CORP % 11/19/2019 YD Quartz BEAN 231 BANYAN GOLD CORP % 11/19/2019 YD Quartz BEAN 232 BANYAN GOLD CORP % 11/19/2019 YD Quartz BEAN 233 BANYAN GOLD CORP % 11/19/2019 YD Quartz BEAN 234 BANYAN GOLD CORP % 11/19/2019 YD Quartz BEAN 235 BANYAN GOLD CORP % 11/19/2019 YD Quartz BEAN 236 BANYAN GOLD CORP % 11/19/2019 YD Quartz BEAN 237 BANYAN GOLD CORP % 11/19/2019 YD Quartz BEAN 238 BANYAN GOLD CORP % 11/19/2019 YD Quartz BEAN 239 BANYAN GOLD CORP % 11/19/2019 YD Quartz BEAN 240 BANYAN GOLD CORP % 11/19/2019 YD Quartz BEAN 241 BANYAN GOLD CORP % 11/19/2019 YD Quartz BEAN 242 BANYAN GOLD CORP % 11/19/2019 YD Quartz BEAN 243 BANYAN GOLD CORP % 11/19/2019 YD Quartz BEAN 244 BANYAN GOLD CORP % 11/19/2019 YD Quartz BEAN 245 BANYAN GOLD CORP % 11/19/2019 YD Quartz BEAN 246 BANYAN GOLD CORP % 11/19/2019 YD Quartz BEAN 247 BANYAN GOLD CORP % 11/19/2019 YD Quartz BEAN 248 BANYAN GOLD CORP % 11/19/2019 YD Quartz BEAN 249 BANYAN GOLD CORP % 11/19/2019 YD Quartz BEAN 250 BANYAN GOLD CORP % 11/19/2019 YD Quartz BEAN 251 BANYAN GOLD CORP % 11/19/2019 YD Quartz BEAN 252 BANYAN GOLD CORP % 11/19/2019 YD Quartz BEAN 253 BANYAN GOLD CORP % 11/19/2019 YD Quartz BEAN 254 BANYAN GOLD CORP % 11/19/2019 YD Quartz BEAN 255 BANYAN GOLD CORP % 11/19/
32 Grant Number Regulation Type Claim Name Claim Number Claim Owner Claim Expiry Date YD Quartz BEAN 256 BANYAN GOLD CORP % 11/19/2019 YD Quartz BEAN 257 BANYAN GOLD CORP % 11/19/2019 YD Quartz BEAN 258 BANYAN GOLD CORP % 11/19/2019 YD Quartz BEAN 259 BANYAN GOLD CORP % 11/19/2019 YD Quartz BEAN 260 BANYAN GOLD CORP % 11/19/2019 YD Quartz BEAN 261 BANYAN GOLD CORP % 11/19/2019 YD Quartz BEAN 262 BANYAN GOLD CORP % 11/19/2019 YD Quartz BEAN 263 BANYAN GOLD CORP % 11/19/2019 YD Quartz BEAN 264 BANYAN GOLD CORP % 11/19/2019 YD Quartz BEAN 265 BANYAN GOLD CORP % 11/19/2019 YD Quartz BEAN 266 BANYAN GOLD CORP % 11/19/2019 YD Quartz BEAN 267 BANYAN GOLD CORP % 11/19/2019 YD Quartz BEAN 268 BANYAN GOLD CORP % 11/19/2019 YD Quartz BEAN 269 BANYAN GOLD CORP % 11/19/2019 YD Quartz BEAN 270 BANYAN GOLD CORP % 11/19/2019 YD Quartz BEAN 271 BANYAN GOLD CORP % 11/19/2019 YD Quartz BEAN 272 BANYAN GOLD CORP % 11/19/2019 YD Quartz BEAN 273 BANYAN GOLD CORP % 11/19/2019 YD Quartz BEAN 274 BANYAN GOLD CORP % 11/19/2019 YD Quartz BEAN 275 BANYAN GOLD CORP % 11/19/2019 YD Quartz BEAN 276 BANYAN GOLD CORP % 11/19/2019 YD Quartz BEAN 277 BANYAN GOLD CORP % 11/19/2019 YD Quartz BEAN 278 BANYAN GOLD CORP % 11/19/2019 YD Quartz BEAN 279 BANYAN GOLD CORP % 11/19/2019 YD Quartz BEAN 280 BANYAN GOLD CORP % 11/19/2019 YD Quartz BEAN 281 BANYAN GOLD CORP % 11/19/2019 YD Quartz BEAN 282 BANYAN GOLD CORP % 11/19/2019 YD Quartz BEAN 283 BANYAN GOLD CORP % 11/19/2019 YD Quartz BEAN 284 BANYAN GOLD CORP % 11/19/2019 YD Quartz BEAN 285 BANYAN GOLD CORP % 11/19/2019 YD Quartz BEAN 286 BANYAN GOLD CORP % 11/19/2019 YD Quartz BEAN 287 BANYAN GOLD CORP % 11/19/2019 YD Quartz BEAN 288 BANYAN GOLD CORP % 11/19/2019 YD Quartz BEAN 289 BANYAN GOLD CORP % 11/19/2019 YD Quartz BEAN 290 BANYAN GOLD CORP % 11/19/2019 YD Quartz BEAN 291 BANYAN GOLD CORP % 11/19/2019 YD Quartz BEAN 292 BANYAN GOLD CORP % 11/19/2019 YD Quartz BEAN 293 BANYAN GOLD CORP % 11/19/2019 YD Quartz BEAN 294 BANYAN GOLD CORP % 11/19/2019 YD Quartz BEAN 295 BANYAN GOLD CORP % 11/19/
33 Grant Number Regulation Type Claim Name Claim Number Claim Owner Claim Expiry Date YD Quartz BEAN 296 BANYAN GOLD CORP % 11/19/2019 YD Quartz BEAN 297 BANYAN GOLD CORP % 11/19/2019 YD Quartz BEAN 298 BANYAN GOLD CORP % 11/19/2019 YD Quartz BEAN 299 BANYAN GOLD CORP % 11/19/2019 YD Quartz BEAN 300 BANYAN GOLD CORP % 11/19/2019 YD Quartz BEAN 301 BANYAN GOLD CORP % 11/19/2019 YD Quartz BEAN 302 BANYAN GOLD CORP % 11/19/2019 YD Quartz BEAN 303 BANYAN GOLD CORP % 11/19/2019 YD Quartz BEAN 304 BANYAN GOLD CORP % 11/19/2019 YD Quartz BEAN 305 BANYAN GOLD CORP % 11/19/2019 YD Quartz BEAN 306 BANYAN GOLD CORP % 11/19/2019 YD Quartz BEAN 307 BANYAN GOLD CORP % 11/19/2019 YD Quartz BEAN 308 BANYAN GOLD CORP % 11/19/2019 YD Quartz BEAN 309 BANYAN GOLD CORP % 11/19/2019 YD Quartz BEAN 310 BANYAN GOLD CORP % 11/19/2019 YD Quartz BEAN 311 BANYAN GOLD CORP % 11/19/2019 YD Quartz BEAN 312 BANYAN GOLD CORP % 11/19/2019 YD Quartz BEAN 313 BANYAN GOLD CORP % 11/19/2019 YD Quartz BEAN 314 BANYAN GOLD CORP % 11/19/2019 YD Quartz BEAN 315 BANYAN GOLD CORP % 11/19/2019 YD Quartz BEAN 316 BANYAN GOLD CORP % 11/19/2019 YD Quartz BEAN 317 BANYAN GOLD CORP % 11/19/2019 YD Quartz BEAN 318 BANYAN GOLD CORP % 11/19/2019 YD Quartz BEAN 319 BANYAN GOLD CORP % 11/19/2019 YD Quartz BEAN 320 BANYAN GOLD CORP % 11/19/2019 YD Quartz BEAN 321 BANYAN GOLD CORP % 11/19/2019 YD Quartz BEAN 322 BANYAN GOLD CORP % 11/19/2019 YD Quartz BEAN 323 BANYAN GOLD CORP % 11/19/2019 YD Quartz BEAN 324 BANYAN GOLD CORP % 11/19/2019 YD Quartz BEAN 325 BANYAN GOLD CORP % 11/19/2019 YD Quartz BEAN 326 BANYAN GOLD CORP % 11/19/2019 YD Quartz BEAN 327 BANYAN GOLD CORP % 11/19/2019 YD Quartz BEAN 328 BANYAN GOLD CORP % 11/19/2019 YD Quartz BEAN 329 BANYAN GOLD CORP % 11/19/2019 YD Quartz BEAN 330 BANYAN GOLD CORP % 11/19/2019 YD Quartz BEAN 331 BANYAN GOLD CORP % 11/19/2019 YD Quartz BEAN 332 BANYAN GOLD CORP % 11/19/2019 YD Quartz BEAN 333 BANYAN GOLD CORP % 11/19/2019 YD Quartz BEAN 334 BANYAN GOLD CORP % 11/19/2019 YD Quartz BEAN 335 BANYAN GOLD CORP % 11/19/
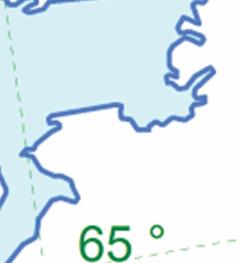
34 Grant Number Regulation Type Claim Name Claim Number Claim Owner Claim Expiry Date YD Quartz BEAN 336 BANYAN GOLD CORP % 11/19/2019 YD Quartz BEAN 337 BANYAN GOLD CORP % 11/19/2019 YD Quartz BEAN 338 BANYAN GOLD CORP % 11/19/2019 YD Quartz BEAN 339 BANYAN GOLD CORP % 11/19/2019 YD Quartz BEAN 340 BANYAN GOLD CORP % 11/19/2019 YD Quartz BEAN 341 BANYAN GOLD CORP % 11/19/2019 YD Quartz BEAN 342 BANYAN GOLD CORP % 11/19/2019 YD Quartz BEAN 343 BANYAN GOLD CORP % 11/19/2019 YD Quartz BEAN 344 BANYAN GOLD CORP % 11/19/2019 YD Quartz BEAN 345 BANYAN GOLD CORP % 11/19/2019 YD Quartz BEAN 346 BANYAN GOLD CORP % 11/19/2019 YD Quartz BEAN 347 BANYAN GOLD CORP % 11/19/2019 YD Quartz BEAN 348 BANYAN GOLD CORP % 11/19/2019 YD Quartz BEAN 349 BANYAN GOLD CORP % 11/19/2019 YD Quartz BEAN 350 BANYAN GOLD CORP % 11/19/2019 YD Quartz BEAN 351 BANYAN GOLD CORP % 11/19/2019 YD Quartz BEAN 352 BANYAN GOLD CORP % 11/19/2019 YD Quartz BEAN 353 BANYAN GOLD CORP % 11/19/2019 YD Quartz BEAN 354 BANYAN GOLD CORP % 11/19/2019 The Hyland Gold Project is within the Traditional Territory of the Liard First Nation, which is part of the Kaska Nation. Banyan has maintained good working relationships with the Liard First Nation, and Banyan has no reason to believe that the First Nation will not support development of the project (P. Gray, pers. com. 2016). 5.0 ACCESSIBILITY, CLIMATE, LOCAL RESOURCES, INFRASTRUCTURE AND PHYSIOGRAPHY 5.1 Project Access The Hyland Gold Project is located in southeast Yukon approximately 74 km northeast of Watson Lake, which lies along the Alaska Highway. It is centered at 60 o north latitude and 127 o west longitude on NTS Map Sheets 95 D/05 and 95 D/12. The property is accessible by float plane from Watson Lake to Quartz Lake, (also known as Hulse Lake) or by helicopter from Watson Lake. A 40 km long winter road built in 1989 provides access to the property from the government maintained Coal River Road at Km 35 from the junction of the Coal River Road and the Alaska Highway at Contact Creek. Both the Coal River Road and the winter road to the property are passable by 4x4 vehicles for most of the year except for a swampy section between Km 1 and 3 on the winter road that normally restricts traffic to the months of December, January, February and March. The winter road was utilized in March 2015 to mobilize heavy equipment to support the recent trenching and diamond drilling program on the Project (Gray, 2015). The winter trail connects to a network of all weather drill roads over the Main Zone that leads down into the exploration camp on Quartz Lake (Figure 5.1). 29
35 5.2 Climate The Hyland Gold Project area is subject to a continental climate with long cold winters and warm dry summers. The average annual precipitation in the area is about 450 mm occurring mostly as rain in the warmer months. In the winter, the snowpack rarely exceeds 1 m in depth. Permafrost occurs irregularly across north facing slopes. The lakes are typically ice free and serviceable for float planes by early June and they begin to freeze in early November. 5.3 Local Resources and Infrastructure A 35 man exploration camp is located on the south shore of Quartz Lake (Figure 5.1), consisting of three - four person cabins and six - four person tent platforms. Dry and kitchen/dining facilities were constructed in Two storage sheds, a geology shack, a dedicated first aid building and core logging and cutting facilities are also buildings on site. A compositing toilet and a 16 kva 220/110V generator complete the physical infrastructure in the camp. The camp can be brought up to a fully operational status with a four person team in three days in normal summer weather conditions (Gray, 2015). A medium sized bulldozer, a small excavator and a diamond drill along with associated tooling, supplies and support equipment are currently stored on the property. The surface rights are held by the Yukon government and any exploration, development or mining operations require regulatory approval. There is no grid supplied electrical power available. Water for exploration drilling is available from small lakes and streams on the property. There are ample areas suitable for plant sites, tailings storage, and waste disposal areas should commercial production be contemplated. 5.4 Physiography, Elevation and Vegetation The Project covers moderately rugged terrain with elevations that range from 920 m on the shores of Quartz Lake to 1,830 m at the highest peak on the property (Figure 5.1). Tree line starts at approximately 1,450 m where alpine brush and vegetation give way to a mix of black spruce, alder, willow, pine, white spruce and moss depending on the moisture content and aspect of the slope. Subcrop is abundant above tree line with some outcrop below tree line however bedrock exposure is generally limited to small cliffs and creek cuts. The area underwent glaciation during the Pleistocene with ice movement from the northwest to southeast. Most steep north facing slopes are free of glacial till but south and west facing hillsides display varying thicknesses of glacial debris. A prominent terrace of glaciofluvial material wraps around the hillsides at about 1,065 m elevation in the Quartz Lake valley (Armitage and Gray, 2012b). 30

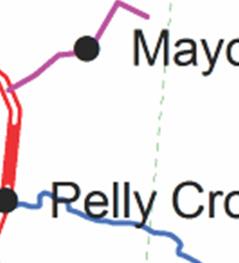
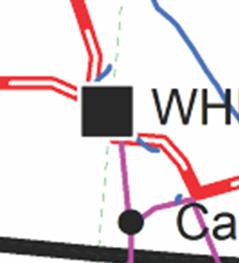
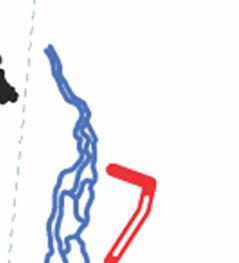
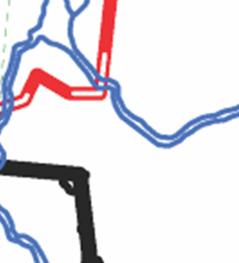
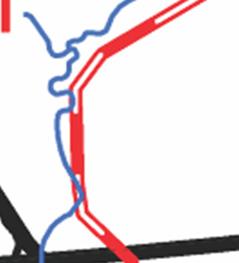
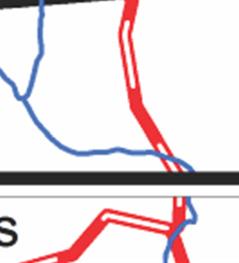
36 Figure 5.1: Project Infrastructure Map 31
37 6.0 HISTORY Mineral exploration in the Hyland Gold Project area began in the late 1800 s with the discovery of the McMillan zinc-lead-silver deposit 5 km west of the current Project area. Drilling conducted intermittently at the McMillan prospect since the late 1940 s by Liard River Mining Company Ltd. has defined a non-compliant and unclassified historical resource of 1.1 million tonnes grading 8.5% zinc, 4.1% lead and 62 g/t silver in the Main Zone and 0.4 million tonnes grading 1.7% zinc, 9.3% lead and 214 g/t silver in the South Zone. Liard River also explored parts of the current Project area, including the Main Zone. The focus of their exploration there was base metal mineralization and they employed a mix of geological mapping, hand trenching, soil sampling, an EM survey and diamond drilling of four holes. Results were not encouraging and claims covering part of the current Project area were allowed to lapse in 1955 (Carne, 2000). In July 1973 Hyland Joint Venture (HJV) staked the Porker claims to cover a lead-zinc exploration target near what is now the Main Zone, following up on the Liard River work in the area. Work completed by the joint venture under the supervision of Archer, Cathro & Associates Limited ( Archer Cathro ) over a three year period ending in 1975 included prospecting, geological mapping, grid soil sampling, gravity surveys and 303 m of diamond drilling in four holes. Results of this work outlined widespread arsenic soil geochemical anomalies with several high gold values, but HJV was not interested in pursuing gold exploration and no further work was undertaken (Carne, 2000). Exploration in the area was renewed to focus on potential gold mineralization in 1981, beginning with the staking and exploration of the Cuz and Quiver claims by Archer Cathro on behalf of Kidd Creek Mines Ltd. ( Kidd Creek ). These claims were staked to cover the gold-arsenic anomalies identified by HJV located south and east of the Porker claims. Kidd Creek contracted Archer Cathro to perform geological mapping and grid soil sampling the following year that defined a 450 m long gold-arsenic-bismuth geochemical anomaly on the Cuz property and scattered, weakly to moderately anomalous gold values on the Quiver claims (Archer and Carne, 1982). No further work was done on the properties until Kidd Creek performed follow-up prospecting and rock sampling on the Cuz property in When a bedrock source for the anomalous gold-arsenicbismuth geochemistry was not located, claim ownership was transferred to Archer Cathro. In the interim, Archer Cathro had also re-staked the Porker claims on their expiry in 1984 as the Piglet 1-32 claim group (Carne, 1985) (Figure 4.3). In 1986 Archer Cathro acquired the Quiver claims east of the Piglet block and sold the entire property comprised of 88 claims to Silverquest Resources Ltd. ( Silverquest ) who performed prospecting, soil sampling and hand trenching that same year. The following year Hyland Gold Joint Venture (HGJV) was formed, comprised of Silverquest, Novamin Resources Ltd. ( Novamin ) and NDU Resources Ltd. ( NDU ) and it carried out a program of soil geochemistry, bulldozer trenching and road construction (Dennett and Eaton, 1987). Novamin withdrew from the HGJV in 1988 and was replaced by Adrian Resources Ltd. ( Adrian ) as a joint venture partner. That year soil sampling and several ground geophysical surveys including magnetic, IP and EM were conducted with concurrent bulldozer trenching, diamond drilling (376 m in four holes) and road construction (Dennett and Eaton, 1988). The road construction continued into the early winter of 1989, culminating with the completion of a 40 km long winter road from the property to the Coal River Road (Figure 4.2). The winter road facilitated the mobilization of a truck mounted reverse circulation (RC) drill rig in 1990 and completion of 3,656 m of RC drilling in 41 holes (Sax and Carne, 1990). In 1994, Archer Cathro sold the Cuz property, which had been reduced to seven claims covering the main gold in soil geochemical anomaly to Nordac Resources Ltd. (now Strategic Minerals Ltd.). 32
38 Hemlo Gold Mines Inc. ( Hemlo ) optioned the HGJV property from Cash Resources Ltd. ( Cash ) (restructured and renamed from Silverquest) in 1994 and in 1995 completed a geological mapping program followed by diamond drilling program of 439 m in three holes (Bidwell, 1995). Results were negative and the option expired without Hemlo earning an interest in the property. In 1998 Cash purchased United Keno Hill Mines Ltd. interest in the property (after its merger with NDU) and in 1999 further consolidated ownership of the Hyland Gold property by purchasing Adrian s working interest (Carne, 2000). In 1994, contemporaneous to Hemlo s option deal with Cash, Westmin Resources Ltd. ( Westmin ) became active in the area by staking 416 claims surrounding the HGJV and Cuz properties. Some of those claims form part of the current Project property. Work by Westmin that year included an airborne geophysical survey, detailed geological mapping and soil sampling (Tucker and Pawliuk, 1995). Further airborne geophysical surveys (flown by Newmont for Westmin) and soil sampling were completed in 1995 that led to the staking of additional claims, geological mapping, rock sampling, reconnaissance soil sampling and power auger soil sampling in following years (Pawliuk, 1996 and Jones, 1997). Expatriate Resources Ltd. ( Expatriate ) purchased Westmin s property interests in the spring of 1999 and conducted a small prospecting and sampling program that summer (Lustig et al. 2003). In March of 2000 a new joint venture was created to explore the HGJV, Cuz and surrounding Expatriate claims with the following interests: 55% Cash Minerals Ltd. (formerly Cash Resources), 31% Expatriate and 14% Strategic Metals. This property eventually became what is now the core of the current Hyland Gold Project. The following year the joint venture conducted a small exploration program consisting of re-mapping the bulldozer trenches, hand trenching and sampling of the geochemical anomalies identified by Westmin. By the end of January 2003 Expatriate had acquired 100% interest in the then Hyland Gold Project and sold it in its entirety to StrataGold Corporation ( StrataGold ) (Lustig et al, 2003). In 2003 StrataGold completed a program of diamond drilling totalling 2416 m in 12 holes (Hladky, 2003 and Lustig et al, 2003). The following year StrataGold completed line kilometres of IP/Resistivity surveying divided into six east-west trending lines over the main zone. Results of the geophysical survey were followed up with 1800 m of diamond drilling in eight holes. (Hladky, 2004). StrataGold drilled four diamond drill holes in 2005 with a total length of 985 m focused on discovering new gold mineralization east of the Main Zone and at the Cuz anomaly (Sparling and Whitehead, 2007). Argus Metals Corp. ( Argus ) optioned the Hyland Gold Project from Victoria Gold Inc. (which had previously acquired StrataGold) in Argus completed 20 diamond drill holes (3,953 metres) on the Project in 2010 and 2011 in addition to Transient Electromagnetic (TEM) geophysical surveys over the Main Zone and north of the Cuz anomaly. Promising intercepts of gold and silver mineralization were encountered in the Main Zone drilling and a gold mineralization discovery was made by drilling at the Cuz Zone (Armitage and Gray, 2012a). On February 15, 2013, Banyan (then Banyan Coast Capital) acquired a 100% interest in the Hyland Gold Project. Banyan completed a resource calculation on the Main Zone in 2012, prior to the closing of the property acquisition (Armitage and Gray, 2012b) and has conducted exploration programs on the Project in each subsequent year (Gray, 2014a; Gray, 2014b and Gray, 2015). This work consisted of grid soil sampling and ridge and spur soil sampling, which lead to the prospecting discovery of gold mineralization south of the Cuz Zone. The newly discovered Montrose Ridge Zone was explored with excavator trenching in 2015 and connected with a bulldozer trail to the existing road network. Banyan also completed diamond drilling on the Camp Zone (two holes) and north of the Main Zone (one hole) in
39 7.0 GEOLOGICAL SETTING AND MINERALIZATION 7.1 Regional Geology The Hyland Gold Project is located in southeastern Selwyn Basin; a Late Precambrian to Middle Devonian tectonic element characterized by deposition of deep water marine sediments. Deposition into the basin was restricted by the Cassiar Platform to the southwest and the Mackenzie Shelf to the east. It is considered part of ancestral North America and records several episodes of pericratonic rifting with subsequent subsidence. Generally, the basin fill comprises shale, limestone, chert and grit that have been subdivided across the basin into many formations and distinct facies that may or may not be time-equivalent. Recent regional scale geological mapping that includes the Project area (Figure 7.1) by Yukon Geological Survey (Pigage et al., 2011) provides a framework for the regional and property-scale descriptions given below. On a regional scale, the Hyland Gold Project is located in an area of Selwyn Basin underlain by Precambrian Hyland Group Yusezyu, Narchilla and Vampire Formations ( Fm ), Lower to Middle Cambrian Sekwi Fm, Cambrian to Ordovician Otter Creek and Rabbitkettle Fm, Ordovician Sunblood Fm, Silurian to Devonian Road River Group and undivided time-equivalent Nonda-Muncho-McConnell-Stone-Dunedin Fm, Devonian to Mississippian Earn Group and local Eocene sedimentary sequences in Rock River Basin (Figure 7.1). The older sedimentary rocks were intruded by Cretaceous granite, quartz monzonite and granodiorite plugs assigned to the Selwyn Plutonic Suite. Collectively, they record a quiescent, subsiding continental margin punctuated by transgressive and regressive cycles, rifting, collision of allochthonous terranes, mountain building and magmatism (Gordey and Anderson, 1993). The lower Hyland Group Yusezyu Fm (Py) comprises quartz-rich sandstones ranging from medium grained sand to pebble conglomerate sized clasts. Distinct, opalescent blue spherical quartz grains are common. The bottom of the formation is not exposed in the Basin but the formation is estimated to be greater than 3 km thick. At the top of the Yusezyu Fm, a crystalline limestone or calcareous sandstone unit (PCvn-l) is generally present. This unit marks the transition from Yusezyu Fm sandstones to finer grained clastic rocks of the Narchilla Fm (PCvn-m). In the Project area the Narchilla and Vampire Fm are undivided with the former representing the basinal facies and the latter the basin to shelf transitional facies. The Narchilla Fm consists of maroon and green phyllite, silty phyllite and minor quartzose sandstone to pebble conglomerate. Narchilla limestone and clastic rocks are locally interfingered. The Vampire Fm (PCvn) consists of green phyllite, silty phyllite, minor quartzose sandstone to pebble conglomerate, and bedded limestone (Black, 2010). Lower Cambrian rocks interpreted to be correlative to the Sekwi Fm (Cs) conformably overlie the Narchilla- Vampire sequences. They consist of green to tan brown weathering phyllite, siltstone and arkose. The finer grained lithologies are locally calcareous and/or fossiliferous. Locally a mafic volcanic sequence of tuff, flows and pillowed lavas (Cv) occurs near the top of the Sekwi Fm. The Lower Cambrian rocks are unconformably overlain by Cambrian to Ordovician rocks including the Otter Creek Fm (COoc) comprising resistant light grey limestone and buff coloured dolostone. Overlying these rocks is the Rabbitkettle Fm (COR), divided into: a volcanic facies (COR-v) comprised of mafic tuff, breccias and amygdaloidal pillowed flows; a west facies (COR-lp) including platy phyllitic limestone, calcareous phyllite and light grey, yellow weathering silty limestone; and an east facies (COR-n) that is more calcareous comprised of wavy banded, nodular silty limestone and pale grey bedded limestone. 34
40 Figure 7.1: Regional Geology Map 35
41 The Ordovician is represented by the Sunblood Fm comprised of two members: a mafic volcanic member comprised of basaltic tuff, breccia and amygdaloidal pillowed flows (OSu-v), and a laminated and/or bioturbated buff to orange weathering dolostone or limestone (OSu). Conformably overlying the Sunblood Fm is the Silurian to Devonian Road River Group (SDRR) comprised of dark grey to black calcareous or dolomitic locally graptolitic recessive shale, siltstone and bedded chert. The laterally equivalent carbonate dominated Silurian to Devonian unit SDc (undivided Nonda-Muncho-McConnell-Stone-Dunedin Fm) is present to the south and consists of grey thick-bedded dolostone, and black thick-bedded limestone. (Black, 2010). Devonian to Mississippian extension resulted in sub vertical normal faults of varying orientation that juxtapose deeper basinal rocks against younger lithologies. This geometry effectively preserved Ordovician to Silurian rocks locally and resulted in unconformable relationships between the Hyland and Earn Group clastic rocks elsewhere. The occurrence of abundant debris flows containing car-sized clasts of underlying lithologies are a product of this block faulting. Mesozoic docking of allocthonous terranes to the southwest of Selwyn Basin resulted in thin-skinned thrusting and folding with eastward displacements upwards of 200 km (Gabrielse, 1991). Related deformation in Selwyn Basin is dominated by the interplay of less competent quartz-poor and competent quartz-rich layered rocks. Large-scale structures consist of thrust-faults, open to tight folds, locally intense small scale folds and zones of closely spaced imbricate thrust sheets. These structures are attributed to Early Cretaceous northeast directed compression pre-dating the extensive plutonism in the basin. Typically a well developed phyllitic to slaty cleavage is present and is most prevalent in mudstone and siltstone. The dominant fabric in the basin trends northwest and generally dips steeply to the northeast but in places may be shallowly south-dipping. Locally however, structural trends vary and commonly parallel the arcuate Paleozoic shale-carbonate boundary within the Mackenzie Mountains to the east. This results in structural trends that may vary from east-northeast to eastwest with northerly, easterly, or westerly vergence of major structures. Following crustal thickening numerous calc-alkaline plutons were emplaced into the sedimentary package. Cretaceous plutonism in Selwyn Basin progressed from the southeast to the northwest beginning with the emplacement of the Hyland-Anvil ( Ma) and Tay River (98 96 Ma) suites and culminating with the emplacement of the Tungsten and Tombstone suites ca Ma (Anderson, 1983 and 1993). Previously the nearest known intrusion to the Hyland Gold Project was a 15 km diameter stock located 22 km to the west. Recent mapping by Pigage et al. (2011) however, has identified a 7 km x 3 km body granitic body that returned a U-Pb zircon age of 97.8 Ma. This body is the southernmost exposure of Cretaceous granitic rocks along a northeast trending belt of higher metamorphic grade (locally up to garnet-staurolite grade) and Cretaceous magmatism that parallels the Skonseng fault (Figure 7.1). Regionally, the Hyland Gold Project is located in the hanging wall of an east-verging imbricate thrust system controlled by the Coal River Fault. The surface trace of westernmost fault of this system is located just inside the eastern margin of the property (Figure 7.1). Within the hanging wall the structural grain is largely northwest trending and lineations plunge both to the northwest and to the southwest. The dominantly Precambrian sedimentary rocks of the hanging wall are folded into a series of anticline-syncline pairs that expose the Yusezyu Fm at the core of northwest trending anticlines (Black, 2010). East of the imbricate thrust system, Cambrian to Devonian rocks with a carbonate shelf affinity contain a north trending structural fabric. Mapped folds are typically tighter with more closely spaced axial planes and eastverging. Lineations plunge north and south likely controlled by their proximity to second-order east-west trending strike slip faults related to the larger thrust faults. Locally, the strike-slip faulting has up to 3 km of displacement. 36
42 7.2 Regional Mineralization and Metallogeny Selwyn Basin is most well known for its endowment of sedex zinc-lead-silver occurrences including twelve deposits with proven reserves (Carne and Cathro, 1982). Three of those were past producers. The sedex deposits can be divided into three categories based on their age of formation. Late Cambrian deposits include the Anvil Range Belt, which hosts the former Faro, Grum and Vangorda Mines and the unmined Grizzly deposit. Early Silurian sedex mineralization occurs at Howards Pass and Late Devonian examples include Tom and Jason deposits at Macmillan Pass. In addition to the sedex deposits the Basin also contains Mississippi Valley Type lead-zinc mineralization and stratiform barite deposits. The Hyland Gold Project is located at the southeast end of a younger overlapping metallogenic province referred to as the Tintina Gold Belt, comprised of several gold rich districts extending from western Alaska to southeastern Yukon. The belt includes notable gold deposits such as the Donlin Creek deposit, Fort Knox Mine and Pogo Mine in Alaska. In Yukon the Tintina Gold Belt includes the Klondike placer gold district, hard rock gold occurrences including the former Brewery Creek, Mt. Nansen and Ketza Mines, as well as the Coffee, White Gold and Eagle development stage gold projects and the newly discovered Rackla Belt of sedimenthosted gold mineralization. The Tintina Gold Belt is coincident with a belt of extensive mid-cretaceous and younger plutonism and precious metal deposit types are typically associated with these intrusions in some fashion. The compositions of the intrusive rocks are typically granodiorite, granite and syenite. They are predominantly metaluminous, calk-alkaline to locally alkalic, have low primary oxidation states and typically contain significant crustal contamination (Hart et al, 2000). The most significant mineral occurrence near the Hyland Gold Project is the Mel deposit, located 12 km eastsoutheast of the Hyland Gold Main Zone. Stratabound barite-zinc-lead mineralization is laterally extensive within the Cambro-Ordovician Rabbitkettle Fm, but lacks the finely laminated character of typical sedex mineralization, although this may be due to strain-induced recrystallization (Carne, 1976). The Mel Main Zone hosts an Inferred Resource of 5.38 million tonnes grading 6.45% zinc, 1.85% lead and 44.79% barite (BaSO 4 ), at a cut-off grade of 5.0% zinc-equivalent (King and Giroux, 2014). Mineralization there consists of coarsegrained sphalerite and galena disseminated throughout a mixture of mudstone, silica-carbonate and coarsely crystalline barite. The Mel Main Zone is open down dip and has good potential to host a larger zinc-lead resource. The McMillan silver-lead-zinc deposit lies 5 km west of the Hyland Gold Main Zone. Two pyritic massive sulphide bodies have been outlined by extensive surface exploration and diamond drilling. A non-compliant, unclassified historical resource of 1.1 million tonnes grading 8.3% zinc, 4.1% lead and 62 g/t silver occurs in strata concordant and discordant mineralization in the McMillan Main Zone. An additional 0.4 million tonnes of similar mineralization grading 1.7% zinc, 9.3% lead and 214 g/t silver occurs in the McMillan South Zone. The deposit is hosted in late Precambrian rocks of the Hyland Group and it has been described as replacement style or manto mineralization developed by hydrothermal fluids ascending along northerly trending fault zones. Unpublished lead isotope studies carried out at the University of British Columbia suggest a poorly constrained Tertiary age of mineralization (Carne, 1985). 7.3 Property Geology and Mineralization Geology The Hyland Gold Project is underlain by an interbedded sequence of quartzites, limestones, and phyllites. Individual beds vary from less than one metre to tens of metres in thickness. Several units are mixed, with 37
43 thinly interbedded phyllitic dirty limestones, calcareous quartzites and phyllites. This stratigraphic complexity coupled with folding and faulting, and a general lack of bedrock exposure makes it difficult to carry out meaningful geological mapping. The underlying bedrock in the central part of the Project area is interpreted by Pigage et al. (2011) to belong to the transition zone between the Yusezyu and Vampire Formations of the Precambrian Hyland Group (Figure 7.2). In general, a mixed unit of quartzites, phyllites, and limestones appears to be folded about a north-south trending, southeasterly plunging anticline with the Main Zone gold mineralization aligned along its axis. Flanking the mixed unit to the east and west in an overlying relationship is a relatively clean, massive limestone unit. A north-south structural corridor referred to as the Quartz Lake Lineament trends through the core of the Main Zone, coincident with the anticline axis (Figure 7.2), and it is thought to be a major control of mineralization (Carne, 2000). Previous workers have developed property stratigraphy within the Vampire Fm in the central part of the property that is interpreted to comprise one continuous conformable sequence. The following description in descending stratigraphic order is taken from Carne (2002) and Lustig et al. (2003). Upper Quartzite (Q2) The Upper Quartzite unit consists of blocky weathering, tan, grey and pale green lithic quartzite, orthoquartzite, calcareous quartzite and minor sandstone with phyllitic siltstone and phyllite. The term quartzite is used because of the well indurated nature of the clastic units, normally an effect of regional metamorphism. Because of poor natural bedrock exposure on the Project area, property scale geological mapping was mostly of exposures created by trenching through overburden within the area of exploration interest as defined by anomalously high arsenic in soils. The highly indurated nature of the quartzite is possibly an effect of hydrothermal recrystallization and pervasive silicification adjacent the mineralized structures. Regionally, these rocks are more appropriately termed sandstones. Upper Limestone (L1) The Upper Limestone unit is a dark shaly and gritty fissile limestone with common phyllitic partings. Bedding ranges from 1 to 100 m thick. A horizon of phyllite and interbedded quartzite occurs near the base of this unit. Upper Phyllite (P2) The Upper Phyllite consists of thinly laminated silver-grey, green and black, locally graphitic or calcareous phyllite. This unit contains quartzite beds up to 5 m thick. Main Quartzite (Q1) The Main Quartzite is an orthoquartzite greater than 20 m thick. Phyllite becomes more prevalent towards the top of the unit with individual phyllite units up to 10 cm thick. Lower Limestone (L2) The Lower Limestone is a black to grey, platy, silty limestone that is typically weakly recrystallized. Lower Phyllite (P3) The Lower Phyllite consists of interbedded siltstone, sandstone, greywacke, and quartz-lithic granule conglomerate. Locally, this unit may resemble a quartzite where strong quartz flooding or alteration occurs. 38
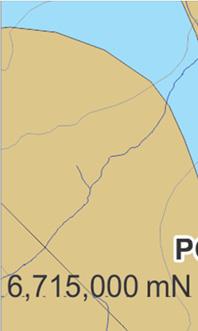
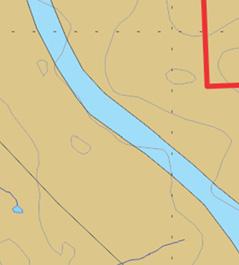
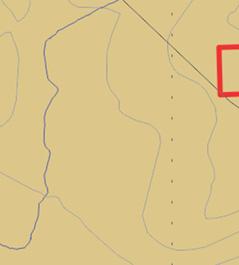
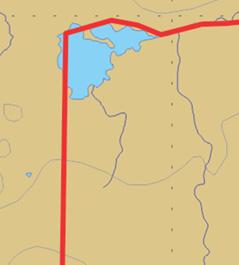
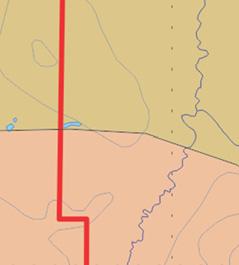
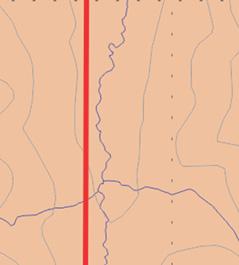
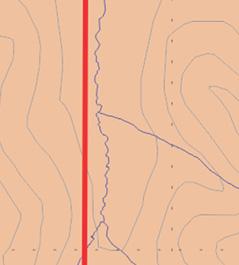
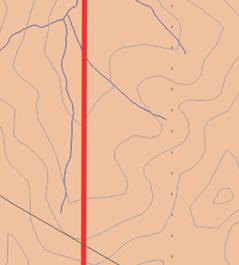
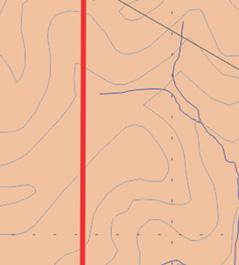
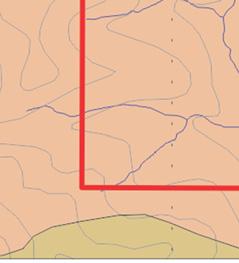
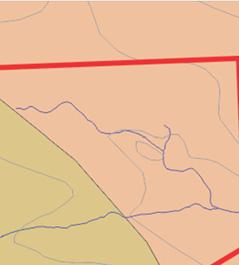
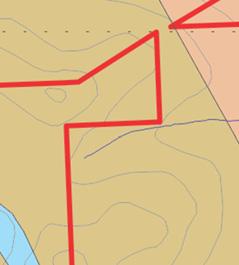
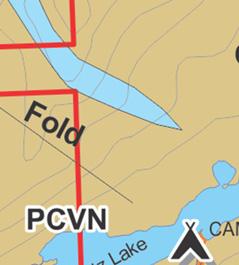
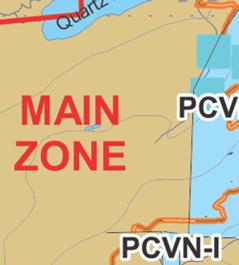
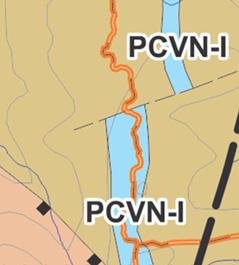
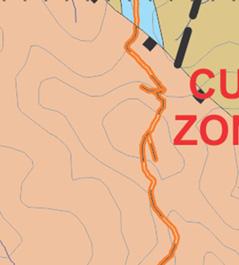
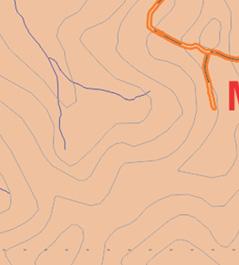
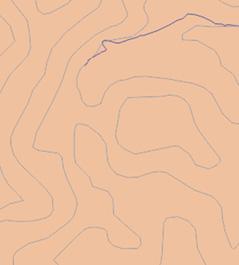
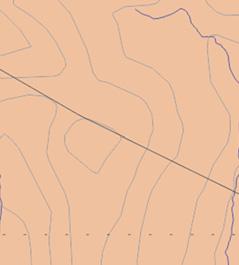
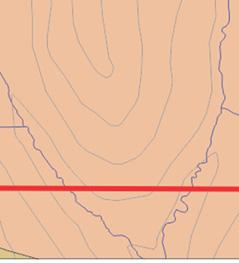
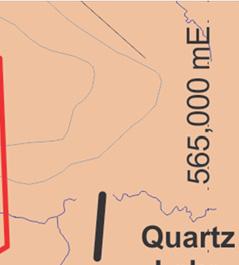
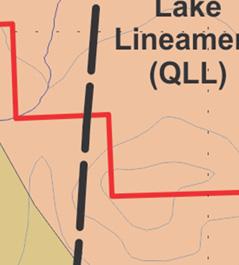
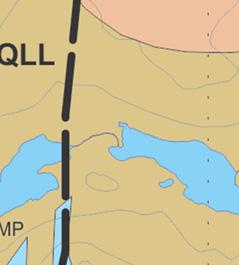
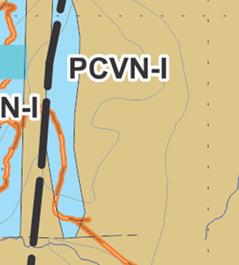
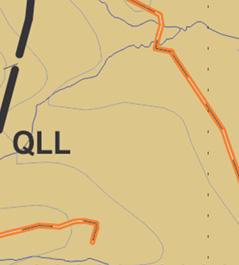
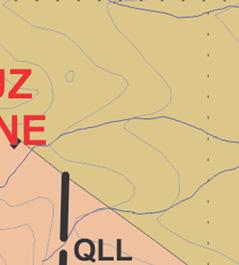
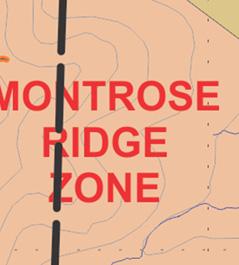
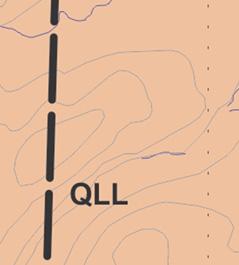
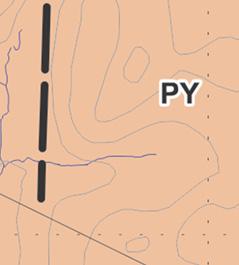
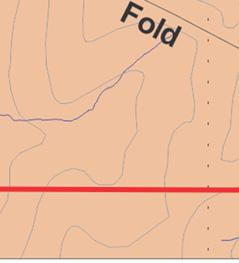
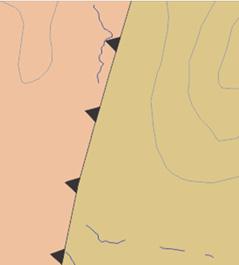
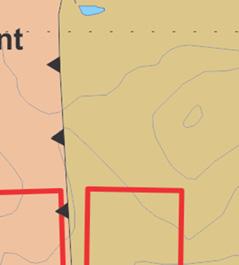
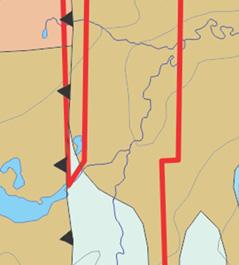
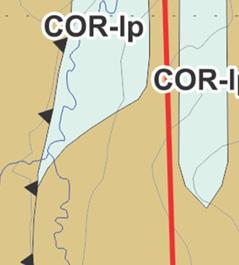
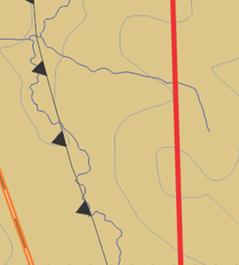
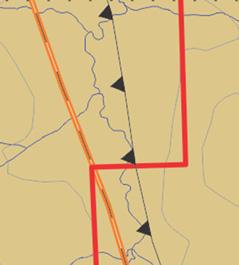
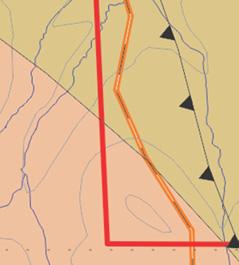
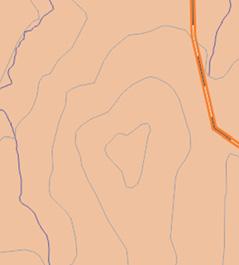
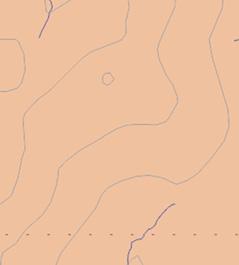
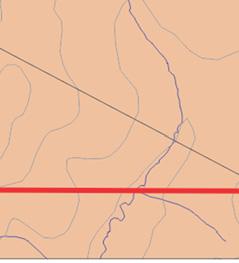
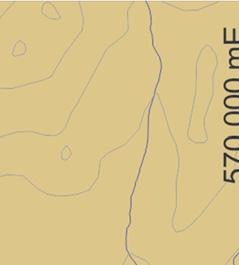
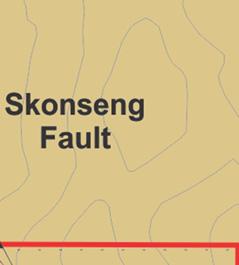
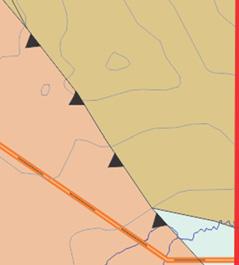
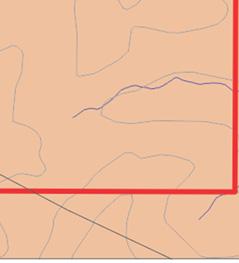
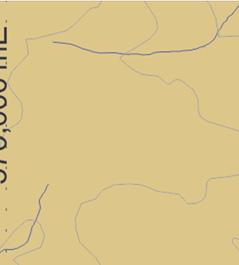
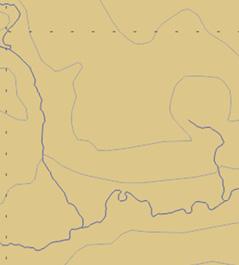
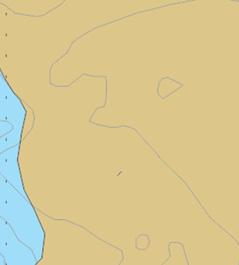
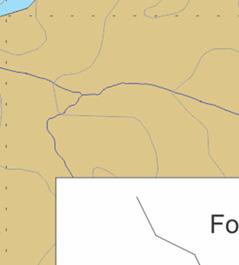
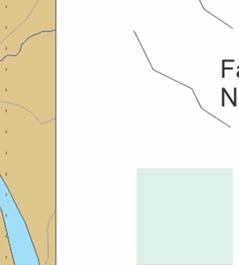
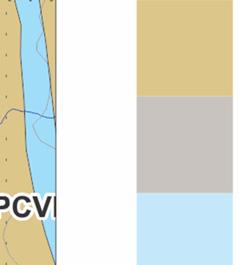
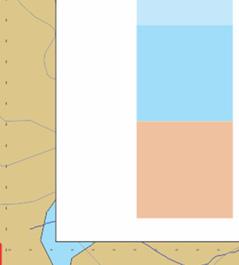
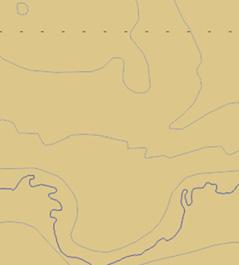
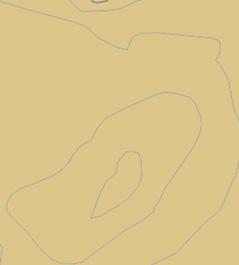
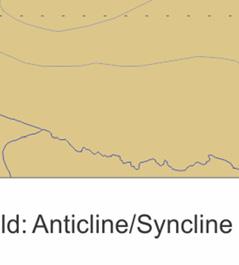
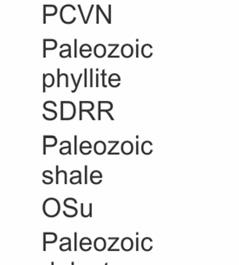
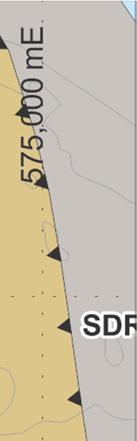
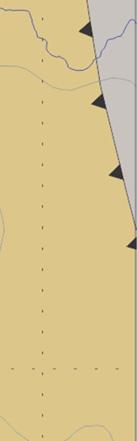
44 Technnical Report on the Hyland Gold d Project, Yukon Territory, Canaada ure 7.2: Pro operty Scalee Geology Map M Figu 39
45 Although the Quartz Lake area is located near the southern end of a belt of Cretaceous granitic plutons, there are no large intrusive bodies exposed in the Project area per se. Evidence for buried intrusions on the claim block includes a few narrow mafic dykes, magnetic lows outlined by geophysical surveys and a 2 km 2 area east of Quartz Lake where sedimentary rocks are locally thermally metamorphosed to garnet-staurolite schist (Carne, 2002). The most prominent structural feature in the Project area is a north trending recessive topographic linear (Figure 7.3) that probably corresponds to a steeply dipping structural zone (Carne, 2002). The linear, called the Quartz Lake Lineament (QLL), is usually filled by glacial till or talus, but where bedrock is exposed in a number of trenches across the Main Zone, it consists of a series of anastomosing, sub parallel faults. Sense of motion on the structures is unknown but local stratigraphy appears to have negligible offset. The QLL bisects the Main Zone and strikes toward the Cuz Showing, where it is cut by a normal fault that juxtaposes Yusezyu Fm against the Vampire Fm stratigraphy (Figure 7.2). The QLL also coincides with resistivity and magnetic lows in the vicinity of the Main Zone Alteration Two styles of hydrothermal alteration related to gold mineralization occur on the Hyland Gold Project. Tourmaline+/-arsenopyrite-pyrite-silica alteration is ubiquitous within mineralized intervals. The alteration locally eradicates primary sedimentary features and imparts a light greyish brown colour on all lithologies. White quartz veins cut this alteration and adjacent less altered intervals, but they are interpreted to be part of the same alteration assemblage. Sulphide minerals occur as anhedral fine to medium grained aggregates disseminated throughout the altered intervals and in dismembered irregular veins. Tourmaline is visible only in thin section and consists of very fine grained anhedral to euhedral crystals occurring in aggregates or disseminated throughout the groundmass. Notably, the eradication of sedimentary structures in strongly altered zones can give the false impression that the original rock type is a quartzite. Their primary distinction is the lack of strain features in the secondary silica (Black, 2010). Patchy to pervasive, very fine grained iron carbonate alteration has not been examined in thin section but is observed in drill core. The iron carbonate alteration imparts a light beige wash across the drill core and appears antithetic to sulphide mineral formation as well as overprinting the silica alteration. Furthermore, titanitequartz-carbonate veins, thought to be contemporaneous to the iron carbonate alteration, cross cut quartz and quartz + sulphide veins. For these reasons the pervasive iron carbonate alteration is interpreted to be sulphide destructive and post dates the earlier tourmaline+/-arsenopyrite-pyrite-silica alteration (Black, 2010) Mineralization Introduction Primary gold mineralization occurs in at least four different settings on the Hyland Gold Project: (1) breccia zones, veins and auriferous sulphide disseminations, best developed in silicified quartzite or jasperoid altered zones in phyllite; (2) north-trending recessive weathering fault zones in the QLL containing pods of semi-massive to massive pyrrhotite + pyrite; 40
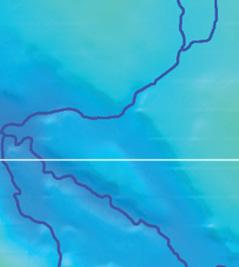
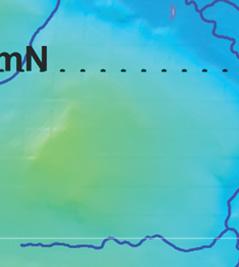
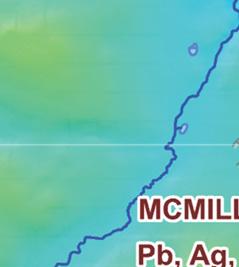
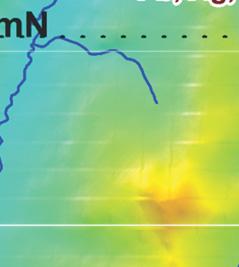
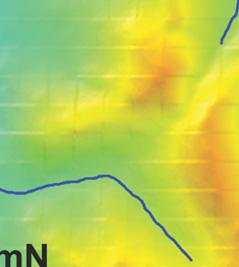
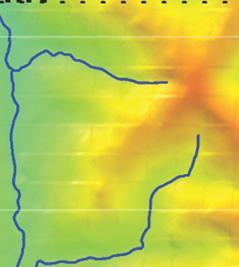
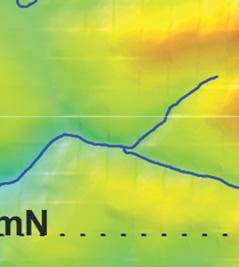
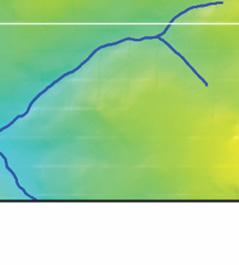
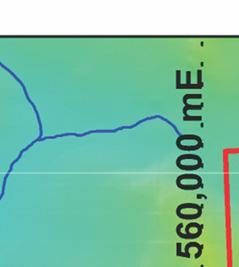
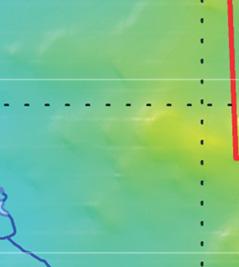
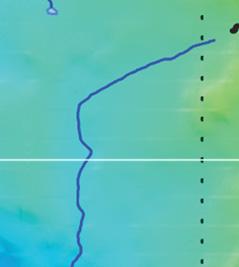
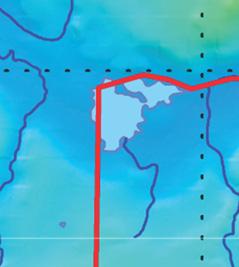
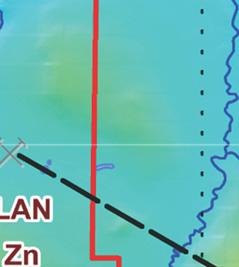
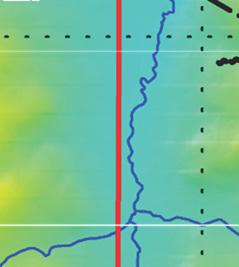
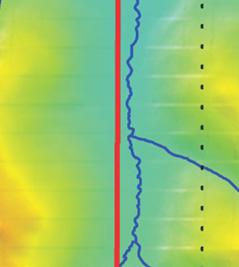
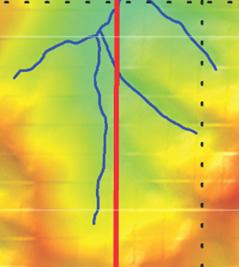
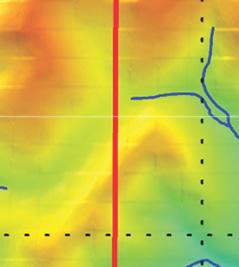
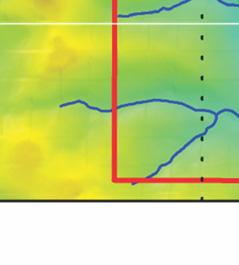
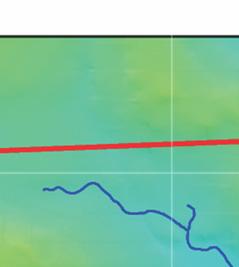
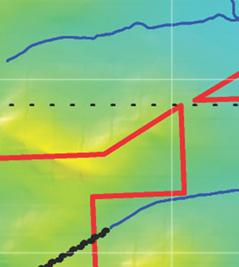
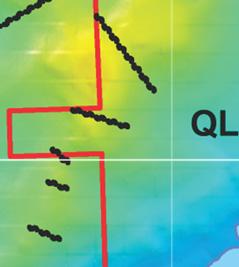
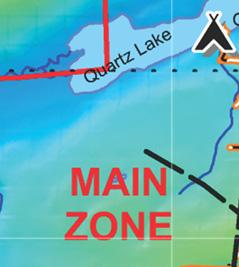
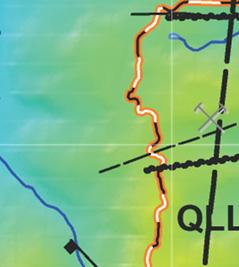
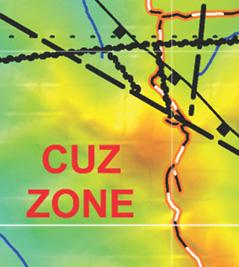
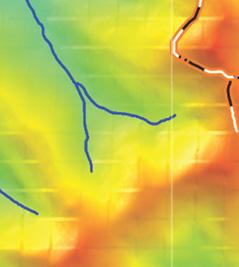
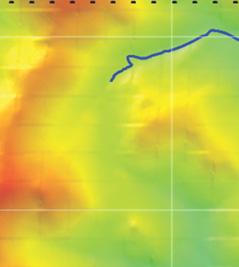
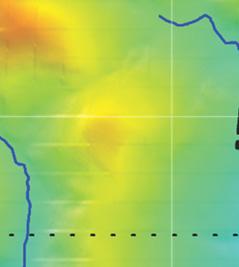
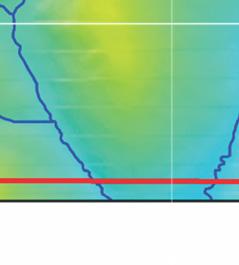
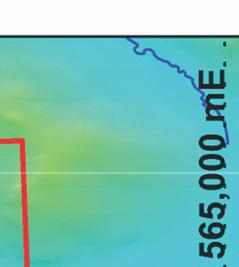
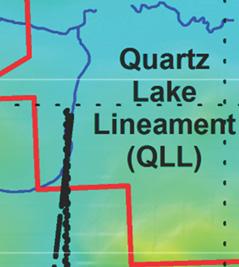
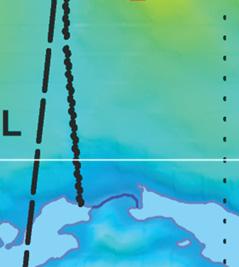
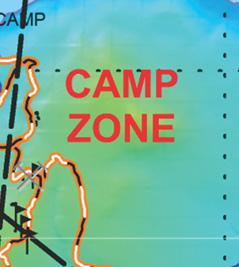
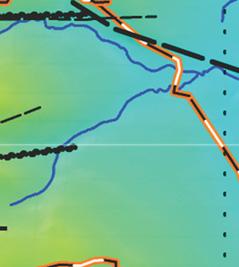
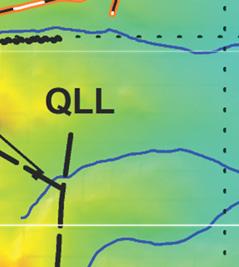
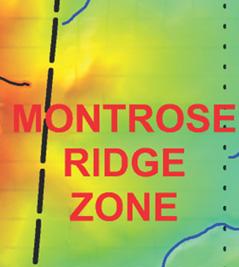
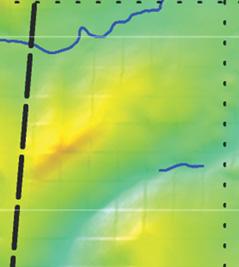
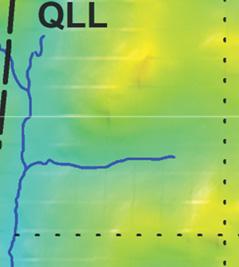
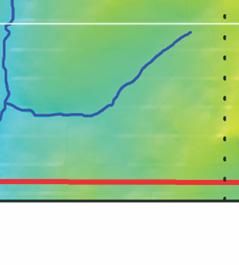
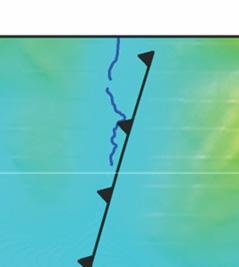
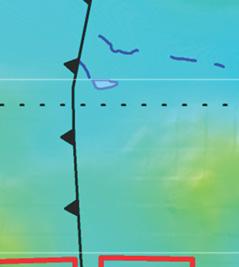
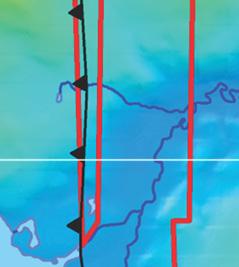
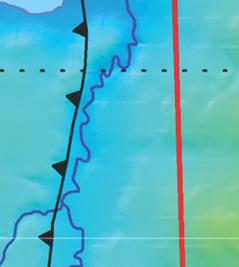
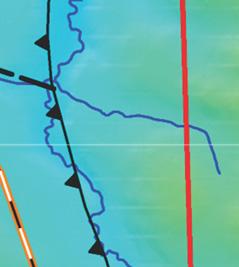
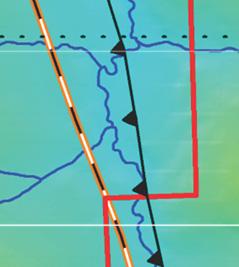
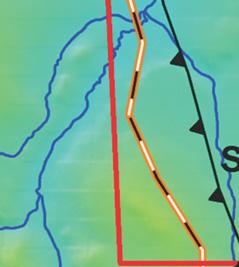
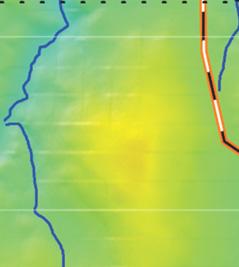
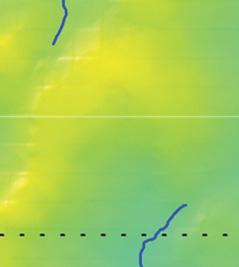
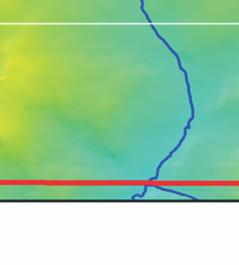
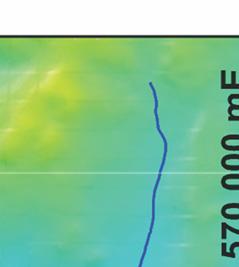
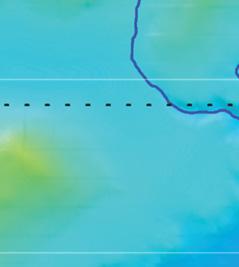
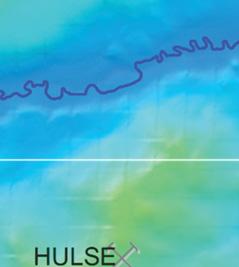
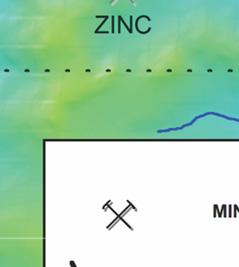
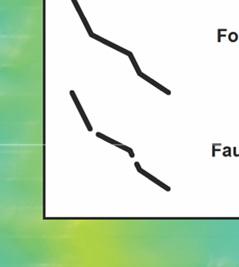
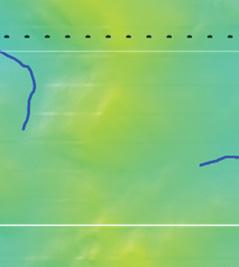
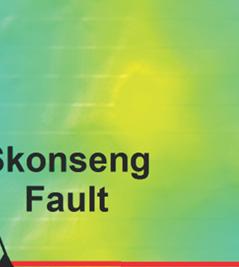
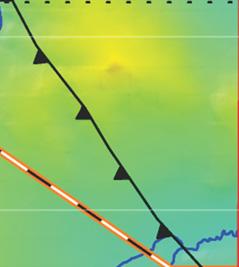
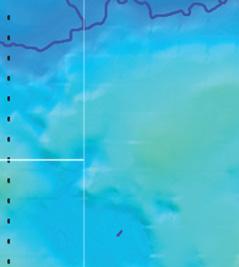
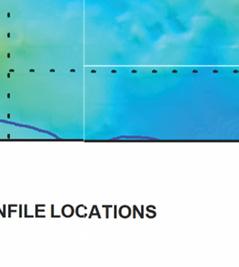
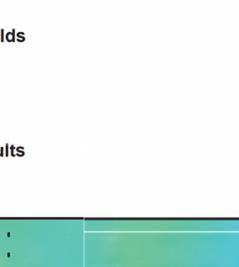
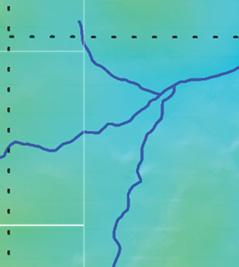
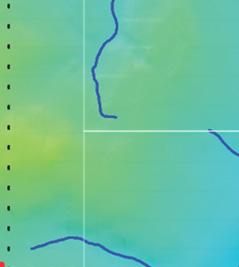
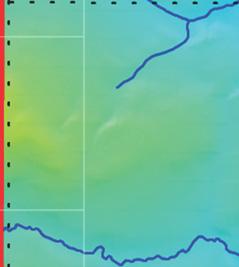
46 Technnical Report on the Hyland Gold d Project, Yukon Territory, Canaada ure 7.3: Pro operty-scalee Structurall Geology Map M On Sh haded Topoography Figu 41
47 (3) manto-like siderite replacement bodies up to 40 m thick, formed along limestone-quartzite contacts in a corridor along the QLL. These contain relatively minor amounts of pyrite, pyrrhotite and arsenopyrite; (4) narrow quartz veins containing erratic pods of nearly massive jamesonite, samples of which assayed up to 41% lead, g/t silver and 3.4 g/t gold. All types of mineralization are oxidized to varying depths, depending on fault-induced fracture density and local degree of glacial erosion. Character and intensity of mineralization depends on the character and chemistry of the host rocks. To that extent, the gold mineralization is both stratigraphically and structurally controlled (Carne, 2000) Main Zone Mineralization The Main Zone trends southerly across a low, heavily vegetated hilltop (Figure 7.2). Gold mineralization occurs within the core and nearby limb areas of a slightly overturned anticline. Best values are associated with within three parallel, strongly fractured and brecciated zones developed along the QLL in the core of the anticline in the Lower Quartzite or jasperoid replacement horizons developed in the overlying Lower Phyllite. The fault zones are up to 40 m wide and typically consist of recessive weathering, limonitic sand, clay gouge and quartzite fragments (Franzen, 1989). Minor gold mineralization occurs with massive sulphide or siderite altered zones at the base of the overlying Lower Limestone. Pre-glacial weathering and consequent oxidation of sulphide minerals extends to depths of up to 60 m from surface, especially in highly fractured areas. Glaciation has removed most of the oxide facies at lower elevations where fresh pyrite and arsenopyrite are present near surface (Carne, 2000). The best assays (>5 g/t gold) in the oxide zone are returned from samples containing scorodite stained grey quartz veins with abundant boxwork cavities after sulphide minerals. Moderately mineralized intervals grading 1.0 to 5.0 g/t gold occur within brecciated jasperoid altered horizons adjacent to higher grade vein mineralization. The jasperoid horizons are surrounded by sericite-clay altered rocks which carry gold grades between 0.3 and 1.0 g/t. Massive sulphide and siderite altered limestone typically contains 0.3 to 1.0 g/t gold (Carne, 2000). Although structural complexity makes unit by unit stratigraphic correlation in the Main Zone difficult, it appears that the best mineralization is in 3 m to 20 m thick, stratabound zones that may be linked by irregular, steeply dipping breccia bodies (Carne, 2002). Oxidation extends much deeper in the highly fragmented gold-rich central zone than it does in the less well fractured weakly mineralized adjacent sections. Sulphide mineralization and cross-cutting relationships among sulphide bearing veins are complex. There are at least three generations of veining present in the samples sent for petrographic analyses. They have been referred to as Types I, II and III. These veins overprint disseminated stratabound pyrite mineralization that occurs as aggregates of anhedral pyrite disseminated along bedding planes in less altered, layered sedimentary rocks. Type I veins consisting of ill defined or discontinuous aggregates of fine to medium grained, intergrown, anhedral pyrite and arsenopyrite. These are in turn cross cut by and dismembered by Type II veins consisting of quartz and fine grained sulphides (pyrite +/- arsenopyrite +/- chalcopyrite +/- bismuthinite), +/- tetrahedrite and +/- native gold. Type III veins consist of quartz +/- Fe-carbonate +/- pyrite +/- titanite and cross cut all other vein types and mineralization (Mauler-Steinmann, 2011). Ore microscopy work has identified eight gold grains 5 to 35 microns in size in one sample. Gold grains typically occur at pyrite-arsenopyrite grain boundaries or less commonly as inclusions within pyrite and are thought to be genetically related to the pyrite. Gold shows a strong geochemical correlation with bismuth and a moderate correlation with arsenic, copper and silver. Bismuthinite was identified in two petrographic samples 42
48 that returned 4 g/t and 2 g/t gold and arsenopyrite is a common constituent in the quartz-sulphide stockwork associated with the Main Zone mineralization (Mauler-Steinmann, 2011). The preferred host of gold mineralization is quartz veined and brecciated zones in the Lower Quartzite, with lesser mineralization in jasperoid altered or quartz flooded horizons in the overlying Lower Phyllite unit. Minor gold mineralization occurs in the capping Lower Limestone. Sax and Carne (1990) noted that tenor of mineralization is correlative with competency of the host unit. The brittle quartzites are heavily fractured in the core of the anticline, allowing for open space for hydrothermal deposition. The more ductile phyllite and limestone intervals are less permeable and offer little open space for mineral deposition. The best gold grades are accompanied by highly anomalous values of arsenic and bismuth. The recessive linear is flanked by resistant zones, several tens of metres wide of silicified but relatively unfractured rock that carries moderately anomalous gold values but with moderately to strongly anomalous bismuth and arsenic. These, in turn, are flanked by less silicified zones which carry only weakly to moderately anomalous gold. High levels of bismuth and the presence of bismuthinite is often used as evidence for a magmatic origin for gold mineralization. Carne (2000) notes that an association of anomalously high antimony, tungsten and copper values with gold in the Main Zone is also evidence for a magmatic source, at least in part, for the hydrothermal fluids responsible for the gold mineralization. Arsenic, on the other hand can occur in a variety of gold depositional environments (Mauler-Steinmann, 2011). It is also possible that sediment hosted gold mineralization at the Hyland Gold Project is part of a larger system that includes the McMillan silver-lead-zinc manto deposit. Replacement of the basal part of the Upper Limestone unit by manto-like bodies of siderite up to 20 m thick occurs in a flanking position to the Main Zone mineralization, along the sides of the anticline (Bremner and Oulette, 1990 and Carne, 2000). It is possible, and probable, that the entire Main Zone may have been capped by siderite replacement of overlying limestone before erosion removed all but the flanking bodies. The resulting interpretation is that iron metasomatism is also an integral part of the hydrothermal alteration and mineralization suite at the Main Zone Camp Zone Mineralization Oxidized to partially oxidized iron carbonate and/or semi-massive to massive sulphide (mostly pyrrhotite with lesser pyrite and arsenopyrite) bodies occur in limestone peripheral to the north-northeast trending QLL for several hundreds of metres north of the Main Zone. These are accompanied by a more than one kilometre long gold and arsenic-in-soil anomaly that has been tested by wide-spaced bulldozer trenching, RC drilling and diamond drilling between 1986 and the present. This area is collectively called the Camp Zone. The carbonate, sulphide and oxide replacement zones are shown by mapping and prospecting to be relatively continuous and mappable, following a nearly continuous trend along the QLL (Black, 2010). On surface iron oxide occurs in two bands that strike north and take a bend to the east before returning to a north-northeasterly trend approximately 300 m further on. The western band appears to be thicker (~10 m) with more intense alteration and mineralization. Both contain moderate to intense secondary iron oxide mineralization (limonite, goethite, and locally earthy hematite) and moderate to intense manganese oxides. These manto-like or chimneylike replacement bodies may represent deeper feeder style mineralization than the more silica flooded, open space filling style mineralization of the Main Zone. Drilling campaigns in 1990, 2003, 2004, 2010 and 2015 have tested Camp Zone structure for feeder zone sulphide systems. Many of them were short vertical or angle holes that did not exhaustively explore the large- 43
49 scale target for what will probably be a relatively localized style of mineralization with strong structural and stratigraphic control. For instance, Hemlo's 1995 surface exploration program targeted jasperoid alteration in a phyllite package along the QLL in the Camp Zone. Elevated gold and arsenic response from the geochemical sampling of the altered phyllites prompted diamond drilling to test for mineralization at depth, believing the jasperoid bodies to be the possible upper manifestation of Carlin-type gold mineralization at depth (Bidwell, 1995). Hemlo modelled the structural setting of the QLL, and associated replacement mineralization and jasperoid alteration, as part of a westerly dipping listric fault system as originally proposed by Bremner and Oulette (1991) (G. Bidwell, pers. com., 1995). Three diamond drill holes were completed in the area in September to October, Two of the three holes intersected pyritic zones but gold assays were low and no further work was carried out. If, as current accepted, the QLL is a near-vertical structural corridor, then deeper levels of the mineralized system would not have been tested by the relatively shallow Hemlo angle drill holes that were collared 300 m or more west of the surface trace of the QLL. In addition to the jasperoid, carbonate and sulphide replacement style mineralization, a few scattered jamesonite veins or pods up to 10 cm wide cut a siderite body exposed in a bulldozer trench about 400 m northeast of the north end of the Main Zone (Carne, 2002) Cuz Zone Mineralization The Cuz Zone lies about 4 km south of the Main Zone at the intersection of the Quartz Lake Lineament with a southeasterly trending normal fault that terminates or offsets the QLL (Figure 7.2). Host rocks are quartzite, conglomerate and limestone of the Upper Quartzite Unit of the upper Vampire Fm in fault contact with similar rocks of the overlying Yusezyu Fm. The main expression of the Cuz Zone mineralization is a gold/arsenic soil geochemical anomaly, originally 300m by 700m in area that has since been extended over two kilometres to the southeast along the strike of the southeasterly trending fault. In 2011, Argus Metals diamond drilling program resulted in the first ever in situ gold mineralization discovery at the Cuz Zone (Gray, 2015). Hole HY returned 4.5 m grading 1.93 g/t gold from 25.9 to 30.4 m and 4.5 m grading 0.65 g/t gold from 10.5 m to 15 m in the Cuz Zone discovery hole. Drill hole HY-11-37, located 80 m northwest of discovery hole HY intersected 6 m grading 1.38 g/t gold from 9.0 to 15.0 m and 1.5 m grading 1.52 g/t gold from m to 27.0 m. Drill hole HY located 240 m northwest of discovery hole HY intersected 3.6 m grading 1.12 g/t gold from 16.4 to 20.0 m. Complete oxidation of sulphide mineralization in drill core extends to about 20 m from surface, while transition zone incomplete oxidation extends to about 40 m from surface. Field examination of mineralized talus fragments collected in 2001 revealed two main types of gold mineralization (Carne, 2002). The first type and the one returning the highest gold grades to date, consist of limonitic, siliceous vein float within which tiny grains of arsenopyrite are sometimes still present after oxidation. Grey chalcedonic, somewhat banded and often drusy quartz in the veins, has been emplaced in at least two stages and is accompanied by brecciation and alteration of the host rock. Yellow-orange to red-brown limonite comprises from 10 to 50% of the vein material. Crosscutting relationships suggest that the veins may form a stockwork zone within the anomalous area. A grab sample of this material assayed 9.0 g/t gold. The second type of mineralization consists of gold bearing, sheared, leached and bleached clastic sedimentary rocks. At first glance these do not appear to differ greatly from the barren to weakly mineralized quartzite and conglomerates that are peripheral to the anomalous zone. On closer inspection, strong silicification and box works after disseminated sulphides are evident. One such specimen assayed 3.7 g/t gold. Although this type of mineralization is generally lower grade than the vein-bearing rock, the silicified material is probably more representative of much of the material found between veins or shear zones within the anomalous area. The 44
50 source area of this talus mineralization has not been directly tested by diamond drilling in 2005 and 2011, which was carried out at the base of slope. The fault that cross-cuts the QLL trends northwesterly from the Cuz occurrence through a narrow valley with poor bedrock exposure. Prospecting in this valley in 1982 discovered siderite float, a common alteration type in the Camp Zone (Joan Carne, pers. com. 2016). Mineralization at Cuz is gold dominated with low silver values as compared to the silver dominated mineralization at the Main Zone deposit (Gray, 2015). In style and mineralogy Cuz Zone mineralization is most comparable to Type III mineralization at the Main Zone deposit with quartz +/- Fe-carbonate +/- pyrite +/- titanite. (Black, 2010 and Lustig et al., 2003). Type III mineralization is the latest stage of mineralization at the Main Zone and possibly represents a distal, upper or waning phase of the hydrothermal system. Cuz Zone gold mineralization intersected by the 2011 drilling program, in conjunction with results of prospecting and soil sampling, outlines a potentially mineralized breccia up to 300 m wide over a possible 2 km strike length on a southeasterly trend. Gold mineralization sampled to date at the Cuz Zone is distinct from the Main Zone gold mineralization as there is a significantly lower silver component than the Main Zone. The Cuz Zone mineralization occurs along a regional scale fault that terminates or offsets the QLL and is in higher structural and stratigraphic setting than the Main Zone. It is the interpretation of Banyan staff that these secondary structures (and their intersections with the dominant north-south Quartz Lake Lineament) may offer important exploration targets for future work on other parts of the Property (Gray, 2015). Furthermore, the mineralogical and metallogenic characteristics of the Cuz Zone, coupled with its stratigraphic and structurally higher setting than the Main Zone, suggest that it may represent distal or high-level mineralization. It is possible then that significant gold mineralization may exist at deeper levels in the Cuz Zone where Main Zone stratigraphy may be present Unnamed Area of Mineralization Soil sampling by Westmin in 1995 over an area located 1500 m east of the Cuz occurrence (Pawliuk 1996) partially delineated an area of anomalous arsenic in soils response. Accompanying gold values ranged up to 525 ppb. Prospecting follow up in 1999 discovered strongly limonitic float with abundant pits formed by weathered sulphides that returned 5.5 g/t gold, >1% arsenic, ppm bismuth and 4050 ppm copper (Carne, 2002) Montrose Ridge Zone Mineralization Ridge and spur soil sampling was carried out in 2011 on Montrose Ridge, about 2 km south of the Cuz Zone, as a follow up of silt geochemical anomalies resulting from early exploration programs. Anomalous gold and arsenic in soils was followed up with more detailed geochemical sampling in 2013 and The 2014 program was successful in connecting the Cuz Zone soil coverage with the 2013 Montrose Ridge soils grid. The anomalous gold-arsenic in soils zone was enlarged by this program and a more defined underlying, possibly structural, trend determined in the process. These results indicate a broad 500m by 1000 m easterly trending gold-in-soils anomaly (>20ppb Au) (Gray, 2014b). Proceeding and co-incident with access road construction to Montrose Ridge in 2015, a systematic portable X- Ray Fluorescence (XRF) analysis soil sampling program was conducted on the Montrose Ridge gold/arsenic-insoils anomaly. This grid-based soil sampling program served to confirm XRF analyses effectiveness as well as to in-fill and extend the Montrose Ridge anomaly. Results of this work show that the XRF analyses 45
51 of Montrose soil samples report arsenic- in-soils results comparable to 2013/14 chemical analysis; and additionally that Bi is a highly applicable pathfinder element for the Montrose Ridge gold-in-soils anomaly. Excavator trenching was carried out in 2015 over the soil geochemical and portable XRF anomalies. Trench 2015 assay highlights include 6 m of 4.4 g/t Au from 0 to 6m in Trench MT-15-01, including 2 m of 13.1 g/t Au from 4 to 6 m. Trench MT also returned 24 m of 0.47 g/t Au from 18 to 42 m, including 6 m of 1.3 g/t Au from 36 to 42 m. Trench MT was 42 m long, however only 30 m were sampled due to overburden conditions from 6m to 18m. Chip and channel samples from other nearby trenches returned anomalous, but less significant values of gold and arsenic. The trench sample results at Montrose Ridge have low silver response (<1 g/t) similar to the Cuz Zone, 2.5 km to the north and strengthens the interpretation that both Cuz and Montrose represent a separate or higher level mineralized system than the Hyland Main Zone system, where an approximate 1:4 gold-silver ratio exits (Gray, 2015). This definition of vertically extensive, multi-phased gold mineralization events on the Hyland Gold Project further emphasizes the district-scale of the causative hydrothermal system Hyland South Zone Several point sample Au anomalies located within the more southern ridge and spur lines as well as 2013 follow-up soils grids should be revisited and step out soil sampling conducted in conjunction with geological mapping programs. Interestingly, the southern grids have a low background arsenic component in comparison to the Cuz and Montrose Ridge areas. This could be a function of primary mineralizing event and/or host rock (lithological) differences. More mapping and sampling will be required to more adequately qualify this discrepancy, and should concentrate on determining if a separate domain of arsenic background should be utilized in all future exploration programs in these developing exploration zones Pyrite Creek Showing Westmin geologists mapping and prospecting in 1995 along the canyon of Pyrite Creek, about 3 km west of the Hyland Gold Main Zone, noted that siliceous quartzites there contain up to 1 to 2% disseminated pyrite with local arsenopyrite. A grab sample of siliceous quartzite with massive arsenopyrite and pyrite returned an assay of 2.23 g/t gold and greater than 1% arsenic (Turner and Pawliuk, 1996). 8.0 DEPOSIT TYPES 8.1 Overview of Hyland Gold Mineralization Styles Gold mineralization has been discovered in several areas on the Hyland Gold Project. The Main Zone has received the most exploration and it is the best known example: It occurs within a slightly recumbent anticline developed along a regional structural corridor of faulting and folding known as the Quartz Lake Lineament (QLL), notably where it is cut by a cross cutting southeast trending fault. There is a strong coincidence with other less well explored gold mineralization and untested geochemical targets with the QLL or cross cutting faults; Gold occurs in quartz veins and breccias in quartzite, to a lesser degree in silicified (jasperoid altered) zones in phyllite intervals, and as a minor constituent of iron sulphide or iron carbonate replacement zones in limestone along the QLL; Native gold occurs as inclusions in pyrite and at pyrite/arsenopyrite grain boundaries; 46
52 Primary mineralization in the Main Zone comprises pyrite, arsenopyrite and chalcopyrite, with minor sphalerite, tetrahedrite, pyrrhotite and bismuthinite; Accessory minerals include tourmaline and muscovite; Mineralization is both stratabound and structurally controlled; There is no direct evidence of an igneous association for mineralizing fluids although the pathfinder element suite of arsenic-bismuth-tungsten and the association of hydrothermal tourmaline suggests involvement of granitic fluids, at least in part; and Highly fractured zones of better grade gold mineralization can be oxidized to a much greater depth than relatively unfractured, but silicified, flanking zones of lower grade mineralization. In other areas on the Project, gold occurs in manto-like siderite replacement bodies in limestone adjacent to the QLL, in massive sulphide bodies within fault zones that make up the QLL, in jamesonite veins cutting the siderite mantos, and as sulphide mineral disseminations in silicified and/or brecciated sedimentary rocks outside the QLL corridor. The association of mineralization with faulting is evident along the QLL, especially where it is intersected by cross faults. The stratigraphy along the QLL generally plunges to the south for a nine kilometer distance that rises in elevation from the Camp Zone, through the Main Zone, the Cuz Zone and finally to the Montrose Ridge Zone. Changes in gold deposit style range from manto and chimney sulphide-rich bodies at the Camp Zone, to silicaflooded, relatively silver-rich breccia zones in the Main Zone and finally, distal style mineralization with low silver-gold ratios at higher elevations and higher stratigraphic levels in the Cuz and Montrose Ridge Zones. These variations in deposit style may be a result of regional lateral zonation, relative exhumation level of the Project wide hydrothermal system, chemical/physical variation in host stratigraphy; or some combination of all these factors. The McMillan lead-zinc-sliver manto mineralization west of the Project area also occurs along the same southeasterly tending fault that focuses mineralization at the Cuz occurrence and offsets the QLL. A conceptual model of Hyland Gold mineralization is shown below in Figure Sediment-hosted Gold Occurrences Elsewhere in Selwyn Basin Sediment hosted gold mineralization with indirect or no direct magmatic association occurs elsewhere in Selwyn Basin at the ATAC Resources Ltd. Rackla Gold Project in the recently discovered Rau and Nadaleen Trends. The Tiger deposit is the best known of twenty or more gold occurrences in the Rau Trend of central Yukon. The deposit has a compliant Measured and Indicated resource of 5,680,000 tonnes containing 485,700 ounces of gold at a grade of 2.66 g/t and 649,900 ounces of silver at a grade of 3.56 g/t, and an Inferred Resource of 3,230,000 tonnes containing 188,500 ounces of gold at a grade of 1.81 g/t and 95,600 ounces of silver at a grade of 0.92 g/t (Kappes et al, 2014). Mineralization consists of sediment-hosted carbonate replacement mineralization developed within a Silurian to Devonian shallow water limestone unit adjacent to a major regional-scale, crustal fault that may have been active as far back as the Paleozoic (Kappes, et al, 2014). 47

53 Figure 8.1: Conceptual Model for Hyland Gold Project Mineralization Auriferous sulphide mineralization at Tiger is developed in a shallow water lagoon facies limestone that is replaced by ferruginous dolomite and iron carbonate minerals adjacent to the regional scale northwest trending fault. Mineralization occurs in two distinct assemblages: (1) hydrothermal ferruginous dolomite with goldbearing arsenopyrite and minor pyrite, and (2) fractures hosting native gold associated with bismuth, antimony, silver, tungsten and minor base metals (Thiessen et al, 2016). Best grades of mineralization and deepest oxidation occurs in an area cross cutting north trending faults. Gold mineralization has been bracketed by isotopic dating to be contemporaneous with intrusion of a nearby granite intrusion dated at 62.3 Ma. Magmatic fluids migrating along fault corridors from the 3 km distant pluton were responsible for relatively high temperature (~350 o C) gold mineralization deposited along selective permeable limestone horizons (Theissen et al, 2016). The Nadaleen Trend recent gold discoveries are located 100 km east of the Tiger Deposit. They are considered to be true Carlin-type mineralization (Arehart et al, 2013). Carlin-type gold occurrences are abundant in northcentral Nevada but uncommon elsewhere. They are characterized by micron-scale gold contained within disseminated arsenian pyrite. Deposits are typically found as replacement zones in silty carbonate and have both structural and stratigraphic controls with strong relationships to deep seated crustal structures (Tucker, at al, 2013). Folds and faults are important controls on mineralization, with best developed examples occurring in 48
54 anticline core areas along regional scale faults. Nadaleen Trend gold mineralization occurs within many lithologies but is best developed within silty limestone sequences where alteration is characterized by decalcification, silicification and occasional solution collapse breccias that are accompanied by peripheral secondary calcite flooding. Mineralization within non-calcareous rocks is typically associated with fault breccias and/or intense fracture development. Significant late-stage realgar, orpiment, fluorite, arsenian pyrite and trace stibnite are found as associated open space fillings (Lane et al, 2015). The Conrad Deposit in the Nadaleen Trend has an age of mineralization bracketed by isotopic data of between 74 and 43 Ma (Tucker, 2015). Carlin type occurrences are conventionally thought to be generated by relatively low salinity, possibly distal magmatic fluids with temperatures estimated at 175 o C to 250 o C. The Nadaleen Trend deposits are estimated, on limited data, to have formed from fluids with temperatures around 200 o C (Arehart et al, 2013). 8.3 Distal-disseminated Sediment-hosted Gold Deposits at the Marigold Mine, Nevada The best analogy for gold mineralization at the Hyland Gold Project may be another type of sediment-hosted gold mineralization that also occurs in north-central Nevada. The Main Zone has many characteristics of the gold deposits that form the Marigold Mine, located at the north end of the Battle Mountain-Eureka Trend in north-central Nevada, as documented by Carver et al (2014). Three packages of passive continental margin Paleozoic sedimentary rocks are present at Marigold. In ascending order, these are: the Ordovician Valmy Fm; the Pennsylvanian to Permian-aged Antler Sequence; and the overlying Havallah Sequence. All of these stratigraphic packages host gold mineralization on the Marigold Mine property. The Valmy Fm consists of relatively deep water deposits of a lower interbedded quartzite and argillite sequence; an intermediate package composed of meta-basalt, chert, and argillite; and an upper package of quartzite and argillite very similar to the lower unit. The top of the Valmy Fm marks a major regional depositional angular unconformity with the overlying Antler Sequence. The Antler Sequence is composed of a sequence of continental shelf sedimentary rock including conglomerate, sandstone, limestone, chert and barite that were deposited in marine basins and troughs adjacent to the paleo-highland of Valmy Fm. The contact with the overlying Havallah sequence is the Golconda thrust fault. The Havallah assemblage is dominated by siltstone, meta-volcanic, chert, sandstone and carbonate rocks. Gold mineralization at Marigold has been mined in a number of deposits located over a three by ten km area. The main structural corridor and controlling feature for the gold deposits is a 1.6 km wide, 8 km long uplifted block of predominantly Valmy Fm rocks that is cut and bordered by north-south trending steep normal faults. In this structural domain Valmy Fm rocks are highly deformed, with imbricate low angle thrust faults, bedding slip and associated overturned tight folds. Argillite beds within the sequences deformed plastically while the intercalated quartzite horizons shattered, creating open fracture spaces for deposition of gold-bearing sulphide mineralization. Gold mineralization is spatially related to favorable stratigraphic horizons with the Valmy host rocks as well as within fault zones. The series of north-south trending, bounding fault structures are interpreted to have been important fluid conduits for the supply of ascending mineralizing fluids into zones of favorable stratigraphy along the length of the mineralized area. The intersections of the north-south trending bounding faults with second order north-west and north-east trending faults are also a key structural control for gold deposition at 49
55 Marigold. In un-oxidized rocks, gold occurs in quartz veinlets within arsenic enriched overgrowths on pyrite (Carver et al, 2014). The deposits at the Marigold Mine are classified as distal-type sediment-hosted gold deposits by Carver et al, (2014) and as distal-disseminated sediment-hosted gold deposits by Johnston and Ressel (2004). These gold occurrences are replacement bodies without typical epithermal-style veins or epithermal open-space features. Gold and ore-stage sulfides are typically disseminated in altered or silicified sedimentary host rocks. There is no direct relationship between mineralization and a related major pluton, although there commonly are associated distal-type dikes and/or sills - leading to speculation that there is a major pluton(s) at depth below such gold districts. Distal-disseminated sediment-hosted gold deposits in north-central Nevada are identified by characteristic hydrothermal alteration assemblages consisting of jasperoidal silicification, argillization, and decalcification of carbonate-bearing lithologies. Controls on mineral deposition that are useful for exploration include a common association with fold hinges. Occurrences are aligned along favorable faults or fault corridors that were active during mineralization. There is an association with narrow dikes, and a strong lithological control which can result in manto-like shapes to mineralized bodies in receptive host rocks. Gold in these deposits is hosted by numerous lithologies, the common feature being some type of pre-mineral permeability, whether primary or secondary. Johnston and Ressel (2004) propose a continuum between distal-disseminated gold deposits and Carlin-type gold deposits in the Great Basin of Nevada with most or all deposits occurring as peripheral, relatively shallow components of large, complex, magmatic hydrothermal systems. In Selwyn Basin, as in north-central Nevada, there may be an indirect link between different varieties of sediment-hosted gold occurrences, assuming that variation in characteristics between Carlin-type, carbonate replacement and distal-disseminated may largely be a result of relative distance from magmatic heat and fluid sources, and differing host lithologies. While the similarities of Hyland Gold Main Zone mineralization to distal-disseminated sediment-hosted gold deposits of the western United States was recognized relatively early in the exploration history of the Project (Carne, 1984), little research has been carried out to refine the Hyland Gold deposit model as an exploration targeting tool. An integrated MSc. level compilation of all available exploration data on the property with application to the deposit model is an appropriate next step. The first author (Carne) has managed and participated in exploration programs on the Rau Trend between 2008 and 2015 and the Nadaleen Trend between 2009 and 2015 and participated in a university graduate level field trip to the Marigold Mine in Discovery and delineation of gold mineralization at all three projects has been a result of persistent exploration programs carried out over many years in concert with applied research. 50
56 9.0 EXPLORATION 9.1 Geological Mapping The Hyland Gold Project area spans a variety of terrain, from low-lying areas with little bedrock exposure to ridge tops above tree line. The main historical areas of exploration interest lie below tree line and, aside from mechanically disturbed areas; there is little natural exposure of the mineralization in the Main Zone area. The first detailed mapping on the project was done by in 1984 (Carne, 1985) before bulldozer trenching and drilling campaigns were carried out. Although this work provided a framework for the structural and stratigraphic setting of gold mineralization, the poor level of natural bedrock exposure prohibited a definitive understanding of the property geology. Since then, there has been significant exposure of bedrock by mechanized trenching and detailed mapping has accompanied sampling of the trenches. Various geochemical sampling programs by a variety of operators over different parts of the Project area have also been accompanied by localized geological mapping at various scales. However, a rigorous integration of this geological data with results of geochemical and geophysical survey programs compiled with fragmented geological mapping has never been carried out to produce a property-scale geology map with a level of detail necessary to guide the next levels of investigation. Figure 7.2 is a compilation of property geology taken from relatively recent regional scale geological mapping by the Yukon Geological Survey (Pigage et al, 2011). 9.2 Geochemical Sampling Introduction The Hyland Main Zone area has been covered by numerous soil and stream geochemical surveys conducted from 1973 to Data is compiled from the 1984 to 2015 sampling programs in the core Project area as well as other data resulting from surveys carried out by Westmin Resources Ltd. in 1994 and 1995 over the rest of the property and it is presented as thematic maps for gold and arsenic in soil and silt samples in Figures 9.1 to 9.4. All detailed soil sampling of the Main Zone was performed before there were any surface disturbances from road building, trenching or drilling so that there is little likelihood of contamination or dispersion by mechanical means. A brief history of the different surveys over the Main Zone, adapted in part from Armitage and Gray (2012b), follows below. The entire area of the original Hyland Gold core claims was sampled prior to 1986 by several generations of wide-spaced soil geochemical surveys. Sample preparation, analytical methods and sample security for the various programs are discussed in Section 11 of this report. Soil samples collected in were collected at wide-spaced grid intervals (60 by 245 m or 200 by 800 feet) and from regional-scale soil and stream sediment traverses across the entire property. Soil sampling on the Quiver claims was carried out in 1982 at 30 m intervals along and in between old partially overgrown 800 foot spaced cut lines. Soil samples were collected on the Piglet claims in 1984 at 50 m intervals along and in between the old cut lines. Detailed soil sampling carried out in 1986 covered a 3.3 km 2 area. Two thousand one hundred soil samples were collected at 30 m intervals on 60 m line spacing. Soil sampling in the south part of the property in 2013 and 2014 consisted of ridge and spur traverses that were followed up with small grid sampling programs in 2014 and Geochemical background, threshold and maximum values for important chemical elements in the Hyland mineralizing system are tabulated below (Table 9-1). Note that geochemical patterns and associations between bismuth, antimony, silver, lead, zinc, and manganese rely on observations made from historical data in map and report form that are not included in this document. 51
57 Table 9.1 Background and Threshold Values for Important Elements Element Backqround Threshold Maximum Gold 5 ppb 25 ppb 1950 ppb Arsenic 50 ppm 200 ppm >1% Bismuth <2 ppm 4 ppm 546 ppm Copper 15 ppm 50 ppm 309 ppm Lead 35 ppm 50 ppm 380 ppm Zinc 50 ppm 100 ppm 600 ppm Barium 150 ppm 300 ppm 1160 ppm Antimony <10 ppm 10 ppm 310 ppm Manganese 200 ppm 600 ppm >1% Main Zone - Camp Zone Anomaly Results of geochemical surveys carried out in previous years on the Hyland Gold property have defined a 2 km long, northerly-trending zone of strongly anomalous gold values, with coincident highly anomalous arsenic and bismuth soil geochemical response. The Main Zone occurs at the south end of this area, while the northern extension underlies the Camp Zone (Figures 9.1 and 9.2). A 1.2 km long south east extension of the soil geochemical anomaly (Southeast Anomaly) with similar gold values but only weakly to moderately anomalous arsenic values has only been lightly explored with a few bulldozer trenches that did not reach bedrock for the much of their length. A broad zone northerly trending area of moderately anomalous gold and weakly anomalous arsenic values (East Anomaly) lies about 1 km east of the Main Zone. This area has received little historical follow up to the soil sampling program originally conducted in In the Main Zone Anomaly, gold values in soils range from a threshold value of 25 to a maximum of 1,950 ppb. Arsenic values exceed 1% from a threshold of 200 ppm and bismuth values range up to 546 ppm with a threshold value of 4 ppm. The anomalous area extends northerly along the Camp Zone beyond the known extent of Main Zone gold mineralization, where it is eventually terminated to the north by an area of deep glaciofluvial overburden. Bismuth anomalies closely follow gold anomalies with the strongest and most continuous values occurring along the QLL. Arsenic response follows the same trends as gold and bismuth, although the anomalies tend to be more widespread. Antimony values are generally less than the 10 ppm lower detection limit of the ICP analytical technique used. Anomalous values (>10 ppm) cluster in isolated patches along the length of the Main Zone Anomaly with peak values to 310 ppm antimony. Silver response is weak and erratic with only localized anomalies present with individual values reaching 32.4 ppm. Lead, zinc and manganese show a good inter-correlation with anomalous values clustering west of, and peripheral to, the elongate gold-bismuth-arsenic-antimony-silver Main Zone Anomaly. This pattern in the soil geochemistry is possible evidence for metal zoning from a precious metal core to base metal periphery. 52
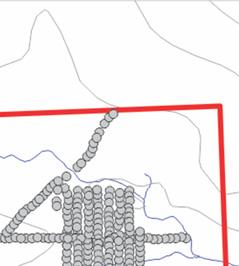
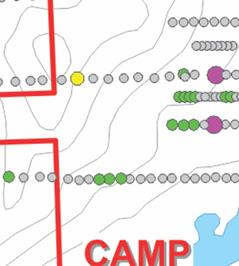
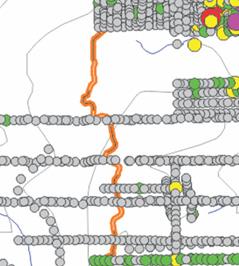
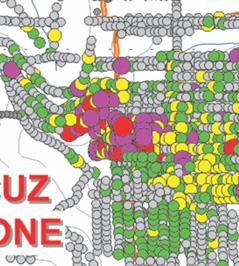
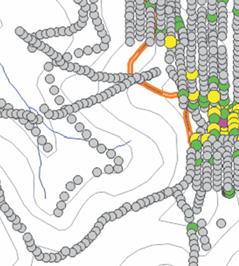
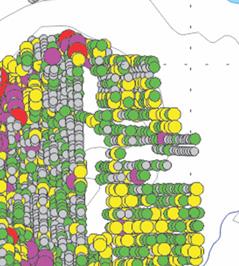
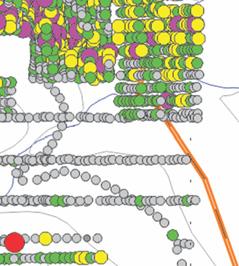
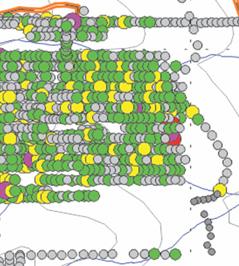
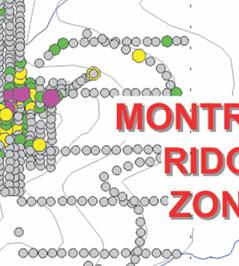
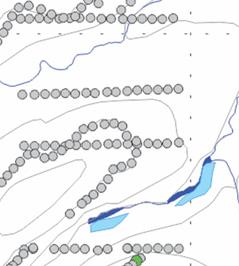
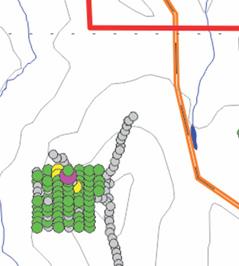
58 Technnical Report on the Hyland Gold d Project, Yukon Territory, Canaada Figu ure 9.1: Soil Sampling Compilation C n Map Go old Geochem mistry 53
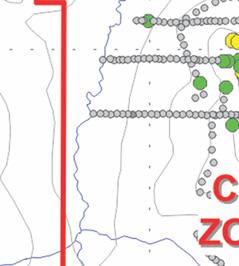
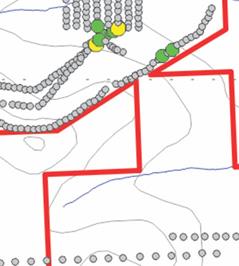
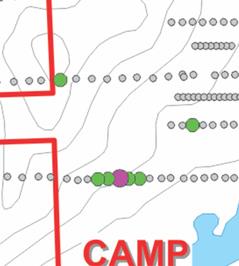
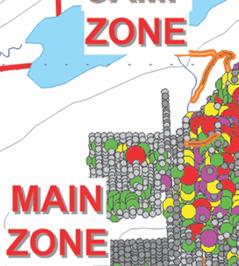
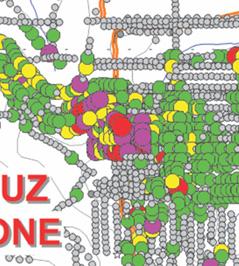
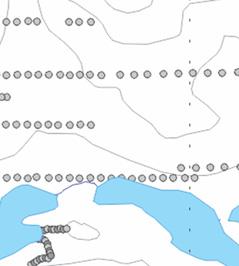
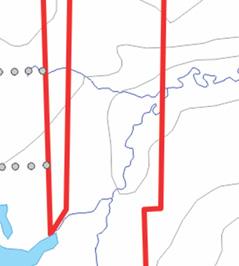
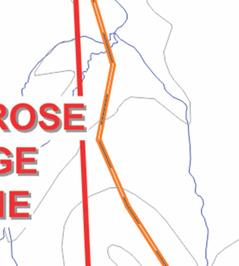
59 Technnical Report on the Hyland Gold d Project, Yukon Territory, Canaada Figu ure 9.2: Soil Sampling Compilation C n Map Arsenic Geoch hemistry 54
60 9.2.3 Southeast Anomaly The Southeast Anomaly was not completely delineated by the 1986 grid sampling program. Gold and bismuth outline a 1.2 km long, 300 m wide southeast trending anomalous zone that is not associated with any obvious topographic feature but closely matches a northwest-southeast feature evident in the Newmont airborne magnetics survey. Arsenic values in soils from the Southeast Anomaly are not as strong as those from the northern part of the anomalous trend. Peak values in soils exceed 100 ppb gold, 250 ppm arsenic and 10 ppm bismuth. Antimony values are generally less than the 10 ppm lower analytical limit of the ICP analytical technique used. Scattered clusters of soil samples containing 10 ppm antimony are associated with the broader gold-bismuth anomaly although no strongly anomalous values were detected. Silver response is generally low with large areas of weakly anomalous values to 20 ppm. Lead, zinc and manganese response varies from threshold to moderately anomalous values. Unlike the Main Zone anomaly, however, the distribution of lead, zinc and manganese anomalies generally follows that of the gold-bismuth-arsenic suite East Anomaly The East Anomaly was not re-sampled during the 1986 survey so sample density is lower in this area and consequently the data was not contoured. Broad, discontinuous areas of moderate gold, arsenic, lead, zinc and manganese response resulting from the 1982 sampling program are not related to any known geological feature. Broad areas exceed the 25 ppb gold threshold with several spot values above 100 ppb Au Cuz Anomaly The main expression of the Cuz Zone mineralization is a gold and arsenic soil geochemical anomaly, originally 300m by 700m in area that has since been extended over two kilometres to the southeast along the strike of the southeasterly trending fault. The core of the Cuz Anomaly is a roughly circular, 275 m diameter area of very anomalous gold-in-soils response with most samples exceeding 100 ppb, to a maximum of 1940 ppb. Arsenic results from soils in the core area range up to 4600 ppm and, similar to the Main Zone area, they outline an anomalous area considerably larger than the area of high gold-in-soils (Carne, 2002) Montrose Ridge Anomaly In 2011 Argus Metals conducted of ridge and spur soil geochemical sampling programs totaling 1,754 soil sample with a complementary watershed silt sediment sampling program totaling 129 samples on recently staked claims extending the Hyland Gold Project to the south (Gray 2014b). These claims were staked to target untested regional stream sediment geochemical anomalies determined from an analysis of government RGS and project proprietary silt sample data (Arne, 2011). Follow up of the 2011 recce scale gold and arsenic geochemical anomalies was the main focus of Banyan s 2013 and 2014 exploration efforts. Banyan s 2013 geochemical exploration program consisted of four detailed soil grids, following up on ridge and spur anomalies and two ridge and spur soil sampling traverses designed to follow up on geochemically anomalous silt samples. Each of these grids and ridge and spur traverses was successful in delineating and expanding earlier gold in soil geochemical anomalies and has in particular, resulted in the discovery of an open sided, coincident gold and arsenic in soils anomaly designated as the Montrose Ridge Zone (Gray, 2014b). This newly identified area is located ~6.5 km south of the Main Zone and extends south from the Cuz Zone, with the most anomalous soils geochemical response located about 2 km south of the Cuz Zone. The 2014 Program (Gray 2014b) was successful in filling the unexplored areas between the Montrose Ridge and Cuz grids and moreover, extending and further defining the 2013 anomalous gold and arsenic-in-soils 55
61 anomalies. In total, Banyan collected and shipped 491 samples (452 soils and 39 rocks) from the soil grid program. All samples were sent for subsequent analyses to AGAT Labs in Whitehorse, YT where they were prepped and subsequently analyzed for 50 element ICP assay with a 30g Fire Assay finish. The geochemical sampling program targeted the Montrose Ridge and Cuz South geochemical anomalies generated from 2014 soil sampling and returned anomalous gold-in-soils results as summarized below: Gold levels in soils ranged from trace to 120 ppb Au with a mean of 7 ppb, Arsenic levels in soils ranged from trace to 561 ppm As with a mean of 54 ppm, and Silver levels in soils ranged from trace to 300 ppb Ag with a mean of 103 ppb. In 2015, a portable X-Ray Fluorescence (XRF) analysis based grid soil geochemical sampling program was conducted over the Montrose Ridge gold and arsenic-in-soils anomaly. This was done to confirm XRF analyses effectiveness as well as in-fill and extend the existing Montrose Ridge anomaly. The XRF analyses of the Montrose soil samples were comparable to the 2013 and 2014 arsenic-in-soils laboratory results. In addition, it was found that bismuth was a highly applicable pathfinder element for the Montrose Ridge gold-in-soils anomaly (Gray 2015). In total, 301 soil samples were collected from the Montrose Ridge Zone during the 2015 exploration program. All soil samples locations were determined by GPS and analyzed by XRF daily, with final results used to finalize the location of the 2015 excavator trenches. The XRF soils analytical work produced a strong 1.4 km long bismuth and arsenic-in-soils anomaly centered on the previously identified gold and arsenic-in-soils anomaly at Montrose Ridge. The Bi XRF results ranged from trace to 2,818 ppm bismuth with an average of 59.3 ppm. Arsenic XRF results ranged from trace to 4,308 ppm with an average of 405 ppm. The bismuth and arsenic-in-soils anomaly forms a broadly east trending zone with a possible 110 main strike, interpreted to represent a possible secondary mineralized structure akin to the control of gold mineralization previously identified by drilling in the Cuz Zone to the north (Gray, 2015). Additionally, several generations of Project-wide stream sediment sampling have been conducted on the Hyland Gold property. Figures 9.3 and 9.4 summarize the stream sediment sampling data results for gold and arsenic, respectively Discussion of Geochemical Survey Results Effective soil sampling in the Main Zone area is hampered by pockets of deep glacial overburden in north-south trending gullies immediately east of the Main Zone Anomaly and a thick glaciofluvial terrace that flanks the sides of the Quartz Lake valley. To test for extensions of the Main Zone Anomaly to the north, south and east would require mechanized auger sampling to penetrate this cover. Similarly, increasing overburden depth on the East Anomaly may, in part, be responsible for the decreased magnitude of the geochemical signature and power auger sampling could be an effective tool to test this. The location of the Main Zone Anomaly closely follows the main axis of the anticline along the QLL (Figure 7.2) and is closely associated with the Lower Phyllite unit exposed in the core of this structure. Outcrop in the 56


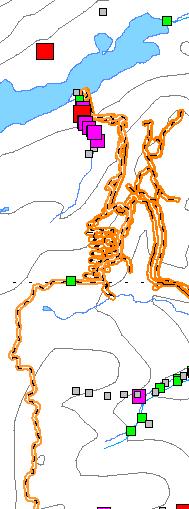
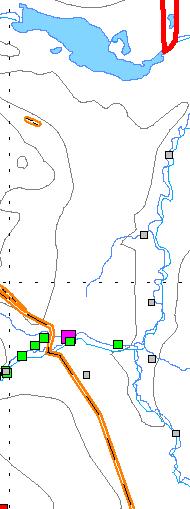
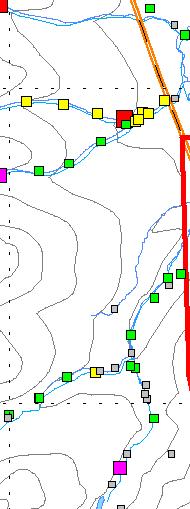
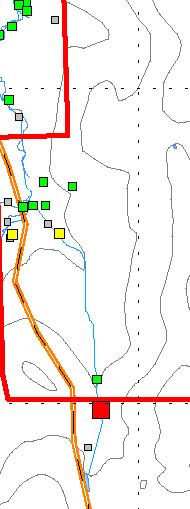
62 Figure 9.3: Stream Sediment Sample Compilation Map Gold Geochemistry 57


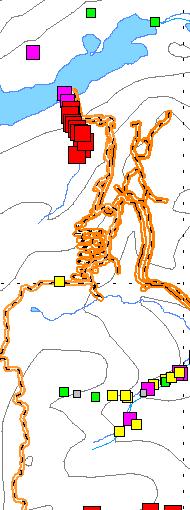
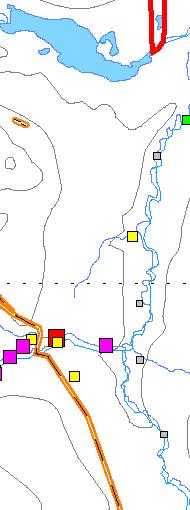
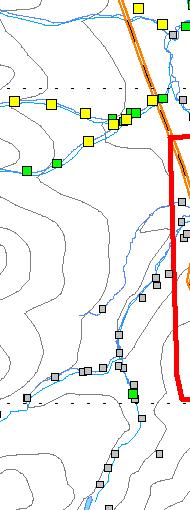
63 Figure 9.4: Stream Sediment Sample Compilation Map Arsenic Geochemistry 58
64 East Anomaly area is very sparse, and it is possible that the anomaly signature is lower in this area due to weaker mineralization because of less favourable underlying host rocks. Similarly, testing the southern extension of the Main Zone and Southeast Anomalies may be complicated by changes in underlying stratigraphy. Mapping suggests that as topography ascends to the south, Upper Limestone units are exposed. It is thought that these relatively reactive and ductile units form barriers to upward hydrothermal fluid migration in the Hyland hydrothermal system. However, significant gold mineralization could be expected in phyllites or quartzites beneath the Upper Limestone, especially where weak soil geochemical anomalies suggest the presence of leakage mineralization developed in the limestone along through going faults. 9.3 Geophysical Surveys Descriptions of the historical geophysical surveys conducted over the Hyland Gold Project area and an interpretation of that data were prepared by Klein (2004) and the section following was adapted from the Armitage and Gray (2012b) review of that work (Figure 9.5). Ground geophysical surveys were conducted in 1988 over a 2,500 x 2,900 m area in the northern part of the property along E-W oriented lines approximately 125m apart. Induced Polarization/Resistivity (IP/Res), Magnetic (GMag) and VLF-EM data were collected. Not all lines were surveyed with IP/Res. That part of the ground survey covers only the northern part of the Main Zone and the area further to the north. All data is available in profile and contour form. No actual data points are shown on the original maps and station intervals are therefore not known. A 542 line kilometer Dighem-V airborne electromagnetic survey was carried out in June Lines were flown in an E-W direction at 200m intervals. The survey covers an area of 7 x 14 km and is centered just north of the Cuz Zone. The full Dighem report, maps and digital data are available including the Calculated Resistivity for the 7200Hz coplanar coil set. An airborne magnetic and radiometric survey was flown with the Newmont airborne system in June An area of ~1,800 square kilometers was covered with E-W oriented lines at 250m interval. The aircraft, including the 1,024 cubic inch spectrometer, was optimally flown at 90m above ground level. The magnetometer was towed 30m below the aircraft. The data is available in map and digital format with a report by the Newmont staff. The IP/Res survey used a single separation Schlumberger array (transmitter dipole AB=240m, receiver dipole MN=40m). The VLF-EM employed the Seattle station transmitting at 24.8 khz. The direction towards that station means that ~N-S oriented conductors and resistivity contrasts are emphasized over those oriented ~E-W. The data available is of good quality. The IP contours were digitized in 2003 using the NAD83 base and then converted to NAD27. The main anomalous axes of the other ground data sets were traced on to the NAD27 base map. There will be some discrepancies in this process so care was to be taken when cross correlating different data sets in detail or when deciding on the actual location of anomalies. The Aeromagnetic ( AMag ) results show a large (~2,000 x 1,500m) smooth magnetic low (<56,800nT) roughly centered near the Main Zone (Figure 9.6). This type of broad, smooth magnetic low can be caused by a deep-zoned intrusive or by pervasive alteration over a large area that has destroyed primary magnetic minerals. The latter is the more likely source of this magnetic low. Directly north of the Main Zone short-waved 59

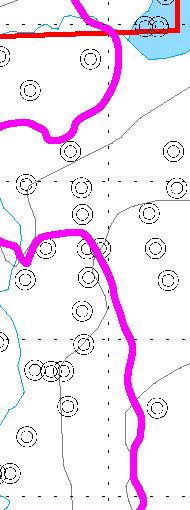
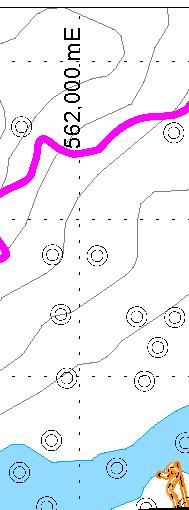
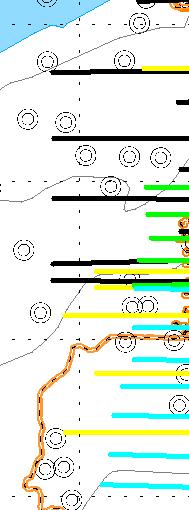
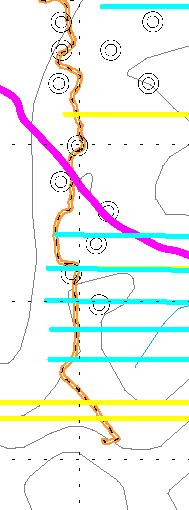
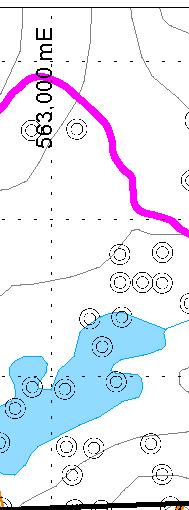
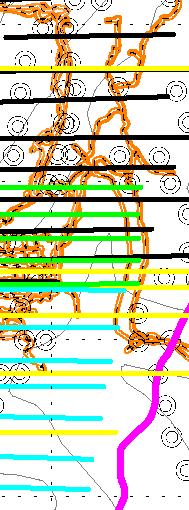
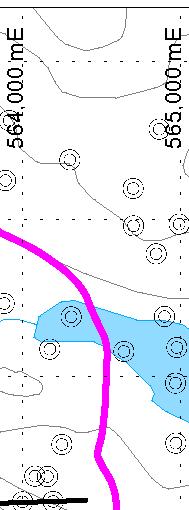
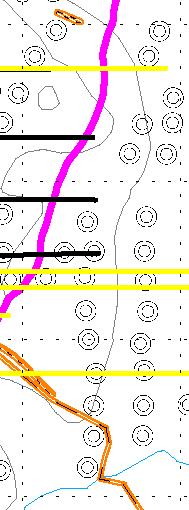
65 Figure 9.5: Geophysical Survey Compilation Map 60
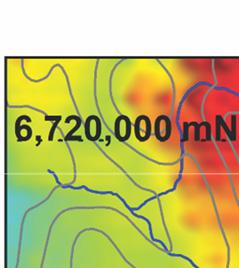
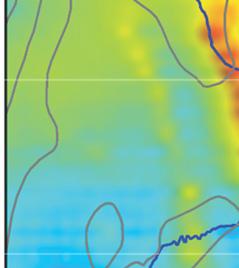
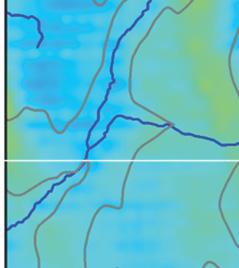
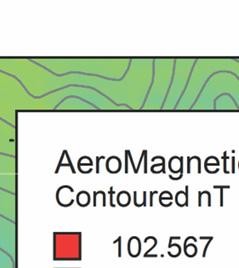
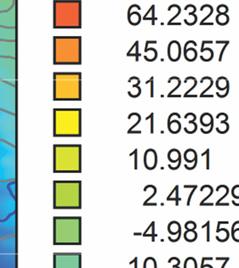
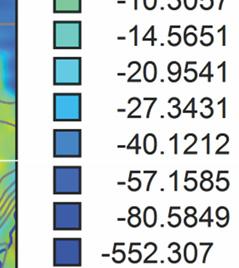
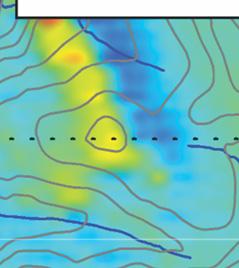
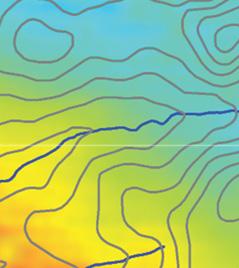
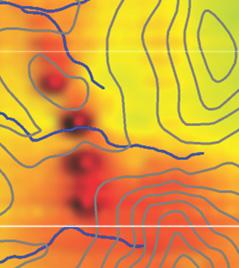
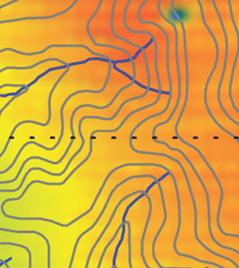
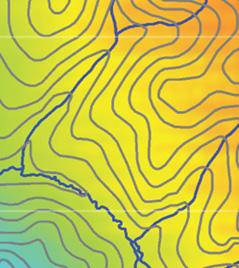
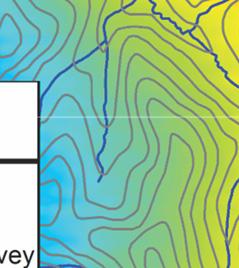
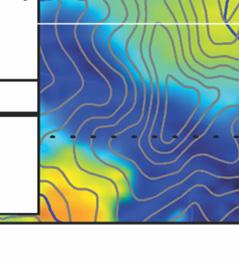
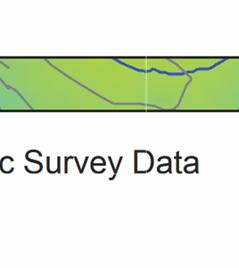
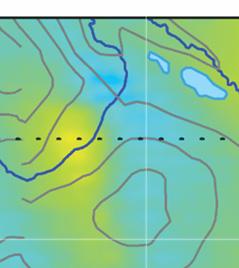
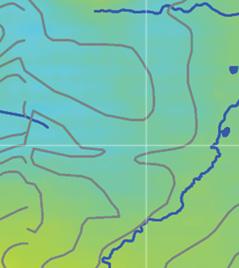
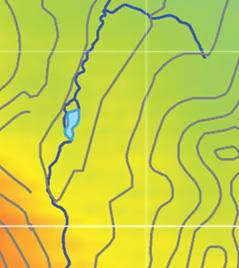
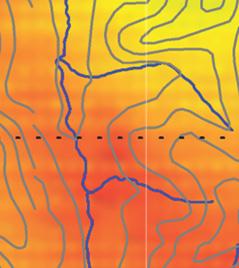
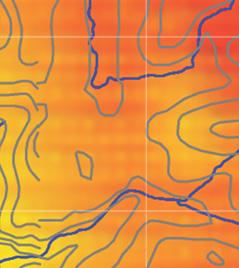
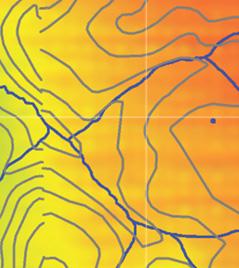
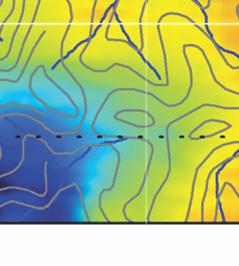
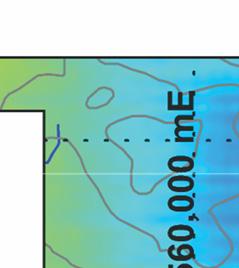
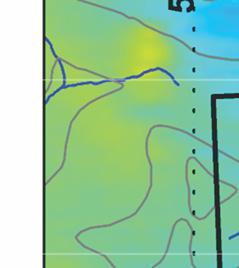
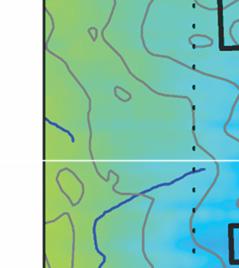
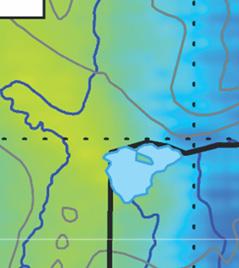
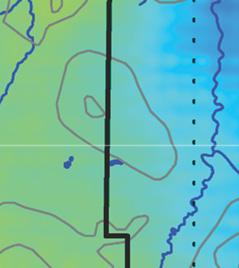
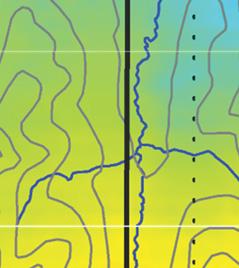
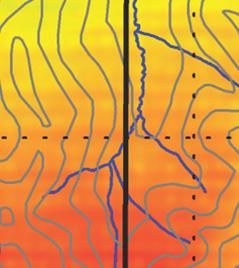
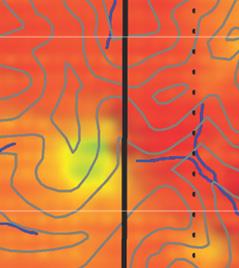
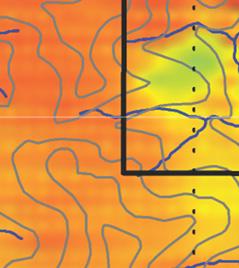
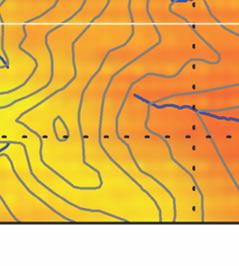
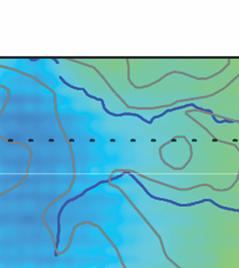
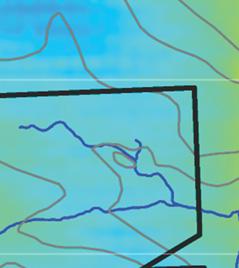
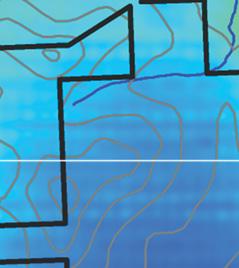
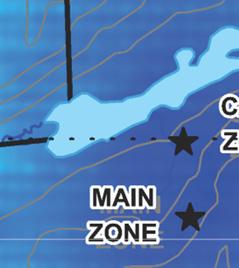
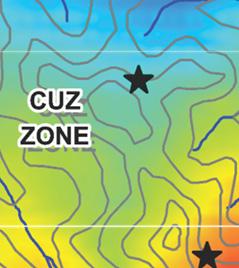
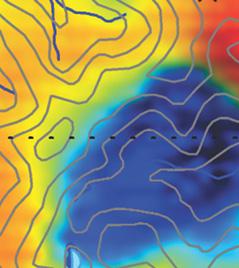
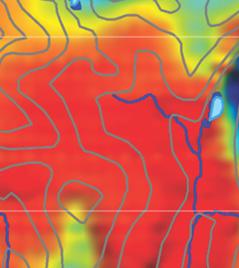
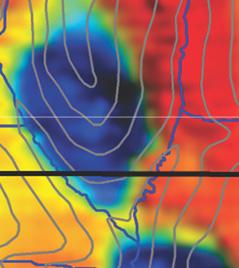
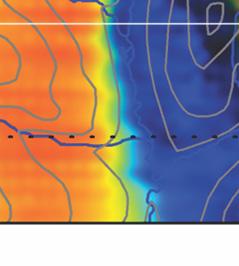
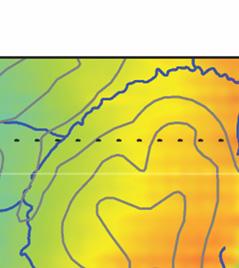

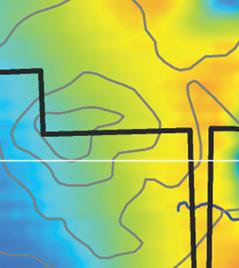
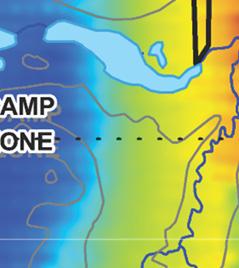
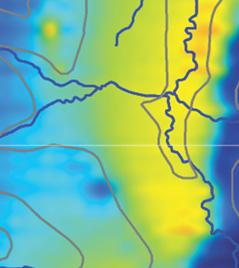
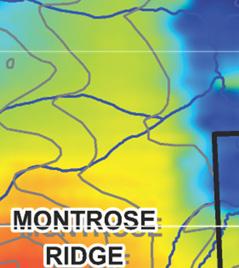
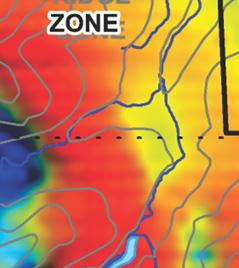
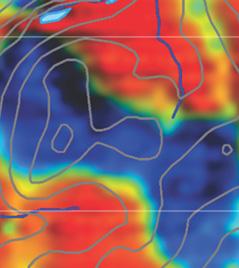
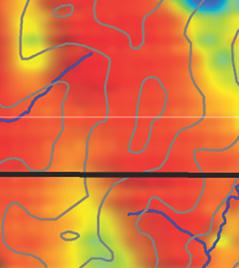
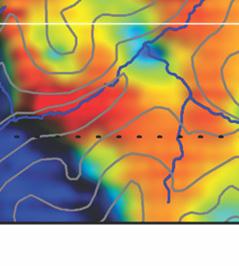
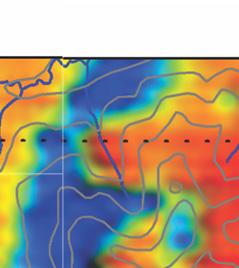
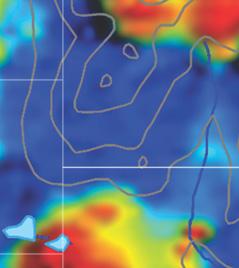
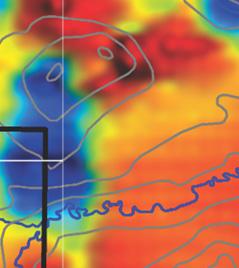
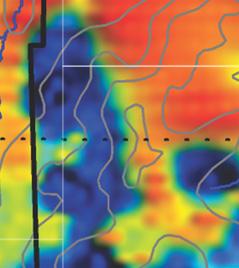
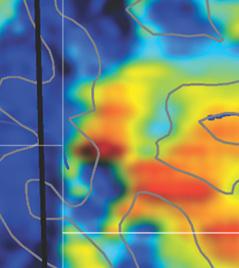
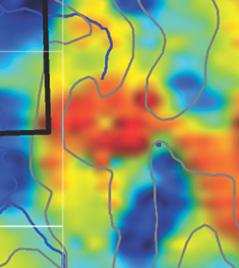
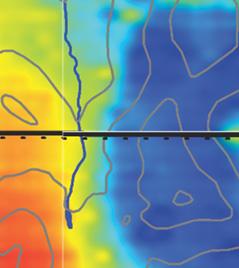
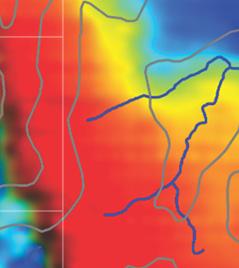
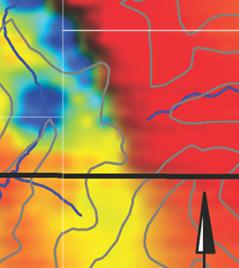
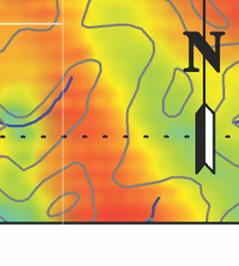
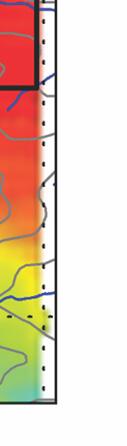
66 Technnical Report on the Hyland Gold d Project, Yukon Territory, Canaada Figu ure 9.6: Tottal Field Airrborne Mag gnetic Map 61
67 (=shallow sourced) N-S trending AMag and GMag highs and lows are visible. They are superimposed on the broad low. They most likely reflect local pockets of pyrrhotite (but magnetite cannot be excluded) deposited along faults by mineralizing fluids. Pyrrhotite was detected in drill holes along the Camp Zone supporting this interpretation. These shallow magnetic features are not seen over the Main Zone, although that may be a result of deeper levels of oxidation there. The ground geophysical results can be divided in to two parts. Only the northern portion of the Main Zone is covered with IP/Res surveys. The IP data over the Main Zone shows surprisingly low values of less than 20 msec. This value means that chargeable material (sulphide minerals, graphite etc.) is present in low quantity (~1%). The general background for the whole grid is ~25 msec. Resistivity values are also non-anomalous in the ohm range. There are no VLF-EM or AEM conductors mapped over the Main Zone. The resistivity values calculated from the 7200Hz AEM data over the Main Zone are in the ohmm range. The GRes and ARes values show different ranges as they are calculated differently. They have to be compared within their individual data sets. It is concluded that the Main Zone does not show an obvious anomalous geophysical signature, although again that may be due to deeper levels of sulphide mineral oxidation there. The area directly to the north of the Main Zone shows a completely different geophysical character. Narrow somewhat en-echelon IP highs with amplitudes of >50 msec coincide or are en-echelon with VLF-EM conductors and short-waved magnetic responses. This zone contains also the best AEM conductor from the Dighem survey. The Ternary Radiometric map shows also a weak change compared with the areas immediately to the west and east. Holes DDH HY to 07 were drilled in this area. These holes intersected higher concentrations of sulphide minerals than the holes in the Main Zone. These are most likely semi-massive to massive (py + po) zones of replacement and may explain the location of the conductors along anastomosing fault strands in the QLL. The axis of the geophysical anomalies north of the Main Zone are oriented ~N5ºW. These axes do not project though the Main Zone. It is therefore possible or most likely that the Main Zone and the area to the north represent two separate mineralizing events possibly originating from the same deep source. The two zones appear slightly offset along an ~NW SE structure roughly coinciding with the 500 ohmm GRes contour visible directly north of DDH HY The large area of GRes low (<500 ohmm) extends to the west of the North Zone and correlates with a large portion of the center of the large AMag low. It is important to note that the trend of the geophysical anomalies cuts obliquely across the geology as seen on detailed maps. The ARes map shows a low (<100 ohm) correlating with the large GRes low directly west of the anomalous area north of the Main Zone. The Main Zone, as mentioned, displays elevated ARes values. A structural zone that is outlined by a contrast in resistivity values along its east side can be followed southward to ~6,706,000N and possibly along the east side of the Cuz Zone and further south. The Cuz Zone does not show any conductive responses in the AEM data, rather it displays high ARes values of ~6,000ohmm. An area in the southeast part of the IP/Res grid (~6,708,500N, ~564,000E) shows elevated values up to 50 msec; it is open to the south. A VLF-EM conductor projects in to it together with a weak N-S trending AEM conductor. The northern tip of a strong linear Mag high coincides with the SE-most peak of the high IP zone. Main Quartzite unit, a brittle lithology that shows open fractures and dilatant zones, underlies it. The IP values further to the north over the same unit are not as high. Gold geochemical values over it are 25 ppb or less but directly to the south, where there is no IP/Res coverage, numerous high Au values are recorded. This area is of interest because is possible that the IP high reflects hydrothermal sulphides and Au further to the south rather than graphite or primary sulphides. 62
68 In October 2010 Frontier Geosciences carried out a Transient Electromagnetic (TEM) survey. The purpose of the survey was to evaluate potential for massive to semi-massive sulphide mineralization at depth beneath and to the north of the Main Zone. The survey consisted of a single ~1,000 m by 500 m loop surveyed from five 1km long traverses with readings taken every 25m. Results of the survey indicate that there are no shallow conductors beneath the Main Zone, possibly reflecting the depth of oxidation and/or lack of interconnectivity of sulphide minerals. The geophysical survey indicates that a steep dipping conductive plate strikes ~009 o and is buried 150 m below the surface. The data set was not conducive to modeling the thickness or conductivity. In July 2011 Abitibi Geophysics carried out a Time Domain Electromagnetic (TDEM) survey. The purpose of the survey was to evaluate potential for massive to semi-massive sulphide mineralization at depth beneath and to the south of the Main Zone. The survey consisted of a ~1,800 m by 1,600 m loop surveyed from eight 1.5 km long traverses with readings taken every 25 and 50m. An In-Loop survey of four 1 km long traverses had readings taken every with 25 m and 50 m. TDEM anomalies w e r e detected over the survey grid at the south end of the Main Zone. Th e s e anomalies are considered as moderate conductors with response typical of disseminated sulphide type mineralization. Two anomalies are identified at the southern end of the TDEM survey and remain open to expansion further south. An IP survey to help detect sulphide mineralization associated with gold was recommended (Dubois, 2011). 9.4 Mechanized Trenching All bulldozer trenching on the property was carried out over the Main Zone in 1988 by E. Caron Diamond Drilling Ltd. of Whitehorse with a ripper-equipped Caterpillar D7E bulldozer. A total of 2,760 lineal metres of bedrock was exposed in 16 trenches, and 1,515 m 3 of overburden was stripped from trenches that did not reach bedrock. Bulldozer trenches were cut across the Main Zone geochemical anomaly at approximately 100 m intervals over a 2,000 m strike length and across a few of the secondary anomalies. Parts of trenches that reached bedrock were continuously chip sampled along their floor or lower ribs. Samples were taken over 5 to 10 m intervals from all potentially mineralized exposures, except in particularly complex areas where the intervals were shortened as required. Four hundred and thirty, 5 to 10 kg samples were collected and sent to Chemex Labs Ltd. (now ALS Laboratory Group) where they were dried, crushed, ring pulverized, screened to -140 mesh and homogenized before a one assay ton split was taken and fire assayed for gold using a gravimetric finish. In addition to the rocks, 170 soil samples were collected along the bottom of trenches that did not reach bedrock in order to compare the geochemical response deep in the soil profile to that at surface. They were also sent to Chemex and analyzed for gold by the same geochemical technique outlined above for the 1986 soil geochemical surveys. Trench locations within the Main Zone are illustrated in Figure 5.1 and significant results reported in Table 9-2. It is important to note that even within the Main Zone, many of the trenches did not reach bedrock along their entire lengths. Trenches cut through the Main Zone outlined a mineralized fault breccia complex approximately 1,000 m long by 200 m wide. The best trench exposure chip samples averaged 4.87 g/t gold over 30 m including 6.55 g/t over 20 m from trench P-36 near the centre of the complex. This particular interval coincides with a north-trending fault and consists of moderately graphitic gouge. Farther west in the same trench, seventeen chip samples taken over an 88 m width returned a weighted average of 0.81 g/t Au from an area cut by three large faults. To the east where overburden tended to be deeper, three chip samples averaged 1.84 g/t Au over 16 m. True thickness of the mineralized intervals is difficult to determine as the sampling is across the core of an interpreted antiform and true thickness could vary from sample to sample. 63
69 Table 9-2 Hyland Gold Project Selected Main Zone Trenching Results Trench Interval (m) Width (m) Gold (g/t) includes and includes includes X includes includes includes and includes ~120.0* includes 107.5~112.0* includes and The 2015 Hyland Program represented the first ever heavy equipment supported exploration program Banyan has undertaken on the Project, and the first time since the early 1990 s excavators and bulldozers were utilized on the Property. The successful March 2015 winter road mobilization of a D-6 Cat and PCS200 Excavator 64
70 greatly enhanced the 2015 program by affording access construction (3.2 km) and targeted trench-based sampling (700m) of the Montrose Ridge Anomaly. Access road construction and trenching at the Montrose Zone in 2015 was carried with a PCS200 excavator and D-6 dozer operated by Kluane Drilling. Approximately 700 m of lineal excavation in five trenches was completed along a 380 m strike length of the Montrose Ridge Zone soil geochemical anomaly. In total, 187 channel, chip and grab samples were collected from the 5 trenches and sent for analysis. Trench assay highlights from 2015 include 6 m of 4.4 g/t Au from 0 to 6m in Trench MT-15-01, including 2 m of 13.1 g/t Au from 4 to 6 m. Trench MT also returned 24 m of 0.47 g/t Au from 18 to 42 m, including 6 m of 1.3 g/t Au from 36 to 42 m. Trench MT was 42 m long, however only 30 m were sampled due to overburden conditions from 6m to 18m. Chip and channel samples from other nearby trenches returned anomalous, but less significant values of gold and arsenic. All exploration drill core and trench samples from the 2015 Hyland Gold Project were analyzed at Bureau Veritas Commodities Canada Ltd. (formerly Acme Analytical Laboratories) of Vancouver, B.C. utilizing the MA-200, 45-element analytical package with FA430 Fire Assay with Gravimetric finish for gold on all samples. All core samples were split on-site at Banyan s Hyland Gold exploration camp and shipped to the Laboratory s preparation facility in Whitehorse, YT where samples were sorted and crushed to appropriate particle size (pulp) and representatively split to a smaller size for shipment to the lab s Vancouver analysis facility. A system of standards was implemented in the 2015 exploration program and was monitored as chemical assay data became available DRILLING Drilling on the Hyland property has focused primarily on the Main Zone area. Six distinct historical drilling campaigns have tested the area in 1988, 1990, 1995, 2003, 2005 and Drilling Completed by Previous Operators The 1988 program consisted of diamond drilling over the core of the Main Zone. The 1990 program consisted of reverse circulation drilling over the core of the Main Zone and to the north of it. The 1995 program consisted of diamond drilling to the north of the Main Zone and off axis to the west of the Quartz Lake Lineament (QLL). The 2003 and 2005 core drilling programs focused on Main Zone targets as well as the QLL north and south of the Main Zone. The 2010 and 2011 core drilling campaigns targeted Main Zone mineralization as well as goldarsenic and gold-bismuth soil geochemical anomalies to the east and south of the Main Zone (Figures 5.1 and 10.1). While visiting the property in 2010, one of the authors of an earlier Technical Report (Gray of Armitage and Gray, 2012b) took numerous handheld GPS measurements of the location of marked historical drill collars. This data included 1990 collar locations from the Main Zone and collars from step out drilling to the north. On compilation of the historical data, discrepancies were noticed between the historical drill collar locations and the measured GPS locations. Investigation of possible UTM projection shifts in the data did not resolve the problem. A complete survey of all drill collar and trench locations relative to the grid and UTM coordinates was carried out in 2010 and
71 Diamond Drilling Four diamond drill holes totaling m were drilled in 1988 by E. Caron Diamond Drilling Ltd. of Whitehorse (Dennett and Eaton, 1988). A unitized Longyear 38 drill was used and all holes were completed with either HQ or NQ equipment. Results from this program were severely hampered by recovery problems, particularly in strongly oxidized breccia and gouge zones that contain extremely hard, quartzite fragments in a soft limonite or clay matrix. Recovery in the top 40 m to 70 m of the holes was often as low as 1 or 2% and averaged about 20%. Most of the core that was recovered consisted of barren quartzite pebbles without any of the potentially mineralized breccia matrix. Heavy bentonite mud mixtures were used in all holes in an attempt to improve core recovery and build up the walls of the holes. Unfortunately, the clays and limonite that made up the mineralized matrix were suspended in the mud and would not settle out in sludge samples. The core was logged and mineralized intervals were split and sent to Chemex where they were dried, crushed, ring pulverized, screened to -140 mesh and homogenized before a one assay ton split was taken and fire assayed for gold using a gravimetric finish. Several of the most promising intervals were not sampled because recovery was less than five percent. The remaining core was stored on the property. All holes were located within the central fault-breccia complex, testing beneath some of the better trench intersections. Results are briefly described below. Hole 88-1 tested down dip from a fault zone in Trench P-25 that assayed 2.25 g/t Au over 22.7 m. The hole cut a mixture of quartzites and phyllites that are well fractured and in places strongly sheared and brecciated. Recovery ranged from 0 to 100% but was generally less than 10% in sheared or brecciated intervals. The rocks are well oxidized to 45 m. The best assay was 2.19 g/t Au over 3.0 m from a highly pyritic horizon occurring near the bottom of the hole. Holes 88-2 and 88-3 were drilled in opposite directions from the same collar and explored beneath well mineralized intervals in Trench P-23. The upper half of Hole 88-2 cut a series of broad faults while the bottom half intersected fairly massive phyllite, siderite and limestone. The top half is totally oxidized and recovery averaged only about 10%. Most of the material recovered consists of rounded, barren quartzite fragments. The best intersection from the hole was 3 m of 0.96 g/t Au compared 1.93 g/t Au over 45 m in the overlying trench. Hole 88-3 appears to have been drilled down the bedrock dip. Recovery was generally better than that obtained in Hole 88-2 but in two 12 m intervals no core was recovered. The rocks are a mixture of phyllite and quartzite and the base of oxidation is at 64 m. None of the assays from this hole exceeded 0.70 g/t Au even though the trench directly above it averaged 1.50 g/t Au over 52.3 m Hole 88-4 was drilled beneath Trench P-25 at the north end of the central fault-breccia complex. The highest assay (1.17 g/t Au over 3 m) came from a quartz and pyrite rich band located 65 m down dip of a 5 m interval in the trench that assayed 2.23 g/t Au. The apparent dip of this zone is about 80 o toward the west. 66
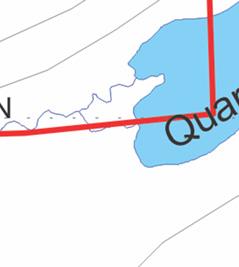
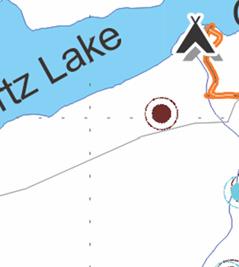
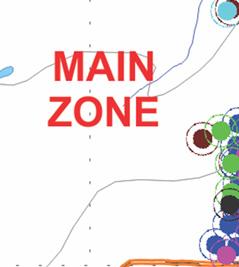
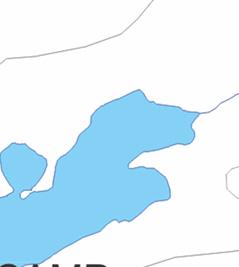
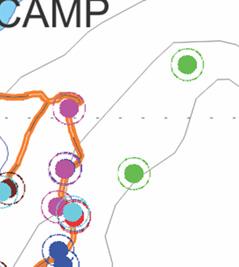
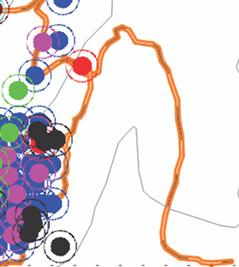
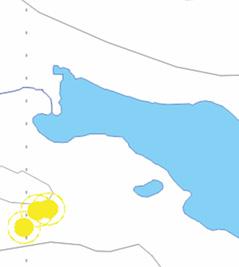
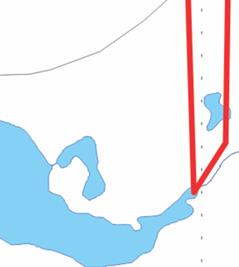
72 Technnical Report on the Hyland Gold d Project, Yukon Territory, Canaada ure 10.1: Drrilling Compilation Ma ap Figu 67
73 Reverse Circulation (RC) Percussion Drilling A total of 3,656 m in forty-one reverse circulation (RC) holes were drilled during the 1990 field season. Thirtyfive holes were drilled on 100 m sections over the core of the Main Zone, while six second phase holes were wide spaced step-outs drilled to the north of the Main Zone, testing for extensions of mineralization. All work was carried out by E. Caron Diamond Drilling Ltd. of Whitehorse using a truck-mounted rotary percussion drill. Reverse circulation with a down-hole hammer was most often used; however conventional circulation was used to aid recovery in badly broken ground. Select drill intersections from the Main Zone deposit included 2.65 g/t gold over 16.7 m in PDH90-09 and 1.19 g/t gold over m in PDH Select intersections from step out drilling to the north averaged 1.0 g/t gold over 13.7 m in PDH90-34 and 0.9 g/t gold over 33.6 m in PDH90-34 (Table 10.1) and 2005 Diamond Drilling Programs During the summer of 2003 StrataGold conducted two phases of diamond drilling totaling 2416 m, to better understand and define the extension of the QLL. This structural feature appears to trend for at least 13 km and contains a 3.2 km long area of anomalous gold, arsenic and bismuth revealed by soil geochemical survey results. A 2004 exploration program included eight diamond drill holes totaling 1,800 m. In 2005, exploration work consisted of four diamond drill holes totaling 985 m, one which followed up on an IP/res geophysical target defined in 2004 east of the Main Zone, as well as targeting soil geochemical anomalies in the Cuz Zone that are coincident with apparent structural features four km south of the Main Zone. Significant intercepts from the historic drilling programs at the Main Zone are listed in Table


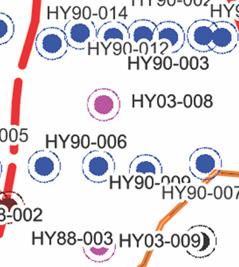
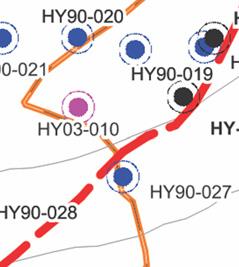
74 Figure 10.2: Main Zone and Camp Zone Drilling Compilation Map 69
75 Table 10.1 Summary of Significant Main Zone Drill Intersections ( ) Hole From(m) To (m) Width (m) Au (g/t) PDH90-01* PDH (EOH) PDH PDH PDH PDH PDH PDH includes (EOH) PDH PDH (EOH) PDH PDH PDH
76 Hole From(m) To (m) Width (m) Au (g/t) PDH PDH PDH PDH PDH PDH PDH PDH PDH PDH PDH PDH PDH PDH PDH PDH (EOH) PDH PDH (EOH) PDH
77 Hole From(m) To (m) Width (m) Au (g/t) (EOH) PDH PDH DDH DDH HY HY HY HY HY HY HY HY HY HY HY HY HY HY HY HY HY HY HY HY HY HY HY HY HY * PDH holes are reverse circulation percussion drill holes, all others are diamond drill holes 72
78 and 2011 Diamond Drilling Programs Twenty drill holes totaling 3,953 m were completed in 2010 and 2011 by Argus. In 2010 four diamond drilling holes totaling 765 m were drilled in the Main Zone and its northern extension. Apex diamond drilling of Smithers, BC drilled HQ and NQ sized drill core using a heli-supported drill rig. Significant results included HY with 9.13 m of 2.08 g/t gold and g/t silver and Hole HY with m of 1.1 g/t gold and 3.79 g/t silver, extending the Main Zone mineralization to the east. In 2011, 16 diamond drill holes were completed for a total of 3,218 m of NQ and HQ drilling targeted the Main Zone deposit, and soil anomalies to the south and east of the Main Zone and one vein hosted target south of the Cuz Zone. Candrill Global Ltd. of Tisdale Saskatchewan executed the program with a A5 skid mounted drill rig. As in previous drill programs, recovery was difficult in the upper oxide zone, however through effective control of drill torque and water pressure, as well as reduced core increased core retrieval cycles there was a noticeable increase in recovery and competence of core material. Significant results included HY-11-29, 39.4 m of 0.80 g/t gold and 3.28 g/t silver from 71.6 m to m depth, HY-11-31, 42.2 m of 0.78 g/t gold and 2.38 g/t silver from m to m depth, including 9.2 m of 1.79 g/t gold and 0.36 g/t silver from m to m depth and HY-11-30, 1.5 m of 1.56 g/t gold from 75.0 to 76.5 m (a zone of no recovery of 7.5 m and then 3 m of 0.33g/t gold and 11g/t silver). HY intersected 25.9 m grading 2.03 g/t gold and 6.42 g/t silver from to m within m grading 0.54 g/t gold and 2.84 g/t silver from 3.0 to m, including 1.5 m of 11.7 g/t gold and 20.1 g/t silver at m which extends Main Zone mineralization to depth and to the east. HY intersected 17.7 m grading 1.0 g/t gold and 8.0 g/t silver from 99.3 to 117 m which extends Main Zone mineralization to the east. HY-11-42, 21.0 m returned 1.1 g/t gold and 15.0 g/t silver from 48 to 69 m within 45 m of 0.65 g/t gold and 7.8 g/t silver from 24 to 69 m which extends Main Zone mineralization to the east. DDH HY intersected 4.5 m grading 1.93 g/t gold from 25.9 to 30.4 m and 4.5 m grading 0.65 g/t gold from 10.5 m to 15 m in the Cuz Zone discovery hole. Drill hole HY intersected 6 m grading 1.38 g/t gold from 9.0 to 15.0 m and 1.5 m grading 1.52 g/t gold from m to 27.0 m 80m northwest of discovery hole HY Drill hole HY with 3.6 m grading 1.12 g/t gold from 16.4 to 20.0 m is located 240 m northwest of discovery hole HY These three drill holed extend Cuz Zone mineralization over 240 m of east-west strike coincident with a previously defined arsenic soil geochemical anomaly Diamond Drilling Completed by Banyan Gold Corp. During 2015 Banyan carried out 740 metres of HQ and ND diamond drilling in three holes within the Camp Zone. Minor amounts of carbonate-hosted pyrite, arsenopyrite, pyrrhotite, sphalerite, galena, bismuthinite and native copper were intersected (Banyan Gold Corp, 2015). Results from the drill program of the 2015 Hyland Gold exploration program include: Drill hole HY-15-45: m of 0.4 g/t gold from 2.45 to m including m of 0.62 g/t gold from 2.45 to m. Elevated base metals were encountered at depth in this hole, beyond a fault zone, including a 1.14m interval that returned 870 ppm copper complete with an over limits (>200 g/t) silver analysis, 73
79 Drill hole HY-15-46: m of 0.32 g/t gold from to m including m of 0.41 g/t gold from to m and 35.9m of 0.36 g/t gold from to m. Drill hole HY-15-47: 88.7 m of 0.24 g/t gold from to m which includes intervals of m of 0.33 g/t Au from to m and m of 0.37 g/t Au from to m. Hole HY also intercepted an anomalously high interval of 2000 ppm lead from 94.7 to m. This lead grade requires further definition as three of the intervals (5.23 m of the total interval) returned >10,000 ppm lead and require over limits analyses to more accurately define the grades. Over limits zinc assays were reported from these intervals as well SAMPLE PREPARATION, ANALYSES AND SECURITY 11.1 Surface Soil and Rock Sampling Carne and Halleran (1986) document the collection, transportation and analysis of samples collected in early exploration programs. Samples were packaged in 20 kg lots in sealed rice bags that were transported to Whitehorse under continuous chain of custody by Archer Cathro employees. They were then shipped by air or truck to Chemex Labs Ltd. (Chemex) in North Vancouver (now ALS Laboratory Group) for analysis. Much of the current central project area was geochemically surveyed in 1973, 1974 and 1975 during base metal exploration programs. At that time arsenic analyses were carried by Atomic Absorption Spectroscopy (AAS) out on -80 mesh fractions of soil and silt samples digested in nitric-perchloric acid. Pulps from these analyses were retained by Archer Cathro and in 1984, following the staking of the Piglet 1-32 claims, these were reanalyzed for gold by Fire Assay preconcentration for Neutron Activation Analysis (FA-NAA). Soil samples collected on the Quiver claims in 1982 were analyzed for gold by FA-NAA on -35 mesh fractions of the samples. Samples were later reanalyzed for arsenic, bismuth, lead, copper, tungsten and manganese by Induced Couple Plasma (ICP) technique and for antimony using AAS. Soil samples collected on the Piglet claims in the current main Zone area in 1984 were screened to -35 mesh, pulverized to better than -100 mesh and analyzed by FA-NAA for gold. This procedure was utilized to minimize the anticipated effect of silica encapsulation of micron-sized gold in detrital material. Rock samples were crushed and pulverized to -100 mesh and analyzed for gold by the same method. Over 2000 soil samples were collected in 1986 over a 3.3 square km area in the central part of the Project area. These samples form the basis of the current geochemical data set. They were analyzed for gold by the same method as the 1984 samples. Every second sample also underwent 30 element analysis by the ICP method. Soil geochemical sampling in 1987 was confined to a restricted area south of the previous grid sampling over the Main Zone. A total of 164 samples were collected and sipped to Chemex in North Vancouver where they were dried, screened to -35 mesh, pulverized to -140 mesh and analyzed for gold using FA-NAA. No analyses were done for other elements (Dennett and Eaton, 1987). Grid soil sampling in 1999 focussed on the area south and east of the Cuz Zone and north of the Main Zone on the north side of Quartz Lake where the Quartz Lake Lineament passes into a low lying swampy area. A total of 269 samples were collected and sent to Chemex in North Vancouver for analysis. They were dried, sieved to - 35 mesh, pulverized to -150 mesh and analyzed for gold using FA-NAA followed by 32 element ICP analysis 74
80 (Gish, 2000). Soil sampling in 2001 was carried out over widespread, untested areas of the Project. Treatment and analyses and of the samples were the same as in 1999 (Carne, 2002). In 2013, soil samples collected in the field were sealed at the sample point with sample numbers written on the kraft sample bags and a 3 part tag was inserted into each sample bag at the sample site (Gray, 2014a) The samples were then placed into sealed rice bags which were then shipped via float plane to Watson Lake and then by truck to the Acme Analytical Labs preparation facility in Whitehorse, Yukon. There the samples were sorted and crushed to an appropriate particle size (pulp) and representatively split to a smaller size that was shipped to Acme's Vancouver analysis facility, an ISO 9001:2008 certified, independent laboratory, utilizing a 1DX ICP 30 element analytical package with G6 Fire Assay finish for gold on all samples. In 2014 Banyan collected and shipped 491 samples (452 soils and 39 rocks) from the soil grid sampling program south of the Cuz showing on Montrose Ridge. All samples were sent for analyses to AGAT Labs in Whitehorse, YT where they were prepped and subsequently analyzed for 50 element ICP assay with a 30g Fire Assay finish. (Gray, 2014b). A systematic, portable XRF analysis soil sampling program was conducted in the field on the Montrose Ridge gold and arsenic-in-soils anomaly. This grid-based soil sampling program was conducted to confirm XRF analyses effectiveness as well as in-fill and extend the Montrose Ridge geochemical anomaly. It was determined that the XRF analyses of Montrose soil samples reported comparable arsenic-in-soils results to the 2013 and 2014 geochemical analyses; and additionally that bismuth was a highly applicable pathfinder element for the Montrose Ridge gold-in-soils anomaly (Gray 2015) Diamond Drill Core and 2011 Diamond Drilling Programs Results of the 2010 and 2011 diamond drilling programs were used to calculate the mineral resource for the Main Zone. Sample preparation, analyses and security for earlier programs were not routinely detailed in reports of historical work and they are not summarized here. Core sampling on the Hyland Gold Project was supervised by Gray from July 2010 through October The authors of this report have determined and are confident that adequate sample preparation, analyses and security procedures for drill core handling on the Hyland Gold Project in 2010 and 2011 were all performed in accordance with industry standards. Core was geologically logged on-site. Rock Quality Designation (RQD) was measured in accordance to ASTM D standard, by measuring all recovered core greater than or equal to 10 cm in length. Percentage core recovery was measured, and all drill core was photographed after being marked-out for sampling but prior to splitting. Core recovery is variable with higher loss in oxide horizons which means that the core sample assay results may under represent the gold and silver content of the sampled intervals. The core within each sample interval was split in half lengthwise using a Longyear wheel-type core splitter. The selected intervals generally included all intervals containing significant (greater than 5%) quartz and/or carbonate veining, visible sulphides, and altered rocks for several metres on either side of the main vein intervals. Vein material was generally sampled in one metre intervals, with variations to allow for the occurrence of major structures or lithologic contacts. Wallrock samples outside of the vein zones were sometimes sampled over lengths of up to 1.5 metres. Pre-numbered assay tags were inserted into the sample bags with the core sample, and a matching assay tag was stapled onto the core box, at the top of the sample interval. The remaining half core was kept for reference, in the core box, which is stored in camp at the Hyland Gold Project. 75
81 The samples were sealed into standard heavy poly plastic bags and then placed into sealed rice sacks which were then shipped via float plane to Watson Lake and then by truck to the ACME Analytical Labs preparation facility in Whitehorse Yukon. At the Acme Analytical Labs preparation facility in Whitehorse samples were sorted and crushed to appropriate particle size (pulp) and representatively split to a smaller size shipped to Acme's Vancouver analysis facility. Assays were performed at the Vancouver, British Columbia facility of AcmeLabs, an ISO 9001:2008 certified, independent laboratory, utilizing a 1EX ICP 44-element analytical package with G6 Fire Assay finish for gold on all samples with g/t 10 ppm Fire Assay 30g AA Finish (Automatic gravimetric over limits analyses) Diamond Drilling Program All exploration drill core samples from the 2015 Hyland Gold Project were analyzed at Bureau Veritas Commodities Canada Ltd. formerly Acme Analytical Laboratories) of Vancouver, B.C. utilizing the MA-200, 45-element analytical package with FA430 Fire Assay with Gravimetric finish for gold on all samples. All core samples were split on-site at Banyan s Hyland Gold exploration camp and shipped to the Laboratory s preparation facility in Whitehorse, YT where samples were sorted and crushed to appropriate particle size (pulp) and representatively split to a smaller size for shipment to the lab s Vancouver analysis facility. A system of standards was implemented in the 2015 exploration program and was monitored as chemical assay data became available (Banyan Gold, 2015) Reverse Circulation Drill Cuttings Recovery reported by Sax and Carne (1990) was estimated by the relative volume of sample collected. In general, they estimated that recoveries were much better than those from the diamond drilling from the 1988 program, averaging roughly 80%. However, re-analysis of the data by Armitage and Gray (2012b) indicates that recoveries greater than 100% were not uncommon, indicating erosion of the hole wall and contamination of samples. A recalculation of the interval-weighted recoveries as recorded in the drill logs gives an overall recovery of 64%. Recalculating with intervals with recovery greater than 100% set to 100% gives an overall average recovery of 60%. This poorer number also agrees with the opinions of Carne (2000) who remarked that the RC program did not successfully test the tenor of gold mineralization at the Main Zone. In holes where recovery was difficult, foam was injected to help float the cuttings. Cuttings were removed using compressed air so that water encountered in the holes was ejected with the cuttings. The leached and oxidized parts of the zone are typically dry and the top of the water table approximately coincides with the upper part of the sulphide zone. Excessive water pressure was encountered in many of the deep holes, especially the step-out holes to the north. High hydrostatic pressure offsets downward force on the bit by lifting the drill string. Since the down-hole hammer system relies on cutting face pressure to trigger the hammer, rate of advance in artesian holes was reduced to the point where the drilling was frequently abandoned short of the target depth. Samples were sent to Chemex Labs Ltd., (now ALS Laboratory Group) North Vancouver for assay where they were dried, crushed, split and pulverized to -150 mesh. A ten gram split was analyzed by fire assay collection with atomic absorption finish with results reported in ppb or g/t. Results above 10,000 ppb were reanalyzed with results reported in ounces per ton. 76
82 12.0 DATA VERIFICATION 12.1 Quality Assurance and Quality Control (QA/QC) Programs Soil and rock geochemical sampling programs carried out from the early 1970 s to 2001 in the current Project area were conducted and supervised by Archer Cathro. Duplicate samples were not introduced in the sample stream, nor were blanks and standards used. There was no data verification with rigorous statistical analysis of the data sets. The diamond drill program carried out in 1988 over the Main Zone was supervised by Archer Cathro. Duplicate samples were not introduced in the sample stream, nor were blanks and standards used. There was no data verification with rigorous statistical analysis of the data sets. During the 1990 RC drilling program duplicate samples were collected and analyzed to test the reliability of the sample splitting process. With few exceptions, duplicate sample assay variability was found to be within 10% of the original split. Dust samples from the cyclone exhaust were collected and analyzed for gold but results did not indicate much variation from analysis of chip samples from the same intervals. There were no blanks or standards used to verify the laboratory results. A rigorous quality assurance/quality control program was initiated for the Hyland drill programs. A target goal of a minimum of 5% company duplicate/ check assay sample program in excess of within assay laboratory duplicates was initiated to provide good control of the quality of gold assay data being reported for the project. Generally, every 20 th sample in the sample stream was selected as a primary duplicate. This sample consists of half core, cut or split, and is identified on the assay submittal sheet for duplicate and check assay work. Two analytical duplicate fire assays are performed from pulps at the primary assay laboratory (ALS Chemex) while the coarse reject of this sample is shipped to the check assay lab (ACME Analytical) for a complete check duplicate by fire assay. A 5% blind field duplicate is also submitted to the primary assay laboratory and consists of a quartering of the remaining half core of the primary duplicate sample. Routine duplicate and blank samples were also inserted into the core sample stream from the Hyland Gold Project in 2010 and These sampling protocols were included in drill core sampling, rock sampling, soil sampling and stream sediment sampling. In specific, every 20 samples saw an alternating insertion of known certified standards, certified blanks and field duplicate core samples (half bag split), respectively. These insertions were compounded with requests for Acme to insert AML Standards which had previously been delivered to them, one in each job number as well as instructions on systematic crusher duplicate at the prep lab stage. Performance of the low grade gold standard CRM GS P7B was generally good (Figure 12.1) although there were two significant failures, as defined by values more than 3 standard deviations either above or below the calculated mean for the CRM (i.e. the expected value). The performance of silver by aqua regia digestion was similar, with one clear failure and several samples just outside the 3 standard deviation limits (Figure 12.2). The fire assay Au results for intermediate grade gold standard CRM 1P5D are generally acceptable, with most analyses lying within 2 standard deviations of the expected value (Figure 12.3). However, two samples suggest an unacceptable positive bias in the data, with two consecutive samples greater than 2 standard deviations above the calculated mean. 77

. Figure 12.")
83 The high grade gold standard CRM 5F also showss several quality assurance failures (Figure 12.4) with twoo samples greater than 3 standard deviations above and below the calculated mean (expected value). Figure 12.1: Performance Summary for Gold by Fire Assayy of Standard CDN GS P7B 78


84 Figure 12.2: Performance Summary for Silver by Aqua Regia Digestion of Standard CDN GS P7B Figure 12.3: Performance Summary for Gold by Fire Assayy of Standard CDN GS 1P5D 79
 ), but this remains within an order of magnitude of the 0..005 ppm lower limit of detection and is not considered to be significant.")
 have reviewed the blank sample results and determined that no contaminationn within the laboratory is indicated by them.")

 considered that, despite a mildd levell of field or laboratory contaminatio on indicated by analysis of the blank samples, the analyticall results weree considered reasonably accurate at")
85 Figure 12.4: Performance Summary for Gold by Fire Assayy of Standard CDN GS 5F The performance of 37 samples of the pulp blank CDN BL 9 suggest one possible instance of goldd contamination (Figure 12.5) ), but this remains within an order of magnitude of the ppm lower limit of detection and is not considered to be significant. Armitage and Gray (2012b) have reviewed the duplicate sample results and determined that variation betweenn them is not significant. Armitage and Gray (2012b) have reviewed the blank sample results and determined that no contaminationn within the laboratory is indicated by them. The 2010 drilling program did not insert standardss into the sample stream, relying on the routine laboratoryy standards program. Blanks were inserted into the sample stream in the field to determine whether or not samplee contamination occurred after collection. Duplicate samples were collected with the sawn half of the coree quartered and both quarter samples submitted as field duplicates. Black (2011) considered that, despite a mildd levell of field or laboratory contaminatio on indicated by analysis of the blank samples, the analyticall results weree considered reasonably accurate at the concentrations of interest for gold, silver and accompanying low levels of base and indicator metals in the mineralized intersections. Fieldd duplicate analyses suggested acceptable levels of precision and reproducibility, with variation likely due to heterogeneity of the mineralization. Black (2011) recommended that future drilling programs should consider using laboratory inserted duplicates of preparedd samples to ensure that assay pulps are representativee of the submitted sample. All exploration drill core and trench samples from the 2015 Hyland Gold Project were analyzed at Bureauu Veritas Commodities Canada Ltd. (formerly Acme Analytical Laboratories) of Vancouver, B.C. utilizing thee MA-200samples. All core samples were split on-site at Banyan s Hyland Gold exploration camp and shipped to thee Laboratory s preparation facility in Whitehorse, YT where samples weree sorted and crushed to appropriatee 45-element analytical package with FA430 Fire Assay with Gravimetric finish for gold on all 80
86 particle size (pulp) and representatively split to a smaller sizee for shipment to the lab s Vancouver analysis facility. A system of standards was implemented in the 2015 exploration program and was monitored as chemical assay data became available. The authors are confident that the data from drilling on the Hyland Gold Project has been obtained inn accordance with contemporary industry standards, and that the data is adequate for the calculation of an inferredd mineral resource, in compliance with National Instrument Figure 12.5: Summary of Gold Fire Assay Data for Pulp Blanks Inserted in Drill Core sample Streams 13.0 MINERAL PROCESSING AND METALLURGICAL TESTING In 1989, 72 hour bottle roll cyanidation tests were conducted onn three assay lab coarse reject composite samples (> 38 um) from the 1988 bulldozer trench sampling program of f oxidized mineralizationn in the Main Zone. Thee work, conductedd by Coastech Research Inc. (Coastech, 1989), reported that 24 hour leach residence time was sufficient for gold recovery of over 95% and concluded that the relatively coarse particle size of the samples indicated that the mineralization is amenable to either vat or heap leaching (Table 13.1). Cyanide and limee consumption were low. Table Bottle Roll Test Results Sample O665 S5739 S609 Calculated Head Grade Au (g/t) % Au Recoveryy NaCN Consumption (kg/t) CaO Consumptionn (kg/t)
87 As part of the 1990 RC drill program, there was limited testing of cold cyanide gold extraction carried out on twenty five selected samples (Sax and Carne, 1990). Depth of the samples in the vertical RC holes ranged from 1.5 m to 150 m. Gold content of the samples, determined by fire assay, ranges from 0.3 to 5.1 g/t. Samples were selected to be representative of the oxide (12 samples), transition (6 samples) and sulphide (7 samples) zones as identified by chip logging. Results are summarized as follows: Average gold recovery of all samples by cold cyanide extraction is 70.2%, Average gold recovery by cold cyanide extraction from oxide samples is 87.5%, Average gold recovery by cold cyanide extraction from transition samples is 87.5%, and Average gold recovery by cold cyanide extraction from sulphide samples is 37.7%. Preliminary microscopy work (Mauser-Steinman, 2011) indicates that gold in unoxidized material is primarily found in fractures and on pyrite grain boundaries and is non-refractory. Gold recovery is independent of grade in the oxide facies, ranging from 70 to 100%. Recovery is also independent of copper grade in the oxide zone, although this does not necessarily mean that copper is not a cyanide consumer (Sax and Carne, 1990). This testing was preliminary in nature and is not a definitive analysis of the cyanide leaching properties of the gold mineralization at the Main Zone deposit MINERAL RESOURCE ESTIMATE 14.1 Introduction The resource estimate is reproduced in whole from Armitage and Gray (2012a) and it represents the first National Instrument ( NI ) resource estimate completed on the Main Zone of the Hyland Gold Project. The resource estimate was initially commissioned by Argus and completed by GeoVector with a report date of March 1, 2012 (filed on SEDAR). Argus reported an Inferred Mineral Resource, at a 0.6 g/t gold equivalent ( AuEq ) of 12,503,994 tonnes containing 361,692 ounces gold at 0.9 g/t and 2,248,948 ounces silver at 5.59 g/t. The resource report was updated for Banyan by Armitage and Gray (2012b). The Inferred Mineral Resource was estimated by Allan Armitage, Ph.D., P. Geol, of GeoVector Management Inc. Armitage is an independent Qualified Person as defined by NI and he remains solely responsible for the content of the resource reporting in Section 14 of this document. Practices consistent with CIM (2005) were applied to the generation of the resource estimate. There are no mineral reserves estimated for the Property at this time. Inverse distance squared interpolation restricted to a single mineralized domain was used to estimate gold and silver grades into the block model. Inferred mineral resources are reported in summary tables in Section 14.9 below, consistent with CIM definitions required by NI
88 14.2 Historical Resource Estimate Sax and Carne (1990) reported that the oxidized core of the Main Zone is estimated to contain a resource of about 3.2 million tonnes grading 1.1 g/t gold. This estimate gives a general indication of the amount of oxidized mineralized material. It is not considered a reliable estimation due to the poor sample recovery from the drilling program. The historical estimation does not use categories stipulated under current National Instrument guidelines, and does not provide categories for the estimation. The estimation of these resources was prepared according to accepted contemporary industry standards using accepted practices and the Authors believe that the work completed has been both thorough and as accurate as possible given the available database Drill File Preparation To complete the resource estimate GeoVector assessed the raw drill core database that was available from drill programs completed between 1988 and 2011 on the Property (Figure 14.1). GeoVector was provided with a database of 92 diamond and reverse circulation ( RC ) drill holes (13,615 meters) with 8,704 assay values collected through This includes 72 historic drill holes (9,662 metres, 2,713 assays) completed from 1988 to 2005, and 20 drill holes (3,953 metres, 5,591 assays) completed in 2010 and 2011 by Argus. The drill hole database included collar locations, down hole survey data, assay data, lithology data and specific gravity ( SG ) data. No resource or geological models were provided to GeoVector. Topographic data from government topographic maps was provided from which a 3D topography surface file was created. The database was checked for typographical errors in assay values and supporting information on source of assay values was completed. Sample overlaps and gapping in intervals were also checked. Gaps in the sampling were assigned a grade value of for gold and 0.01 for silver. In addition, it was noted that samples from the 1988 and 1990 drill programs (2,481 samples) were not analysed for silver. As a result, silver values were calculated for these assay values based on a linear regression curve defined by assay data (6,224 samples) from drill holes for which silver was analyzed. Silver values were calculated for the 1988 and 1990 samples using the formula: Silver = * Gold GeoVector has made the assumption that if silver were analysed in these historic holes, the grades would be consistent with silver grades for samples from more recent drilling. Verifications were also carried out on drill hole locations, down hole surveys, lithology, and topography information. A significant number of drill holes are lacking proper down hole survey information. A number of drill hole elevation values were adjusted based on the topographic surface Resource Modeling and Wireframing For the 2011 resource, a grade control model was built which involved visually interpreting mineralized zones from cross sections using histograms of gold and silver values. Polygons of mineral intersections were made on each cross section and these were wireframed together to create contiguous resource models in Gemcom GEMS 6.3 software. The modeling exercise provided broad controls of the dominant mineralizing direction. The Main Zone resource model (Figure 14.2 and 14.3) defines a shallow north plunging (10 15 ) antiformal structure with shallow to moderate (20 35 ) west dipping limbs (axial plane). The antiform extends for approximately 725 m along strike. The lower limb of the antiform extends and to a depth of up to 250 m. 83

89 Figure 14.1: Isometric View Looking North Showing the Main Zone Drill Hole Distribution and Topography Figure 14.2: Isometric View Looking North Showing the Main Zone Resource Block Model, Drill Hole Distribution and Topography 84

90 Figure 14.3: Isometric View Looking West Showing the Main Zone Resource Block Model, Drill Hole Distribution and Topography 14.5 Composites The average width of drill core samples is 1.48 m, within a range of 0.10 m up to 11.0 m. Of the total assay population 81% were 1.53 metres or less, and only 5% of the assay samples were greater than 2 metres. As a result, 1.50 metre composites were used for the resource. Composites for drill holes were generated starting from the collar of each hole and totalled 9,013. For the resource, a composite population was generated for the mineralized domain and totalled 1,332 (Table 14.1) from 50 drill holes which intersect the resource model. These composite values were used to interpolate grade into the resource model. As discussed above, silver values were calculated for samples from 1988 and 1990 drill holes. Silver values were determined based on a linear regression curve defined by assay data from drill holes for which silver was analyzed. Silver values were calculated for the 1988 and 1990 samples using the formula: Silver = * Gold Based on a statistical analysis of the average grade of silver for all composite values from within the resource model to only those values from drill holes for which silver was analysed, the calculated silver grades had little effect on the overall average grade of silver. 85
91 Table 14.1 Summary of the Drill Hole Composite Data from Within the Main Zone Resource Model Main Zone Composite Values (all drill holes which intersect the resource model) Au (g/t) Ag (g/t) Number of drill holes Number of samples 1,332 1,332 Minimum value Maximum value Mean Median Variance Standard Deviation Coefficient of variation Percentile Main Zone composite values (excluding 1988 and 1990 drill holes) Au (g/t) Ag (g/t) Number of Drill Holes Number of samples Minimum value Maximum value Mean Median Variance Standard Deviation Coefficient of variation Percentile Grade Capping Based on a statistical analysis of the composite database from the resource model (Table 14.1), it was decided that no capping was required on the composite populations to limit high values for gold and silver. Histograms of the data indicate a log normal distribution of the metals with very few outliers within the database. Analysis of the spatial location of these samples and the sample values proximal to them led GeoVector to believe that the high values were legitimate parts of the population and that the impact of including these high composite values uncut would be negligible to the overall resource estimate. 86
92 14.7 Specific Gravity There was limited specific gravity (SG) data available from the Main Zone drill database. Argus had SG analysis completed on 10 mineralized samples from the 2011 drill program. The SG values ranged from 2.84 t/m 3 to 4.38 t/m 3 and averaged 3.35 t/m 3. The average gold grade of the 10 samples is 1.29 g/t. The SG database is limited and may not to be representative of the resource. It was decided that the average of the lower 50% of the SG data be used for the resource estimate. A value of 2.91 t/m 3 was accepted by GeoVector as a reasonable SG value to use for the current resource estimates. The average grade of the 5 samples is 0.60 g/t Au. It was strongly recommended that Banyan begin collecting SG data during the next round of drilling Block Modelling A block model was created for the Main Zone within UTM NAD83 Zone 10 space (Figure 14.4). Block model dimensions are listed in Table Block model size was designed to reflect the spatial distribution of the raw data i.e. the drill hole spacing within each mineralized zone. At this scale of the deposit this still provides a reasonable block size for discerning grade distribution while still being large enough not to mislead when looking at higher cut-off grade distribution within the model. The model was intersected with surface topography to exclude blocks, or portions of blocks, that extend above the bedrock surface. The primary aim of the interpolation was to fill all the blocks within the three resource models with grade. To generate grade within the blocks inverse distance squared (ID 2 ) was used. Grades for gold and silver were interpolated into the blocks by the ID 2 method using a minimum of 2 and maximum of 20 composites to generate block grades in the Inferred category. The size of the search ellipse, in the X, Y, and Z direction, used to interpolate grade into the resource blocks is based on 3D semi-variography analysis of mineralized points within the resource model. For the Main Zone resource the size of the search ellipse was set at 125 x 125 x 50 in the X, Y, Z direction. The Principal azimuth is oriented at 84º, the Principal dip is oriented at 45º and the Intermediate azimuth is oriented at 177. Table 14.2 Block Model Geometry and Search Ellipse Orientation Block Model Main Zone X Y Z Origin (NAD83, Zone 10) Number of Blocks Block Size Rotation 0 Search Type Ellipsoid Principal Azimuth 84 Principal Dip 45 Intermediate Azimuth 177 Anisotropy X

93 Anisotropy Y 125 Anisotropy Z 50 Minimum Samples 2 Maximum Samples 20 Figure 14.4: Isometric View Looking Northwest Showing the Main Zone Resource Block Model, Drill Hole Distribution and Search Ellipse 88


 and on verticall")


94 14.9 Model Validation The total volume of the blocks in the resource model, at a 0 cut-off grade value compared to the volume of thee resource model was essentially identical. The size of the search ellipse and the number of samples used too interpolate grade achieved the desired effect of filling the resource models and very few blocks had zero gradee interpolated into them. Because ID 2 interpolation was used, the drill hole intersection grades would be expected to show goodd correlation with the modelled block grades. A visual check of block grades of gold and silver against thee composite data in 3D (Figures 14.5 and 14.6) and on verticall section showed excellent correlation betweenn block grades and drill intersections. The resource model is considered valid.. Figure 14.5: Isometric View Looking Northwest Showing the Main Zone Gold Resource Blocks 89


.")


95 Figure 14.6: Isometric View Looking Northwest Showing the Main Zone Silver Resource Blocks Resource Classification The Mineral Resource estimate is classified in accordance with the CIM Definition Standards (2005). Based onn the current drill database, it is considered that there is sufficient drill density and confidence in the distributionn of gold and silver within the resource model to classify the Main Zone resource as Inferred. Therefore, all material in the resource estimate is classified as Inferred Resource Reporting The grade and tonnage estimates contained herein are classified as an Inferred Mineral Resourcee given CIMM Definition Standards for Mineral Resources and Mineral Reserves (2005). As such, it is understood that ann Inferred Mineral Resource is that part of a Mineral Resourcee for which quantity and grade or quality can bee estimated on the basis of geological evidence and limited sampling and reasonably assumed, but not verified, geological and grade continuity. The estimate is based on limited information and sampling gathered throughh appropriate techniques from locations such as outcrops, trenches, pits, workings and drill holes. Due to the uncertainty that may be attached to Inferred Minerall Resources, it cannot be assumed that all or anyy part of an Inferred Mineral Resource will be upgraded to an Indicated or Measured Mineral Resource as a result of continued exploration. Confidence in the estimate is insufficient to allow the meaningful application of technical and economic parameters or to enable an evaluation off economic viability worthy of public disclosure. 90
96 GeoVector has estimated a range of Inferred resources at various gold equivalent (AuEq) cut-off grades for the Main Zone (Table 14.3). Using a 0.6 AuEq g/t cut-off, an inferred resource of 12,503,994 tonnes containing 361,692 ounces gold at 0.9 g/t and 2,248,948 ounces silver at 5.59 g/t, equivalent to 396,468 AuEq ounces at 0.99 g/t, has been estimated. Table 14.3 Resource Estimate for the Main Zone Cut-off Grade Tonnes Au Ag AuEq* (AuEq* g/t) Grade Oz Grade Oz Grade Oz (g/t) (g/t) (g/t) <0.1 g/t 20,560, , ,820, , g/t 20,466, , ,818, , g/t 19,972, , ,804, , g/t 18,629, , ,740, , g/t 16,820, , ,619, , g/t 14,734, , ,453, , g/t 12,503, , ,248, , g/t 9,678, , ,988, , g/t 7,038, , ,654, , g/t 5,640, , ,420, , g/t 4,476, , ,147, ,356 * "Gold equivalent" or "AuEq" is based on silver metal content valued at gold value using a $1016 US Au price and a $15.82US Ag price, which approximates the average prices for these metals over the three years previous to the 2012 resource calculation (Armitage and Gray, 2012b) Disclosure At the calculation of the 2012 Resource Estimate, GeoVector (Armitage) was unaware of any environmental, permitting, legal, title, taxation, socio-economic, marketing or political issue that could materially affect the Mineral Resource Estimate. In addition GeoVector was unaware of any mining, metallurgical, infrastructural or other relevant factors that could materially affect the Mineral Resource estimate. The current report authors are also unaware of any subsequent similar factors that could materially affect the 2012 Resource Estimate ADJACENT PROPERTIES 15.1 McMillan Occurrence The McMillan occurrence is located immediately west of the Hyland Gold Project. It was first discovered in 1892 and relocated by K. McMillan, who staked it in October Noranda Exploration Company Ltd. (now Xstrata Nickel Corp.) purchased the property in late 1948 and optioned it in 1949 to New Jersey Zinc Exploration Company Ltd, which hand trenched and drilled 4 diamond drill holes. In 1951 Asarco Exploration Company of Canada Ltd joined the Noranda-New Jersey Zinc joint venture and a new company, Liard River Mining Company Ltd., was formed. Exploration by Liard River between 1951 and 1990 has been episodic, consisting of geochemical surveys, geophysical surveys, bulldozer trenching and diamond drilling in 180 holes totaling about 15,000 m. Other than minor reclamation, little recent work has been carried out. 91
97 The McMillan occurrence is manto-like replacement deposit in the Proterozoic to Lower Cambrian Hyland Group at the sheared contact between carbonate rocks and underlying phyllite (Bremner, 1991). Mineralization includes concordant and discordant types. Concordant mineralization mainly consists of layers of massive sphalerite, galena and carbonate (siderite?) with minor sulphosalt minerals. Discordant mineralization is widespread and consists of quartz-siderite veins and veinlets that cut layering and cleavage (Morin, 1981). The deposit has been described as replacement style or manto mineralization developed by hydrothermal fluids ascending along northerly trending fault zones. Unpublished lead isotope studies carried out at the University of British Columbia suggest a poorly constrained Tertiary age of mineralization (Carne, 1985). Recent geological mapping by Pigage et al (2010) locates the McMillan deposit along the same fault that appears to localize mineralization at the Cuz Zone (Figure 7.1) An historical, unclassified, non-compliant resource of 1.1 million tonnes grading 8.3% zinc, 4.1% lead and 62 g/t silver has been defined for the Main Zone, while the South Zone is listed at 0.4 million tonnes grading 1.7% zinc, 9.3% lead and 214 g/t silver (Yukon MINFILE, 2016) Mel Deposit The Mel deposit is located approximately 12 km east of the Hyland Gold Project (Figure 7.1). Cambrian to Ordovician marine sedimentary rocks and intercalated volcanic rocks host sedimentary-exhalative (SEDEX) zinc-lead-barite mineralization. Stratabound barite-zinc-lead mineralization is laterally extensive within the Cambro-Ordovician Rabbitkettle Fm, but lacks the finely laminated character of typical sedex mineralization; although this may be due to strain-induced recrystallization (Carne, 1976). The Mel property was first staked by prospectors J. Melynchuk and T. Flint in 1967 and it has subsequently been explored by a number of owners and operators, including Newmont Mining Corporation Ltd., Granby Mining Corp., St. Joseph Exploration Ltd. (later Sulpetro Ltd.), Novamin Resources Ltd., Barytex Resources Ltd., Cominco Ltd., and most recently Kobex Minerals Inc. It is now owned by Silver Range Resources Ltd. Exploration activities on the property have included numerous soil geochemical surveys, geophysical surveys (IP, gravity, VLF and magnetics), trenching, diamond drilling, metallurgical test work and several resource estimations. A 1989 prefeasibility study by Sandwell Swan Wooster Inc. concluded that the Mel Main Zone was potentially viable and provided recommendations for further exploration and development (King and Giroux, 2014). To date, a total of 90 diamond drill holes (16,759 m) have been completed on the property. The Mel Main Zone has been systematically drill tested but remains open to depth. The Jeri and Jeri North Zones have received limited, reconnaissance level drilling, and the Mel East Zone is untested by drilling. The main host units are carbonate and clastic sediments that are broadly folded in a north-south trending overturned syncline. This structure has been cut by a number of north and northeast-trending faults. Four, zincrich SEDEX zones have been identified on the Mel property: the Main Mel, Jeri, Jeri North and Mel East Zones. The Mel Main Zone has had the most drilling and it hosts an inferred resource of 5.38 million tonnes grading 6.45% zinc, 1.85% lead and 44.79% barite (BaSO 4 ), at a cut-off grade of 5.0% zinc-equivalent. Mineralization at the Mel Main Zone consists of coarse-grained sphalerite and galena disseminated throughout a mixture of mudstone, silica-carbonate and coarsely crystalline barite. Minor amounts of fine-grained, sparsely 92
98 disseminated pyrite occur locally. The Mel Main Zone is open down dip and has good potential to host a larger zinc-lead resource (King and Giroux, 2014) OTHER RELEVANT DATA AND INFORMATION There is no other relevant data nor additional information or explanation necessary to make this Technical Report comprehensive, understandable and not misleading INTERPRETATION AND CONCLUSIONS The Hyland Gold Project is an advanced exploration stage gold prospect located in the Watson Lake Mining District of southeast Yukon, approximately 74 kilometres northeast of the community of Watson Lake. It consists of 927 claims totaling 18,620 hectares and contains two areas of noteworthy gold mineralization, the Main Zone and the Cuz Zone as well as two other areas of significant exploration interest termed the Camp Zone and the Montrose Ridge Zone. Banyan Gold Corp. has earned a 100% interest in the property subject to various NSR agreements in favour of previous operators. The Project area has been explored for gold and silver intermittently since the 1970 s. Mineral exploration work has included large scale to focused prospecting, hand and mechanized trenching, extensive soil sampling, regional and Property wide stream sediment sampling, multiple geophysical surveys (airborne and ground based), with numerous reverse circulation and diamond drilling campaigns. This work has resulted in the discovery and delineation of the Main Zone gold deposit as well as outlining a series of additional mineralized areas. More recent exploration programs conducted by Argus Metals Corp. and Banyan Gold Corp. from 2010 to 2015 have re-evaluated the geological controls on the known mineralization and resulted in the expansion and definition of the Main Zone gold deposit as well as the discovery of additional bedrock occurrences of gold mineralization at the Cuz and Montrose Ridge Zones. The area of the Hyland Gold Project has been expanded by the staking of additional claims to the south, north, east and west of the original Hyland Gold Project. This staking was done in conjunction with a regional and property wide re-assessment of the available exploration data The Main Zone at the Hyland Gold Project has been calculated to host a Inferred Resource, at a 0.6 g/t gold equivalent ( AuEq ) cutoff, at 12,503,994 tonnes containing 361,692 ounces gold at a grade of 0.9 g/t and 2,248,948 ounces silver at a grade of 5.59 g/t. The results of diamond drilling to date show that the Main Zone is open to expansion in all directions. Historic exploration on the Main Zone was primarily focused on the nearsurface oxide gold resource, while recent drilling campaigns concentrated on delineating the deposit to depth within transition and sulphide mineralization as well as to the east. In the Camp Zone, oxidized to partially oxidized iron carbonate and/or semi-massive to massive sulphide (mostly pyrrhotite with lesser pyrite and arsenopyrite) bodies occur in limestone peripheral to a major zone of faulting for several hundreds of metres north of the Main Zone. Carbonate-hosted pyrite, arsenopyrite, pyrrhotite, sphalerite, galena, bismuthinite and native copper are also present. These are accompanied by a more than one kilometre long gold and arsenic-in-soil anomaly that has been only partly tested by wide-spaced bulldozer trenching, reverse circulation drilling and diamond drilling between 1986 and the present. The 93
99 mineralogical and metallogenic characteristics of the Camp Zone, coupled with its stratigraphic and structurally lower setting than the Main Zone, suggest that it may represent deeper feeder style mineralization. Gold mineralization in bedrock was discovered at the Cuz Zone by diamond drilling in 2011 about 4 km south of the Main Zone. Drilling, in conjunction with historical soil geochemical survey data, has outlined mineralization over a potential 2 km strike length along a southeasterly trend. The Cuz gold mineralization is distinct from the Main Zone gold in that there is a significantly lower silver component than the Main Zone. The mineralogical and metallogenic characteristics of the Cuz Zone, coupled with its higher stratigraphic and structural setting than the Main Zone, suggest that it may represent distal or high-level mineralization. It is possible then that significant gold mineralization may exist at deeper stratigraphic levels in the Cuz Zone area. A significant contribution of the 2013 to 2015 exploration by Banyan Gold Corp. has been the discovery of the Montrose Ridge Zone about 2.5 km south of the Cuz Zone. Follow up of historical steam sediment geochemical anomalies for gold and arsenic have lead to definition of a broad 500 m by 1000 m easterly trending gold-in-soils anomaly (>20 ppb Au). Excavator trenching was carried out in 2015 over the anomalous area. Assay highlights include 6 m of 4.4 g/t Au from 0 to 6m in Trench MT-15-01, including 2 m of 13.1 g/t Au from 4 to 6 m, and 6 m of 1.3 g/t Au from 36 to 42 m. Bedrock was not intersected between 6 and 18 m due to overburden conditions. Chip and channel samples from other nearby trenches returned anomalous, but less significant values of gold and arsenic. The trench sample results at Montrose Ridge have low silver response (<1 g/t) similar to the Cuz Zone and strengthens the interpretation that both Cuz and Montrose represent a separate or higher level mineralized system than the Hyland Gold Main Zone system, where an approximate 1:4 gold-silver ratio exists. The major zones of mineralization on the property are aligned along the Quartz Lake Lineament, a greater than 18 km long zone of faulting, folding and brecciation that has been the locus of a variety of styles of gold mineralization. The Main Zone is classified as a sediment-hosted distal disseminated gold deposit, the best known example of which is the Marigold Mine in the Battle Mountain-Eureka Trend of north-central Nevada. Other areas of gold mineralization on the property bear similarities to carbonate replacement or manto styles of mineralization, similar to recent sediment-hosted gold discoveries at the Rau Trend of central Yukon. In aggregate, the vertically and horizontally extensive areas of known gold mineralization, in conjunction with other less well explored areas of strongly anomalous gold and pathfinder element response, are testament to a strong causative hydrothermal system that gave rise to a district-scale area with high exploration potential for a variety of sediment-hosted gold exploration targets types. Because of extensive vegetation and glacial overburden cover, much of the area of remaining high exploration potential on the Hyland Gold Project has only been tested by wide-spaced soil sampling, if at all RECOMMENDATIONS The Hyland Gold Project covers a large area of high exploration potential. Sediment-hosted gold mineralization is both stratigraphically and structurally controlled, with gold occurring in a variety of deposit styles along an 18 km long, several hundred metre-wide corridor of faulting, folding and brecciation termed the Quartz Lake Lineament (QLL); especially where the QLL is cross-cut by southeast trending normal faults. Historical exploration at the Main Zone culminated with 2010 and 2011 diamond drilling that produced the first
100 compliant resource for the Project. The deposit model for the Inferred Resource remains open for expansion by continued drilling at depth as well as to the north and east. A two-phase exploration program is recommended for the Hyland Gold Project: Phase I: Pre-field work: Exploration for gold on the Project has been carried out by numerous operators since the early 1980 s. There is a large amount of geological mapping, geochemical and geophysical data and drill hole information that cannot be utilized to its fullest extent without integration with specifically acquired multispectral satellite imagery into a GIS based platform. This will enable determination of the physical and geochemical signature of known mineralization and the identification of priority targets for further exploration. 30 day field program: Soil geochemical sampling is the easiest and most efficient way to conduct a first pass evaluation of the gold exploration potential. About 75% of the QLL has been covered by at least wide-spaced soil sample surveys and the remaining 25%, especially at the south end of the property, should also have coverage by transect sample lines at 50 sample spacing by 200 m line spacing. There is little soil sample coverage of recently identified cross faults as well, and they should be sampled with soil geochemical survey traverses along their extent on the property. Geochemically anomalous areas identified south of the Main Zone at the Cuz and Montrose Ridge areas should be explored with excavator trenching as terrain permits, as well as any other targets for follow up in other areas of interest that are identified by the soil sample data set. Attempts at a proper assessment of exploration potential along much of the QLL at lower elevations in the north half of the property have historically been frustrated by thick glacial till cover and frozen ground in forested areas. Old bulldozer trenches and roads that cut across the QLL structural corridor in the Camp Zone area will have had significant subsequent permafrost retreat and they should be deepened to bedrock with a medium size tracked excavator. The floors of the trenches should be continuously channel sampled if safe to do so. Otherwise, grab samples taken from the excavator bucket can suffice to identify the presence of mineralized sections. A hydraulic post hole auger mounted in place of the bucket on the excavator can be used to sample beyond the conventional reach of the machine in deep overburden areas. Phase II: Directed by results of the Phase I program, a 60 day Phase II exploration campaign should have a two-fold objective. (1) Infill sampling of anomalous areas resulting from Phase I should optimally target 50 m by 50 m sample spacing. A comprehensive rotary air blast (RAB) or reverse circulation (RC) recce drill program of 80 holes totaling 8,000 m should be carried out, focussing on refining diamond drill targeting in established areas of gold potential at the Camp, Cuz and Montrose Ridge Zones, as well as any other areas of high exploration interest that were identified by the Phase I work. Recent advancements in drilling technology have developed small track-mounted, self-propelled RAB/RC drills that can complete angle holes through a variety of overburden and groundwater conditions to depths of 100 m at about half the cost of diamond drilling. Fences of m deep angle holes at 200 m fence spacing should be drilled across the targeted structures. 95
101 (2) Concurrent with the RAB/RC drill program, diamond drilling of 45 holes totaling 6,000 metres at the Main Zone should proceed with a focus of extending the mineralized envelope to the north and east, and to depth beneath the relatively shallow drilling carried out to date. Follow-up diamond drilling of other targets prioritized by recce RAB/RC drilling should be carried out after assay results are compiled and the Main Zone drilling is completed. The infrastructure to support such a drilling campaign is in place in the form of the exploration camp, heavy equipment on site, the road and trail network, and some of the required consumables. Baseline environmental studies should be undertaken and community consultation should be carried out in conjunction with both phases of work. Table 18.1 presents a recommended budget to execute the two-phase gold exploration program proposed for the Hyland Gold Project. Table 18.1 Recommended Hyland Gold Project Exploration Budget Phase I 30 Day Field Program Work/Employee Description Time and Per Day Unit Cost Cost Multi-spectral satellite imagery acquisition $40,000 GIS data compilation $25,000 Mobilization/Demobilization/Travel Related $25,000 Camp Opening $5,000 Project Geologist 50 $770 per day $38,500 2 Samplers 30 $880 per day $26,400 Cook/First Aid 30 $385 per day $11,550 Camp Man/ Equipment Operator 30 $440 per day $13,200 ATV Rental (2) 30 $200 per day $6,000 Excavator 300 $150 per hour $4,000 Geochemical Analysis $30 per sample $45,000 Diesel Fuel 50 $300 per barrel $15,000 Fixed Wing Support 20 $900 per flight $18,000 Camp Costs 150 person $150/day $22,500 Freight/Expediting $15,000 Communications $5,000 Community Consultation $10,000 Baseline Environmental Sampling $20,000 15% $51,772 Phase I Total $396,922 96
102 Phase II 70 Day Field program Work/Employee Description Time and Per Day Unit Cost Cost Mobilization/Demobilization/Travel Related $80,000 Camp Upgrade $8,000 Project Geologist 90 $770 per day $70,230 Junior Geologists (2) 140 $660 per day $27,000 Samplers (2) 140 $330 per day $92,400 Cook/First Aid 70 $385 per day $26,950 Camp Man/ Equipment Operator 70 $440 per day $30,800 Caterpillar 300 $150 per hour $45,000 Diamond Drilling 6000 $150 per metre $900,000 RAB/RC Drilling 8000 $75 per metre $600,000 Geochemical Analysis $30 per sample $150,000 Fuel 250 $300 per barrel $75,000 Fixed Wing Support 40 $900 per flight $36,000 Camp Costs 930 person $150 per day $139,500 Baseline Environmental Sampling $20,000 Freight/Expediting $25,000 Communications $10,000 Community Consultation $10,000 Resource calculation update $30,000 15% $58,500 Phase II Total $2,732,262 Total Phase I and Phase II $3,102,184 97
103 19.0 REFERENCES Anderson, R.G., 1983; Selwyn plutonic suite and its relationship to tungsten mineralization, southeastern Yukon and District of Mackenzie: Geological Survey of Canada Current Research Paper 83-1B, p Anderson, R.G., 1987; Plutonic rocks of the Dawson map area, Yukon Territory: Geological Survey of Canada Current Research Paper 87-1A, p Anderson, R.G., 1993; Granitic rocks, in Gordey, S.P., and Anderson, R.G., eds., Evolution of the northern Cordilleran miogeocline, Nahanni map area (105I), Yukon and Northwest Territories: Geological Survey of Canada Memoir 428, p Archer, A.R. and Carne, J., 1982; Final Report, Quartz Lake Project 1982; internal report for Kidd Creek Mines Ltd. Arehart, G. B., Ressel, M., Carne, R. and Muntean, J., 2013; A comparison of Carlin-type deposits in Nevada and Yukon, in SEG Special Publication 17, pp Armitage, A. and Gray, P.D., 2012a; Technical Report on the Hyland Gold Property in the Yukon Territory, Canada; NI Report for Argus Metals Corp., filed on SEDAR under Argus Gold Corp. Armitage, A. and Gray, P.D., 2012b; Technical Report on the Hyland Gold Property in the Yukon Territory, Canada; NI Report for Banyan Coast Capital, filed on SEDAR under Banyan Gold Corp. Arne, D., 2011; Review of Hyland regional stream sediment geochemistry; internal report for Argus Metals Corp. ATAC Resources Ltd.; 2016, News release dated May 31, 2016, filed on SEDAR under ATAC Resources Ltd. Bidwell, G.E., 1995; Hyland Gold Property, 1995 Exploration Program, Watson Lake Mining District, Quartz Lake Area, Yukon Territory, Diamond Drilling; internal report for Hemlo Gold Mines Ltd. Banyan Gold Corp.; 2015, News release, September 17, 2015, filed on SEDAR under Banyan Gold Corp. Black, R., 2010; 2010 Geological, Geophysical and Diamond Drilling Report on the Hyland Project; internal report for Argus Metals Corp. Bremner, T. and Ouellette, D., 1991; Hyland Gold property, southeastern Yukon. In: Yukon Exploration 1990, Yukon Exploration and Geological Services, Indian & Northern Affairs Canada/Department of Indian & Northern Development: Exploration & Geological Services Division, p. 36. Carne, R. C., 1976; Geology of the stratabound barite-lead-zinc deposit on the Mel and Jean claim group, Coal River, Yukon; Dept. of Indian and Northern Affairs, EGS Report Carne, R. C. and Cathro, R. J., 1982; Sedimentary exhalative (sedex) zinc-lead-silver deposits, northern Canadian Cordillera; CIM Bulletin, April 1982, Vol. 75, No Carne, R.C., 1985; Geochemical and Geological Report on the Piglet 1-32 Claims; internal report for Archer, Cathro & Associates (1981) Limited. Carne, R.C., 2000; Summary of Gold Potential, Hyland Gold Project, Yukon Territory; internal report for Hyland Gold Joint Venture. Carne, R.C., 2002; Geological report describing the Hyland Gold property including 2001 geochemical surveys and prospecting: Hyland Gold Joint Venture; Yukon Mining Assessment Report , 58 p. 98
104 Carne, R.C. and Halleran, W.H., 1986; Geochemical Sampling Program, Hyland Gold Property; internal report for Hyland Gold Joint Venture. Coastech Research, Inc., 1989; Hyland Gold Joint Venture cyanidation scoping testwork, Project # , internal report for Hyland Gold Joint Venture, 14 p. Dennett, J.T. and Eaton, W.D., 1987; Report on Soil Geochemical and Bulldozer Trenching Program, Piglet, Quiver and Sow Claims; internal report for Hyland Gold Joint Venture. Dennett, J.T. and Eaton, W.D., 1988; Report on Soil Geochemical, Geophysical, Bulldozer Trenching and Diamond Drilling Program conducted for Adrian Resources Ltd., NDU Resources Ltd., and Silverquest Resources Ltd. at Piglet, Quiver, Sow, Boar and Ham claims; internal report for Hyland Gold Joint Venture. Dubois, M., 2011; Ground TDEM Survey, Hyland Gold Project, Watson Lake Yukon, Canada; internal report for Argus Metals Corp. Franzen, J. P, 1989; Review report on the Hyland Gold property, Watson Lake Mining District, Yukon Territory; internal report for Silverquest Resources Ltd., 7 p. Gabrielse, H., 1991; Chapter 17, Structural styles in Gabrielse, H., and Yorath, C. J., eds., Geology of the Cordilleran Orogen, in Canada, 4, Geological Survey of Canada, p Gish, R.F., 2000; Assessment Report describing Hyland Gold Property including 1999 Prospecting and Soil Geochemistry; internal report for Hyland Gold Joint Venture. Gordey, S.P. and Anderson, R.G., 1993; Evolution of the northern Cordilleran miogeocline, Nahanni map area (105I), Yukon and Northwest Territories, in Geological Survey of Canada Memoir 428. Gray, P.D., 2014a; 2013 Geochemical report on the Hyland Project; internal report for Banyan Gold Corp. Gray, P.D., 2014b; 2014 Geochemical report on the Hyland South Project; internal report for Banyan Gold Corp. Gray, P.D., 201; 2015 Trench and Geochemical Report on the Hyland South Project; internal report for Banyan Gold Corp. Hart, C.J.R., Baker, T., and Burke, M., 2000; New Exploration Concepts for Country-Rock-Hosted, Intrusion- Related God Systems: Tintina Gold Belt in Yukon, in The Tintina Gold Belt: Concepts, Exploration, and Discoveries, BC and Yukon Chamber of Mines Cordilleran Roundup Special Volume 2. Hladky, D., 2003; Hyland Project, Assessment Report 2003, StrataGold Corporation; Yukon Mining Assessment Report , 524 p. Hladky, D., 2004; Hyland Project 2004, Preliminary Report: StrataGold Corporation; Yukon Mining Assessment Report , 43 p. Johnston, M. K. and Ressel, M. W., 2004; Carlin-type and distal disseminated Au-Ag deposits: related distal expressions of Eocene intrusive centers in north-central Nevada, in Controversies on the Origin of World Class Gold Deposits, Part 1: Carlin-type deposits in Nevada; SEG Newsletter No. 59, p. 10. Jones, M.I., 1997; 1996 Assessment Report, Hyland Property, Geological Mapping, Soil Sampling and Auger Soil Sampling Surveys; internal report for Westmin Resources Limited, Yukon Mining Assessment Report AR Kappes, D., Giroux, G. H., Abdel Hafez, S., McIntyre, R. L. and Carlson, G., 2014; Preliminary Economic Assessment (PEA), NI Technical report on the Tiger Gold Project, Yukon Territory, Canada; 277 p., filed on SEDAR under ATAC Resources Ltd. 99
105 King, H.L. and Giroux, G.H., 2014; Technical Report on the Mel Zinc-lead-barite property, Watson Lake Mining District, Yukon, for Silver Range Resources Ltd.; 78 p., filed on SEDAR under Silver Range Resources Ltd. Klein, J., 2004; Highland Property, Watson Lake M.D. Yukon Territory, Comments on the Geophysical Data Sets; internal report for StrataGold Corporation. Lane, J., Phillips, R. and Carne, R., 2015; (abst.), Recent Carlin-type gold discoveries by ATAC Resources Ltd. on the Rackla Gold Project in central Yukon, in New Concepts and Discoveries; proceedings of the 2015 GSN Symposium, Reno NV. Lustig, G. N., Tucker, T. L., and Duncan, R. A., 2003; A summary report for the Hyland property in the Watson Lake Mining District Yukon Territory, Canada; StrataGold Corporation internal report, 78 p. Mauler-Steinman, A., 2011; Petrography of Twelve Core samples from the Hyland Gold Property, (Yukon) MSC11-03R; internal report by Equity Exploration Inc for Argus Metals Corp. Morin, J.A., 1981; The McMillan Deposit - a stratabound lead-zinc-silver deposit in sedimentary rocks of Upper Proterozoic age, Yukon; in Yukon Geology and Exploration , Indian & Northern Affairs Canada, Exploration & Geological Services Division. Pawliuk, D. J., 1996; Westmin Resources Limited, McMillan Area, Yukon, Yukon Mining Assessment Report Pigage, L. C., Abbott, J. G., and Roots, C. F., 2011; Bedrock geology of Coal River map area (NTS 95D), Yukon; Yukon Geological Survey, scale 1: Plafker, G., and Berg, H.C., 1994; Overview of the geology and tectonic evolution of Alaska, in Plafker, G., and Berg, H.C., eds., in The geology of Alaska: The geology of North America, v. G-1: Geological Society of America, Boulder, Colorado, p Sax, K. and Carne, R.C., 1990; Report on Reverse Circulation Percussion Drilling conducted for Hyland Gold Joint Venture at the Hyland Gold Property; internal report for Hyland Gold Venture. Sparling J., Whitehead, K., 2007; Hyland Gold Property Summary; internal report for StrataGold Corporation. Thiessen, E. J., Gleeson, S. A., Bennett, V. and Creaser, R. A., 2016; The Tiger Deposit: a carbonate-hosted, magmatic-hydrothermal gold deposit, central Yukon, Canada; Economic Geology, vol. 111, pp Tucker, M. J., 2015; Geology, mineralization and geochronology of the Conrad zone Carlin-type prospect, eastcentral Yukon, Canada; unpublished M.Sc. Thesis, Vancouver, Canada, University of British Columbia, 235 p. Tucker, M. J., Hart, C. J. R. and Carne, R. C., 2013; Geology, alteration, and mineralization of the Carlin-type Conrad Zone, Yukon, in Yukon Exploration and Geology, 2012, K. E. MacFarlane, M. G. Nordling, and P. J. Sacks (eds.), Yukon Geological Survey, p Tucker, T.L., and Pawliuk, D.J., 1995; 1994 Assessment Report, Hyland Property, Geological Mapping, Lithogeochemical Sampling, Stream Sediment Sampling, Soil Sampling and Airborne Geophysical Surveys; Yukon Mining Assessment Report AR Yukon MINFILE, 2016; digital entry for the McMillan occurrence (95D 005); viewed June 1,
106
107 QP CERTIFICATE - ALLAN ARMITAGE To Accompany the Report titled "Technical Report on the Hyland Gold Project, Yukon Territory, Canada" dated August 4th,2A16 (the "Technical Report") l, Allan E. Armitage, Ph. D., P. Geol. of 62 River Front Way, Fredericton, New Brunswick, hereby certify that: 1. I am a consulting geologist with GeoVector Management lnc., 10 Green Street Suite 312 Ottawa, Ontario, Canada l<2j 32:6. 2. I am a graduate of Acadia University having obtained the degree of Bachelor of Science - Honours in Geology in 1989, a graduate of Laurentian University having obtained the degree of Masters of Science in Geology in 1992 and a graduate of the University of Western Ontario having obtained a Doctor of Philosophy in Geology in I have been employed as a geologist for every field season (May - October) from 1987 to I have been continuously employed as a geologist since March of I have been involved in mineral exploration and resource modeling for gold, silver, copper, lead, zinc, nickel, and uranium in Canada, Mexico, Honduras, Bolivia, Chile, and the Philippines at the grass roots to advanced exploration stage since '1991, including resource estimation since I am a member of ihe Association of Professional Engineers, Geologists and Geophysicists of Alberta and use the title of Professional Geologist (P.Geol.) (License No ; 1999), and I am a member of the Association of Professional Engineers and Geoscientists of British Golumbia and use the designation (P.Geo.) (Licence No, 38144; 2012). 6. I have read the definition of "Qualified Person" set out in National lnstrument $-1U ("N ") and certify that by reason of my education, affiliation of my professional association and past relevant work experience, I fulfillthe requirements to be a "Qualified Person". 7. I am responsible for Section 14 "Mineral Resource Estimate" of the Technical Report, 8. I have personally inspected the Property and drill core in the field on October 12, I was an author of a previous technical report on the Hyland Gold Project for Banyan Coast Capital Corp. which was dated November 02, Since that date I have had no involvement in the Hyland Gold Project. 10. I am independent of Banyan Gold Corp. as defined by Section 1.5 of Nl As of the date of this certificate, to the best of my knowledge, information and belief, the Technical Report contains all scientific and technical information that is required to be disclosed to make the Technical Report not misleading. 12. I have read Nl and Form $-1A1F1 (the "Form"), and the Technical Report has been prepared compliance with Nl and the Form, Signed and dated this 4th day of August, 2016 at Fredericton, New Brunswick. in
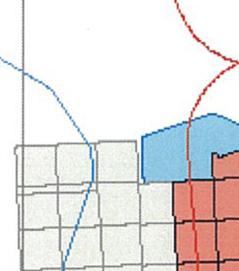
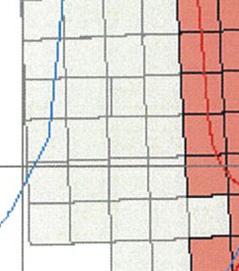
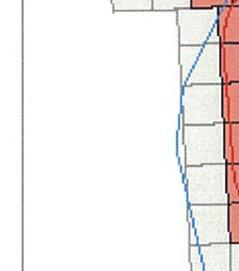
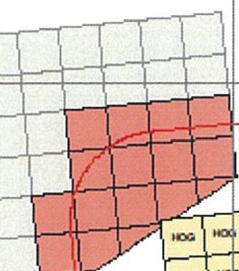
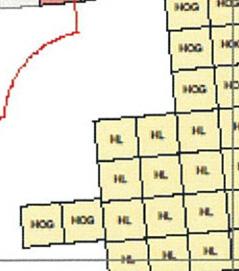
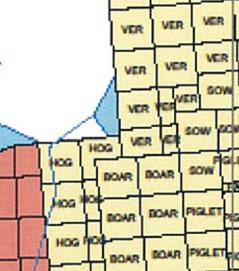
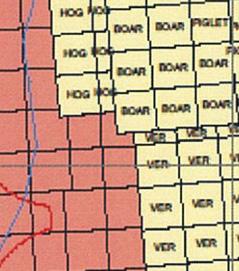
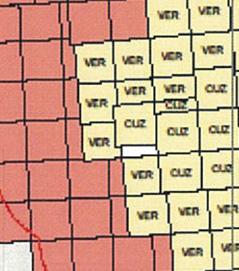
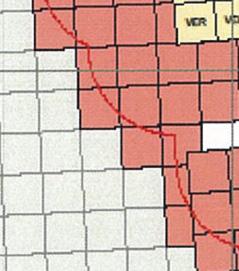
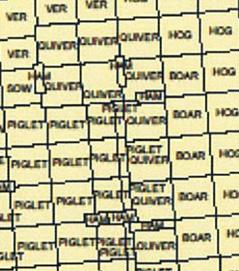
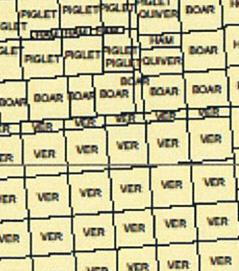
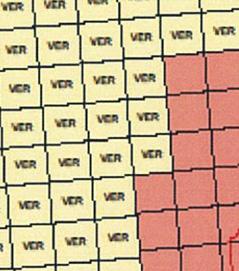
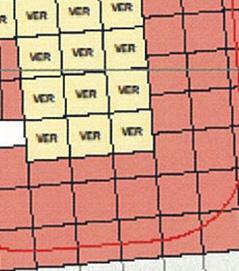
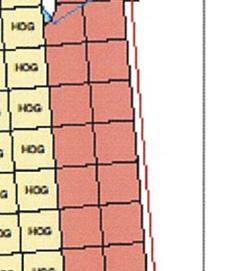
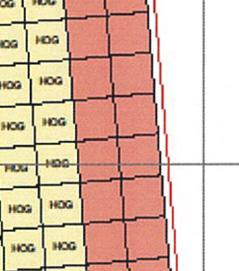
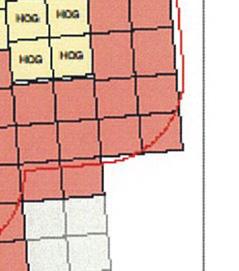
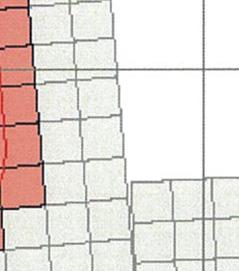
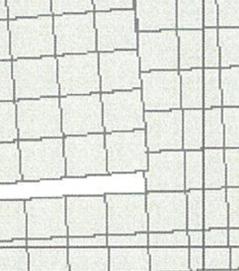
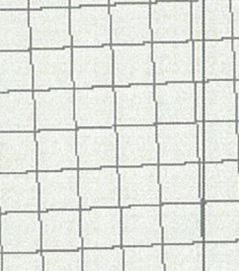
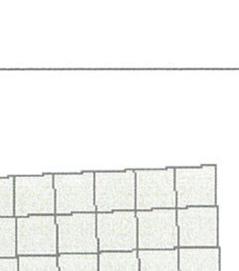
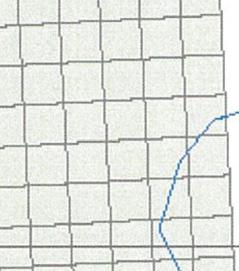
108 Technnical Report on the Hyland Gold d Project, Yukon Territory, Canaada APP PENDIX 1: 1 Hyland d Gold Prroject Ro oyalties Review 103
109 Technnical Report on the Hyland Gold d Project, Yukon Territory, Canaada 104
110 Technnical Report on the Hyland Gold d Project, Yukon Territory, Canaada 105
111 Technnical Report on the Hyland Gold d Project, Yukon Territory, Canaada 106
112 Technnical Report on the Hyland Gold d Project, Yukon Territory, Canaada 107
113 108
TECHNICAL REPORT ON THE
 TECHNICAL REPORT ON THE UPDATED MINERAL RESOURCE ESTIMATE FOR THE MAIN ZONE, HYLAND GOLD PROPERTY, WATSON LAKE MINING DISTRICT, SOUTHEAST YUKON, CANADA Located in the Watson Lake Mining District NTS: 95D/05
Elephant Mountain, Alaska Intrusive Related Gold Project July Option to Earn 100%
 Elephant Mountain, Alaska Intrusive Related Gold Project July 2018 Option to Earn 100% CORPORATE Corporate DISCLOSURE Disclosure The information contained herein, while obtained from sources which we believe
Timberline Completes Technical Reports on the Elder Creek and Paiute Porphyry Copper-Gold Projects, Nevada
 FOR IMMEDIATE RELEASE Timberline Completes Technical Reports on the Elder Creek and Paiute Porphyry Copper-Gold Projects, Nevada Coeur d Alene, Idaho November 29, 2018 Timberline Resources Corporation
ANTLER GOLD EXPLORATION UPDATE, WILDING LAKE GOLD PROJECT, NEWFOUNDLAND
 ANTLER GOLD EXPLORATION UPDATE, WILDING LAKE GOLD PROJECT, NEWFOUNDLAND HALIFAX, NOVA SCOTIA (CNW May 10, 2018) Antler Gold Inc. ( Antler ) (TSX-V:ANTL) is pleased to provide an update on its upcoming
Probe Metals Continues to Intersect Significant Gold Mineralization in Expansion Drilling at Val-d Or East, including 4.1 g/t Gold Over 15.
 NEWS RELEASE 10/2018 Symbol: TSX-V: PRB Shares Issued: 110,584,945 Probe Metals Continues to Intersect Significant Gold Mineralization in Expansion Drilling at Val-d Or East, including 4.1 g/t Gold Over
A New Direction. Copper-Gold Deposit at Thor TSX.V:COL. August 11, May 2013
 A New Direction Copper-Gold Deposit at Thor August 11, 2016 May 2013 TSX.V:COL FORWARD LOOKING STATEMENTS This presentation includes certain forward-looking information or forward-looking statements for
NEWS RELEASE. Evrim announces additional drilling results at Cuale Gold Project in Mexico
 910-850 WEST HASTINGS ST. VANCOUVER, BC, CANADA V6C 1E1 TEL: 604.248.8648 FAX: 604.248.8663 WWW.EVRIMRESOURCES.COM TSX-V: EVM CONTACT: PADDY NICOL OR CHARLES FUNK NEWS RELEASE Evrim announces additional
Eloro Outlines Major New Mineralized Trend on La Victoria Project, Peru; Sample Results Return Values To 33 Grams Gold Per Tonne
 20 Adelaide Street East, Suite 200, Toronto, Ontario CANADA M5C 2T6 Tel.: (416) 868-9168 Fax: (416) 361-1333 TSX.V Symbol: ELO www.elororesources.com Eloro Outlines Major New Mineralized Trend on La Victoria
Probe Metals Intersects 3.2 g/t Gold Over 45.5 Metres At Val-d Or East
 NEWS RELEASE 11/2018 Symbol: TSX-V: PRB Shares Issued: 110,584,945 Highlights: Probe Metals Intersects 3.2 g/t Gold Over 45.5 Metres At Val-d Or East Near-surface intercept grading 3.2 g/t Au over 45.5
MINERAL MOUNTAIN RESOURCES LTD. MMV.TSX-V
 MINERAL MOUNTAIN RESOURCES LTD. 201-1416 West 8 th Avenue Vancouver, B.C. V6H 1E1 T: 604-714-0111 F: 604-714-1119 MMV.TSX-V NEWS RELEASE March 3, 2011 No. 2011-04 MINERAL MOUNTAIN DRILLS 3.17 g/t OVER
Probe Metals Continues to Expand Gold Zones At Val-d Or East
 NEWS RELEASE 02/2018 Symbol: TSX-V: PRB Shares Issued: 93,914,742 Highlights: Probe Metals Continues to Expand Gold Zones At Val-d Or East New Beliveau Deposit resource expansion drilling to the West returned
PRESS RELEASE. DUBUISSON NORTH DRILLING CUTS g/t AU OVER 5.0 METRES NEW S50 EAST DISCOVERY, 3.39 g/t AU OVER 25.9 METRES
 PRESS RELEASE DUBUISSON NORTH DRILLING CUTS 45.05 g/t AU OVER 5.0 METRES NEW S50 EAST DISCOVERY, 3.39 g/t AU OVER 25.9 METRES Toronto, Ontario November 19, 2014 Wesdome Gold Mines Ltd (TSX: WDO) today
Mineral Resource Estimate Comparison at 3 g/t Au cut-off
 HARTE GOLD CORP. 8 King Street East, Suite 1700 Toronto, Ontario, M5C 1B5 Tel: 416-368-0999 Fax: 416-368-5146 Harte Gold Announces 2018 Drilling Increases Indicated Mineral Resources by 55% Overall Resource
NEWS RELEASE. Evrim announces initial drilling results at Cuale Gold Project in Mexico
 910-850 WEST HASTINGS ST. VANCOUVER, BC, CANADA V6C 1E1 TEL: 604.248.8648 FAX: 604.248.8663 WWW.EVRIMRESOURCES.COM TSX-V: EVM CONTACT: PADDY NICOL OR CHARLES FUNK NEWS RELEASE Evrim announces initial drilling
Green Springs Project
 Green Springs Project AUGUST 2016 Ely Gold & Minerals Inc. elygoldandminerals.com @ElyGoldNevada TSX.V:ELY FORWARD LOOKING STATEMENTS Certain statements herein may contain forward looking information within
ANTLER GOLD DRILLS GRAMS PER TONNE GOLD OVER 5.35 METRES AT THE WILDING LAKE GOLD PROJECT, NEWFOUNDLAND
 ANTLER GOLD DRILLS 10.01 GRAMS PER TONNE GOLD OVER 5.35 METRES AT THE WILDING LAKE GOLD PROJECT, NEWFOUNDLAND HALIFAX, NOVA SCOTIA (CNW December 13 th, 2017) Antler Gold Inc. ( Antler ) (TSX- V:ANTL) is
Kelly Creek Basin. EXPLORATION UPDATE June 23, Reno Office 10 Greg Street, Suite 170 Sparks, Nevada
 Kelly Creek Basin EXPLORATION UPDATE June 23, 2016 Reno Office 10 Greg Street, Suite 170 Sparks, Nevada 89431 775-359-7740 Vancouver Office 1500 885 West Georgia Street Vancouver, B.C. V6C 3E8 604-601-2006
Timberline Resources Announces Gold and Copper Assay Results for the Elder Creek Project, Battle Mountain District, Nevada
 F O R I M M E D I A T E R E L E A S E Timberline Resources Announces Gold and Copper Assay Results for the Elder Creek Project, Battle Mountain District, Nevada Coeur d Alene, Idaho June 18, 2018 Timberline
NEWS RELEASE ORCA GOLD REPORTS CONTINUED SUCCESS AT GSS
 NEWS RELEASE OA GOLD REPORTS CONTINUED SUCCESS AT GSS May 26, 2014 Orca Gold Inc. (TSX.V:ORG) ( Orca or the Company ) is pleased to provide an update on exploration at its Galat Sufar South ( GSS ) prospect
ANTLER GOLD HIGHLIGHTS NEW GOLD-IN-SOIL ANOMALIES, CENTRAL NEWFOUNDLAND
 ANTLER GOLD HIGHLIGHTS NEW GOLD-IN-SOIL ANOMALIES, CENTRAL NEWFOUNDLAND HALIFAX, NOVA SCOTIA (CNW October 17, 2018) Antler Gold Inc. ( Antler ) (TSX- V:ANTL) is pleased to provide an update on its successful
Cordoba Minerals Provides an Update on Exploration Activities at the San Matias Copper-Gold Project in Colombia
 Cordoba Minerals Provides an Update on Exploration Activities at the San Matias Copper-Gold Project in Colombia 1,000-Metre Diamond Drill Program to Test Alacran Porphyry and Northern Extension Targets
OSISKO METALS INTERSECTS 10.49% ZINC+LEAD OVER METRES AND 12.15% ZINC+LEAD OVER METRES AT PINE POINT
 OSISKO METALS INTERSECTS 10.49% ZINC+LEAD OVER 22.84 METRES AND 12.15% ZINC+LEAD OVER 17.00 METRES AT PINE POINT (Montreal November 19, 2018) Osisko Metals Incorporated (the Company or Osisko Metals )
Probe Metals Confirms Continuity of Gold Mineralization on its Val-d Or East Project And Increases 2017 Drill Program to 75,000 metres
 NEWS RELEASE 07/2017 Symbol: TSX-V: PRB Shares Issued: 93,328,938 Probe Metals Confirms Continuity of Gold Mineralization on its Val-d Or East Project And Increases 2017 Drill Program to 75,000 metres
Pacific Empire Minerals Provides Copper King RC Drilling Results
 Pacific Empire Minerals Provides Copper King RC Drilling Results November 1, 2018 - Vancouver, BC, Canada - Pacific Empire Minerals Corp. (TSXV: PEMC) ( Pacific Empire, PEMC or the Company ), a hybrid
West Pender Street Vancouver, BC V6C 2V6 Tel: Fax: TSX-V: GBR NEWS RELEASE
 1020 800 West Pender Street Vancouver, BC V6C 2V6 Tel: 604-646-8354 Fax: 604-646-4526 TSX-V: GBR NEWS RELEASE Great Bear Drills Hinge Zone Extensions - Results Include New 42 m Wide Zone with Multiple
AZUCAR MINERALS COMMENCES DRILLING AT THE EL COBRE PROJECT, MEXICO
 NEWS RELEASE June 13, 2018 Trading Symbols: TSX-V: AMZ; OTCQX: AXDDF www.azucarminerals.com AZUCAR MINERALS COMMENCES DRILLING AT THE EL COBRE PROJECT, MEXICO VANCOUVER, B.C. Azucar Minerals Limited ("Azucar"
Yukon Presentation. January 2015
 Yukon Presentation January 2015 Disclaimer This presentation contains forward looking statements. All statements, other than statements of historical fact, included herein, including without limitation,
MONETA INTERCEPTS g/t GOLD INCLUDING g/t GOLD AT SOUTH WEST
 NEWS RELEASE 13/2018 Symbol: TSX: ME FOR IMMEDIATE RELEASE MONETA INTERCEPTS 25.00 m @ 2.48 g/t GOLD INCLUDING 4.50 m @ 5.00 g/t GOLD AT SOUTH WEST Toronto, Ontario September 13, 2018 - Moneta Porcupine
Advancing High Grade Gold Assets in Red Lake, Ontario
 Advancing High Grade Gold Assets in Red Lake, Ontario Forward Looking Statement Except for historical information contained herein, this presentation may contain forward-looking statements including but
NEWS RELEASE. Tigray Intersects 28.2 metres at 8.50 grams per tonne gold at Mato Bula, Adyabo Project, Northern Ethiopia
 Suite 3114, 1055 Dunsmuir Street Four Bentall Centre Vancouver, BC V7X 1G4 tel 604 488 0822 toll free 866 488 0822 fax 604 899 1240 web www.tigray.ca email investors@tigray.ca NEWS RELEASE Tigray Intersects
CAUTIONARY STATEMENT
 AUGUST 2018 RLG CAUTIONARY STATEMENT Some of the statements contained in this presentation are forward-looking statements. Such forward-looking statements involve known and unknown risks, uncertainties
Highlights include: Hole TTD050: 6.12 g/t Au over 7.00 metres from metres o Including g/t Au over 1.18 metres
 GT Gold Continues to Drill Multiple High-Grade Intercepts at Saddle South, Intersecting 12.05 g/t Au Over 3.79 Metres and 9.77 g/t Au Over 5.53 Metres in Hole TTD045 Vancouver, British Columbia December
LH Property Update: Magnum Goldcorp Hits High Grade Gold 16.9 m of g/t, including 10.9 m of g/t, and as well, 11 m of 20.
 Trading symbol: TSX-V: IBC News Release No. 15-04 2489 BELLEVUE AVENUE WEST VANCOUVER, BC V7V 1E1 TEL 604 922 2030 FAX 604 922 2037 TOLL FREE (CANADA) 1 888 888 9122 TOLL FREE (USA) 1 888 888 9123 LH Property
Hole (93) From (m) To (m) m Au (g/t) Ag (g/t) Cu (%) Pb (%) Zn (%) CMLP
 From (m) To (m) m Au (g/t) Ag (g/t) Cu (%) Pb (%) Zn (%) CMLP") Toachi Mining Inc. Intersects 13.91 m grading 3.51 g/t Au, 64.24 g/t Ag, 0.59% Cu, 4.11% Zn and 0.85% Pb at the Gold-Rich La Plata VMS Project in Ecuador Toronto, Ontario October 11, 2017 Toachi Mining
Toachi Mining Inc. Intersects 13.91 m grading 3.51 g/t Au, 64.24 g/t Ag, 0.59% Cu, 4.11% Zn and 0.85% Pb at the Gold-Rich La Plata VMS Project in Ecuador Toronto, Ontario October 11, 2017 Toachi Mining
SALAZAR ANNOUNCES AN UPDATED RESOURCE REPORT OF 5.53 MT INDICATED AND 1.46 MT INFERRED AT ITS HIGH GRADE VMS EL DOMO DEPOSIT
 SALAZAR ANNOUNCES AN UPDATED 43-101 RESOURCE REPORT OF 5.53 MT INDICATED AND 1.46 MT INFERRED AT ITS HIGH GRADE VMS EL DOMO DEPOSIT VANCOUVER, BRITISH COLUMBIA, January 12, 2012 - Salazar Resources Ltd.
LME m averaging 0.65 g/t Au and 0.32% Cu, or 1.19 g/t Au Equiv LME m averaging 0.64 g/t Au and 0.11% Cu, or 0.
 Bellhaven Tops Previous Best Hole at the Middle Zone Deposit, La Mina Project, Colombia: LME-1072 134.39m at 0.65 g/t Au and 0.32%Cu, or 1.19 g/t Au Equivalent Medellin, Colombia May 14, 2012. Bellhaven
NEWS RELEASE. Evrim and Harvest Gold Complete Drilling at Cerro Cascaron
 910-850 WEST HASTINGS ST. VANCOUVER, BC, CANADA V6C 1E1 TEL: 604.248.8648 FAX: 604.248.8663 WWW.EVRIMRESOURCES.COM TSX-V: EVM CONTACT: PADDY NICOL OR CHARLES FUNK NEWS RELEASE Evrim and Harvest Gold Complete
NEWS RELEASE NOVEMBER 15, 2018 HANNAN COMPLETES DRILLING AT BALLYHICKEY, DEFINES SIGNIFICANT ZINC TARGET AT KILMURRY, CO.
 1305 1090 West Georgia Street, Vancouver, BC, V6E 3V7 Phone: +1 604 685 9316 / Fax: +1 604 683 1585 NEWS RELEASE NOVEMBER 15, 2018 HANNAN COMPLETES DRILLING AT BALLYHICKEY, DEFINES SIGNIFICANT ZINC TARGET
NEWS RELEASE DRILLING BEGINS AT THE CERRO CASCARON GOLD AND SILVER PROJECT IN MEXICO
 HARVEST GOLD CORP. Suite 804 750 West Pender Street Vancouver, BC V6C 2T7 T: (604) 682-2928 F: (604) 685-6905 E: info@harvestgoldcorp.com W: www.harvestgoldcorp.com NEWS RELEASE DRILLING BEGINS AT THE
Yukon Presentation. October 2012
 Yukon Presentation October 2012 Disclaimer This presentation contains forward looking statements. All statements, other than statements of historical fact, included herein, including without limitation,
Mountain Maid Gold System Displays Major Size Potential
 29 July 2008 The Manager, Companies Australian Securities Exchange Ltd Electronic Announcement System Dear Sir, AXIOM MINING LIMITED (ASX CODE: AVQ) ASX Announcement Mountain Maid Gold System Displays
Probe Metals Discovers New High Grade Gold Zone on Val-d Or East Project: Intersects 12.6 g/t Gold Over 7.3 Metres
 NEWS RELEASE 23/2016 Symbol: TSX-V: PRB Shares Issued: 85,458,906 Probe Metals Discovers New High Grade Gold Zone on Val-d Or East Project: Intersects 12.6 g/t Gold Over 7.3 Metres Toronto, December 6,
Golden Predator Intersects 7.5 m of 33 g/t Gold at the 3 Aces Project; Discovers Significant Stockwork Mineralization
 NEWS RELEASE TSX.V: GPY January 19 th, 2017 NR 17-02 www.goldenpredator.com Golden Predator Intersects 7.5 m of 33 g/t Gold at the 3 Aces Project; Discovers Significant Stockwork Mineralization Vancouver,
Seafield Announces the Discovery of a New Porphyry-Style Drill Target at its Quinchía Gold Project in Risaralda, Colombia
 For Immediate Release Seafield Announces the Discovery of a New Porphyry-Style Drill Target at its Quinchía Gold Project in Risaralda, Colombia Toronto, Ontario, September 27, 2012 - Seafield Resources
May 17, Two holes explored the extension at depth of the historic Sta Rosa vein
 May 17, 2011 PROSPERO INTERSECTS 781 g/t Ag, 1.2% Cu, 4.1% Zn OVER 2.62 METERS; DISCOVERS NEW ZINC RICH CANAL ZONE AT SAN LUIS DEL CORDERO PROJECT, MEXICO Vancouver, B.C. - Prospero Silver Corp. (TSX VENTURE:
NEWS RELEASE NOVEMBER 28th, 2017 Trading Symbols: TSX-V: AMZ; OTCQX: AXDDF
 NEWS RELEASE NOVEMBER 28th, 2017 Trading Symbols: TSX-V: AMZ; OTCQX: AXDDF www.almadexminerals.com ALMADEX REPORTS FIRST HOLES FROM RAYA TEMBRILLO (VILLA RICA) INTERSECTS ENRICHED COPPER ZONE AND HYPOGENE
True Width (m) Carneritos to
 Carneritos to") Exchange Tower 410-150 York Street Toronto, Ontario M5H 3S5 Canada www.mammothresources.ca FOR IMMEDIATE RELEASE: July 13, 2017 No. 08/17 Mammoth Resources Intersects 36.5 Grams per Tonne Gold in Channel
Exchange Tower 410-150 York Street Toronto, Ontario M5H 3S5 Canada www.mammothresources.ca FOR IMMEDIATE RELEASE: July 13, 2017 No. 08/17 Mammoth Resources Intersects 36.5 Grams per Tonne Gold in Channel
Golden Predator Intersects 6.86 m of g/t Gold at the 3 Aces Project; Jack and Ace of Spades Zones Merging
 NEWS RELEASE TSX.V: GPY July 10, 2017 NR 17-15 www.goldenpredator.com Golden Predator Intersects 6.86 m of 20.15 g/t Gold at the 3 Aces Project; Jack and Ace of Spades Zones Merging Vancouver, BC, July
MONETA INTERCEPTS g/t GOLD INCLUDING g/t GOLD AND g/t GOLD INCLUDING g/t GOLD AT SOUTH WEST
 NEWS RELEASE 15/2018 Symbol: TSX: ME FOR IMMEDIATE RELEASE MONETA INTERCEPTS 5.30 m @ 7.63 g/t GOLD INCLUDING 0.80 m @ 22.40 g/t GOLD AND 7.13 m @ 5.06 g/t GOLD INCLUDING 1.98 m @ 12.47 g/t GOLD AT SOUTH
Bellhaven Expands the Middle Zone Prospect with New Drilling: Advances toward New Resource in First Half of 2012
 Bellhaven Expands the Middle Zone Prospect with New Drilling: Advances toward New Resource in First Half of 2012 Vancouver, British Columbia January 19, 2012. Bellhaven Copper & Gold Inc. (TSX- Venture:
ATON RETURNS 22.2 METRES OF 2.77 GRAMS PER TONNE GOLD EQUIVALENT FROM HAMAMA WEST; VISIBLE GOLD DISCOVERED AT BOHLOG
 FOR IMMEDIATE RELEASE: ATON RETURNS 22.2 METRES OF 2.77 GRAMS PER TONNE GOLD EQUIVALENT FROM HAMAMA WEST; VISIBLE GOLD DISCOVERED AT BOHLOG Vancouver, April XX, 2017: Aton Resources Inc. (AAN: TSX-V) (
AUGUSTINE VENTURES ANNOUNCES HIGH GRADE GOLD BEARING TENSION VEINS IN THE HANGING WALL OF THE SURLUGA DEPOSIT
 NEWS RELEASE November 29, 2016 AUGUSTINE VENTURES ANNOUNCES HIGH GRADE GOLD BEARING TENSION VEINS IN THE HANGING WALL OF THE SURLUGA DEPOSIT Toronto, Ontario November 29, 2016 - The Manager, Red Pine Exploration
Large Epithermal Quartz Veins Found in Outcrop at Shot Rock, Nova Scotia; Dozens of Large Angular Boulders Suggest Extensive System
 Large Epithermal Quartz Veins Found in Outcrop at Shot Rock, Nova Scotia; Dozens of Large Angular Boulders Suggest Extensive System Ottawa, Ontario (November 7, 2018) - Northern Shield Resources Inc. ("Northern
Drilling Extending Mineralization in La Mina North Zone
 Toachi Mining Inc. Intersects 5.42 m grading 4.35 g/t Au, 77.34 g/t Ag, 7.48% Cu, 4.24% Zn and 0.22% Pb at the Gold-Rich La Plata VMS Project in Ecuador Drilling Extending Mineralization in La Mina North
July Exploring for Canadian Gold in the Rainy River District of Ontario
 July 2013 Exploring for Canadian Gold in the Rainy River District of Ontario 1 Forward Looking Statements Some of the statements in this document may be deemed to be "forward-looking statements". All statements
(TSXV: GPLY, OTCQB: GLYXF
 GOLDPLAY ANNOUNCES POSITIVE RESULTS FROM SAMPLING OF HISTORICAL CORE AT SAN MARCIAL - ATTRACTIVE SILVER-LEAD-ZINC MINERALIZATION SUPPORTS OPEN PIT POTENTIAL October 09, 2018, Vancouver, BC - Goldplay Exploration
Summary of Rover Metals Geologic Mapping Program at the Up Town Gold Project, Northwest Territories
 October 13, 2017 Summary of Rover Metals Geologic Mapping Program at the Up Town Gold Project, Northwest Territories Vancouver, British Columbia, Canada - Rover Metals Corp., Rover, is pleased to provide
TSX.V: TR. Drilling in the Shadow of World-Class Deposits. TR: TSX.V January 2019
 TSX.V: TR Drilling in the Shadow of World-Class Deposits TR: TSX.V January 2019 1 Looking Forward Statement Investors are cautioned that, except for statements of historical fact certain information contained
Drilling Program Commences on Iron Oxide Copper Gold Targets
 3 June 2008 Manager Company Announcements Company Announcements Office Australian Stock Exchange Limited Level 10, 20 Bond Street SYDNEY NSW 2000 ABN 42 082 593 235 Electronic delivery No of pages: 6 Drilling
NEWS RELEASE GOLD CANYON INTERCEPTS 286 METERS AT 1.03 GRAMS PER TONNE GOLD CONFIRMING NORTHEAST DIP OF PORTAGE ZONE AT SPRINGPOLE GOLD PROJECT
 GOLD CANYON RESOURCES INC. GCU: TSX-V Suite 810-609 Granville Street, P.O. Box 1036 Pacific Centre, Vancouver, BC, Canada V7Y 1G Tel: (604) 682-3234 Toll free: 1 (888) 242-3234 Fax: (604) 682-037 www.goldcanyon.ca
Minsud to recommence resource outline diamond drilling at the Chita Valley Cu- Au-Ag-Mo Project, San Juan, Argentina
 TSX-V: MSR August 17, 2016 Minsud to recommence resource outline diamond drilling at the Chita Valley Cu- Au-Ag-Mo Project, San Juan, Argentina Program features preliminary test of Epithermal Au-Ag Vein
Yorbeau identifies two new exciting exploration targets at the Rouyn Property
 PRESS RELEASE FOR IMMEDIATE RELEASE Yorbeau identifies two new exciting exploration targets at the Rouyn Property Montreal, April 18, 2012 - Yorbeau Resources Inc. ( Yorbeau ) is pleased to report that
IDM Mining s Underground Drilling Intersects g/t Au and g/t Ag over 6.80 Meters True Width at the Red Mountain Gold Project
 IDM Mining s Underground Drilling Intersects 18.70 g/t Au and 66.85 g/t Ag over 6.80 Meters True Width at the Red Mountain Gold Project November 22 nd, 2016, Vancouver, BC IDM Mining Ltd. (TSX.V:IDM) (
FALCO PACIFIC COMPLETES INITIAL MODEL FOR THE HORNE 5 GOLD/SILVER/ZINC/COPPER DEPOSIT
 For Immediate Release NR 13-10 FALCO PACIFIC COMPLETES INITIAL MODEL FOR THE HORNE 5 GOLD/SILVER/ZINC/COPPER DEPOSIT (Vancouver, BC, September 16, 2013) Falco Pacific Resource Group Inc. ( Falco Pacific
Melkior retains Geologica to complete a NI report on its Launay property, Québec
 TSX.V: MKR / OTCPK: MKRIF / FSE: MEK September 4 th, 2014 Melkior retains Geologica to complete a NI 43-101 report on its Launay property, Québec Ottawa, Ontario. Melkior Resources Inc. ( Melkior or the
San Gold Drills New Mine Horizon Adjacent to Rice Lake Mine, Returns 10.4 Metres Grading 25.7 g/t Au
 SAN GOLD CORPORATION TSX: SGR OTCQX: SGRCF FOR IMMEDIATE RELEASE October 15, 2014 San Gold Drills New Mine Horizon Adjacent to Rice Lake Mine, Returns 10.4 Metres Grading 25.7 g/t Au WINNIPEG, MANITOBA
Queenston Announces 112% Increase in Indicated Resource (to 1.5 M oz. gold) and 16% Increase in Inferred Resource (to 0.7 M oz. gold) at Upper Beaver
 and 16% Increase in Inferred Resource (to 0.7 M oz. gold) at Upper Beaver") 2012-19 Queenston Announces 112% Increase in Indicated Resource (to 1.5 M oz. gold) and 16% Increase in Inferred Resource (to 0.7 M oz. gold) at Upper Beaver September 26, 2012 Toronto, Ontario - QUEENSTON
2012-19 Queenston Announces 112% Increase in Indicated Resource (to 1.5 M oz. gold) and 16% Increase in Inferred Resource (to 0.7 M oz. gold) at Upper Beaver September 26, 2012 Toronto, Ontario - QUEENSTON
NORTHQUEST LTD. ANNOUNCES DRILLING RESULTS FROM THE PISTOL BAY GOLD PROJECT, NUNAVUT, CANADA
 NORTHQUEST LTD. ANNOUNCES DRILLING RESULTS FROM THE PISTOL BAY GOLD PROJECT, NUNAVUT, CANADA PB-14-15 INTERSECTS 134.42 METRES GRADING 1.36 GRAMS GOLD PER TONNE AT THE VICKERS TARGET STRIKE LENGTH OF THE
Pahtavaara Drill Program Intersects 32.8 G/T Gold Over 2.0M And 2.1 G/T Gold Over 18.0M In The Karoliina Zone
 Page 1 of 6 a Pahtavaara Drill Program Intersects 32.8 G/T Gold Over 2.0M And 2.1 G/T Gold Over 18.0M In The Karoliina Zone Jan 11, 2017 Toronto, Ontario, Canada Listed: RUP-TSX-V January 10, 2017 Rupert
ET and and and
 NEWS RELEASE Oceanus Intersects 110 Meters of 0.79 g/t Gold Equivalent Consisting of 0.6 g/t Gold and 14.5 g/t Silver at its El Tigre Property in Sonora, Mexico HALIFAX, NOVA SCOTIA December 14, 2016 Oceanus
News Release No GOLD AND COPPER MINERALIZATION DISCOVERED DURING PHASE 2 EXPLORATION AT THE MCBRIDE PROPERTY
 November 19, 2018 TSX Venture Exchange Listed Frankfurt Exchange Listed News Release No. 303-2018 GOLD AND COPPER MINERALIZATION DISCOVERED DURING PHASE 2 EXPLORATION AT THE MCBRIDE PROPERTY Vancouver,
Great Atlantic Rock Samples Return up to 5.8 oz. / ton Gold Golden Promise Property in Central Newfoundland
 Great Atlantic Rock Samples Return up to 5.8 oz. / ton Gold Golden Promise Property in Central Newfoundland FOCUSED ON EXPLORING ATLANTIC CANADA (TSXV : GR) (FRA: PH01) VANCOUVER, British Columbia August
Detour Gold Reports Drilling Results from Lower Detour
 December 17, 2015 NEWS RELEASE Detour Gold Reports Drilling Results from Lower Detour Detour Gold Corporation (TSX: DGC) ( Detour Gold or the Company ) reports final results from its 2015 summer drilling
Cove Gold Project 2201 Discovery Update, May 2014
 Proven Management Proven Gold Districts Safe Jurisdictions Cove Gold Project 2201 Discovery Update, May 2014 Symbol: Exchange: PG TSX 1-888-346-1390 DISCLAIMER: This presentation may contain "forward looking
GOLDEN MINERALS DISCOVERS ADDITIONAL HIGH GRADE VEINS AT SANTA MARIA RESULTS UP TO 1.88 g/t Au and 648 g/t Ag
 GOLDEN MINERALS DISCOVERS ADDITIONAL HIGH GRADE VEINS AT SANTA MARIA RESULTS UP TO 1.88 g/t Au and 648 g/t Ag Golden, Colorado /Globe Newswire/ July 12, 2018 Golden Minerals Company (NYSE American and
Probe Metals Intersects 1,122 g/t Gold Over 0.7 Metres in New Zone at Val-d Or East
 NEWS RELEASE 06/2017 Symbol: TSX-V: PRB Shares Issued: 92,851,188 Probe Metals Intersects 1,122 g/t Gold Over 0.7 Metres in New Zone at Val-d Or East Toronto, March 6, 2017 PROBE METALS INC. (TSX-V: PRB)
PELANGIO ENTERS OPTION AGREEMENT TO ACQUIRE KEIGAT LAKE AREA CLAIMS SURROUNDING THE BIRCH LAKE PROPERTY
 Pelangio Exploration Inc. 82 Richmond Street East, Toronto, ON M5C 1P1 Tel: 905-336-3828 Fax: 905-336-3899 NEWS RELEASE PELANGIO ENTERS OPTION AGREEMENT TO ACQUIRE KEIGAT LAKE AREA CLAIMS SURROUNDING THE
NEWS RELEASE ORCA GOLD INDICATED AND INFERRED RESOURCES AT BLOCK 14 INCREASE BY 24% AND 48% RESPECTIVELY
 Orca Gold Inc., 2000-885 West Georgia St., Vancouver, B.C., V6C 3E8, Canada Tel: +1 604 689 7842 Fax: +1 604 689 4250 NEWS RELEASE ORCA GOLD INDICATED AND INFERRED RESOURCES AT BLOCK 14 INCREASE BY 24%
OSISKO INTERSECTS 115 g/t Au OVER 8.4 METRES AT LYNX. Interval (m)
") OSISKO INTERSECTS 115 g/t Au OVER 8.4 METRES AT LYNX Infill Drilling Continues to Encounter High-Grade Gold (Toronto, April 26, 2018) Osisko Mining Inc. (OSK:TSX. "Osisko" or the "Corporation") is pleased
OSISKO INTERSECTS 115 g/t Au OVER 8.4 METRES AT LYNX Infill Drilling Continues to Encounter High-Grade Gold (Toronto, April 26, 2018) Osisko Mining Inc. (OSK:TSX. "Osisko" or the "Corporation") is pleased
Goldplay President and CEO Marcio Fonseca commented
 February 7, 2019 GOLDPLAY ANNOUNCES ITS MAIDEN MINERAL RESOURCE, CONTAINING 36 MILLION Oz AgEq (INDICATED) AND 11 MILLION Oz AgEq (INFERRED), AT THE SAN MARCIAL PROJECT Vancouver, BC - Goldplay Exploration
NEWS RELEASE. Evrim commences drilling at Cerro Cascaron gold and silver project with partner Harvest Gold
 910 850 WEST HASTINGS ST. VANCOUVER, BC, CANADA V6C 1E1 TEL: 604.248.8648 FAX: 604.248.8663 WWW.EVRIMRESOURCES.COM TSX V: EVM CONTACT: PADDY NICOL OR CHARLES FUNK NEWS RELEASE Evrim commences drilling
COMPASS GOLD: SOIL GEOCHEMICAL SURVEY IDENTIFIES INTENSE GOLD ANOMALIES COINCIDENT WITH CRUSTAL-SCALE FAULTS ON SANKARANI PERMIT
 COMPASS GOLD: SOIL GEOCHEMICAL SURVEY IDENTIFIES INTENSE GOLD ANOMALIES COINCIDENT WITH CRUSTAL-SCALE FAULTS ON SANKARANI PERMIT Toronto, Ontario, May 31, 2018 Compass Gold Corp. (TSX-V:CVB) (Compass or
TECHNICAL REPORT ON THE BLACK CREEK PROPERTY FOR CARRIE ARRAN RESOURCES BLACK TOWNSHIP LARDER LAKE MINING DIVISION ONTARIO
 TECHNICAL REPORT ON THE BLACK CREEK PROPERTY FOR CARRIE ARRAN RESOURCES BLACK TOWNSHIP LARDER LAKE MINING DIVISION ONTARIO B.J. McKay, 8 February 2011 Keewatin, Ontario TECHNICAL REPORT BJML 2011 Table
Abzu Gold Options 10 Red Back Ghanaian Gold Concessions From Kinross Gold Corp
 TSXV: ABS June 29, 2011 For Immediate Release NR11 07 Abzu Gold Options 10 Red Back Ghanaian Gold Concessions From Kinross Gold Corp (Vancouver, June 29, 2011) Abzu Gold Ltd. (TSXV: ABS OTCQX: ABZUF) (
V Sample from C.O.D vein 15 metres southwest of V
 TSX-V: GGX Gold Drop Property Multiple Gold Bearing Rock Samples including 19.6 g/t Gold at Historic C.O.D Shaft And 14.1 g/t Gold at New Vein Showing Greenwood BC Vancouver, British Columbia June 8, 2017
BALMORAL ANNOUNCES SIGNIFICANT GOLD DISCOVERY ON DETOUR GOLD TREND IN QUEBEC
 TSXV: BAR July 7, 2011 For Immediate Release NR11-14 BALMORAL ANNOUNCES SIGNIFICANT GOLD DISCOVERY ON DETOUR GOLD TREND IN QUEBEC INTERSECTS 6.15 g/t GOLD OVER 4.04 METRES AND 4.18 g/t GOLD OVER 5.00 METRES
GRAPHITE ONE DRILLS 165.3M of 4.23% GRAPHITE INCLUDING 46.4M OF 6.6%, 14.3M of 10.1% and 21M of 10.1% GRAPHITE
 GRAPHITE ONE DRILLS 165.3M of 4.23% GRAPHITE INCLUDING 46.4M OF 6.6%, 14.3M of 10.1% and 21M of 10.1% GRAPHITE August 7, 2012 - Calgary, Alberta Graphite One Resources Inc. (GPH: TSX- V, GPHOF: OTCQX)
GOLDPLAY OUTLINES FIVE NEW EXPLORATION TARGETS AT THE SAN MARCIAL PROJECT IN MEXICO
 January 18, 2019 GOLDPLAY OUTLINES FIVE NEW EXPLORATION TARGETS AT THE SAN MARCIAL PROJECT IN MEXICO Vancouver, BC - Goldplay Exploration Ltd. (TSXV: GPLY, FRANKFURT: GPE, OTCQB: GLYXF) ( Goldplay or the
MCEWEN MINING ANNOUNCES EXPLORATION UPDATE FOR EL GALLO 1, MEXICO
 MCEWEN MINING ANNOUNCES EXPLORATION UPDATE FOR EL GALLO 1, MEXICO TORONTO, ONTARIO - (April 21, 2015) - McEwen Mining Inc. (NYSE: MUX) (TSX: MUX) is pleased to announce drill results that we expect will
OSISKO INTERSECTS 36 g/t Au OVER 6.9 METRES AT LYNX
 OSISKO INTERSECTS 36 g/t Au OVER 6.9 METRES AT LYNX (Toronto, September 18, 2017) Osisko Mining Inc. (OSK:TSX. "Osisko" or the "Corporation") is pleased to provide new results from the ongoing drill program
JUNE 25, 2015 TSX: WDO
 JUNE 25, 2015 TSX: WDO PRESS RELEASE WESDOME CONFIRMS CONTINUITY OF THE S50 EAST AND PRESQU ILE ZONES AT VAL D OR PROPERTIES Hole S783 intersects 89.72 g Au/tonne over 3.1 metres Toronto, Ontario June
GOLDPLAY ANNOUNCES FURTHER SAMPLING RESULTS FROM SAN MARCIAL HISTORICAL CORE; CONFIRMS OPEN PIT TARGET NEAR SURFACE WITH gpt AgEq.
 GOLDPLAY ANNOUNCES FURTHER SAMPLING RESULTS FROM SAN MARCIAL HISTORICAL CORE; CONFIRMS OPEN PIT TARGET NEAR SURFACE WITH 46.0 METERS @ 129 gpt AgEq. August 28, 2018, Vancouver, BC - Goldplay Exploration
2. The latter two intersections occur outside the presently defined mineral resource.
 Avidian Drills 67 m of 4.93 g/t Au, includes 39.8 m of 7.54 g/t Au, at Golden Zone Property, Alaska & Discovers New Zone Northeast of the Breccia Pipe Deposit (Toronto, Ontario January 18, 2018) Avidian
Skeena Intersects g/t AuEq over metres at Eskay Creek
 NR: 19-01 January 15, 2019 Skeena Intersects 30.99 g/t AuEq over 14.72 metres at Eskay Creek Vancouver, BC (January 15, 2019) Skeena Resources Limited (TSX.V: SKE, OTCQX: SKREF) ( Skeena or the Company
Marathon Announces Discovery of New High-Grade Gold Zone in Marathon Area and Sprite Zone Drilling Results, Valentine Lake Gold Camp
 Marathon Announces Discovery of New High-Grade Gold Zone in Marathon Area and Sprite Zone Drilling Results, Valentine Lake Gold Camp TORONTO, ON October 8, 2014 - Marathon Gold Corporation ( Marathon or
NEWS RELEASE November 5, 2018
 NEWS RELEASE 18-22 November 5, 2018 Liberty Gold Extends Goldstrike Deposit Trend 300 Metres to the Southwest 0.72 g/t over 76.2 m including 1.26 g/t over 6.1 m 0.98 g/t over 15.2 m and 0.81 g/t over 27.4
COMPASS GOLD: DRILLING SUCCESS AT FIRST OUASSADA BEDROCK GOLD TARGETS
 COMPASS GOLD: DRILLING SUCCESS AT FIRST OUASSADA BEDROCK GOLD TARGETS Toronto, Ontario, January 10, 2019 Compass Gold Corp. (TSX-V: CVB) (Compass or the Company) is pleased to provide an update on the
Corvus Gold Drills g/t Gold, Extends Mother Lode Sediment Hosted Gold System to at Least 450 Metres Along Strike
 Suite 1750, 700 West Pender St. Vancouver, British Columbia CANADA V6C 1G8 TSX: KOR OTCQX: CORVF Tel: (604) 638-3246 Toll Free: 1-844-638-3246 info@corvusgold.com www.corvusgold.com NR17-19 December 12,
SABINA GOLD &SILVER REPORTS COMPLETION OF DRILLING AT ECHO DEPOSIT, BACK RIVER, NUNAVUT.
 202-930 West First Street, North Vancouver, B.C. 604.998.4175 July 31, 2014 SBB NR-14-10 SBB TSX SABINA GOLD &SILVER REPORTS COMPLETION OF DRILLING AT ECHO DEPOSIT, BACK RIVER, NUNAVUT. 2014 Drilling confirms
Surface Trenching Highlights. Santos Target. To (m) Width (m) Au (g/t) Comment. (m) Santos (1)-includes internal dilution
 Width (m) Au (g/t) Comment. (m) Santos (1)-includes internal dilution") Goldplay Exploration announces surface trenching program results to date at the 100% owned El Habal Property: including 130 meters grading 1.86 g/t Au, 100 meters grading 1.20 g/t Au, 90 meters grading
Goldplay Exploration announces surface trenching program results to date at the 100% owned El Habal Property: including 130 meters grading 1.86 g/t Au, 100 meters grading 1.20 g/t Au, 90 meters grading