AN ABSTRACT OF THE THESIS OF
|
|
|
- Hollie Russell
- 6 years ago
- Views:
Transcription
1
2 AN ABSTRACT OF THE THESIS OF James Michael Eller for the degree of Master of Science in Civil Engineering presented on June 2, Title: Predicting Pore Pressure Response in In-Situ Liquefaction Studies using Controlled Blasting Abstract approved: Scott A. Ashford Originally used as a method to densify loose soils, controlled blasting has expanded its applicability to geotechnical engineering by becoming a research tool to physically generate liquefaction for full-scale in-situ tests, ranging from seismic performance of deep foundations to evaluating ground improvement techniques. Current methods used to design the blasting layout (i.e. charge weight, placement, etc.) rely upon empirical models that typically do not consider in-situ soil conditions in predicting pore pressure response. In addition, these empirical models were developed for single blasts whereas current blasting studies rely upon the use of multiple blasts in loading the soil. Through the investigation of several controlled blasting case histories, a statistical analysis was performed on the recorded blasting results and in-situ soil data to observe if in-situ soil conditions significantly influence the generation of residual pore pressures for both single and multiple blasts. Based upon the study, it was found that the development of residual pore pressure during multiple blasts is highly influenced by the initial in-situ soil conditions and should be accounted for in predicting pore pressure response. Several multiple regression analyses were performed to identify which in-situ soil properties should be considered in an empirical model that predicts the blastinduced residual pore pressure. It was found that the best model was as a function of the blasting layout and the initial soil conditions represented by the SPT (N 1) 60 blow counts
3 and the effective overburden pressure, σ v0, expressed in kpa. The model was evaluated on case history data and it was found to be valid for blasting layouts that are relatively simple (i.e. square grid or circular array with less than 30 charges), but became unreliable for complex blasting layouts consisting of many charges (more than 30) or erratic blasting patterns. In addition, it was found that the model was statistically acceptable to be used for single blasts as well. The new empirical model estimates the extent of liquefaction and residual pore pressure for both single and multiple blasts and can be used in design of future blasting studies. Although the empirical model has yet to be validated from experimental field tests, it is anticipated that this model could be a step in the development of energy-based design for assessing liquefaction potential and in performing ground improvement evaluations. As more blasting studies are being performed, the model is expected to be refined and improved with the increase in case history data.
4 Copyright by James Michael Eller June 2, 2010 All Rights Reserved
5 PREDICTING PORE PRESSURE RESPONSE IN IN-SITU LIQUEFACTION STUDIES USING CONTROLLED BLASTING by James Michael Eller A THESIS submitted to Oregon State University in partial fulfillment of the requirements for the degree of Master of Science Presented June 2, 2010 Commencement June 2011
6 Master of Science thesis of James Michael Eller presented on June 2, 2010 APPROVED: Major Professor, representing Civil Engineering Head of the School of Civil and Construction Engineering Dean of the Graduate School I understand that my thesis will become part of the permanent collection of Oregon State University libraries. My signature below authorizes release of my thesis to any reader upon request. James Michael Eller, Author
7 ACKNOWLEDGEMENTS In the development and completion of this thesis, I would like to acknowledge the key players that made this task successful and enjoyable: My advisor, Professor Scott Ashford, who gave me the opportunity to work with him and take on this project The National Science Foundation (Award No ), that provided funding for the project. Dr. Yohskue Kawamata, who served as my Rosetta Stone in translating technical documents from Japanese to English. All the talented engineers and researchers that participated in the Ishikari Liquefaction Field Test with the Port and Airport Research Institute (PARI), Japan, and shared their research with me at the U.S/Japan Workshop on Controlled Blasting at Oregon State University in September The great group of Geotech faculty and graduate students here at Oregon State University of past and present that I had the opportunity to work with. The incredible support and encouragement from my family and friends.
8 TABLE OF CONTENTS Page 1.0 Introduction Seismic Design for Liquefaction Statement of Objectives Scope of Work Literature Review Controlled Blasting History of Blasting in Civil Projects Blast Design Instrumentation Pore Pressure Response During Blasting Factors Affecting Pore Pressure Generation Predicting Pore Pressure Response During Blasting Motivation for Research Materials and Methods Introduction Accounting for Multiple Blasts Port of Ishikari, Japan Site Conditions and Test Layout Test Results Vancouver, British Columbia, Canada, Site Conditions and Blasting Layout Test Results Maui, Hawaii, Site Conditions and Blasting Layout Test Results... 37
9 TABLE OF CONTENTS (Continued) Page 3.5 Port of Tokachi, Hokkaido Island, Japan, Site Conditions and Blasting Layout Test Results Vancouver, British Columbia, Canada, Site Conditions and Blasting Layout Test Results San Francisco, California, Site Conditions and Blasting Layout Test Results Fort McMurray, Alberta, Canada, Site Conditions and Blasting Layout Test Results South Platte River, Colorado, Site Conditions and Blasting Layout Test Results Results Pore Pressure Results From Case Histories Evaluation of Existing Empirical Models Single Blast Comparison to Empirical Model Comparison of Multiple Blasts to Empirical Model Development of a New Empirical Model Pore Pressure Effect due to Relative Density Multiple Regression Analysis Empirical Model for Multiple Blasts Empirical Model for Single Blasts Discussion Validating Empirical Models Evaluation of Empirical Model for Multiple Blasts... 76
10 TABLE OF CONTENTS (Continued) Page Maui Comparison Vancouver Comparison Tokachi Comparison Ishikari Comparison Overall Evaluation of Empirical Model for Multiple Blasts Evaluation of Empirical Model for Single Blasts Multiple Blast Model and Single Blast Model Comparison Design Example Limitations and Considerations Summary and Conclusions Summary of Work Performed Summary of Results and Lessons Learned Future Work and Research Bibliography Appendices Appendix A Site & Test Information for Case Histories A.1 Port of Ishikari, Hokkaido Island, Japan A.2 Vancouver, British Columbia, Canada, A.3 Maui, Hawaii, A.4 Port of Tokachi, Hokkaido Island, Japan A.5 Treasure Island, San Francisco, California Appendix B Blasting and In-Situ Data B.1 Multiple Blasts B.2 Single Blasts
11 TABLE OF CONTENTS (Continued) Page Appendix C Statistical Regression Analysis C.1 Multiple Blasts: Logarithmic-Based Multiple Regression Analysis C.2 Multiple Blasts: Power-Based Multiple Regression Analysis C.3 Single Blasts: Logarithmic-Based Multiple Regression Analysis C.4 Single Blasts: Power-Based Multiple Regression Analysis
12 LIST OF FIGURES Figure Page Figure 2-1 Generalized Wave Paths from an Explosion Figure 2-2 Pore pressure response stages during blasting Figure 2-3 Sand Boil due to liquefaction during Tokachi blasting study Figure 2-4 Studer and Kok (1980) empirical model Figure 2-5 Empirical models for predicting Ru for single blasts (assuming an initial effective vertical stress of 50 kpa) Figure 2-6 Empirical Models predicting Ru for single blasts (Studer & Kok 1980) and multiple blasts (Rollins et al. 2004) Figure 3-1 Blasting layout from example blasting study Figure 3-2 Pore pressure time history from example blasting study Figure 3-3 Residual pore pressure, Ru, vs. scaled distance for example blasting study Figure 3-4 Typical Soil Profile for Ishikari Blasting Study Figure 3-5 Blasting Layout for Ishikari Pilot Study Figure 3-6 Blasting Layout for Ishikari Full-Scale Blasting Study Figure 3-7 Maximum Residual Porewater Pressure Ratios from Ishikari Pilot Study P2 and Full-Scale Study Figure 3-8 Typical Soil Profile for Vancouver, British Columbia Blasting Study Figure 3-9 Blasting Layout for Pilot Study at Vancouver, British Columbia Test Figure 3-10 Sequential Change in Residual Porewater Pressure Ratio, Ru, with respect to Scaled Distance from Vancouver Blasting Study Figure 3-11 Typical Soil Profile for Maui Blasting Study Figure 3-12 Blasting and Instrumentation Layout at Maui (distances in meters)... 36
13 List of Figures (Continued) Page Figure 3-13 Residual Pore Pressure Response vs. Scaled Distance for Maui Blasting Study Figure 3-14 Typical Soil Profile for Tokachi Blasting Study Figure 3-15 Blasting Layout and Sequence during Tokachi Full-Scale Blast # Figure 3-16 Pore Pressure Transducer Layout during Tokachi Full-Scale Blast # Figure 3-17 Residual Pore Pressures vs. Scaled Distance during Tokachi Blasting Study, Pilot Test Figure 3-18 Residual Pore Pressures vs. Scaled Distance during Tokachi Blasting Study, Full-Scale Test # Figure 3-19 Typical Soil Profile for Delta, British Columbia Blasting Study Figure 3-20 Blasting and Instrumentation Layout at Delta, British Columbia Study Figure 3-21 Maximum Residual Pore Pressure Ratio vs. Scaled Distance for Delta, British Columbia Blasting Study Figure 3-22 Typical Soil Profile for Treasure Island, California Pilot Study Figure 3-23 Blasting and Instrumentation Layout for Treasure Island Pilot Study Figure 3-24 Maximum Pore Pressure Ratio vs. Scaled Distance for Treasure Island Pilot Study Figure 3-25 Blasting Layout for CANLEX Blast Testing, Blast #2 Pathirage Figure 3-26 Blasting Layout for CANLEX Blast Testing, Blast #6 Pathirage Figure 3-27 Pore Pressure Ratio vs. Scaled Distance at CANLEX Figure 3-28 Typical Soil Profile for South Platte River Study Figure 3-29 Blasting and Instrumentation Layout for South Platte River Liquefaction Study (from Charlie et al. 1992) Figure 3-30 Measured residual PPR vs. scaled distance in South Platte River blasting study... 58
14 List of Figures (Continued) Page Figure 4-1 Pore Pressure Response vs. Scaled Distance for Multiple Blasts Figure 4-2 Pore Pressure Response vs. Scaled Distance for Single Blasts Figure 4-3 Studer & Kok (1980) and Rollins et al. (2004) empirical models compared with single and multiple blasts results Figure 4-4 Residual Plot of Single Blasts Data to Studer and Kok (1980) model Figure 4-5 Residual Plot of Single Blasts Data to Studer and Kok (1980) model Figure 4-6 Multiple Blasts comparison to existing empirical models and observed trend lines Figure 4-7 Residual Plot of Multiple Blasts Data to Studer and Kok (1980) model and Rollins et al. (2004) model Figure 4-8 Pore pressure response for multiple blasts categorized by relative density.. 66 Figure 4-9 Pore pressure response from single blasts categorized by relative density Figure 4-10 Log-based Empirical Model developed for Multiple Blasts (shown with 95% confidence limits) Figure 4-11 Power-based Empirical Model developed for Multiple Blasts (shown with 95% confidence intervals) Figure 4-12 Comparison of Logarithmic Model and Power Model for Multiple Blasts Figure 4-13 Residual plot for log-based and power-based empirical models Figure 4-14 Empirical Model for Single Blasts shown with 95% confidence intervals Figure 5-1 Comparison of the Empirical Model to the Maui Blasting Study Figure 5-2 Residual plot of Blast #1 and Blast #2 of Maui Blasting Study Figure 5-3 Comparison of empirical model to Vancouver pilot study with incremental values shown Figure 5-4 Residual plot from Vancouver Pilot Test compared to scaled distance Figure 5-5 Residual plot from Vancouver Pilot Test compared to observed Ru... 81
15 List of Figures (Continued) Page Figure 5-6 Comparison of the empirical model to the Tokachi pilot study Figure 5-7 Residual plot of the Tokachi full-scale blast #1 compared to scaled distance (categorized by depth of pore pressure transducer) Figure 5-8 Residual plot of the Tokachi full-scale blast #1 compared to observed Ru (categorized by depth of pore pressure transducer) Figure 5-9 Comparison of empirical model to Ishikari pilot test Figure 5-10 Residual plot of Ishikari pilot study and full-scale test to empirical model compared to scaled distance Figure 5-11 Residual plot of Ishikari pilot study and full-scale test to empirical model compared to observed Ru Figure 5-12 Comparison of empirical model for single blasts to existing models Figure 5-13 Comparison of empirical model for single blasts with existing models with recorded case history data Figure 5-14 Comparison of empirical model for single blasts with existing models with recorded case history data Figure 5-15 Comparison of residual plot of empirical model for multiple blasts and Studer and Kok (1980) with single blasts data compared to scaled distance Figure 5-16 Comparison of residual plot of empirical model for multiple blasts and Studer and Kok (1980) with single blasts data compared to observed Ru. 92 Figure 5-12 Blasting Layout and Soil Profile used for Example Design Problem Figure 5-13 Multiple Blasts Design Chart for Example Problem... 96
16 LIST OF TABLES Table Page Table 3.1 Selected Blast-Induced Liquefaction Studies Table 3.2 Analysis of results from example blasting study Table 3.3 Ishikari Pilot Study Blasting Details Table 3.4 Residual Pore Pressure Results during Maui Blasting Study Table 3.5 Maximum Residual Pore Pressures during Tokachi Full-Scale Test # Table 3.6 Residual Pore Pressure Measurements during TILT Pilot Study Table 3.7 Soil Conditions for CANLEX study Table 3.8 Peak Residual Pore Pressure Readings during CANLEX study Table 3.9 Laboratory Test Results for South Platte River Study Table 3.10 Peak Residual Pore Pressure Readings during South Platte test Table 4.1 Parameters and Adjusted Correlation Coefficient using in Multiple Regression Analysis for Multiple and Single Blasting Data Table 5.1 Evaluation of Empirical Model to Maui Blasting Study for both blasts Table 5.2 Statistical Evaluation of Empirical Model to Vancouver Pilot Study Table 5.3 Statistical Evaluation of Empirical Model to Tokachi Pilot Study Table 5.4 Statistical Evaluation of Empirical Model to Ishikari Pilot and Full-Scale Study Table 5.5 Statistical Evaluation of Studer and Kok (1980) model to Single Blasts Case History Data Table 5.6 Statistical Evaluation of empirical model for multiple blasts to Single Blasts Case History Data... 94
17 DEDICATION To my wife, Allison, who has been willing to share life s adventures with me and encourages me so much along the way. To my daughter, Dayvanee and son, Asher, who constantly remind me how exciting the simple things of life can be. To my mother, Barbara, for all the sacrifices she gave to help make sure her son was able to pursue a higher education.
18 PREDICTING PORE PRESSURE RESPONSE IN IN-SITU LIQUEFACTION STUDIES USING CONTROLLED BLASTING 1.0 INTRODUCTION Earthquake effects require the most careful attention of the design engineer [where] failures in previous earthquakes provides little ground for complacency. - Seed and Whitman, SEISMIC DESIGN FOR LIQUEFACTION The 1995 Hyogoken-Nanbu earthquake in Kobe, Japan on January 17, 1995 (M w 6.9) tested the resiliency of a nation with modern seismic design codes. Due to strong ground motions, liquefaction occurred and caused major damage to ports, highways, and other critical infrastructure. Many lives were lost as collapsed highway bridges prevented emergency crews from reaching victims. The total aftermath of the earthquake left over 6,300 people dead and over $200 billion in economic losses, with a significant portion of the loss due to damage from liquefaction (Schiff 1988). Liquefaction began to primarily develop as an important seismic design issue for geotechnical engineers following the 1964 earthquakes in Anchorage, Alaska and Niigata, Japan. Earthquake-induced liquefaction is a transformation of a granular material from a solid to a liquefied state as a consequence of increased pore-water pressure and reduced effective stress induced by the tendency of [loose] granular materials to compact when subjected to cyclic shear deformations (Youd et al. 2001). It can cause significant loss in soil strength, resulting in foundation failures, slope failures, or lateral spreading of soil. Liquefaction is a seismic hazard that becomes a risk when infrastructure is threatened. As urban development and infrastructure within liquefaction-susceptible areas increases, such as in the seismically-active San Francisco Bay area or along the urban coastline of Japan, liquefaction increasingly presents a risk to the lives and economies of the population in such areas.
19 2 A major concern when dealing with liquefaction is how to minimize damage to lifelines and maintain performance immediately following an earthquake. Lifelines are defined as the systems and facilities that provide services vital to the function of an industrialized society and [are] important to the emergency response and recovery of a national disaster (TCLEE 2010). These systems and facilities include communication, power (electric, liquid fuel, and natural gas), water (clean and wastewater), and transportation (airports, highways, ports, rail and transit). Liquefaction can cause loss or damage of these lifelines, thus impeding emergency response and disaster relief following an earthquake, in addition to the disruption of the normal, day-to-day activities of a society, as witnessed in the 1995 Hyogoken-Nanbu earthquake in Kobe, Japan. Another sobering example is from the 1906 San Francisco earthquake (estimated M7.9) where liquefaction caused significant ground settlement, rupturing gas lines and waterlines that resulted in uncontested fires that destroyed most of the city and claimed nearly 3,000 lives, approximately 8% of the city s population at the time (USGS 2009). Liquefaction is a serious threat to our infrastructure, and with lifelines playing such a vital role in the response effort following an earthquake, there is no room for engineers to exhibit complacency in seismic design. The current approach to liquefaction design follows three questions, as described by Kramer (2008): 1. Is the soil susceptible to liquefaction? 2. Is the anticipated seismic loading sufficient to initiate liquefaction? 3. What will the effects of liquefaction be? Much research has been performed in each of these areas, but continued research is necessary to improve our understanding and design techniques. For example, the current technique to assess a soil s resistance to liquefaction under seismic loading has been developed through post-earthquake reconnaissance investigations, laboratory testing, numerical studies, and in-situ testing. However, many of these research methods generally provide results assuming ideal or simplified conditions, which do not always represent actual field conditions. Laboratory testing uncertainties include sample
20 3 disturbance, sample size, and misrepresentation of the existing conditions of the site, in addition to human error. Empirical correlations to estimate a soil s resistance to liquefaction have been developed based upon in-situ index tests such as penetration resistance measurements (i.e. SPT, CPT) or shear wave velocities, but they are generally applicable to clean sands or silty sands, becoming unreliable for gravels and clays that have shown to also be susceptible to liquefaction-type behavior (Bray and Sancio 2006). Therefore, to minimize uncertainties and limitations, in-situ assessment techniques using dynamic testing have been developed to evaluate liquefaction susceptibility. Testing the liquefaction susceptibility of the soil in its in-situ state is highly advantageous as it removes sample disturbance effects and accounts for the existing stress conditions, the location of groundwater table, and the soil heterogeneity of the site. Ideally, through the use of a dynamic source, all soil types could be investigated, minimizing the need to idealize any of the site conditions or behavior of the test. Current methods used in performing in-situ liquefaction tests include vibroseis and controlled blasting. Vibroseis uses controlled vibrations to induce shear strains in the soil, creating pore pressure buildup. The Civil Engineering Department at the University of Texas at Austin has performed small-scale in-situ liquefaction tests using vibroseis to cause strain-controlled pore pressure response (Chang et al. 2007). Controlled blasting has also been used to perform liquefaction evaluations as a means of supplementing other methods (Rollins et al. 2004, Gohl et al. 2009). Through the use of blasting, excess pore pressure can be generated through the shock wave of the blast, eventually building up to liquefaction. Blasting was originally used as a ground improvement method to densify loose soils and later expanded its applicability by becoming a research tool in performing full-scale seismic experiments. One of the first full-scale blast-induced liquefaction experiments was conducted in the San Francisco Bay area in California by Ashford et al. (2004) to induce liquefaction for estimating the lateral load capacity of deep foundations in liquefied sands.
21 4 The current standard of practice in designing these tests is to use empirical models to design a pilot study that will in turn identify the optimal layout (i.e. single or multiple blasts, blasting depth, charge weight, number of blasts) to liquefy the target area. The empirical methods currently in place predict residual pore pressure response with the total weight of explosives and distance between the explosives and area of interest. However, these methods do not consider soil conditions, limiting their applicability to the conditions from which they were developed. If a test were designed using these methods and the soil was different than the conditions in which the empirical methods are based upon, then the residual pore pressure may be inaccurately predicted, requiring additional trial and error tests to determine the optimal blasting layout. In addition, most empirical models are based upon single blasts, whereas current blasting projects utilize multiple blasts. Although the amount of total energy may be the same between the single and multiple blasts, the pore pressure response can be different. 1.2 STATEMENT OF OBJECTIVES Controlled blasting has developed to be a viable research tool and ground improvement technique in liquefaction-related studies in geotechnical engineering. However, to promote further use and development of controlled blasting, it would be beneficial to predict excess pore pressure response with blasting as a function of not only the blasting layout but the soil conditions as well. In addition, understanding the effect of multiple blasts versus single blasts on excess pore pressure response would provide insight in to determining a blasting layout to induce liquefaction. Generation of excess pore pressure is the means from which liquefaction is able to occur, and a model that can more accurately predict these pore pressures would prove to be highly useful to future blasting studies used for liquefaction evaluations, full-scale testing, and/or even ground improvement methods. Based upon the understanding that in-situ conditions play a significant role in pore pressure generation in earthquake-induced liquefaction, the goal of this research is to evaluate if blast-induced pore pressures can be predicted based upon blasting layout and in-situ parameters. This is answered by the following objectives:
22 5 a) Develop a standard method to evaluate the effect of multiple blasting in regard to the generation of residual pore water pressure. b) Perform multiple linear regression analysis to determine the in-situ parameters to be considered in an improved empirical model for single and multiple blasts. c) Validate the models for single and multiple blasts through statistical evaluations. These objectives meet the primary goal of the National Science Foundation Grant # of increasing our knowledge of blast-induced liquefaction. This will help assess whether controlled blasting is appropriate for use in physically modeling earthquake-induced liquefaction, as well as give insight into the possible development of using controlled blasting as an assessment tool to supplement existing liquefaction assessment methods. In addition, this project is intended to increase and promote collaboration with U.S. and Japanese researchers, as it was initiated following a large research project involving U.S. and Japanese participants in Japan in SCOPE OF WORK The remaining chapters of this thesis are organized as follows: Chapter 2, the Literature Review section, provides background on liquefaction and pore pressure development for both earthquake-induced liquefaction and blast-induced liquefaction, with a summary of existing empirical models used to predict blast-induced pore pressure. Chapter 3 is the Materials and Methods section, and summarizes select blast-induced liquefaction case histories, presenting the site characteristics, blasting layout, and pore pressure responses of each test. In this chapter a standard method of accounting for multiple blasts in residual pore pressure development is also presented. Chapter 4 presents the results of the analyses, including the empirical models developed for single and multiple blasts from the research. Chapter 5 provides a discussion of the results, including an evaluation of the validity of the newly developed empirical models through comparisons with existing models and case history data. Chapter 6 concludes the research by summarizing the work performed and results, as well as recommendations for possible future work to increase our insight into developing blasting as an in-situ liquefaction assessment tool.
23 6 2.0 LITERATURE REVIEW Liquefaction is one of the most important, interesting, complex, and controversial topics in geotechnical earthquake engineering. Steven L. Kramer, Geotechnical Earthquake Engineering (1996) 2.1 CONTROLLED BLASTING The use of controlled blasting in civil engineering construction has been used since the 1930 s as a ground improvement method to densify sandy soils to increase bearing capacity, decrease hydraulic conductivity, reduce settlements, and even to increase liquefaction resistance (Narin van Court and Mitchell 1994). Commonly referred to as explosive compaction, this ground improvement technique densifies soil by causing localized liquefaction through compressive shock waves breaking down the soil matrix. Just as in earthquake-induced liquefaction, as the soil matrix collapses, excess pore pressures are generated, reducing the strength of the soil and ultimately causing the soil to behave more like a liquid. As the excess pore pressures begin to dissipate, the soil grains reorganize and settle, forming a new soil skeleton that becomes increasingly denser as additional settlement (compression) occurs during the regaining of effective stresses (Narsilo et al. 2009). Blasting has been used as a cost-effective method to mitigate liquefaction-susceptible soils, particularly clean to silty sands with relative densities less than 50%, up to 40 m in depth (Dickenson et al. 2002, Mitchell 2008, Narsilio et al. 2009) History of Blasting in Civil Projects In 1936, Russian engineers attempted to densify loose soils beneath a railway embankment in the former Soviet Union (Ivanov 1967). Although the target soil was densified, the project was deemed unsuccessful due to extensive cracking in the overlying soils (Narin van Court and Mitchell 1994). Blasting to densify soils was later used successfully in the U.S. when foundation soils beneath the Franklin Falls Dam in New Hampshire were densified (Lyman 1942). Later, blasting was performed to densify loose soils at depths up to 40 m beneath the Jebba Dam Hydroelectric plant in Nigeria (Solymar 1984). Blasting was used to densify loose soils deposited during the Mt. St.
24 7 Helens eruption in order to reduce the liquefaction potential of the soil underlying Spirit Lake Highway (Kimmerling 1994). Recently, blasting has been used to densify mine tailings within aggregate ponds to increase storage capacity and reduce the liquefaction potential of the tailings (Gohl et al. 2009). In the 1970 s and 1980 s, controlled blasting studies transitioned from ground improvement studies to military-based research. During the midst of the Cold War, research studies were motivated through military interest into understanding the threat that a large explosion poses to infrastructure founded on liquefiable soils (Fragaszy and Voss, 1986). Controlled blasting experiments using both nuclear and high-energy chemical explosives were performed to investigate the range of liquefaction based upon the energy of the explosive (Charlie et al. 1988a). Recently, controlled blasting has been used to physically model liquefaction for largeand full-scale in-situ experiments. Ashford et al. (2004) used controlled blasting to liquefy sandy soils in order to gain insight into the behavior of piles in liquefied sands. The Port and Airport Research Institute (PARI) of Japan performed several blasting studies to investigate the performance of lifelines in liquefied soils, such as pipelines and airport infrastructure (Sugano et al., 2002, PARI 2009). Blasting has been considered as a means to perform an in-situ assessment of the liquefaction potential of soils. Rollins et al. (2004) and Gohl et al. (2001) discuss the use of blasting to perform in-situ liquefaction evaluations as a supplement to existing methods, but this is still in the development stage. Additional blast-induced liquefaction studies have also been performed and are presented in Chapter BLAST DESIGN A blasting program typically consists of charges placed in a grid when a large unit of soil is being liquefied, or a circular array can be used when the center of the testing area is the primary target area, such as testing vertical drains in mitigating pore pressures (Rollins 2004). In blasting studies, a sequence of multiple charges has been found to be more effective in generating residual pore pressures than an energy-equivalent single
25 8 blast (Narsilio 2009). This is due to the decrease in cyclic shear stress amplitude with the increase in number of cycles or loads. Typically, the sequential charges are detonated when the excess pore pressure from the preceding charges are greatest, giving a time interval range of 0.03 to 2 seconds (Narin van Court & Mitchell 1994). Further information into the excess pore pressures are provided in Section 2.3. In performing controlled blasting studies either for ground improvements or for research purposes, the main design considerations include the following, as provided by Charlie (1985): (1) Charge weight per unit volume of soil, (2) Charge distribution (array layout, depth placement, and vertical spacing), (3) Blasting sequence, (4) Delay time, (5) Soil and rock properties, and (6) Groundwater conditions. From an energy viewpoint, for blasting to be effective in generating liquefaction, the amount of energy from blasting must equal or exceed the energy required to overcome the soil resistance to liquefaction. The total energy input during blasting is a function of the charge size, charge geometry, type of explosion, distance between detonation and point of interest, soil characteristics and the attenuation of the blast waves (Narin van Court and Mitchell, 1994). The theoretical amount of energy released during blasting is x 10 6 joules (J) per kilogram (kg) of TNT, with only about 67% of this energy converted into mechanical energy that acts on the soil structure while the remaining 33% escaping as heat loss (Charlie & Doehring, 2007; Green & Mitchell, 2004). Therefore, because a dense soil exhibits greater shear strength than a loose soil, more explosive energy (i.e. increase in weight of the charge) is required to cause shear straining and ultimately liquefaction within denser soils. In addition, larger charges are required to liquefy soils at greater depths (Green 2001).
26 9 In determining the required amount of explosives necessary to cause liquefaction, the most common approach is the Hopkinson s Number (Narin van Court and Mitchell 1994). The Hopkinson s Number (HN) is defined by the following equation: 2-1 where HN is expressed in kg 0.33 /m, and W is the TNT-equivalent charge size in kilograms, and R is the radial distance from the center of the charge in meters. Throughout the literature, the ratio of W 0.33 /R is commonly inversed to R/W 0.33 and is referred to as the scaled distance, SD. Although the Hopkinson s Number accounts for the charge weight and distance from the charge, it does not account for the geometry of the charge. This makes it more applicable to concentrated charges at shallow depths than for distributed or columnar charges at greater depths (Green 2001). Other methods used to determine required amount of explosives include the Normalized Weight and Powder Factor, which are explained in detail in Narin van Court and Mitchell (1994). Currently, there are no theoretical design approaches used in practice known to the author except the cavity expansion theory described by Gohl et al. (2009) that is used in a finite element model developed by others. This theory assumes that residual pore pressures are governed by accumulated shear strains and large stress changes, and that the effect of the charge changes with depth, thus requiring a larger charge for greater depths. Also, the theory holds that subjecting the soil to multiple blasts rather than a single blast is more effective in generating residual pore pressures. Additional information regarding the empirical models used in design is presented in Section 2.4. For a thorough summary of design procedures, the author recommends Narin van Court and Mitchell s report on explosive compaction (1994) Instrumentation During blasting experiments, robust monitoring equipment to measure pore pressure response and other changes due to blasting must be able to withstand the shock wave generated from the blast pulse. Pore pressure transducers must be able to survive a
27 10 transient blast pulse of 41.4 MPa (6,000 psi), while maintaining a tolerance of ± 0.69 kpa (0.1 psi) to record residual pore pressures following the blast (Rollins et al, 2005a). Other key instrumentation used to monitor blasting experiments include accelerometers to measure ground shaking, geophones to measure surface vibrations and Sondex tubes to measure settlements at particular depth intervals following blasting. Ground surface settlements can be measured by conventional rod-and-level techniques or settlement plates. For large areas, LIDAR (Light Detection And Ranging), a laser scanning system that can characterize fine-scale topographic changes, can quickly measure ground deformations up to a 1 cm resolution and provide digital plots of the data once converted to the Cartesian coordinate system using GPS coordinates (Kayen et al. 2009). 2.3 PORE PRESSURE RESPONSE DURING BLASTING Explosives can generate substantial energy through stress waves created by the detonation pressure and pressure due to the expanding blast-generated gases (Narin van Court & Mitchell 1994). Blast pressures travel radially from the explosive as a compression wave throughout the soil, with gas pressures traveling towards the surface. Blast-induced ground motions can cause localized peak accelerations that can be several orders of magnitude greater than earthquake accelerations due to the short travel paths (Charlie 1985). When the compression wave, which travels by contracting and expanding parallel to the direction of travel (Kramer 1996), encounters interfaces such as rock-soil boundaries, the water table or ground surface, shear waves and surface waves can be generated (Charlie 1985). In example of generalized wave paths is shown in Figure 2-1. A point of interest, as shown in Figure 2-1, will feel the compression waves first as they travel faster than shear waves, followed by the shear waves and lastly, the surface waves. The controlling wave (wave with the most energy) is determined by the distance between the energy source (i.e. explosive) and the point of interest. The compression waves subject the soil to a large and abrupt, albeit short-lived, pressure and strain pulse (Dowding and Hryciw 1986), but they attenuate much quicker than shear waves. This is observed in earthquakes where the source is tens to hundreds of kilometers away, causing
28 11 compression waves to attenuate significantly while shear waves produce the lowfrequency, long-duration waves resulting in ground motions. However, during blasting where the distances are much shorter (meters to tens of meters), the soil is typically subjected to energy derived primarily from compression waves. Figure 2-1 Generalized Wave Paths from an Explosion When multiple blasts are used with time delays between detonations, these compression waves can cyclically load the soil, causing ground motion. The cyclic loading can gradually cause the soil to exhibit shear straining, and may eventually lead to a collapse of the soil matrix. The level of the induced shear strains are influenced by the mechanical properties of the soil such as the soil type, soil density, effective stress, stress history, number of strain cycles, and other properties. Typically, shear strains within dry soils will cause volumetric contraction in loose soils and dilation in denser soils. However, if the soil consists of saturated loose sand and drainage is impeded (i.e. soils beneath groundwater table), shear straining can cause significant adverse effects to soils. If the soil structure is weak and incapable of fully
29 12 supporting the increased stress, it begins to collapse, transferring the load to the pore water. The pore water begins to develop residual (excess) pore pressures, or pressures beyond its hydrostatic state, due to its degree of incompressibility. Simply put, excess pore pressures are generated when the fluid responds elastically while the soil responds plastically (Charlie 1985). The magnitude of the residual pore pressure is a function of the initial stress state, the magnitude of the total stress increase, the loading and unloading moduli of the soil, and the drainage conditions of the soil (Fragaszy and Voss 1986). During undrained conditions, the residual pore pressures can lead to a reduction in the effective stress of the soil, leading to a complete loss of shear strength when the residual pore pressure is equal to the initial effective vertical stress (Ferritto 1997). At this stage, liquefaction of the soil has occurred. When a soil has reached liquefaction, the individual sand grains are no longer in contact with each other but are in a suspended state, acting more like a viscous liquid than a solid. Liquefaction can be represented by the following equation: 2-2 where the residual pore pressure ratio is represented by PPR or Ru, and is the change in residual pore pressure (Δu) divided by the initial vertical effective stress (σ v0). A Ru value greater than 0 indicates residual pore pressures have been generated while a Ru of 1.0 represents complete liquefaction. During blasting, a soil will experience three distinct pore pressure response stages: (1) Peak (transient) pore pressure that is attributed to the compressive wave or shock blast, (2) Residual (excess) pore pressure, and (3) Dissipation of pore pressure.
30 13 These stages are presented in Figure 2-2, which shows a generalized Ru time history during a blasting experiment which utilized three blasts detonated at time intervals of approximately 1.0 second. The peak pore pressures can exceed the theoretical liquefaction boundary of Ru = 1.0, but the pressures are short-lived, serving only as a precursor of the residual pore pressure developed by contraction of the soil. The residual pore pressure will maintain a constant level until dissipation initiates. The duration of dissipation is based upon the permeability of the soil, which can change after each blast as the soil densifies, reducing the amount of voids for seepage to occur. In blasting studies, more attention is typically given towards the residual pore pressure as this directly correlates to liquefaction. After the residual pore pressures dissipate, the soil particles begin to settle and rearrange into a denser state than the initial state before blasting. Settlement can reach up to 2 to 10% of the initial thickness of the liquefied layer (Narsilio et al. 2009). Figure 2-2 Pore pressure response stages during blasting

31 14 Typically during a blasting experiment and with earthquake-induced liquefaction, sand boils will occur at the surface as the pore pressures seek out the easiest route to the surface to relieve the pressures. Water flows through the cracks and fissures of the subsurface, carrying sand particles with it. As it reaches the surface, the sand is ejected and is distributed concentrically around the hole. An example of this is shown in Figure 2-3, in which a sand boil was developed following blasting at the Tokachi Study in Japan. Figure 2-3 Sand Boil due to liquefaction during Tokachi blasting study Ashford and Juirnarongrit, Factors Affecting Pore Pressure Generation There are four general components that affect pore pressure generation and ultimately, the liquefaction potential of soils: (1) soil type, (2) soil density, (3) saturation, and (4) magnitude of shaking. Changing one or more of these components, such as increasing the density or decreasing the anticipated magnitude of shaking, and the likelihood of
32 15 liquefaction occurring will be reduced. The most susceptible soils to liquefaction consist of saturated, loose to medium dense, poorly-graded granular soils with a relatively low permeability, such as clean and silty sands. Recently, research and post-earthquake field reconnaissance have shown that gravelly soils and clayey-silty soils can also be susceptible to liquefaction due to the soil composition factors (Seed et al. 2003, Boulanger & Idriss 2004, Bray & Sancio 2006). Bray and Sancio (2006) identified that liquefaction-type behavior can occur in clayey soils depending on the amount and type of clay minerals in the soil. Other soil composition factors include confining pressures (e.g. capping soils, overburden stress), soil structure and cementation, thickness of soil deposit, strain history, permeability and drainage, and the amount of entrapped air within the deposit (Charlie et al. 1988b, Figueroa et al. 1994). 2.4 PREDICTING PORE PRESSURE RESPONSE DURING BLASTING Several studies have been performed to predict the pore pressure response due to blasting. The common method is to relate the residual pore pressure ratio (Ru) to the scaled distance (R/W 0.33 ), where W is the TNT-equivalent charge size in kilograms, and R is the radial distance between the point of interest and the explosive charge in meters. Other methods in predicting pore pressure response use peak particle velocity or compressive strain to predict pore pressure response (Charlie 1985, Al-Qasimi et al. 2005). To the author s knowledge, there are no theoretical methods currently in use for estimating residual pore pressure response during blasting. Most of the past research in estimating residual pore pressures was centered on single charges in saturated sandy soils. Ivanov (1967) observed that liquefaction typically occurred between scaled distances (R/W 0.33 ) less than 6 to 8 for sandy soil with a relative density between 30 and 40%. While performing blasting in marine deposits, Kummeneje and Eide (1961) observed that the potential for liquefaction decreases as depth increases due to the increased confining stress. Therefore, in predicting the pore pressure response with blasting, they considered the initial effective vertical stress (σ vo) as shown in the following equation, where R/W 0.33 is in m/kg 0.33, and the initial effective vertical stress (σ vo) is in kpa:
33 Residual Porewater Pressure Ratio, Ru Although based solely on the scaled distance, the most common empirical method used to predict residual pore pressure response in soils was developed by Studer and Kok (1980) following blasting to densify loose sands within Amsterdam Harbor utilizing single blasts, and is provided below, in addition to the range as provided by Narin van Court and Mitchell (1994): Average: 2-4 Range: where Ru is the pore pressure ratio, W is the TNT-equivalent charge weight in kilograms, and R is the radial distance between the piezometer and the explosive charge in meters. These are shown graphically in Figure 2-4, with the average shown in the solid line and the range represented by the dashed lines Studer and Kok (1980) Scaled Distance, R/W 0.33 (m/kg 0.33 ) Figure 2-4 Studer and Kok (1980) empirical model
34 Residual Pore Pressure Ratio, Ru 17 In studying residual pore pressure responses from underground chemical explosions, Charlie and Doehring (2007) identified the upper-bound maximum scaled distance for initial pore pressure generation and ultimately liquefaction. Based upon their analysis, the maximum boundary for pore pressure generation occurred at a scaled distance of 14 m/kg 0.33, and the maximum boundary for liquefaction occurred at 3 m/kg From these boundaries, it can be deduced that for 1 kg of TNT, any point beyond the 14 m radius is not expected to be subjected to enough strain to cause generation of residual pore pressure. A comparison of the Charlie and Doehring (2007) model, Studer and Kok (1980) model, and the Kummeneje and Eide (1961) model are presented in Figure 2-5. Limitations of these models include omissions such as initial soil properties and depth of placement of the charge, as these can affect the distribution of energy from the charge blast and ultimately, the pore pressure response (Narin van Court & Mitchell 1994) Studer & Kok (1980) Kummeneje & Eide (1961) Charlie & Doehring (2006) shown with σ' v0 = 50 kpa Scaled Distance, R/W 0.33 (m/kg 0.33 ) Figure 2-5 Empirical models for predicting Ru for single blasts (assuming an initial effective vertical stress of 50 kpa)
35 Residual Porewater Pressure Ratio, Ru 18 Based upon a blasting study using multiple blasts, Rollins et al. (2004) identified a bestfit trend line for the observed residual pore pressure and scaled distances developed from a separate blasting test performed by Rollins (2004). This best-fit trend line can be approximated by Equation 2-7. However, it should be noted that it is unclear if Equation 2-7 considers any other parameters rather than the scaled distance as it was approximated from a graph provided by Rollins et al. (2004). Assuming the trend line is based solely on the scaled distance, the approximate equation is provided below: 2-7 For comparison purposes, the trend lines developed by Studer and Kok (1980) and Rollins et al. (2004) are presented in Figure Studer & Kok (1980) Rollins et al. (2004) Scaled Distance, R/W 0.33 (m/kg 0.33 ) Figure 2-6 Empirical Models predicting Ru for single blasts (Studer & Kok 1980) and multiple blasts (Rollins et al. 2004)
36 19 From the figure, it is observed that liquefaction can occur at a greater scaled distance for multiple blasting (represented by the Rollins et al model) than for single blasts (represented by the Studer and Kok (1980) model), which occurs at a scaled distance of 4.1 m/kg 0.33 and 2.7 m/kg 0.33 respectively. For a 1 kg charge, initiation of pore pressure generation for multiple blasts can occur at a scaled distance of approximately 20 m while single blasts may be bounded around 12 m. 2.5 MOTIVATION FOR RESEARCH After evaluating the current trends for predicting residual pore pressure response with scaled distances, there are two significant observations that have motivated this research. First of all, of the existing empirical models, only one model (Kummeneje and Eide 1961) considers soil conditions as a parameter in predicting the residual pore pressure. If denser soils exhibit more resistance to liquefaction, than it is expected that they would require more energy (lower scaled distance value) to generate residual pore pressure and eventually liquefaction, but this is not accounted for with the empirical methods presented. Therefore, an analysis should be made to evaluate the influence that in-situ conditions have on blast-induced pore pressure generation. Secondly, of all the methods, only Rollins et al. (2004) is applicable to multiple blasts. From our understanding of soil mechanics, more energy is required to cause liquefaction from one load cycle (e.g. 1 blast) than for multiple load cycles (e.g. multiple blasts). Therefore, an empirical model for single blasts would not be the same for multiple blasts, but would actually underestimate the scaled distance (more energy) for a given residual pore pressure. As mentioned in Chapter 1, this research evaluates the pore pressure response for multiple blasts and single blasts as a function of blasting properties and soil conditions. If such a trend exists and is considered an improvement to existing models, then this empirical model may serve as a design tool in planning future blasting studies.
37 MATERIALS AND METHODS I was awakened by a tremendous earthquake and I ran out of my cabin, both glad and frightened shouting, A noble earthquake! feeling sure I was going to learn something. John Muir, Our National Parks (1901) 3.1 INTRODUCTION Geotechnical engineers began to use controlled blasting as a means for densifying loose soils in the 1930 s. It has only been relatively recent that controlled blasting has developed into a tool for geotechnical engineers to physically generate liquefaction for seismic-related research. Several experiments have been performed in the last two decades, ranging from investigating the seismic behavior of deep foundations when subjected to liquefaction to developing controlled blasting as a tool to perform liquefaction potential assessments to supplement to existing methods. This section summarizes several blast-induced liquefaction experiments, as shown in Table 3.1, beginning with the most recent test performed in Ishikari, Japan in These case histories serve as the Methods and Materials of this thesis, from which the recorded insitu soil conditions, blasting layout, and pore pressure results serve as the data for this research. The case histories presented provide valuable insight into the effect of blasting on pore pressure development. Although this section presents several selected case histories, it should be noted that this does not include all controlled blasting experiments performed to date. Other studies have been performed in the last 30 years that investigated pore pressure generation, including large nuclear experiments, but were not included in this research due to the inapplicability of the data to the specific research hypothesis and/or the availability of published data.
38 21 Table 3.1 Selected Blast-Induced Liquefaction Studies Test Location (year) Ishikari, Hokkaido Island, Japan (2007) Vancouver, British Columbia, Canada (2004) Maui, Hawaii (2004) Tokachi, Hokkaido Island, Japan (2002) Delta, British Columbia, Canada (2000) Treasure Island, San Francisco, California (1998) Fort McMurray, Alberta, Canada (1997) South Platte River, Colorado (1987) Principal Investigator Port and Airport Research Institute (PARI) Brigham Young University (BYU) BYU & University of Hawaii PARI & UC San Diego (UCSD) Pacific Geodynamics, Inc. & Univ. of British Columbia (UBC) UCSD, BYU, & U.S. Geological Survey Single (S) / Multiple (M) Blasts M S, M Principal References PARI (2009), Nakazawa & Sugano (2010) Rollins (2004), Strand (2008) S, M Rollins et al. (2004a) S, M Ashford & Juirnarongrit (2004) S, M Gohl et al. (2001) M Ashford & Rollins (2002), Ashford et al. (2004) UBC S, M Pathirage (2000) Colorado State University, Fort Collins S Charlie et al. (1992) 3.2 ACCOUNTING FOR MULTIPLE BLASTS As presented in Chapter 2, pore pressure generation due to blasting is often plotted with the scaled distance, R/W 0.33 (in m/kg 0.33 ), between the explosive and point of interest (e.g. pore pressure transducer). Although this is easily estimated for single blasts, it is unclear how to estimate the scaled distance for when multiple blasts are used. If all blasts were detonated at the same time, then one could simply average the scaled distance for each explosive. But is this a valid method when a series of blasts are used, involving different charge weights and radial distances with time intervals between blasts? In order to analyze the pore pressure response with respect to multiple blasts, a consistent method to account for the changing scaled distance with each blast must be established. In order to do so, the following assumptions were made:
39 22 The magnitude of pore pressure generated from each sequential blast is influenced by the previous blast and generated pore pressure. As explained in Chapter 2, soil can lose its stiffness during pore pressure buildup. Therefore, a blast can have a different impact in generating residual pore pressures when Ru = 0.5 than it does at the beginning of a blasting study when Ru = 0. Time intervals between sequential/multiple blasting are short enough to minimize significant pore pressure dissipation. Blasting patterns (e.g. in-to-out, out-to-in, circular, alternating sides, etc.) are not considered to play a significant role in pore pressure buildup. However, this assumption cannot be verified within the scope of this research. Blasts that did not cause an increase in pore pressure, either represented by excess pore pressure or residual pore pressure ratio, are not considered. This requires a decipherable time history to determine pore pressure increase following each blast pulse. Blasts that exceeded an individual scaled distance (e.g. simply their specific radial distance divided by the cubed root of their specific charge weight) of 20 m/kg 0.33 were considered to have an insignificant influence in pore pressure generation based upon observation of data. Therefore, these particular blasts were not considered in the overall analysis. From these assumptions, a general method was established to account for pore pressure generation for multiple blasts, and is shown in the following equation: 3-1 where R/W 0.33 is the scaled distance between explosive and point of interest, R is the radius in meters, and W is the equivalent weight of the charge to TNT in kilograms, N is the number of blasts, and 1, 2, and i denotes the associated distance and weight of the charge number.
40 23 To provide a clear and concise understanding of this method, an example of a blasting test with pore pressure readings and analysis is displayed in Figures 3-1 through 3-3, and in Table 3-1. In Figure 3-1, the blasting layout is shown. The layout consists of 3 charges with sizes of 0.5, 1.0, and 1.5 kg. The largest charge is placed at a radial distance of 8 m from the center of the test area, and the 1.0 kg charge and 0.5 kg charge placed at radial distances of 6 m and 4 m, respectively. A pore pressure transducer is placed in the center of the test area at a depth of 4 m, which is also the same depth where the explosives were placed. The blasting sequence utilized an out-to-in sequence, starting with the farthest charge (i.e. W = 1.5 kg) being detonated first with time delays of 500 ms. Figure 3-1 Blasting layout from example blasting study From the pore pressure time history shown in Figure 3-2, each blast is represented initially by the transient pore pressure increase, representing the change in the applied mean normal stresses from the blast pulse, and immediately dissipates. Following the transient pulse the residual pore pressures develop as the soil skeleton progressively collapses. This causes a decrease in effective stress equal to the generated excess pore
41 24 pressures. After blasting has concluded, the residual pore pressure reaches a peak and after a period of time it will begin to dissipate, as previously shown in Figure 2-5. In the example, the soil does not achieve liquefaction (e.g. Ru = 1.0), but gets relatively close to the boundary. In an actual event, sand boils may appear indicating liquefaction has occurred even though the residual pore pressure has not met that theoretical boundary. Figure 3-2 Pore pressure time history from example blasting study In Table 3.2, an analysis is shown how the scaled distance was calculated for each sequential blast. The magnitude of excess pore pressure is dependent upon the blast size and distance, as well as the previous blasts sizes and distances. The residual pore pressure developed for each blast was determined by the maximum pore pressure observed on the chart prior to the next blast and/or dissipation.
42 25 Table 3.2 Analysis of results from example blasting study Blast Radius Mass Scaled Distance R W R ave /Σ(W 0.33 ) Excess Pore Pressure Residual Pore Pressure Ratio No. m kg m/kg 0.33 kpa R u From Table 3.2, the residual pore pressure ratio, Ru, is plotted in Figure 3-3 with respect to the scaled distance. The increasing Ru is plotted as a negative slope with the adjusted scaled distance plotted on a semi-log plot, indicating that each blast reduces the overall scaled distance. Figure 3-3 Residual pore pressure, Ru, vs. scaled distance for example blasting study
43 PORT OF ISHIKARI, JAPAN In the fall of 2007, a full-scale blast-induced liquefaction study was conducted by Japan s Port and Airport Research Institute (PARI) at the Ishikari Bay New Port in Hokkaido Island, Japan, to evaluate the resiliency of airport infrastructure subjected to liquefaction induced from a major earthquake (PARI 2009). Airports play a critical role in a community s response following a natural disaster, providing emergency services and supplies for medical and relief operations. Using controlled blasting to induce liquefaction, the seismic performance of several full-scale airport structures were evaluated, including ground improvement techniques to mitigate liquefaction. The airport structures tested included a mock runway, apron, embankment, and other structures. Ground improvement techniques included compaction grouting and chemical (permeation) grouting, and were compared to the settlement observed in an unimproved area within the blasting area. Chemical grouting was performed with various treatment depths to determine the cost-effective treatment layout. The study emphasized that liquefaction-induced settlement beneath a runway can force closure of the runway following a major earthquake, which can cause significant delays in disaster relief services. However, cost-effective liquefaction countermeasures can be implemented to minimize settlement and maintain serviceability. The study was largely funded by Japan s Ministry of Land, Infrastructure, and Transportation, and included over forty-seven research groups participating with PARI collaborating on thirty different projects in five research areas. The research areas included (1) observation of liquefaction behavior, (2) pavement management, (3) liquefaction mitigation methods, (4) airport infrastructure, and (5) monitoring techniques. Oregon State University (OSU) and the United States Geological Survey (USGS), with funding provided by the National Science Foundation (NSF), contributed to the study by measuring post-liquefaction settlement using LIDAR (Light Detection And Ranging) to measure fine-scale topographic changes and by performing non-destructive evaluation methods to analyze density changes following dissipation of blast-induced residual pore pressures. To date, this may be the most extensively monitored controlled blasting study performed, providing a wealth of information including soil conditions,
44 27 blasting results, and so forth. However, a major obstacle in regard to this information is that most of it is currently in Japanese, requiring a translation to English in order to make it understandable to U.S. researchers Site Conditions and Test Layout The test site consisted of loose, reclaimed sand dredged from Ishikari Bay extending to a depth of approximately 5 to 6 m below the ground surface. The reclaimed sand had an average fines content of 10 to 20% and SPT (N 1) 60 values ranging from 1 to 8 blows per 30 cm. The reclaimed sand was underlain by several alluvial soil layers consisting of sand, gravel, and clay. SPT (N 1) 60 values for the alluvial layers ranged from 3 to 12 blows per 30 cm. The average shear wave velocity of the reclaimed sand was approximately 120 m/s. The reclaimed soil was classified as poorly graded and susceptible to liquefaction. The groundwater table was at an approximate depth of 2 to 2.5 m. A typical soil profile is shown in Figure 3-4, including average SPT (N 1) 60 values. Figure 3-4 Typical Soil Profile for Ishikari Blasting Study
45 28 The pilot study consisted of four separate blasting studies using both multiple blasts and single blasts. Pilot study P2, shown in Figure 3-5, utilized a grid array of 16 boreholes spaced on a 6.5 m grid. Charges were placed at depths of 4.5 m and 9.0 m, with charge weights ranging from 2 kg to 4 kg, as shown in Table 3.3. Time delays between each blast with the exception of the first and second blasts was 200 ms. The second blast occurred approximately 34 minutes after the first blast for reasons unknown. During this 34 minute pause between blasting, the pore pressure had enough time to almost fully dissipate within each pore pressure transducer prior to the second blast. For additional information regarding the pilot study, the reader is referred to PARI (2009). Figure 3-5 Blasting Layout for Ishikari Pilot Study (adapted from PARI 2009)
46 29 Table 3.3 Ishikari Pilot Study Blasting Details (adapted from PARI 2009) Pilot Study, P2 Charge Weight at depth of placement (kg) Radial Distance of Explosive from Pore Pressure Transducer, PPT (m) Blast at z = 4.5 m at z = 9.0 m SK-PW03 (at 4 m) PA-PW01 (at 4 m) PA-PW01 (at 8 m) SK-PW04 (at 4 m) SK-PW02 (at 4 m) The full-scale study was performed approximately one month following the pilot study. The full-scale study used 269 boreholes with 2-kg and 4-kg charges placed at depths of 4.5 m and 9.0 m, respectively, below the ground surface. The delay interval was 200 ms between each blast, requiring nearly 2.5 minutes to complete blasting. A general layout of the full-scale blasting study is shown below in Figure 3-6, with an additional figure in Appendix A.1.4 displaying the blasting sequencing. In the tarmac area, horizontal blasts were used instead of downhole vertical blasts to liquefy the immediate area beneath the

47 30 pavement. A specific layout identifying specific pore pressure transducers is included in Appendix A.1.5. Recorded time histories from the transducers following the pilot test are provided in Appendix A.1.1 and A.1.2, and the full-scale test readings are in Appendix A.1.3. Many of the transducers were damaged or affected by the blast pulse, causing their readings to not be included in the analysis portion of the study. Figure 3-6 Blasting Layout for Ishikari Full-Scale Blasting Study (from Ashford et al. 2008)
48 Residual Porewater Pressure Ratio, Ru Test Results In both the pilot study and the full-scale study, sand boils and flowing of groundwater to the surface indicated that liquefaction had occurred. Maximum residual pore pressure ratios recorded from several transducers from the pilot and full-scale studies are plotted in Figure 3-7 based upon scaled distance estimated using the procedure shown previously in Equation 3-1. From the results, the data follows the expected trend of increasing Ru values with decreasing scaled distance. Generally, transducers closer to the explosives experienced higher residual pore pressures during blasting Pilot Test Full-Scale Test Scaled Distance, R/W 0.33 (m/kg 0.33 ) Figure 3-7 Maximum Residual Porewater Pressure Ratios from Ishikari Pilot Study P2 and Full-Scale Study 3.3 VANCOUVER, BRITISH COLUMBIA, CANADA, 2004 An in-situ liquefaction study using controlled blasting was performed near the Massey Tunnel in Vancouver, British Columbia with the objective of evaluating the performance of vertical composite earthquake drains to mitigate liquefaction (Rollins 2004, Strand 2008). Prior to the full-scale test of the composite drains, a pilot study was performed to

49 32 design the blasting layout and to serve as the baseline for comparison purposes of the drains. Multiple blasting was to be used over a period of 10 to 16 seconds to liquefy the soils surrounding the composite drains Site Conditions and Blasting Layout The soil consisted of young alluvial sand/silty sand that extended to a depth of 6 m to approximately 15 m, as shown in Figure 3-8. The sand layer had an average shear wave velocity of 180 m/s and an average relative density of approximately 40%. CPT-based correlations provided by Kulhawy and Mayne (1990) estimated the SPT (N 1) 60 values to range from 8 to 14 per 30 cm, with an average of 10 blows per 30 cm. Figure 3-8 Typical Soil Profile for Vancouver, British Columbia Blasting Study The soil blasting layout was designed to provide a relatively broad zone of liquefaction while preventing adverse impacts to nearby infrastructure. A total of 3 pilot test blasts were performed along a circular array 10 m in diameter, as shown in Figure 3-9. The first test consisted of 8 holes with 3 decks of kg charges. The blast holes were placed at depth intervals of 6.4 m, 8.5 m, and 10.1 m beneath the surface. The first pilot
50 33 test did not generate high residual pore pressures within the soil, so a single charge was used in test #2 to evaluate pore pressure response with an increased charge weight. A single blast was performed with an increased charge size of kg placed at a depth of 8.5 m. The results from test #2 are unknown. The third test blast consisted of 7 boreholes with 3 charges in each borehole at the same depths as test #1, with charge sizes increased to 1.36 kg. Figure 3-9 Blasting Layout for Pilot Study at Vancouver, British Columbia Test (from Strand 2008) Test Results Time histories of residual pore pressure, Ru, were measured during the first and third blasts and are shown in Appendix A.2. From the time histories, the increase in Ru with
51 Residual Porewater Pressure Ratio, Ru 34 each blast was able to be estimated and plotted as a sequence with respect to scaled distance as shown in Figure In Figure 3-10, the maximum recorded Ru for each transducer is represented by the larger marker in the sequence of blasts. During the first blast sequence, the maximum Ru was approximately 0.70, indicating that liquefaction did not occur. It was observed that pore pressure transducers (PPT) installed at greater depths experienced less Ru than PPT s closer to the surface, perhaps due to the increase in scaled distance and the increase in soil density (Strand, 2008). During the third blast, the maximum Ru typically exceeded 0.90, indicating that the soil was nearly liquefied completely Scaled Distance, R/W 0.33 (m/kg 0.33 ) Blasting Data (Max Ru) Figure 3-10 Sequential Change in Residual Porewater Pressure Ratio, Ru, with respect to Scaled Distance from Vancouver Blasting Study 3.4 MAUI, HAWAII, 2002 In order to assess the in-situ potential of liquefaction in coralline sands, researchers from Brigham Young University and the University of Hawaii performed a controlled
52 35 blasting experiment in Maui, Hawaii (Rollins et al. 2004). Prior to the blasting experiment, an SPT-based liquefaction assessment based on clean non-coralline sands indicated that the soil was liquefiable. However, shear velocity measurements were high enough to categorize the site as not being susceptible to liquefaction. Blasting was performed as a supplemental method to assess the liquefaction potential of the coralline sand Site Conditions and Blasting Layout The site consisted of clayey silt and fine volcanic sand overlying coralline silty sand and gravel, the layer of interest in the liquefaction study. SPT (N 1) 60 values ranged from 2 to 8 blows per 30 cm, with an average of 5 blows for 30 cm for the coralline sand while shear wave velocities ranged from 200 to 215 m/s. Based upon the SPT test, the coralline sand was considered susceptible to liquefy for a design-level earthquake while the shear wave velocity evaluation showed the soil to be able to resist liquefaction. A typical soil profile is shown in Figure Two different controlled blasting tests utilizing multiple blasts were performed to provide an in-situ liquefaction assessment of the coralline sands, with layouts shown in Figure All explosives and pressure transducers were placed at a depth of 5.35 m. The individual charge sizes were 0.45 kg, with a total of 8 charges used for each test. In test #1, the charge line was placed at a perpendicular distance of approximately 8 m, while test #2 was moved closer to a perpendicular distance of approximately 4 m.
53 36 Figure 3-11 Typical Soil Profile for Maui Blasting Study Figure 3-12 Blasting and Instrumentation Layout at Maui (distances in meters) (from Rollins et al. 2004)
54 Test Results Pore pressures (both peak and residual), ground motions, and settlements were measured during both tests. Pore pressure time histories are included in Appendix A.3. It was uncertainty of which pore pressure transducer the results came from, further analysis was performed using the center transducer. Table 3.4 summarizes the residual pore pressures recorded with each charge during blast #1 and #2. The first charge during blast #1 consisted of two charges detonated simultaneously. During the test, changes in Ru were recorded with each blast and plotted in Figure 3-13 for blast #1 and blast #2 with the calculated scaled distance. During blast #1 and #2, the peak pore pressure ratio reached a value of 0.91 and 0.96, respectively, indicating that blast sequence effectively liquefied the soil in each case. Based upon their results, Rollins et al. (2004) concluded that the coralline sand was indeed susceptible to liquefaction, and that correction factors should be made to shear wave velocity tests performed in such soils. Charge Number Table 3.4 Residual Pore Pressure Results during Maui Blasting Study Charge Mass (kg) Change in Pore Pressure, ΔRu Adapted from Rollins et al. (2004) Test Blast #1 Test Blast #2 Change in Residual Pore Charge Pore Pressure Mass Pressure, Ratio, Ru (kg) ΔRu Residual Pore Pressure Ratio, Ru
55 Residual Porewater Pressure Ratio, Ru Blast #1 Blast # Scaled Distance, R/W 0.33 (m/kg 0.33 ) Figure 3-13 Residual Pore Pressure Response vs. Scaled Distance for Maui Blasting Study 3.5 PORT OF TOKACHI, HOKKAIDO ISLAND, JAPAN, 2001 Lead by the Port and Airport Research Institute (PARI) of Japan, a multi-participant, fullscale blast-induced liquefaction experiment was performed to assess the performance of piles, pipelines, and quay walls against lateral spreading based upon static and seismic design. Universities and industries from Japan and the U.S. also contributed to the study, experimenting with mitigation techniques and response of lifelines to liquefaction. Blasting was performed to induce lateral spreading of a hydraulic fill placed less than 2 years prior to the test (Sugano et al. 2002). Prior to the full-scale experiment, pilot tests were performed to determine the optimal blasting layout to ensure liquefaction, such as charge weights, locations of charges, and delay in blasts (Ashford and Juirnarongrit, 2004) Site Conditions and Blasting Layout The site consisted of young hydraulic fill that was mostly loose silty sand. In-situ measurements recorded average (N 1) 60 values of 3 blows per 30 cm, shear wave
56 39 velocities averaging 100 m/s, and a relative density of approximately 30% from CPT measurements for the upper 7 m. A typical soil profile for the site is provided in Figure The soil was considered very susceptible to liquefaction, as observed by the loose density of the sand indicated by the low SPT (N 1) 60 values. Figure 3-14 Typical Soil Profile for Tokachi Blasting Study The first pilot test consisted of several single borehole tests and was performed to determine the blasting sequence, the optimum depth of the charge, and the optimum explosive weight. The boreholes were spaced at the corners of a square area with border lengths of 10 m. The explosives were placed at a depth of 5 m below the ground surface for boreholes S1 and S2, and decked at depths of 5 m and 10 m for S3 and S4. The soil conditions for the 10 m depth is unknown except that it was a dense sand with SPT (N 1) 60 values exceeding 40 blows per 30 cm. The individual charge weights were 2 kg for S1, and 3 kg for the remaining charges. Each borehole was detonated upon dissipation of residual pore pressures from the previous borehole explosion. During test S3, blasting started from the bottom-up, while in S4 it was performed from the top-down, with a time delay of 300 ms.
57 40 For the full-scale tests, sequential blasting was performed utilizing a grid pattern covering an area of approximately 4,800 m 2 as shown in Figure During the first test, explosives were placed in a 6 m grid, with charges placed at depths of 3.5 m and 7.5 m below the ground surface. Charge sizes ranged from 3 to 5 kg along the outer perimeter, while 2 kg charges were used near the test piles to prevent damage due to the shock blast. The blasting interval was 750 ms between boreholes, requiring approximately 35 seconds for the 60 charges to be detonated within the test area. Blasting was performed in an out-to-in pattern. Pore pressure transducers were placed near the pile groups at depths of 2, 4, and 6 m beneath the surface, as shown in Figure Figure 3-15 Blasting Layout and Sequence during Tokachi Full-Scale Blast #1 (from Ashford and Juirnarongrit 2004)
58 41 Figure 3-16 Pore Pressure Transducer Layout during Tokachi Full-Scale Blast #1 (from Ashford and Juirnarongrit 2004) Test Results Pore pressure time histories are provided in Appendix A.4. During pilot test #1, the maximum residual excess pore pressures were observed to increase with increased charge size in tests S1 and S2. In tests S3 and S4, it was observed that a maximum Ru was achieved when blasting was performed from the bottom-up rather than top-down sequence. The change in Ru observed in the pilot studies is plotted with respect to scaled distance in Figure The maximum recorded Ru is shown as the larger, darker marker on the figure.
59 Residual Porewater Pressure Ratio, Ru Scaled Distance, R/W 0.33 (m/kg 0.33 ) Pilot Study (max Ru shown with large dark marker) Figure 3-17 Residual Pore Pressures vs. Scaled Distance during Tokachi Blasting Study, Pilot Test During the full-scale blast #1, residual pore pressures near the transducers increased rapidly as the blasting approached the transducer locations. Ru measurements showed that liquefaction occurred within 25 seconds, and sand boils appeared at the ground surface shortly thereafter, indicating that liquefaction had indeed occurred. The change in Ru observed in individual transducers is plotted in Figure 3-18 with respect to scaled distance. The maximum Ru recorded for each pore pressure transducer are denoted by the larger, darker marker on the figure as well as presented below in Table 3.5.
60 Residual Porewater Pressure Ratio, Ru Scaled Distance, R/W 0.33 (m/kg 0.33 ) Full-Scale Test (Max Ru shown with large dark marker) Figure 3-18 Residual Pore Pressures vs. Scaled Distance during Tokachi Blasting Study, Full-Scale Test #1 Table 3.5 Maximum Residual Pore Pressures during Tokachi Full-Scale Test #1 Pore Pressure Transducer (PPT) Depth of PPT Residual Pore (m) Pressure, Ru S S F F F B B B AB
61 VANCOUVER, BRITISH COLUMBIA, CANADA, 2000 Controlled blasting was used to perform an in-situ liquefaction field test in Delta, British Columbia, Canada by Pacific Geodynamics Inc. and the University of British Columbia in 2000 (Gohl et al. 2001). The goal of the blast-induced liquefaction experiment was to develop a downhole in-situ liquefaction test to supplement existing penetration testbased methods and cyclic laboratory tests, particularly for problematic soils such as lowplasticity silts, and sand and gravel deposits that are difficult to perform conventional liquefaction assessments in. Sequential blasting using multiple charges was performed to generate shear and compressive strain pulses to cyclically load the soil to the equivalent shear strain that would be expected from anticipated ground motions created from the design-level earthquake Site Conditions and Blasting Layout The site was composed of estuarine deposits consisting of interlayered sand, silt and clayey silt. The target layer for the liquefaction study was low plasticity silty sand at a depth of 10 to 12 m. Shear wave velocities for the target layer averaged around 160 m/s, with (N 1) 60 values ranging from 5 to 10 blows per 30 cm. Empirical liquefaction relationships indicated that the soil was susceptible to liquefaction for the design-level earthquake for the area, a M w 7 earthquake capable of producing shear strains ranging from 0.4% to 2%. A typical soil profile for the site is provided in Figure A circular array was used for the blasting layout, with explosives spaced at alternating radial distances of 6 m and 12 m from the center. A total of 16 explosives were used, with two 6-kg charges used in the 12 m radius holes and two 2-kg charges used in the 6 m radius hole spaced at depths of 8 m and 12 m. Prior to the main blasting event a single 8- kg charge was detonated at a distance of 12 m from the center of the blasting area to verify that all instrumentation was functioning. The blasting and instrumentation layout is shown in Figure The blasts were delayed by an average of 500 ms between each deck, and 1 second between each borehole.
62 45 Figure 3-19 Typical Soil Profile for Delta, British Columbia Blasting Study Figure 3-20 Blasting and Instrumentation Layout at Delta, British Columbia Study (from Gohl et al. 2001)
63 Residual Porewater Pressure Ratio, Ru Test Results The change in the residual pore pressure following the single 2-kg test blast and after all blasts were detonated were 0.15 and 0.48, respectively, for a maximum residual pore pressure of This pore pressure ratio indicates that complete soil liquefaction was not achieved, as confirmed by a lack of sand boils at the surface. Following their study, Gohl et al. (2001) recommended a similar downhole in-situ controlled blasting experiment to be performed on clean sand to serve as a baseline for future liquefaction evaluations. The maximum Ru recorded for the single blast and the multiple blasts are plotted in Figure 3-21 with respect to the scaled distance Multiple Blast Single Blast Scaled Distance, R/W 0.33 (m/kg 0.33 ) Figure 3-21 Maximum Residual Pore Pressure Ratio vs. Scaled Distance for Delta, British Columbia Blasting Study
64 SAN FRANCISCO, CALIFORNIA, 1998 To improve seismic design for lateral load capacity of deep foundations, a full-scale insitu liquefaction study was performed by UC San Diego and Brigham Young University. Other participants collaborated on the project, including the U.S. Geological Survey. The test was performed at the National Geotechnical Experimentation Site (NGES) located on Treasure Island in the San Francisco Bay of California. This full-scale study, called the Treasure Island Liquefaction Test (TILT), focused on developing lateral loaddisplacement relationships for a variety of individual piles and pile groups in liquefied sand under full-scale conditions (Ashford & Rollins 2002, 2004; Ashford et al. 2006). Controlled blasting was used to induce liquefaction in the surrounding soil prior to conducting the lateral load pile tests. In order to determine the blasting layout that would sufficiently induce liquefaction for the full-scale test, two pilot tests were performed. The second pilot test was conducted to verify if the soil could be liquefied at a site more than once using the same blasting design Site Conditions and Blasting Layout Treasure Island is a man-made island consisting of hydraulically-placed sands. The site investigation identified the sand fill extended to a depth of approximately 6 m below the ground surface, and having a relative density ranging from 20% to 70%. SPT (N 1) 60 values ranged from 2 to 19 blows per 30 cm, with the highest penetration values within 1 m of the surface. Underlying the hydraulic fill are sandy silts and Young Bay Mud. The hydraulic fill is considered liquefiable based upon previous liquefaction during the Loma Prieta earthquake in 1989 (M w 6.9). A typical soil profile for the pilot liquefaction study is provided below in Figure The water table was approximately 0.5 m beneath the excavated surface during this study. The pilot study involved two blasting events separated by three days. The blasting layout consisted of 0.5 kg TNT-equivalent charges placed at approximately 3 m beneath the excavated surface, spaced evenly in a circular array with horizontal radius of approximately 2 m, with pore pressure transducers spaced at depths ranging from 1 m to 6 m throughout the testing area, as shown in Figure During the second blast, the blasting layout was rotated clockwise 0.3 m, maintaining the same radial distance used during the first test.
65 48 Figure 3-22 Typical Soil Profile for Treasure Island, California Pilot Study Figure 3-23 Blasting and Instrumentation Layout for Treasure Island Pilot Study (from Ashford et al. 2004)
66 Residual Porewater Pressure Ratio, Ru Test Results During both blasts, pore pressure ratios of more than 80% were consistently achieved throughout the soil profile, with many transducers indicating that liquefaction had occurred. Sand boils appeared at the ground surface about 5 minutes after blasting had finished, and continued to eject material for over 20 minutes. Residual pore pressures measured during the first and second blasts are included in Appendix A.5 of this thesis. The maximum residual pore pressures are plotted in Figure 3-24 with respect to scaled distance for both Blast #1 and Blast #2. Table 3.6 summarizes the maximum recorded Ru from each PPT during the blast #1 and blast #2 of the pilot study. Additional information regarding TILT is provided by Kayen et al. (2000), Ashford et al. (2004), and Rollins et al. (2005a, 2005b) Pilot Test - Blast #1 Pilot Test - Blast # Scaled Distance, R/W 0.33 (m/kg 0.33 ) Figure 3-24 Maximum Pore Pressure Ratio vs. Scaled Distance for Treasure Island Pilot Study
67 50 Table 3.6 Residual Pore Pressure Measurements during TILT Pilot Study Pore Pressure Transducer (PPT) Depth of PPT (m) Residual Pore Pressure Ratio, Ru Blast #1 Blast # FORT MCMURRAY, ALBERTA, CANADA, 1997 In 1997, a fourth phase of the Canadian Liquefaction Experiment (CANLEX), was performed by researchers from the University of British Columbia near Fort McMurray, Alberta, Canada to investigate the potential of using controlled blasting as a liquefaction assessment technique (Pathirage 2000). This study was a part of a multi-phase study aimed in developing liquefaction prediction methods using controlled blasting. The researchers were attempting to use controlled blasting to match ground motion characteristics from earthquakes Site Conditions and Blasting Layout The blasting was performed at a quarry where previous blasting experiments were performed during earlier studies of the CANLEX studies. The soil consisted of artificiallydeposited medium dense silty sand to sandy silt, with an average corrected SPT blow
68 51 count of 3 blows per 30 cm, and average shear wave velocity of 127 m/s (Pathirage 2000). The groundwater table was approximately 0.5 m below the surface. Additional soil information from Pathirage (2000) is provided in Table 3.7. Table 3.7 Soil Conditions for CANLEX study Soil Type Silty sand to sandy silt Mean Grain Size, D 50 (mm) 0.17 Effective Grain Size, D 10 (mm) 0.08 Specific Gravity of Soil, G s 2.62 Minimum Void Ratio, e min Maximum Void Ratio, e max In-situ Void Ratio, e Total Unit Weight, γ t (kn/m 3 ) 19.5 Relative Density, D R (%) 43 A total of six blast events were performed, with half involving single blasts and half multiple blasts. Charge weights ranged from 1 kg to 4.5 kg, with placement depths ranging from 3 m to 9 m. Based upon the available results, only blast tests #2 and #6 were evaluated. Blast #2 is a single blast event, and blast #6 is a multiple blast event involving 4 bore holes (G,H,I, and J) with 3 decks of charges each (1,2, and 3). The layout for Blast #2 and Blast #6 are shown in Figures 3-25 and 3-26, respectively. The charges were cylindrical, and detonated from the bottom up with a delay time of 250 ms between decks and 500 ms between bore holes. Additional details regarding the blasting study are provided by Pathirage (2000) and Al-Qasimi et al. (2005).
69 52 Figure 3-25 Blasting Layout for CANLEX Blast Testing, Blast #2 Pathirage 2000 Figure 3-26 Blasting Layout for CANLEX Blast Testing, Blast #6 Pathirage Test Results Residual pore pressure measurements recorded following blasting are summarized in Table 3.8 below. The recorded Ru with respect to scaled distance are plotted in Figure Although Table 3.8 shows Ru values decreasing during some blasts, Figure 3-27 was
70 53 developed on the assumption that dissipation of excess pore pressures are not occurring. Therefore, the data shown in Figure 3-27 show only the increasing Ru values and their respective scaled distances. Pathirage (2000) identified a best-fit trend line to the data, but the change in scaled distance was accounted for in a different manner than presented in Equation 3-1. For further information on the trend line developed from this study, the reader is referred to Pathirage (2000). Table 3.8 Peak Residual Pore Pressure Readings during CANLEX study Single Blast Test Charge Distance from PPT (m) Residual Pore Pressure Ratio, Ru Number Weight (kg) PPT 1 PPT 2 PPT 1 PPT 2 Blast # Multiple Blast Test Number Charge Weight (kg) Average Radial Distance (m) Residual Pore Pressure Ratio, Ru at 3 m at 6 m at 9 m PPT 1 PPT 2 PPT 1 PPT 2 Blast #6 J I1 + I I J J3+H H H3+G G G
71 Residual Porewater Pressure Ratio, Ru Blast #2 Blast # Scaled Distance, R/W 0.33 (m/kg 0.33 ) Figure 3-27 Pore Pressure Ratio vs. Scaled Distance at CANLEX Through this study, Pathirage (2000) concluded that to simulate actual earthquake ground motions by blasting is not feasible, because frequency characteristics of earthquakes cannot be created with the type of explosives used for CANLEX test. Also, he observed that multiple blasts required less energy than a single blast to generate a specific pore pressure ratio because of the cyclic loading and induced shear strains. The study did show that sequential detonation can be used to investigate the response of installations to the effects of liquefaction during an earthquake. Additional information and discussion regarding the test is provided by Pathirage et al. (2000), Byrne et al. (2000) and Al-Qasimi et al. (2005). 3.9 SOUTH PLATTE RIVER, COLORADO, 1987 Researchers from Colorado State University, Fort Collins performed controlled blasting on a saturated, dense, natural soil deposit along the South Platte River in Colorado with the objective of developing relationships for peak pore pressure response, residual pore pressure response, and peak particle velocity.

72 Site Conditions and Blasting Layout The site was an alluvial deposit consisting of approximately 3.65 m of poorly graded coarse sand underlain by silt. CPT measurements indicated that the sand had a relative density of 70 to 90%, and downhole seismic surveys measured shear wave velocities ranging from 190 m/s to 270 m/s, categorizing the sand as dense. The sand layer was underlain by a lean silt layer. A typical soil profile is shown in Figure 3-28 with additional soil information provided in Table 3.9. Figure 3-28 Typical Soil Profile for South Platte River Study Using six single blasts placed at a depth of 3 meters with charge weights ranging from kg to 9.06 kg, peak and residual pore pressures were generated and monitored at several locations, as shown in Figure Table 3.10 includes the residual pore pressure data and blasting properties recorded for all the detonations, as provided by Charlie et al. (1992).
73 56 Table 3.9 Laboratory Test Results for South Platte River Study (adapted from Charlie et al. 1992) Sand Layer Silt Layer Soil Type SP ML Depth (m) > 3.65 Mean Grain Size, D 50 (mm) 1 to 3 - Effective Grain Size, D 10 (mm) 0.3 to Specific Gravity of Solids, G s Minimum Void Ratio, e min Maximum Void Ratio, e max Total Unit Weight, γ t (kn/m 3 ) 18.4 above GWT below GWT - Permeability, k (cm/s) 3x Atterberg Limits LL/PI / Natural Water Content, w n (%) Figure 3-29 Blasting and Instrumentation Layout for South Platte River Liquefaction Study (from Charlie et al. 1992)
74 57 Detonation Number Table 3.10 Peak Residual Pore Pressure Readings during South Platte test Charge Weight (kg) Adapted from Charlie et al. (1992) Maximum Residual Pore Pressure Ratio, Ru PPT 1 PPT 2 PPT 3 PPT 4 PPT NR NR NR NR NR NR NR NR NR NR NR = No reading recorded (i.e. blast too small to generate significant Ru Test Results Following the blasts, the residual pore pressures were measured and plotted with scaled distance to blast weight for all detonations, as shown in Figure A best-fit line was estimated for the data, and had a correlation value of The equation is developed specifically for single blasts, and is provided below: 3-2 The highest Ru was 0.65, indicating that liquefaction was not achieved. Based upon their results, Charlie et al. (1992) extrapolated that liquefaction could be produced in dense sand through explosives at a scaled distance of 3 m/kg 1/3, with an overburden pressure at 38 kpa when the peak compressive strain had exceeded 0.01%. The threshold for residual pore pressure generation was observed to be at a scaled distance of 16 m/kg 1/3, or at the peak compressive strain of 0.002%. The study concluded that pore pressure generation to liquefaction at a given peak compressive strain decreases with increasing effective stress, indicating that more energy is required to liquefy denser soils than looser soils at the same depth.
75 Residual Porewater Pressure Ratio, Ru Scaled Distance, R/W 0.33 (m/kg 0.33 ) Blasting Data "Best fit" proposed by Charlie et al., 1992 (R2 = 0.59) Figure 3-30 Measured residual PPR vs. scaled distance in South Platte River blasting study
76 Residual Porewater Pressure Ratio, Ru RESULTS A good scientist is a person with original ideas. A good engineer is a person who makes a design that works with as few original ideas as possible. Freeman Dyson, American Physicist and Mathematician 4.1 PORE PRESSURE RESULTS FROM CASE HISTORIES Using Equation 3-1 to estimate the scaled distances, the measured residual pore pressure ratios, Ru, for multiple blasts from the case histories in Chapter 3 are plotted in Figure 4-1. Results for the single blasts are plotted in Figure 4-2. The data is also included in Appendix B. In all the succeeding figures for multiple blasts, it should be noted that the scaled distance was estimated using Equation 3-1, where as the scaled distance for single blasts is simply R/W CANLEX (Pathirage 2000) Treasure Island (Ashford & Rollins 2002) British Columbia (Gohl et al. 2001) Tokachi, Japan (Ashford et al. 2006) Maui (Rollins et al. 2004) British Columbia (Strand 2008) Ishikari, Japan (PARI, 2009) Scaled Distance, R/W 0.33 (m/kg 0.33 ) Figure 4-1 Pore Pressure Response vs. Scaled Distance for Multiple Blasts
77 Residual Porewater Pressure Ratio, Ru Colorado (Charlie et al. 1992) CANLEX (Pathirage 2000) British Columbia (Gohl et al. 2001) Maui (Rollins et al. 2004) Tokachi, Japan (Ashford et al. 2006) Scaled Distance, R/W 0.33 (m/kg 0.33 ) Figure 4-2 Pore Pressure Response vs. Scaled Distance for Single Blasts Upon first observation, the results follow a general trend of an increasing residual pore pressure ratio (Ru) with a decrease in scaled distance (SD) for both multiple and single blasts. In a comparison between the multiple blasts and the single blasts in Figures 4-1 and 4-2, respectively, it appears that the slope of Ru with SD is steeper for multiple blasts than for single blasts. A steeper slope indicates that at a given scaled distance multiple blasts would generate a larger pore pressure response than a single charge of equivalent weight. By using the scaled distance as a proxy for energy, a steeper slope would also indicate that less energy is required to develop residual pore pressure. This observation agrees with the current practice of using multiple blasts to more effectively generate residual pore pressures rather than a large single blast based upon the fact that pore pressure is more efficiently generated during cyclic loading than monotonic loading.
78 Residual Porewater Pressure Ratio, Ru EVALUATION OF EXISTING EMPIRICAL MODELS Current empirical models used to predict pore pressure response based upon scaled distance were presented in Chapter 2.3. As described in that section, most of the empirical models were developed for single blasts, and typically do not account for soil or site conditions. The most referenced empirical model used in blasting studies is the Studer and Kok (1980) model which was developed for single blasts. In regards to multiple blasts, the Rollins et al. (2004) empirical model is the only referenced model for multiple blasts found in the literature and is explained in more detail in Section 2.4. These trend lines are plotted with the results for single and multiple blasts from the case histories in Figure Single Blasts Multiple Blasts Studer & Kok (1980) Rollins et al. (2004) Scaled Distance, R/W 0.33 (m/kg 0.33 ) Figure 4-3 Studer & Kok (1980) and Rollins et al. (2004) empirical models compared with single and multiple blasts results
79 Residuals Single Blast Comparison to Empirical Model In evaluating the single blast data, a residual plot was developed comparing the Ru observed to the Ru predicted by the Studer and Kok (1980) model and is provided in Figure 4-4. From observation of Figure 4-3, the Studer and Kok (1980) model estimates excess pore pressure generation to initiate at a scaled distance of approximately 13, wherein fact observed data showed that excess pore pressures were generated at scaled distances greater than 13. Therefore, in performing the residual analysis for values with scaled distances greater than 13, the observed Ru was the residual value. In observing the residual plot, the Studer and Kok (1980) provides an average residual value of -0.2 for scaled distances less than 10, which is typically the area of interest. From this analysis it can be concluded that the Studer and Kok (1980) does not provide a good fit to the analyzed data and may in fact not provide a good fit to data with soil properties outside the conditions from which it was developed Residual Plot of Ru for Single Blasts Scaled Distance, R/W 0.33 Figure 4-4 Residual Plot of Single Blasts Data to Studer and Kok (1980) model
80 Residual Porewater Pressure Ratio, Ru 63 In Figure 4-5, the single blasts are plotted against the Studer and Kok (1980) model including the range of the model provided by Narin van Court and Mitchell (1994). In addition, the observed trend line is graphed with an equation and the correlation coefficient, R 2 value, provided. From this figure it is readily observed that the best fit trend line plotted for the data is significantly different than Studer and Kok (1980). The slope of the best fit line is significantly lower than Studer and Kok (1980), and appears to provide a much better fit to the data Studer and Kok (1980) single blasts Log. (single blasts) y = ln(x) R² = Scaled Distance, R/W 0.33 (m/kg 0.33 ) Figure 4-5 Residual Plot of Single Blasts Data to Studer and Kok (1980) model Comparison of Multiple Blasts to Empirical Model In Figure 4-6, the multiple blasts data is plotted with the Studer and Kok (1980) average and range trend lines as well as the Rollins et al. (2004) trend line. The Studer and Kok (1980) model appears to bisect the multiple blasts data while the model proposed by
81 Residual Porewater Pressure Ratio, Ru 64 Rollins et al. (2004) appears to serve more as a outer boundary for the data. This does not invalidate Rollins et al. (2004) but suggests that the method in accounting for the change in scaled distance is different than that used to develop the data. A linear (based upon the semi-log plot) trend line is provided in Figure 4-6. With an R 2 value of 0.44, the trend line indicates that blasting conditions (i.e. scaled distance) alone does not provide a good representation or fit to the data. Therefore, it is conclusive that additional parameters should be considered to provide a better fit to the data Studer and Kok (1980) multiple blasts Rollins et al. (2004) Log. (multiple blasts) y = -0.35ln(x) R² = Scaled Distance, R/W 0.33 (m/kg 0.33 ) Figure 4-6 Multiple Blasts comparison to existing empirical models and observed trend lines In a comparison plot of the residuals shown in Figure 4-7, the existing empirical models can be evaluated. The Studer and Kok (1980) exhibits a lot of scatter for scaled distances less than 10, and then transitions to under-predicting the Ru values for scaled distances greater than 10 at a relatively constant residual of The Rollins et al. (2004) exhibits scatter for scaled distances less than 8, but mostly over-predicts the observed Ru for scaled distances greater than 0.8.
82 Residuals Residual Plot of Ru for Multiple Blasts Studer and Kok (1980) Rollins et al. (2004) Scaled Distance, R/W 1/3 Figure 4-7 Residual Plot of Multiple Blasts Data to Studer and Kok (1980) model and Rollins et al. (2004) model Both of the existing models presented are solely based on scaled distance and neglect the possible influence that in-situ conditions may have on the generation of pore pressures, either for single blasts or multiple blasts. Although these models may have provided a reasonable fit for the site/soil conditions from which they were developed, they do not serve as a good general fit to the case history data investigated in this research. 4.3 DEVELOPMENT OF A NEW EMPIRICAL MODEL Pore Pressure Effect due to Relative Density Generally for liquefaction to occur, the soil needs to be loose, saturated granular material. Assuming that the soil consists of sand to silty sand below the groundwater table, the remaining independent parameter is the in-situ relative density of the soil. As described in Chapter 2, the relative density (D R) is commonly correlated to SPT (N 1) 60
83 Residual Porewater Pressure Ratio, Ru 66 values (as well as CPT tip resistance) because of the difficulty in measuring it accurately due to sample disturbance. Based upon the case histories data, the blasting results were categorized based upon the reported relative densities from the boring logs, or if they were unavailable, from the SPT (N 1) 60 correlated values based upon Kulhawy and Mayne (1990). The relative densities were categorized into 4 groups: (1) very loose (D R of 0 15%), (2) loose (D R of 15 35%), (3) medium dense (D R of 35 65%), and (4) dense (D R of 65 85%). Figures 4-8 and 4-9 display the distribution of relative densities for the multiple and single blasts, respectively Very Loose (0-15%) Loose (15-35%) Medium Dense (35-65%) Dense (65-85%) Scaled Distance, R/W 0.33 (m/kg 0.33 ) Figure 4-8 Pore pressure response for multiple blasts categorized by relative density
84 Residual Porewater Pressure Ratio, Ru Loose (15-35%) Medium Dense (35-65%) Dense (65-85%) Scaled Distance, R/W 0.33 (m/kg 0.33 ) Figure 4-9 Pore pressure response from single blasts categorized by relative density From these figures, it is observed that for a given scaled distance, the looser soils can generate a higher Ru than for denser soils. This agrees with the fact that the looser soils are more susceptible to liquefaction than denser soils, thus requiring less energy (i.e. larger scaled distance) to generate residual pore pressures. Also from these results, it appears that significant excess pore pressures were able to be generated in the denser soils, which may not be typically encountered in actual soils following earthquakeinduced shaking. This could possibly indicate that the soil was subjected to a greater amount of energy during blasting than would be realistic during a large earthquake. Based upon the distribution of data with respect to relative density, it is evident that insitu conditions do play a role in the pore pressure generation for multiple blasts and perhaps even with single blasts. Generally, the denser the soil, more energy is required to increase the pore pressure ratio and ultimately reach liquefaction. However, too much energy can cause significant pore pressure generation that would not be expected, even for a large earthquake.
85 Multiple Regression Analysis To identify which in-situ parameters may play a significant role in the pore pressure generation during blasting, several multiple regression analyses were performed on both the multiple and single blasting data using different combinations of common in-situ parameters with respect to the scaled distance. The parameters chosen to use in the analysis were those that were consistently provided on boring logs and laboratory reports, or those that could easily be calculated based upon the provided information, and included corrected SPT (N 1) 60 values, initial relative densities D r, corrected shear wave velocities v s1, initial effective overburden pressure σ vo, and the cyclic resistance ratio (CRR) as determined from the Youd et al. (2001) simplified method. However, it should be noted that these parameters are not solely independent parameters, but some are dependent on one another. For example, the SPT (N 1) 60 values, corrected shear wave velocities, and CRR are all influenced by the effective overburden pressure σ vo in their calculations. Therefore, to evaluate the data, Microsoft Excel 2007 s multiple regression analysis tool was used to perform several multiple regression analyses using the conventional logarithmic-based fit that provides a linear trend line on the semi-log plot. However, upon observing the development of pore pressure with each successive blast followed a curved trend as shown in Figures 3-10 and 3-18 for Vancouver and Tokachi, respectively, a power-based analysis was also provided. The resulting correlation coefficients, R 2, from selected tests are summarized in Table 4.1 for the specific in-situ parameters analyzed for multiple and single blasts. Additional tests were performed, including variations in accounting for the in-situ parameters (i.e. the product of (N 1) 60 and σ vo, etc.) but were not included in this table as they did not improve the fit to the data. Complete results of the analysis are provided in Appendix C.
86 69 Test No. Table 4.1 Parameters and Adjusted Correlation Coefficient using in Multiple Regression Analysis for Multiple and Single Blasting Data Blasting parameters Residual Pore Pressure, Ru Multiple Blasts Scaled Distance, R/W 0.33 (m/kg 0.33 ) Relative Density, D R (%) Effective Overburden Pressure, σ vo (kpa) In-situ parameters SPT N 1( 60) value Cyclic Resistance Ratio, CRR Shear Wave Velocity, v s1 (m/s) Adjusted Correlation Coefficient, R 2 Log / Power 1 X X X X X X X X X X X X X X X X X X X X X X X X X X X X X X X X X X X X X X X X X X X Single Blasts 1 X X X X X X X X X X X X X X X X X The correlation coefficient, R 2, describes the variability of the predicted data (i.e. Ru) as explained by the predictor (i.e. scaled distance, in-situ conditions, etc.). In other terms, the correlation coefficient forecasts how well future events are able to be predicted by the model by describing the linear association of the dependent factor (in this case, Ru) to the regressors (i.e. scaled distance and the in-situ parameters), with a R 2 approaching ± 1 indicating a good fit of the model to the data. The adjusted R 2 indicates that the original R 2 has been negatively adjusted to compensate for using multiple parameters in the regression model (Montgomery and Runger 2003).
87 70 In performing the regression analysis, p-value tests were also calculated for each parameter used in the regression. A p-value test represents the probability that the test statistic will take on a value that is at least as extreme as the observed value of the statistic when the null hypothesis is true (Montgomery and Runger 2003). Typically, p- values less than 0.05 indicate that the parameter should be included in the analysis while p-values greater than 0.05 would indicate that the parameter can be excluded confidently from the regression analysis. In the regression analyses performed for single blasts, when in-situ conditions were considered, the p-value tests for each in-situ index was greater than 0.05, indicating that it did not provide an improved fit to the data. This is also represented by the decrease in the correlation coefficient when in-situ conditions were considered Empirical Model for Multiple Blasts The regression analysis for multiple blasts provided many helpful insights to understanding the effects due to blasting. From Table 4.1, Test #1 confirms statistically that scaled distance alone is not a sufficient parameter to estimate pore pressure as the R 2 value is Although Figure 4-4 indicated that relative density clearly played a role in the pore pressure response during blasting, the R 2 of 0.49 for the log-based analysis and 0.56 for the power-based analysis indicates that scaled distance and relative density are not sufficient either in providing a decent fit to the data. Test #4 with SPT (N 1) 60 values, producing an R 2 of 0.57 for the log-based analysis and 0.61 for the power-based analysis provided the best fit of the in-situ parameters when used with scaled distance. And when effective overburden stress was included with SPT (N 1) 60 values and scaled distance in Test #7, the R 2 was 0.64 for the logarithmic-based analysis and 0.65 for the power-based analysis. This is considered the most practical of the models as SPT in-situ are typically performed during blasting experiments and the effective overburden pressure much be estimated in calculating SPT (N 1) 60.
88 Residual Porewater Pressure Ratio, Ru 71 The equation for the empirical model for Test #7 based upon the logarithmic-based fit and power-based fit are provided in Equations 4-1 and 4-2, respectively where R/W 0.33 is the scaled distance between explosive and point of interest in m/kg 0.33, and the effective overburden pressure, σ v0, is in kpa. Based upon the p-value test shown in Appendix C, the SPT (N 1) 60 values play a more significant role than the effective overburden pressure. Each of the models and their calculated 95% confidence intervals are displayed in Figures 4-10 and 4-11, assuming an effective overburden pressure of 50 kpa and SPT (N 1) 60 value of 5. The equations for the confidence intervals are provided in Appendix C Log-Based Empirical Model Shown with σ' V = 50 kpa and (N 1 ) 60 = Scaled Distance, R/W 0.33 (m/kg 0.33 ) Figure 4-10 Log-based Empirical Model developed for Multiple Blasts (shown with 95% confidence limits)
89 Residual Porewater Pressure Ratio, Ru Power-Based Empirical Model Shown with σ' V = 50 kpa and (N 1 ) 60 = Scaled Distance, R/W 0.33 (m/kg 0.33 ) Figure 4-11 Power-based Empirical Model developed for Multiple Blasts (shown with 95% confidence intervals) A comparison of these two models are plotted with SPT (N 1) 60 values of 5 and 20 in Figure 4-12 with an effective overburden pressure of 50 kpa. For loose soils (SPT (N 1) 60 value of 5), the scaled distance for liquefaction to occur for the log-based model and power-based model is 2.5 and 3.6 m/kg 0.33, respectively, a difference of approximately 30%. It is approximately the same difference with the denser soil (SPT (N 1) 60 value of 20). The models are relatively similar for Ru greater than 0.1, with the greatest difference between the two observed as Ru approaches 1.0. For Ru values less than 0.1, the models are significantly different but it is considered not a great concern as blasting studies are concerned with generating Ru much greater than 0.1.
90 Residual Porewater Pressure Ratio, Ru Power Model Logarithmic Model Shown with σ' V = 50 kpa (N 1 ) 60 = (N 1 ) 60 = Scaled Distance, R/W 0.33 (m/kg 0.33 ) Figure 4-12 Comparison of Logarithmic Model and Power Model for Multiple Blasts Although it has been determined that the models are relatively similar, the deciding factor in which model is the best can be determined in a comparison of the models to the observed blasting data. In Figure 4-13, the residual plots of the observed Ru and the predicted Ru by each of the models are shown. The power-based empirical model provides a better fit to the observed data for scaled distances greater than 10, but for scaled distances less than 10 it may be difficult to identify which model provides the better fit. Both models produce a lot of scatter for scaled distances less than 10. However, when looking at scaled distances less than 5, which is typically the zone of liquefaction observed in the blasting studies, the power-based model begins to consistently overestimate the Ru. Therefore, from this observation and the goal being to determine which model would serve as the better predictor of liquefaction, the log-based model is the better choice.
91 Residuals Log-Based Empirical Model Power-Based Empirical Model Scaled Distance, R/W 0.33 Figure 4-13 Residual plot for log-based and power-based empirical models Empirical Model for Single Blasts For the multiple regression analyses for single blasts in Table 4.1, the results show that even though in-situ parameters played a significant role for residual pore pressure generation in multiple blasts, the best fit of the data was based on the scaled distance alone. In fact, all of the tests using in-situ parameters had p-value tests greater than 0.05, indicating that their contribution to the overall regression is influential. However, this is could be due to multiple reasons. One explanation is that there is simply not enough data and that a large portion of the data analyzed came from one test. Therefore, the best model is represented by the logarithmic fit of scaled distance alone as shown in test #1 with an R 2 of This empirical model is represented by equation
92 Residual Porewater Pressure Ratio, Ru 75 Figure 4-14 provides a comparative plot of this model with the data used in the analysis. For scaled distances smaller than 2.2 and greater than 30, the empirical model is extrapolated to show its projected path Empirical Model for Single Blasts single blasts Extrapolated Area Extrapolated Area Scaled Distance, R/W 0.33 (m/kg 0.33 ) Figure 4-14 Empirical Model for Single Blasts shown with 95% confidence intervals
93 DISCUSSION Engineering is the art of modeling materials we do not wholly understand, into shapes we cannot precisely analyze so as to withstand forces we cannot properly assess, in such a way that the public has no reason to suspect the extent of our ignorance. Dr. A.R. Dykes, British Institution of Structural Engineers 5.1 VALIDATING EMPIRICAL MODELS Empirical models for estimating buildup of residual pore pressure for controlled blasting studies using both multiple blasts and for single blasts have been developed based upon case history data. A model is best evaluated under rigorous testing. Unfortunately, the empirical models presented in Chapter 4 are based solely upon case history data and are not able to be tested experimentally in the field. Although it would have been useful to validate these models through actual blasting experiments, this was the beyond the scope of this proposed research. Therefore, in order to evaluate if the models are an improvement to existing models, comparisons will be made to several case histories. 5.2 EVALUATION OF EMPIRICAL MODEL FOR MULTIPLE BLASTS Maui Comparison The Maui study (Rollins et al. 2004) as presented in Section 3.4, provided a unique opportunity to observe pore pressure generation with each blast for a relatively simple blasting layout. The site conditions consisted of an effective overburden pressure of 60 kpa and SPT (N 1) 60 value of 6 blows per 30 cm. Two blasting sequences consisting of 8 charges each were performed, with the second blast utilizing explosives at approximately half the distance to the center than the first blast. The results are plotted against the empirical model developed for multiple blasts (Equation 4-1) as well as the model proposed by Rollins et al. (2004) in Figure 5-1. As shown in Figure 5-1, the first blast was well-represented by the Rollins et al (2004) model, while the second blast was better represented by the empirical model. This is interesting because the only reported change that occurred was the blasting layout. However, one possible explanation is that both blasts were performed within the same area with 24 hours in between studies and
94 Residual Porewater Pressure Ratio, Ru 77 during the first blast study, there was significant settlement (40 cm) that undoubtedly would have affected the in-situ soil conditions by increasing the density which may result in an increase in SPT (N 1) 60 value and effective overburden pressure. This would theoretically require more energy to achieve liquefaction during the second blasts than observed in the first blast Blast #1 Blast #2 Empirical Model Rollins et al. (2004) Shown with σ' V = 60 kpa and (N 1 ) 60 = Scaled Distance, R/W 0.33 (m/kg 0.33 ) Figure 5-1 Comparison of the Empirical Model to the Maui Blasting Study A plot of the residuals from the blast #1 and blast #2 is shown in Figure 5-2. The average difference in Ru between the observed and predicted were 0.27 and 0.03 in blasts #1 and #2, respectively. This portrays the data from blast #1 as possibly being an outlier, perhaps due to an inaccurate SPT (N 1) 60 value or effective overburden pressure. However, to compare how well the model represents the actual data, a paired t-test using Microsoft Excel Statistical Data Analysis was performed on the observed Ru values and the Ru values predicted by the model, with results provided in Table 5-1. From the two-tailed P-test attained from the paired t-test, the results (P(T<=t) two-tail = ) indicate that the model provides a statistically good fit to the data as the P-test is less than the 0.05, with a much better fit being achieved when only looking at blast #2.
95 Residuals Blast #1 Blast # Scaled Distance, R/W 1/3 Figure 5-2 Residual plot of Blast #1 and Blast #2 of Maui Blasting Study Table 5.1 Evaluation of Empirical Model to Maui Blasting Study for both blasts t-test: Paired Two Sample for Means Ru - Observed Ru Predicted (from model) Mean Variance Observations Pearson Correlation Hypothesized Mean Difference 0 df 14 t Stat P(T<=t) one-tail t Critical one-tail P(T<=t) two-tail t Critical two-tail
96 Residual Porewater Pressure Ratio, Ru 79 The difference between the empirical model and the model developed by Rollins et al. (2004) indicates that there may be a difference on how the scaled distance may be accounted for. Therefore, a residual plot was not performed between the two models. The results do not invalidate the Rollins et al. (2004) model but simply imply that it was developed on a different basis Vancouver Comparison The Vancouver (Strand 2008, Rollins et al. 2004) pilot study utilized a simple circular array for the charge layout as explained in Section 3.3. The site conditions were generalized throughout the soil profile, with an average effective overburden pressure of 100 kpa and average SPT (N 1) 60 value of 10 blows per 30 cm. A comparison plot of the blasting data to the empirical model with 95% confidence intervals is provided in Figure 5-3. From observation, the average predicted trend (represented by the dashed line) provides a decent fit to the data Blasting Data (Max Ru) Empirical Model Shown with σ' V0 = 100 kpa and (N 1 ) 60 = Scaled Distance, R/W 0.33 (m/kg 0.33 ) Figure 5-3 Comparison of empirical model to Vancouver pilot study with incremental values shown
97 Residuals 80 In order to statistically evaluate the model, the same approach used in the Maui comparison (Section 5.2.1) is used here as well. The residuals of the observed Ru and the predicted Ru by the empirical model are plotted against the scaled distance and the observed Ru in Figures 5-4 and 5-5, respectively. From Figure 5-4, the average residual values for blast #1 and blast #2 are and 0.01, respectively. From Figure 5-5, it is observed that the model mostly over-predicts the Ru for blast #1, while transitioning to over-predicting the observed Ru for values approaching 1.0 as seen during blast #3. However, there does not appear to be any outliers that can be identified. A paired t-test was performed to further determine how well the model fit the data, and the results are provided in Table 5-2. The two-tailed P-test obtained from the t-test performed on the observed Ru and predicted Ru indicated that the model provides a good statistical fit to the data Blast #1 Blast # Scaled Distance, R/W 0.33 Figure 5-4 Residual plot from Vancouver Pilot Test compared to scaled distance
98 Residuals Blast #1 Blast # Observed Ru Figure 5-5 Residual plot from Vancouver Pilot Test compared to observed Ru Table 5.2 Statistical Evaluation of Empirical Model to Vancouver Pilot Study t-test: Paired Two Sample for Means Ru - Observed Ru - Predicted Mean Variance Observations Pearson Correlation Hypothesized Mean Difference 0 df 190 t Stat P(T<=t) one-tail E-09 t Critical one-tail P(T<=t) two-tail E-09 t Critical two-tail
99 Residual Porewater Pressure Ratio, Ru Tokachi Comparison The Tokachi experiment consisted of a much more complex blasting layout than the Maui and Vancouver studies, using a larger blasting area with over 120 charges used to liquefy the soil as explained in Section 3.5. A plot of the blasting data from the full-scale test #1 is compared with the empirical model and 95% confidence intervals in Figure 5-6 based upon the generalized site conditions of an average effective overburden pressure of 45 kpa and SPT (N 1) 60 value of 2. In observing Figure 5-6, the blasting data follows more of an exponential increase (based upon the semi-log plot) in Ru with scaled distance rather than the projected linear trend (on a semi-log plot) by the empirical model. As Ru approaches 1.0, it falls outside the 95% confidence intervals of the empirical model. However, the model appears to provide a good fit to the data that fall below Ru of Blasting Results Empirical Model with 95% Confidence Intervals Shown with σ' V0 = 45 kpa and (N 1 ) 60 = Scaled Distance, R/W 0.33 (m/kg 0.33 ) Figure 5-6 Comparison of the empirical model to the Tokachi Full-Scale Test #1
100 Residuals 83 To further investigate the validity of the model for the Tokachi blast results, a residual plot compared to scaled distance and observed Ru were developed based upon the pore pressure transducer (PPT) depths of 2, 4 and 6 m, and are shown in Figures 5-7 and 5-8, respectively. In these figures, it is observed that the Ru measured by PPT at 2 m and 6 m was similar to the predicted values from the empirical model, while values measured at 4 m were significantly different and for the most part, inconsistent. In Figure 5-7, the graphs shows that at a depth of 4 m, the empirical model overestimated the Ru for scaled distances greater than 10 and transitioned to underestimating the Ru for scaled distances less than 10. In Figure 5-8, the results show that the model over-predicted the observed Ru for PPT at 2 m and 6 m for observed Ru values less than 0.45, and then transitioned to under-prediction for observed Ru values greater than From the same figure, the results for PPT at 4 m showed that the empirical model overestimated the Ru for lower observed Ru values while underestimating the Ru for higher observed Ru values PPT at z = 2 m PPT at z = 4 m PPT at z = 6 m Scaled Distance, R/W 0.33 Figure 5-7 Residual plot of the Tokachi full-scale blast #1 compared to scaled distance (categorized by depth of pore pressure transducer)
101 Residuals PPT at z = 2 m PPT at z = 4 m PPT at z = 6 m Observed Ru Figure 5-8 Residual plot of the Tokachi full-scale blast #1 compared to observed Ru (categorized by depth of pore pressure transducer) As with the previous case histories, a paired t-test was performed to evaluate how well the model represented the data, with results shown in Table 5-3. Based upon the two-tail P-test, the result of indicates that the model does not provide a good fit to the data. One significant factor to this result is that the blasting layout was much more complex than that used at Maui or Vancouver, and that the method used to account for the change in scaled distance (Equation 3-1) may be inapplicable to such blasting layouts. In addition, the soil profile used in the analysis was a generalized profile and may not accurately represent the soil conditions existing during blasting.
102 85 Table 5.3 Statistical Evaluation of Empirical Model to Tokachi Pilot Study t-test: Paired Two Sample for Means Ru - Observed Ru - Predicted Mean Variance Observations Pearson Correlation Hypothesized Mean Difference 0 df 108 t Stat P(T<=t) one-tail t Critical one-tail P(T<=t) two-tail t Critical two-tail Ishikari Comparison In the Ishikari blasting study described in Chapter 3.3, the site conditions were considered to be similar for both the pilot and full-scale study (in the unimproved area), with blasting performed mostly in reclaimed sand with an average effective overburden pressure of 45 kpa and average SPT (N 1) 60 value of 5 at a depth of 4 m. Blasting during the pilot study followed a simple square-grid layout using 32 blasts while the full-scale study used over 500 blasts and consisted of a much more complex blasting layout and sequence than seen in previous case histories. The blasting results for the 2 studies are plotted with the empirical model accompanied with the 95% confidence intervals in Figure 5-9. From the figure, the model appears to provide a better fit to the pilot test, while the full-scale test results are not wellrepresented by the model. In predicting liquefaction, the model provides a slightly overestimate of the scaled distance for the pilot study while being off by nearly 60% for the full-scale test.
103 Residual Porewater Pressure Ratio, Ru Pilot Test Full-Scale Test Empirical Model with 95% Confidence Intervals Shown with σ' V0 = 45 kpa and (N 1 ) 60 = Scaled Distance, R/W 0.33 (m/kg 0.33 ) Figure 5-9 Comparison of empirical model to Ishikari pilot test The residuals for both the pilot study and full-scale study are plotted against the scaled distance and observed Ru, and are shown in Figures 5-10 and 5-11 respectively. The residuals for the pilot test generally range from to 0.15, while the full-scale study residuals range from to This may indicate that there is a significant difference between the two tests. A paired t-test was performed on the data to determine the fit of the model to the data. From the two tail P-test result of 0.177, the model was concluded as not providing a good fit to the combined pilot and full-scale study data. To determine if the model provided a better fit to the individual studies, separate paired t-tests were performed on both the pilot test and full-scale test. However, in performing these separate paired t-tests, the p- test indicated the same conclusion: that the model does not provide a good fit to the data.
104 Residuals Residuals Pilot Test Full-Scale Test Scaled Distance, R/W 0.33 Figure 5-10 Residual plot of Ishikari pilot study and full-scale test to empirical model compared to scaled distance 0.3 Pilot Test Full-Scale Test Observed Ru Figure 5-11 Residual plot of Ishikari pilot study and full-scale test to empirical model compared to observed Ru
105 88 Table 5.4 Statistical Evaluation of Empirical Model to Ishikari Pilot and Full-Scale Study t-test: Paired Two Sample for Means Ru - observed Ru - predicted Mean Variance Observations Pearson Correlation Hypothesized Mean Difference 0 df 17 t Stat P(T<=t) one-tail t Critical one-tail P(T<=t) two-tail t Critical two-tail In reviewing the results, there were two main concerns that may explain why the model did not provide a good fit to the data. The pilot study consisted of a relatively simple layout, but the time delay between blasts #1 and #2 was over 30 minutes, which could affect pore pressure generation if the pore pressure did not completely dissipate during that period. The analysis assumed that full dissipation did occur, but it was unknown if this was actually the case. The full-scale study utilized a very complex blasting pattern, using over 500 charges placed throughout the site. During the blasting sequence, the soil may be subjected to the blast loads in the beginning, but begins to be unaffected as the blasting occurs at farther distances. During this time pore pressure dissipation can occur before it is subjected to a second round of blasts as the sequence returns within the radius of influence of the pore pressure transducers Overall Evaluation of Empirical Model for Multiple Blasts To evaluate the validity of the model, graphical comparisons and paired t-tests of the empirical model were made to four different blasting studies consisting of different blasting layouts. It was observed that the empirical model provided a statistically good
106 89 fit to the data for case histories that consisted of simple blasting layouts, such as a simple square grid or circular array. As the blasting layout becomes more complex, such as an increase in the number of blasts or the sequence of blasting, the model did not provide a good fit to the data as shown on both the graphs and paired t-tests. The R 2 value of the empirical model was 0.65, indicating that there are other uncertainties that must be considered to develop a model that will provide a much better fit. These uncertainties can include blasting layout, as shown above, as well as blasting pattern and time delays between blasts. Other considerations may be in regards to additional in-situ soil conditions, such as the soil permeability, cementation, or other aging factors that may exist. 5.3 EVALUATION OF EMPIRICAL MODEL FOR SINGLE BLASTS Figure 5-12 shows the empirical method developed for single blasts (Equation 4-3) plotted with the models developed by Studer and Kok (1980), Kummeneje and Eide (1961), and Charlie and Doehring (2006) with the observed case history data. An effective overburden pressure of 50 kpa is assumed for the Kummeneje and Eide (1961) model. From observation, the best fitting models are the Kummeneje and Eide (1961) model and the empirical model. The Kummeneje and Eide (1961) model appears to do a better job in predicting high Ru values than the empirical model, and appears to do an overall better job representing the data. The data used in the analysis had a maximum Ru value of 0.64, which caused the empirical model to be subject to extrapolation for Ru values that exceed that value. To evaluate how the model compared to the existing models, residual plots were developed based upon the scaled distance and the observed Ru, and are shown in Figures 5-13 and The existing models overestimate the Ru for scaled distances less than 10 while the new model under-predicts the Ru. For the observed Ru residual plot, the empirical model consistently under-predicts the Ru for the range of Ru values investigated (0 to 0.64). Based upon the residual plots, the empirical model provided the best fit to the data.
107 Residuals Residual Pore Pressure, Ru Empirical Model - Single Blasts Studer & Kok (1980) Kummeneje & Eide (1961) Charlie & Doehring (2007) single blasts Scaled Distance, R/W 0.33 (m/kg 0.33 ) Figure 5-12 Comparison of empirical model for single blasts to existing models 0.50 Residual Plot of Ru for Single Blasts Studer & Kok (1980) Kummeneje & Eide (1961) Charlie & Doehring (2007) Empirical Model Scaled Distance, R/W 0.33 Figure 5-13 Comparison of empirical model for single blasts with existing models with recorded case history data
108 Residuals Residual Plot of Ru for Single Blasts Studer & Kok (1980) Kummeneje & Eide (1961) Charlie & Doehring (2007) Empirical Model Scaled Distance, R/W 0.33 Figure 5-14 Comparison of empirical model for single blasts with existing models with recorded case history data 5.4 MULTIPLE BLAST MODEL AND SINGLE BLAST MODEL COMPARISON In an attempt to be practical for blasting experiments, a question arose about the difference between the multiple blast empirical model (equation 4-1) and the empirical model for single blasts. Using the case history data developed from single blasts, an evaluation was made into how well the empirical model developed for multiple blasts compared to the single blasts empirical model in predicting Ru values for single blasts. Based upon the observed Ru and the predicted Ru using the models, residual plots based upon scaled distance and observed Ru are shown in Figures 5-15 and 5-16, respectively. In Figure 5-15, both models underestimate the Ru for scaled distances greater than approximately 13 and then overestimate the Ru for scaled distances less than 13. Both models overestimate the Ru for observed Ru greater than 0.2, but the Studer and Kok (1980) produces a greater range of residual values.
109 Residuals Residuals Scaled Distance, R/W 0.33 Empirical Model - Single Blasts Empirical Model - Multiple Blasts Figure 5-15 Comparison of residual plot of empirical models for multiple blasts and single blasts with single blasts data compared to scaled distance Empirical Model - Single Blasts Empirical Model - Multiple Blasts Observed Ru Figure 5-16 Comparison of residual plot of empirical models for multiple blasts and single blasts with single blasts data compared to observed Ru
110 93 To further compare the models against the single blasts data, paired t-tests were performed between the observed Ru and the predicted values from the single blast model and the multiple blasts empirical model, with results shown in Tables 5-5 and 5-6 respectively. Using the two-tail P-test as a determining factor of how well the model fits the data, the models were able to be evaluated for best fit. From Table 5-5, the P-test from the single blasts was 0.91, indicating that it is not a good fit to the data as it exceeds the determining value of However, in Table 5-6, it is observed that the P-test value for the empirical model for multiple blasts is well below 0.05, indicating that empirical model statistically provides a good fit to the single blasts data. Therefore, it can be concluded that the empirical model developed for multiple blasts can be used for single blasts as well. Table 5.5 Statistical Evaluation of Studer and Kok (1980) model to Single Blasts Case History Data t-test: Paired Two Sample for Means Empirical Model - Single Blasts Ru - Observed Ru - Predicted Mean Variance Observations Pearson Correlation Hypothesized Mean Difference 0 df 31 t Stat P(T<=t) one-tail t Critical one-tail P(T<=t) two-tail t Critical two-tail
111 94 Table 5.6 Statistical Evaluation of empirical model for multiple blasts to Single Blasts Case History Data t-test: Paired Two Sample for Means Empirical Model - Multiple Blasts Ru - Observed Ru - Predicted Mean Variance Observations Pearson Correlation Hypothesized Mean Difference 0 df 31 t Stat P(T<=t) one-tail E-06 t Critical one-tail P(T<=t) two-tail E-05 t Critical two-tail DESIGN EXAMPLE From this research, it has been shown that when in-situ conditions such as SPT (N 1) 60 values and effective overburden pressure are considered, the Ru is better predicted than with the conventional method of using the scaled distance. With the use of this model, design of blasting studies may be able to minimize the number of pilot tests performed, as well as having a good approximation of the zone of liquefaction. This can prevent adverse effects of pore pressure buildup in areas adjacent to the blasting zone. To demonstrate how this model can be used in design of a blasting experiment, an example is provided below: Example: Given: A blasting study will be performed on loose saturated sand within a 6 m radius using a circular array of explosives, as shown in Figure The sand layer is approximately 10 m in depth, with the groundwater table at the surface. The saturated unit weight (γ sat) is 20 kn/m 3 and the average SPT (N 1) 60 value was 5 blows per 30 cm. A pore pressure transducer will be placed
 and placed in eight different boreholes as shown in Figure 5-12.")
112 95 at the center of the array at a depth of 5 m. The explosives will also be at a depth of 5 m (this can be an average depth of a decked explosives or just one explosive) and placed in eight different boreholes as shown in Figure Figure 5-17 Blasting Layout and Soil Profile used for Example Design Problem Find: Determine the required charge weight to cause liquefaction (Ru = 1.0) in the center of the blasting area as measured by the pore pressure transducer. Solution: Step 1: Design Curve Plot the empirical model (Equation 4.1) with the in-situ measurements in order to develop the design curve (shown in Figure 5-13). Confidence intervals for the 95% limits are provided (see Appendix C).
113 Residual Porewater Pressure Ratio, Ru 96 Step 2: Extent of Liquefaction From Figure 5-14, the extent of liquefaction using the average scaled distance value (solid line) is approximately 2.3 m/kg 0.33, with confidence intervals ranging from 1.9 to 4.0 m/kg Log-Based Empirical Model Shown with σ' V = 50 kpa and (N 1 ) 60 = m/kg Scaled Distance, R/W 0.33 (m/kg 0.33 ) Figure 5-18 Multiple Blasts Design Chart for Example Problem Step 3: Required Charge Weight Based upon the scaled distance of 2.3 m/kg 0.33 from the figure, estimate the required weight of explosives to liquefy within the 6 m radius:
114 97 Solving for W req: Step 4: Estimate Boreholes and individual charge sizes For this particular example, the designer would like to use 8 boreholes spaced evenly around the perimeter. To aid in the distributing of explosives, the total weight is increased to 18 kg. Dividing the required weight by the number of boreholes, the amount of explosives (TNT-equivalent) in each borehole would be a total of 2.25 kg of TNT-equivalent explosive. From the 95% confidence intervals, the required charge weight for each borehole would range from 0.45 kg to 4.0 kg approximately. 5.6 LIMITATIONS AND CONSIDERATIONS An empirical model predicting pore pressure response in controlled blasting studies has been developed and has been shown to be applicable to both single and multiple blasts. As previously mentioned this model is based upon case history data and has yet to be evaluated with actual field experiments. Some uncertainties that may exist within this model include: Blasting layout and blasting pattern: circular array versus grid layout may affect how pore pressure is generated and how scaled distances are accounted for. It was observed that simpler layouts with less charges (less than 30) produced similar results predicted by the model while results from complex blasting layouts and patterns created more of a significant difference in the results. Time delays between blasts: is significant drainage occurring within the soil? If so, there would affect the incremental increase in the residual pore pressure with each blast and perhaps the overall pore pressure ratio. The model was developed for a specific range of effective overburden pressures from 14 to 136 kpa, and SPT (N 1) 60 values of 1 to 16 blows per 30 cm. Anything outside of this range would be subjected to extrapolation that may diverge off the projected trend of the regression line.
115 98 Although the influence of fines content was indirectly considered in the regression analysis by the unit-less cyclic resistance ratio (CRR) developed from the Youd et al. (2001) method from the SPT test, it is not considered directly in this analysis. Fines content has been shown to have a significant influence on the liquefaction potential of a soil. A significant majority of the soil information was based on a few tests at selected depths and applied throughout the soil column. Many times an average value was provided in the case history references which may actually not provide an accurate or true representation of the soil conditions through the profile. For the single blasts, there were only 32 data points from which the empirical model was developed, and many of the data points came from one test. This can have a significant impact to the data. To better evaluate the model to single blasts, more data points should be used.
116 SUMMARY AND CONCLUSIONS We can do little to reduce the hazard embodied in an active fault or a major earthquake, but we can do a lot about the risk to the structures we design and build. It is important to remember the frequently quoted observation that earthquakes do not kill, but collapsed buildings and facilities do. - Professor Thomas O Rourke, Cornell University 6.1 SUMMARY OF WORK PERFORMED Controlled blasting has been used as a ground improvement method in densifying loose soils for nearly 70 years, and has recently emerged as a tool to physically generate liquefaction or to even supplement current in-situ liquefaction assessment techniques. Typically, a small blasting study is performed to determine the blasting layout to use in the full-scale tests. Sometimes, multiple trial and error studies must be performed to identify the optimal layout of explosives to liquefy the given volume of soil. Empirical models exist that can help predict the pore pressure with the scaled distance, but they are limited in the fact that they do not consider in-situ soil conditions and that they were developed primarily for single blasts, whereas current blasting experiments utilize multiple blasts to liquefy the soil. To promote the use of controlled blasting as a research tool and liquefaction assessment technique, this research aims to minimize the uncertainty by understanding the role that in-situ conditions and blasting layout play in the generation of residual pore pressures. Through the use of several case histories in which controlled blasting was utilized, a statistical analysis was performed to identify whether residual pore pressures could be predicted based upon the blasting layout and in-situ soil conditions for single and multiple blasts. Empirical models were developed for both multiple and single blasts, and were evaluated through residual plots and paired t-tests.
117 SUMMARY OF RESULTS AND LESSONS LEARNED From this investigation, there were many insights gained into understanding the response of residual pore pressure in controlled blasting studies. Although the loading upon the soil during an earthquake is shear wave-dominated while controlled blasting is typically compression wave-dominated, controlled blasting is a valuable research tool to physically generate liquefaction and investigate soil-structure interaction during liquefied conditions. The intent of this research is to increase the knowledge base of controlled blasting by the following conclusions: A higher residual pore pressure is expected in using multiple blasts than one large single blast of an equivalent scaled distance, R/W In-situ conditions play a significant role in development of residual pore pressures and should be accounted for in blasting design. A consistent method to account for the changing scaled distance in multiple blasts should be used in evaluating pore pressure response due to the observation that the magnitude of residual pore pressure generated from each blast is influenced by the pore pressure generated from the previous blast. In developing an empirical model to predict residual pore pressure with each blast, in-situ conditions such as effective overburden pressure and SPT (N 1) 60 values accompanied with scaled distance provide the best fit, with an R 2 value of The SPT (N 1) 60 values have a more significant effect on the model than the effective overburden pressure. The empirical model is as follows, as defined in Equation 4-1: An empirical model developed for single blasts was shown to provide a better fit to the observed data than observed in the existing models. However, it was found that the empirical model developed for multiple blasts provided a better fit to the single blasts data than the single blasts empirical model. Therefore, it was concluded that the empirical model for multiple blasts can be used for single blasts as well.
118 101 The empirical model should be improved as the case history data increases. The model was shown to be valid for blasting layouts that were relatively simple, such as a square grid or circular array, and consisted of less than 25 charges. The model was not able to predict the Ru values on a consistent basis when the layout consisted of many charges (more than 30) and a complex sequence. Additionally, this research emphasized the benefit of increased collaboration between U.S and Japanese researchers 6.3 FUTURE WORK AND RESEARCH Although this empirical model may provide a statistically good fit to the case history data from which it was developed, a field experiment is considered the best means of scrutinizing and evaluating the validity of the model and is recommended as the first step to be performed in regard to the future work stemming from this research. If the model is validated, this information can be used in future blasting studies including the development of in-situ liquefaction assessments using controlled blasting. In addition, this model may serve as a tool in the development of an energy-based procedure for predicting pore pressure response for soil densification and ground improvement procedures.
119 102 BIBLIOGRAPHY Al-Qasimi, E.M.A., Charlie, W.A., and Woeller, D.J. (2005). Canadian Liquefaction Experiment (CANLEX): Blast-Induced Ground Motion and Pore Pressure Experiments. Geotechnical Testing Journal, 28(1), January 2005, pp Andrus R.D., and Stokoe, K.H. II (2000). Liquefaction Resistance of Soils from Shear- Wave Velocity. Journal of Geotechnical and Geoenvironmental Engineering. 126(11), November 2000, pp ASCE Technical Council on Lifeline Earthquake Engineering (TCLEE). American Society of Civil Engineers (ASCE). (accessed January 2010). Ashford, S.A. and Rollins, K.M. (2002). TILT: Treasure Island Liquefaction Test: Final Report. Report SSRP-2001/17, Department of Structural Engineering, University of California, San Diego. Ashford, S.A., and Juirnarongrit, T. (2004). Performance of Lifelines Subjected to Lateral Spreading. Report SSRP-04/18, Department of Structural Engineering, University of California, San Diego. Ashford, S.A., Rollins, K.M., and Lane, J.D. (2004). Blast-Induced Liquefaction for Full- Scale Foundation Testing. Journal of Geotechnical and Geoenvironmental Engineering. 130(8), August 2004, pp Ashford, S.A., Juirnarongrit, T., Sugano, T, and Hamada, M. (2006). Soil-Pile Response to Blast-Induced Lateral Spreading. 1: Field Test. Journal of Geotechnical and Geoenvironmental Engineering. February pp Ashford, S.A., Kawamata, Y., Rollins, K.M., Kayen, R.E., Weaver, T.J., and Juirnarongrit, T. (2008). The Use of Controlling Blasting for Evaluating Seismic Performance. Not yet published. Boulanger, R.W., and Idriss, I.M. (2007). Evaluation of Cycling Softening in Silts and Clays. Journal of Geotechnical and Geoenvironmental Engineering. 133(6), June 2007, pp Bray, J.D., and Sancio, R.B. (2006). Assessment of the Liquefaction Susceptibility of Fine- Grained Soils. Journal of Geotechnical and Geoenvironmental Engineering. 132(9), September 2006, pp
120 103 Byrne, P.M., Puebla, H., Chan, D.H., Soroush, A., Morgenstern, N.R., Cathro, D.C., Gu, W.H., Phillips, R., Robertson, P.K., Hofmann, B.A., Wride, C.E., Sego, D.C., Plewes, H.D., List, B.R., and Tan, S. (2000). CANLEX Full-Scale Experiment and Modeling. Canadian Geotechnical Journal, 37(3), pp Chang, W.J., Rathje, E.M., Stokoe II, K.H., and Hazirbaba, K. (2007). In Situ Pore-Pressure Generation Behavior of Liquefiable Sand. Journal of Geotechnical and Geoenvironmental Engineering, 133(8), August 2007, pp Charlie, W.A. (1985). Review of Present Practices used in Predicting the Effects of Blasting on Pore Pressure. U.S. Department of the Interior, Bureau of Reclamation. Report GR-85-9, 21 pp. Charlie, W.A., Hubert, M.E., Schure, L.A., Veyera, G.E., Bretz, T.E., and Hassen, H.A. (1988a). Blast Induced Liquefaction: Summary of Literature. Air Force Office of Scientific Research, Washington D.C., 316 pp. Charlie, W.A., Doehring, D.O., Veyera, G.E., and Hassen, H.A. (1988b). Blast Induced Liquefaction of Soils: Laboratory and Field Tests. Air Force Office of Scientific Research, Washington D.C., 184 pp. Charlie, W.A., Jacobs, P.J., and Doehring, D.O. (1992). Blast Induced Liquefaction of an Alluvial Sand Deposit. Geotechnical Testing Journal. 15(1), pp Charlie, W.A., and Doehring, D.O. (2007). Groundwater Table Mounding, Pore Pressure, and Liquefaction Induced by Explosions: Energy-Distance Relations. Reviews of Geophysics. 45, RG4006. December 2007, pp Dickenson, S.E., McCullough, N.J., Barkau, M.G., and Wavra, B.J. (2002). Assessment and Mitigation of Liquefaction Hazards to Bridge Approach Embankments in Oregon Final Report. SPR 361. Oregon Department of Transportation. November Dowding, C.H., and Hryciw, R.D. (1986). A Laboratory Study of Blast Densification of Saturated Sand. Journal of Geotechnical Engineering, 112(2), February 1986, pp Ferrito, J.M. (1997). Seismic Design Criteria for Soil Liquefaction. Technical Report TR SHR. Naval Facilities Engineering Center. June Figueroa, J.L., Saada, A.S., Liang, L., and Dahisaria, N.M. (1994). Evaluation of Soil Liquefaction by Energy Principles. Journal of Geotechnical Engineering. 120(9), September 1994, pp Fragaszy, R.J., and Voss, M.E. (1986). Undrained Compression Behavior of Sand. Journal of Geotechnical Engineering. 112(3), March 1986, pp
121 104 Gohl, W.B., Howie, J.A., and Rea, C.E. (2001). Use of Controlled Detonation of Explosives for Liquefaction Testing. Proceedings: Fourth International Conference on Recent Advances in Geotechnical Earthquake Engineering and Soil Dynamics and Symposium in Honor of Professor W.D. Liam Finn, San Diego, March Gohl, W.B., Martin, T., and Elliott, R.J. (2009). Explosive Compaction of Granular Soils and In Situ Liquefaction Testing Using Sequential Detonation of Explosives. %20and%20Insitu%20Liq%20testing.pdf (accessed December 2009). Green, R.A. (2001). Energy-Based Evaluation and Remediation of Liquefiable Soils, Ph.D. Dissertation. Virginia Polytechnic Institute and State University, 397 pp. ( Green, R.A., and Mitchell, J.K. (2004). Energy-Based Evaluation and Remediation of Liquefiable Soils. Geotrans 2004, ASCE, Proc. Geotech. Eng. For Transportation Projects Ivanov, P.L. (1967). Compaction of Noncohesive Soils by Explosions (translated from Russian). National Technical Information Service Report No. TT U.S. Department of Commerce, Springfield, VA, 211 pp. Kayen, R.E., Barnhardt, W.A., Ashford, S.A., and Rollins, K.M. (2000). Non-destructive Measurement of Soil Liquefaction Density Change by Crosshole Radar Tomography, Treasure Island, California. Computer Simulation of Earthquake Effects. ASCE Research Library. Kayen, R.E., Minasian, D., Ashford, S.A., Kawamata, Y., Sugano, T., Nimityongskul, N., and Nakazawa, H. (2009). Terrestrial LIDAR Study of the Blast-Induced Liquefaction of a Simulated Airport Tarmac, Ishikari Port, Hokkaido, Japan. Paper Grant No. CMMI NSF CMMI Engineering Research and Innovation Conference 2009, Honolulu, Hawaii, June 22-25, Kimmerling, R.E. (1994). Blast Densification for Mitigation of Dynamic Settlement and Liquefaction Final Report WA-RD Washington State Department of Transportation. 135 pp. Kramer, S.L. (1996). Geotechnical Earthquake Engineering. Prentice Hall, Inc. Upper Saddle River, New Jersey. 653 p. Kramer, S.L. (2008). Evaluation of Liquefaction Hazards in Washington State. Final Research Report, Agreement T2695, Task 66, Liquefaction Phase III. Washington State Transportation Commission. Kulhawy, F.H. and Mayne, P.W. (1990). Manual of Estimating Soil Properties for Foundation Design. Report No. EL-6800, Electric Power Research Institute, Palo Alto, CA.
122 105 Kummeneje, O. and Eide, O. (1961). Investigation of Loose Sand Deposits by Blasting. Proc. 5 th International Conf. Soil Mechanics and Foundation Engineering. Vol. 1, pp Lyman, A.K.B. (1942). Compaction of Cohesionless Foundation Soils by Explosives. Transactions ASCE (107) pp Mitchell, J.K. (2008). Mitigation of Liquefaction Potential of Silty Sands. From Research to Practice in Geotechnical Engineering Congress 2008, pp Montgomery, D.C., and Runger, G.C. (2003). Applied Statistics and Probability for Engineers, 3 rd Edition. John Wiley & Sons, Inc., New York, 706 pp. Nakazawa, H., and Sugano, T. (2010). Full-Scale Field Test on Liquefaction-Induced Damage of Runway Pavement by Controlled Blast Technique. In preparation. Narin Van Court, W.A., and Mitchell, J.K. (1994). Explosive Compaction: Densification of loose, saturated, cohesionless soils by blasting. Geotechnical Engineering Report No. UCB/GT/ May pp. Narsilio, G.A., Santamarina, J.C., Hebeler, T., and Bachus, R. (2009). Blast Densification: Multi-Instrumented Case History. Journal of Geotechnical and Geoenvironmental Engineering, 135(6), June 2009, pp Port and Airport Research Institute (PARI), Japan. (2009). Technical Note of the Port and Airport Research Institute: Full-Scale Field Experiment of Airport Facilities during Liquefaction Induced by Controlled Blasting Technique. Independent Administrative Institution, Port and Airport Research Institute, Japan. 338 pp. (in Japanese). Pathirage, K.S. (2000). Critical Assessment of the CANLEX Blast Experiment to Facilitate a Development of an In-Situ Liquefaction Methodology Using Explosives. Thesis in partial fulfillment of the requirements for the Degree of Master of Science, Department of Civil Engineering, The University of British Columbia, December. Rollins, K.M. (2004). Liquefaction Mitigation Using Vertical Composite Drains: Full Scale Testing. Final Report for Highway IDEA Project 94. Transportation Research Board, February 2004, 105 pp. Rollins, K.M., Lane, J.D., Nicholson, P.G., and Rollins, R.E. (2004). Liquefaction Hazard Assessment using Controlled-Blasting Techniques. Proc. 11 th International Conference on Soil Dynamics & Earthquake Engineering. Vol. 2, 2004, pp
123 106 Rollins, K.M., Lane, J.D., Dibb, E., Ashford, S.A., and Mullins, A.G. (2005a). Pore Pressure Measurement in Blast-Induced Liquefaction Experiments. Transportation Research Record 1936, Soil Mechanics 2005, TRB, Washington D.C., pp Rollins, K.M., Gerber, T.M., Lane, J.D., and Ashford, S.A. (2005b). Lateral Resistance of a Full-Scale Pile Group in Liquefied Sand. Journal of Geotechnical and Geoenvironmental Engineering. January 2005, pp Schiff, A.J., editor. (1998). Hyogoken-Nanbu (Kobe) Earthquake of January 17, 1995: Lifeline Performance. ASCE Technical Council on Lifeline Earthquake Engineering Monograph No. 14, September Seed, H.B., and Whitman, R.V. (1970). Design of Earth Retaining Structures for Dynamic Loads. Proceedings, ASCE Specialty Conference on Lateral Stresses in the Ground and Design of Earth Retaining Structures. pp Seed, H.B., and Idriss, I.M. (1971). Simplified procedure for evaluation of soil liquefaction potential. Journal of the Soil Mechanics and Foundations Division, ASCE, 107(9), pp Seed, R.B., Cetin, K.O., Moss, R.E.S., Kammerer, A.M., Wu, J., Pestana, J.M., and Riemer, M.F. (2003). Recent Advances in Soil Liquefaction Engineering and Seismic Site Response Evaluation: A Unified and Consistent Framework. Proceedings: Fourth International Conference on Recent Advances in Geotechnical Earthquake Engineering and Soil Dynamics and Symposium in Honor of Professor W.D. Liam Finn, San Diego, March Solymar, S.V. (1984). Compaction of Alluvial Sands by Deep Blasting. Canadian Geotechnical Journal, 21(2), pp Strand, S.R. (2008). Liquefaction Mitigation using Vertical Composite Drains and Liquefaction-Induced Downdrag on Piles: Implications for Deep Foundation Design. A Dissertation in partial fulfillment of the requirement for the degree of Doctor of Philosophy, Department of Civil and Environmental Engineering, Brigham Young University, April Studer, J. and Kok, L. (1980). Blast-Induced Excess Porewater Pressure and Liquefaction Experience and Application. International Symposium on Soils under Cyclic and Transient Loading, Swansea, UK, January 7 11, pp Sugano, T., Kohama, E., Mitoh, M., and Shiozaki, Y. (2002). Seismic Performance of Urban, Reclaimed and Port Areas Full Scale Experiment at Tokachi Port by Controlled Blasting Technique. The Earthquake Engineering Symposium Proceedings, Vol. 11, pp
124 107 USGS Earthquakes Hazards Program. The Great 1906 San Francisco Earthquake. United States Geological Survey (USGS). /18april/casualties.php (accessed December 2009). Youd, T.L., et al.. (2001). Liquefaction Resistance of Soils: Summary Report from the 1996 NCEER and 1998 NCEER/NSF Workshops on Evaluation of Liquefaction Resistance of Soils. Journal of Geotechnical and Geoenvironmental Engineering. ASCE, 127(10), pp
125 APPENDICES 108
126 109 APPENDIX A SITE & TEST INFORMATION FOR CASE HISTORIES
127 110 A.1 PORT OF ISHIKARI, HOKKAIDO ISLAND, JAPAN Note: All pore pressure data was provided by Dr. Hideo Nakazawa of the Port and Airport Research Institute (PARI). A.1.1 Residual Pore Pressure Results during First Blast of Pilot Test #2
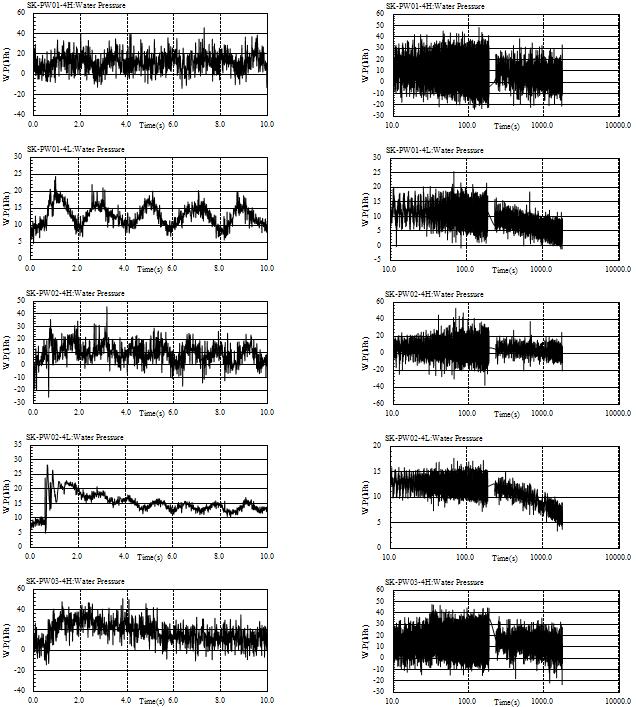
128 111
129 112
130 113
131 114 A.1.2 Residual Pore Pressure Results during Remaining Blasts of Pilot Test #2
132 115
133 116
134 117
135 118 A.1.3 Residual Pore Pressure Results during Full-Scale Test, Ishikari
136 119
137 120
138 121
139 122

140 A.1.4 Blasting Layout for Full-Scale Test at Ishikari (PARI, 2009) 123

141 124 A ) Pore Pressure Transducer layout for Full-Scale Test at Ishikari (PARI,

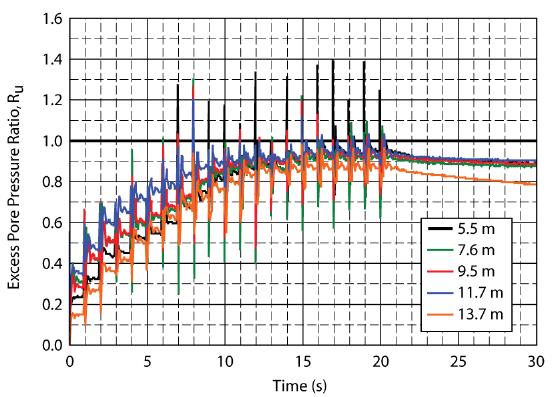
142 125 A.2 VANCOUVER, BRITISH COLUMBIA, CANADA, 2004 A.2.1 Residual Pore Pressure Results during the Pilot Study Blast #1 From Strand 2008 A.2.2 Residual Pore Pressure Results during the Pilot Study Blast #3 From Strand 2008
Liquefaction and Foundations
 Liquefaction and Foundations Amit Prashant Indian Institute of Technology Gandhinagar Short Course on Seismic Design of Reinforced Concrete Buildings 26 30 November, 2012 What is Liquefaction? Liquefaction
IN SITU LIQUEFACTION TESTING USING SEQUENTIAL DETONATION OF EXPLOSIVES ABSTRACT
 IN SITU LIQUEFACTION TESTING USING SEQUENTIAL DETONATION OF EXPLOSIVES W.B. Gohl 1, T. E. Martin 2 and J.P. Sully 3 ABSTRACT The use of the sequential detonation of explosives is described to evaluate
Module 6 LIQUEFACTION (Lectures 27 to 32)
") Module 6 LIQUEFACTION (Lectures 27 to 32) Lecture 31 Topics 6.6 EFFECTS OF LIQUEFACTION 6.6.1 Alteration of Ground Motion 6.6.2 Development of Sand Boils 6.6.3 Settlement 6.6.4 Settlement of Dry Sands
Module 6 LIQUEFACTION (Lectures 27 to 32) Lecture 31 Topics 6.6 EFFECTS OF LIQUEFACTION 6.6.1 Alteration of Ground Motion 6.6.2 Development of Sand Boils 6.6.3 Settlement 6.6.4 Settlement of Dry Sands
Liquefaction: Additional issues. This presentation consists of two parts: Section 1
 Liquefaction: Additional issues Ahmed Elgamal This presentation consists of two parts: Section 1 Liquefaction of fine grained soils and cyclic softening in silts and clays Section 2 Empirical relationship
Mitigation of Liquefaction Potential Using Rammed Aggregate Piers
 ASCE 2011 557 Mitigation of Liquefaction Potential Using Rammed Aggregate Piers R.W. Rudolph, M. ASCE, G.E. 1, B. Serna, M. ASCE, P.E. 2, and T. Farrell, M. ASCE, G.E. 3 1 Principal Consultant, ENGEO,
Evaluation of soil liquefaction using the CPT Part 1
 Evaluation of soil liquefaction using the CPT Part 1 Dr. Peter K. Robertson Webinar #7 2013 CPT Guide 5 th Edition Download FREE copy from: Robertson & Cabal (Robertson) 5 th Edition 2012 www.greggdrilling.com
Liquefaction Potential Variations Influenced by Building Constructions
 Earth Science Research; Vol. 1, No. 2; 2012 ISSN 1927-0542 E-ISSN 1927-0550 Published by Canadian Center of Science and Education Liquefaction Potential Variations Influenced by Building Constructions
Evaluation of the Liquefaction Potential by In-situ Tests and Laboratory Experiments In Complex Geological Conditions
 Evaluation of the Liquefaction Potential by In-situ Tests and Laboratory Experiments In Complex Geological Conditions V. Sesov, K. Edip & J. Cvetanovska University Ss. Cyril and Methodius, Institute of
Numerical analysis of effect of mitigation measures on seismic performance of a liquefiable tailings dam foundation
 Numerical analysis of effect of mitigation measures on seismic performance of a liquefiable tailings dam foundation Yong-Beom Lee, Jorge Castillo Ausenco, USA Aurelian C. Trandafir Fugro GeoConsulting
CHAPTER VI. Deep Compaction Techniques
 CHAPTER VI Deep Compaction Techniques Densification of deep soil deposits is achieved by the following techniques: a. Precompression b. Explosion c. Heavy tamping d. Vibration e. Compaction grouting 1
Liquefaction. Ajanta Sachan. Assistant Professor Civil Engineering IIT Gandhinagar. Why does the Liquefaction occur?
 Liquefaction Ajanta Sachan Assistant Professor Civil Engineering IIT Gandhinagar Liquefaction What is Liquefaction? Why does the Liquefaction occur? When has Liquefaction occurred in the past? Where does
SOME OBSERVATIONS RELATED TO LIQUEFACTION SUSCEPTIBILITY OF SILTY SOILS
 SOME OBSERVATIONS RELATED TO LIQUEFACTION SUSCEPTIBILITY OF SILTY SOILS Upul ATUKORALA 1, Dharma WIJEWICKREME 2 And Norman MCCAMMON 3 SUMMARY The liquefaction susceptibility of silty soils has not received
Effective stress analysis of pile foundations in liquefiable soil
 Effective stress analysis of pile foundations in liquefiable soil H. J. Bowen, M. Cubrinovski University of Canterbury, Christchurch, New Zealand. M. E. Jacka Tonkin and Taylor Ltd., Christchurch, New
Date: April 2, 2014 Project No.: Prepared For: Mr. Adam Kates CLASSIC COMMUNITIES 1068 E. Meadow Circle Palo Alto, California 94303
 City of Newark - 36120 Ruschin Drive Project Draft Initial Study/Mitigated Negative Declaration Appendix C: Geologic Information FirstCarbon Solutions H:\Client (PN-JN)\4554\45540001\ISMND\45540001 36120
SEISMIC RESPONSE OF A SANDY STRATUM WITH A SILT LAYER UNDER STRONG GROUND MOTIONS
 SEISMIC RESPONSE OF A SANDY STRATUM WITH A SILT LAYER UNDER STRONG GROUND MOTIONS Bakhtiar Cahyandi Ridla 1), Huei-Tsyr Chen 2), M. Ruslin Anwar 3) 1) Double Degree Program E-mail: bakhtiar.ridla@gmail.com
Seismic Stability of Tailings Dams, an Overview
 Seismic Stability of Tailings Dams, an Overview BY Gonzalo Castro, Ph.D., P.E. Principal International Workshop on Seismic Stability of Tailings Dams Case Western Reserve University, November 2003 Small
EARTHQUAKE-INDUCED SETTLEMENTS IN SATURATED SANDY SOILS
 VOL., NO., AUGUST 7 ISSN 119- -7 Asian Research Publishing Network (ARPN). All rights reserved. EARTHQUAKE-INDUCED SETTLEMENTS IN SATURATED SANDY SOILS C. Y. Lee Department of Civil Engineering, College
CENTRIFUGE MODELING OF PILE FOUNDATIONS SUBJECTED TO LIQUEFACTION-INDUCED LATERAL SPREADING IN SILTY SAND
 CENTRIFUGE MODELING OF PILE FOUNDATIONS SUBJECTED TO LIQUEFACTION-INDUCED LATERAL SPREADING IN SILTY SAND L. González 1, D. Lucas 2 and T. Abdoun 3 1 Assistant Professor, Dept. of Civil Engineering, University
PHYSICAL SCIENCE FINAL
 PHYSICAL SCIENCE FINAL Liquefaction Doreen Wallace, Tesla Grogan, Amber Ward, Erik Garcia, Cinthia Salas, Alexis Albers Liquefaction What is it? Conditions needed How it works Effects of Liquefaction Soil
Micro Seismic Hazard Analysis
 Micro Seismic Hazard Analysis Mark van der Meijde INTERNATIONAL INSTITUTE FOR GEO-INFORMATION SCIENCE AND EARTH OBSERVATION Overview Site effects Soft ground effect Topographic effect Liquefaction Methods
STUDY OF THE BEHAVIOR OF PILE GROUPS IN LIQUEFIED SOILS
 STUDY OF THE BEHAVIOR OF PILE GROUPS IN LIQUEFIED SOILS Shin-Tower Wang 1, Luis Vasquez 2, and Lymon C. Reese 3, Honorary Member,, ASCE ABSTRACT : 1&2 President & Project Manager, Ensoft, Inc. Email: ensoft@ensoftinc.com
Case Study - Undisturbed Sampling, Cyclic Testing and Numerical Modelling of a Low Plasticity Silt
 6 th International Conference on Earthquake Geotechnical Engineering 1-4 November 2015 Christchurch, New Zealand Case Study - Undisturbed Sampling, Cyclic Testing and Numerical Modelling of a Low Plasticity
Liquefaction Induced Negative Skin Friction from Blast-induced Liquefaction Tests with Auger-cast Piles
 6 th International Conference on Earthquake Geotechnical Engineering 1-4 November 2015 Christchurch, New Zealand Liquefaction Induced Negative Skin Friction from Blast-induced Liquefaction Tests with Auger-cast
Module 8 SEISMIC SLOPE STABILITY (Lectures 37 to 40)
") Lecture 40 Topics Module 8 SEISMIC SLOPE STABILITY Lectures 37 to 40) 8.6.15 Analysis of Weakening Instability 8.6.16 Flow Failure Analysis 8.6.17 Analysis of Stability 8.6.18 Analysis of Deformation 8.6.19
Lecture 40 Topics Module 8 SEISMIC SLOPE STABILITY Lectures 37 to 40) 8.6.15 Analysis of Weakening Instability 8.6.16 Flow Failure Analysis 8.6.17 Analysis of Stability 8.6.18 Analysis of Deformation 8.6.19
Cyclic Triaxial Behavior of an Unsaturated Silty Soil Subjected to Suction Changes
 6 th International Conference on Earthquake Geotechnical Engineering 1-4 November 215 Christchurch, New Zealand Cyclic Triaxial Behavior of an Unsaturated Silty Soil Subjected to Suction Changes T. Nishimura
LIQUEFACTION OF EARTH EMBANKMENT DAMS TWO CASE HISTORIES: (1) LIQUEFACTION OF THE EMBANKMENT SOILS, AND (2) LIQUEFACTION OF THE FOUNDATIONS SOILS
 LIQUEFACTION OF THE EMBANKMENT SOILS, AND (2) LIQUEFACTION OF THE FOUNDATIONS SOILS") LIQUEFACTION OF EARTH EMBANKMENT DAMS TWO CASE HISTORIES: (1) LIQUEFACTION OF THE EMBANKMENT SOILS, AND (2) LIQUEFACTION OF THE FOUNDATIONS SOILS Antonio Fernandez, Ph.D. 1 ABSTRACT Paul C. Rizzo Associates,
LIQUEFACTION OF EARTH EMBANKMENT DAMS TWO CASE HISTORIES: (1) LIQUEFACTION OF THE EMBANKMENT SOILS, AND (2) LIQUEFACTION OF THE FOUNDATIONS SOILS Antonio Fernandez, Ph.D. 1 ABSTRACT Paul C. Rizzo Associates,
POST-CYCLIC RECOMPRESSION CHARACTERISTICS OF A CLAY SUBJECTED TO UNDRAINED UNI-DIRECTIONAL AND MULTI-DIRECTIONAL CYCLIC SHEARS
 NCEE Tenth U.S. National Conference on Earthquake Engineering Frontiers of Earthquake Engineering July -5, 4 Anchorage, Alaska POST-CYCLIC RECOMPRESSION CHARACTERISTICS OF A CLAY SUBJECTED TO UNDRAINED
Cyclic Behavior of Sand and Cyclic Triaxial Tests. Hsin-yu Shan Dept. of Civil Engineering National Chiao Tung University
 Cyclic Behavior of Sand and Cyclic Triaxial Tests Hsin-yu Shan Dept. of Civil Engineering National Chiao Tung University Causes of Pore Pressure Buildup due to Cyclic Stress Application Stress are due
Ground vibration from blast-induced liquefaction testing in Christchurch, New Zealand
 6 th International Conference on Earthquake Geotechnical Engineering -4 November 205 Christchurch, New Zealand Ground vibration from blast-induced liquefaction testing in Christchurch, New Zealand K. Kato,
Investigation of Liquefaction Behaviour for Cohesive Soils
 Proceedings of the 3 rd World Congress on Civil, Structural, and Environmental Engineering (CSEE 18) Budapest, Hungary April 8-10, 2018 Paper No. ICGRE 134 DOI: 10.11159/icgre18.134 Investigation of Liquefaction
Numerical model comparison on deformation behavior of a TSF embankment subjected to earthquake loading
 Numerical model comparison on deformation behavior of a TSF embankment subjected to earthquake loading Jorge Castillo, Yong-Beom Lee Ausenco, USA Aurelian C. Trandafir Fugro GeoConsulting Inc., USA ABSTRACT
MEDAT-2: Some Geotechnical Opportunities. Site Characterization -- Opportunities. Down-hole CPT & vane (Fugro)
") MEDAT-2: Some Geotechnical Opportunities Ross W. Boulanger Department of Civil & Environmental Engineering University of California Davis, California 95616-5294 rwboulanger@ucdavis.edu Presentation for
MEDAT-2: Some Geotechnical Opportunities Ross W. Boulanger Department of Civil & Environmental Engineering University of California Davis, California 95616-5294 rwboulanger@ucdavis.edu Presentation for
(THIS IS ONLY A SAMPLE REPORT OR APPENDIX OFFERED TO THE USERS OF THE COMPUTER PROGRAM
 C A U T I O N!! (THIS IS ONLY A SAMPLE REPORT OR APPENDIX OFFERED TO THE USERS OF THE COMPUTER PROGRAM EQLique&Settle2. THE AUTHOR IS HEREBY RELEASED OF ANY LIABILITY FOR ANY INCORRECT USE OF THIS SAMPLE
Table of Contents Chapter 1 Introduction to Geotechnical Engineering 1.1 Geotechnical Engineering 1.2 The Unique Nature of Soil and Rock Materials
 Table of Contents Chapter 1 Introduction to Geotechnical Engineering 1.1 Geotechnical Engineering 1.2 The Unique Nature of Soil and Rock Materials 1.3 Scope of This Book 1.4 Historical Development of Geotechnical
Evaluation of soil liquefaction using the CPT Part 2
 Evaluation of soil liquefaction using the CPT Part 2 P.K. Robertson 2013 Definitions of Liquefaction Cyclic (seismic) Liquefaction Zero effective stress (during cyclic loading) Flow (static) Liquefaction
CPT Applications - Liquefaction 2
 CPT Applications - Liquefaction 2 Peter K. Robertson CPT in Geotechnical Practice Santiago, Chile July, 2014 Definitions of Liquefaction Cyclic (seismic) Liquefaction Zero effective stress (during cyclic
The CPT in unsaturated soils
 The CPT in unsaturated soils Associate Professor Adrian Russell (UNSW) Mr David Reid (Golder Associates) Prof Nasser Khalili (UNSW) Dr Mohammad Pournaghiazar (UNSW) Dr Hongwei Yang (Uni of Hong Kong) Outline
Liquefaction induced ground damage in the Canterbury earthquakes: predictions vs. reality
 Bowen, H. J. & Jacka, M. E. () Proc. th NZGS Geotechnical Symposium. Ed. CY Chin, Queenstown Liquefaction induced ground damage in the Canterbury earthquakes: predictions vs. reality H J Bowen & M E Jacka
POSSIBILITY OF UNDRAINED FLOW IN SUCTION-DEVELOPED UNSATURATED SANDY SOILS IN TRIAXIAL TESTS
 4 th International Conference on Earthquake Geotechnical Engineering June 25-28, 2007 Paper No. 1289 POSSIBILITY OF UNDRAINED FLOW IN SUCTION-DEVELOPED UNSATURATED SANDY SOILS IN TRIAXIAL TESTS Toshiyuki
Study of the liquefaction phenomenon due to an earthquake: case study of Urayasu city
 Disaster Management and Human Health Risk III 311 Study of the liquefaction phenomenon due to an earthquake: case study of Urayasu city S. Kamao 1, M. Takezawa 1, K. Yamada 1, S. Jinno 1, T. Shinoda 1
EFFECT OF SILT CONTENT ON THE UNDRAINED ANISOTROPIC BEHAVIOUR OF SAND IN CYCLIC LOADING
 4 th International Conference on Earthquake Geotechnical Engineering June 25-28, 2007 Paper No. 1506 EFFECT OF SILT CONTENT ON THE UNDRAINED ANISOTROPIC BEHAVIOUR OF SAND IN CYCLIC LOADING Hadi BAHADORI
Ground Improvement by Dynamic Compaction at a Tailings Disposal Facility
 Missouri University of Science and Technology Scholars' Mine International Conferences on Recent Advances in Geotechnical Earthquake Engineering and Soil Dynamics 2010 - Fifth International Conference
EFFECT OF STORAGE CAPACITY ON VERTICAL DRAIN PERFORMANCE IN LIQUEFIABLE SAND DEPOSITS
 EFFECT OF STORAGE CAPACITY ON VERTICAL DRAIN PERFORMANCE IN LIQUEFIABLE SAND DEPOSITS Juan M. Pestana 1, M. ASCE Christopher E. Hunt 2, Student M. ASCE R. Robert Goughnour 3, M. ASCE Ann M. Kammerer 2,
NEW METHOD FOR LIQUEFACTION ASSESSMENT BASED ON SOIL GRADATION AND RELATIVE DENSITY
 NEW METHOD FOR LIQUEFACTION ASSESSMENT BASED ON SOIL GRADATION AND RELATIVE DENSITY Bambang Istijono 1, Abdul Hakam 2 1,2 Civil Dept. of Engineering Faculty, University of Andalas, Padang, Indonesia ABSTRACT
LIQUEFACTION CHARACTERISTICS EVALUATION THROUGH DIFFERENT STRESS-BASED MODELS: A COMPARATIVE STUDY
 Journal of Engineering Research and Studies E-ISSN976-7916 Research Article LIQUEFACTION CHARACTERISTICS EVALUATION THROUGH DIFFERENT STRESS-BASED MODELS: A COMPARATIVE STUDY P. Raychowdhury 1* and P.
Cyclic Behavior of Soils
 Cyclic Behavior of Soils Antonios Vytiniotis Cyclic Shearing of Sands Dry Sand 1 Triaxial Undrained Monotonic Shearing CIUC tests Ishihara Critical State Toyoura Sand Ishihara 2 Critical State Ishihara
EARTHQUAKE-INDUCED SETTLEMENT AS A RESULT OF DENSIFICATION, MEASURED IN LABORATORY TESTS
 13 th World Conference on Earthquake Engineering Vancouver, B.C., Canada August 1-6, 2004 Paper No. 3291 EARTHQUAKE-INDUCED SETTLEMENT AS A RESULT OF DENSIFICATION, MEASURED IN LABORATORY TESTS Constantine
Evaluation of Pore Water Pressure Characteristics in Embankment Model.
 Evaluation of Pore Water Pressure Characteristics in Embankment Model. Abdoullah Namdar and Mehdi Khodashenas Pelkoo Mysore University, Mysore, India. 76. Amirkabir University, Department of Mining Engineering,
Finite Deformation Analysis of Dynamic Behavior of Embankment on Liquefiable Sand Deposit Considering Pore Water Flow and Migration
 6 th International Conference on Earthquake Geotechnical Engineering 1-4 November 215 Christchurch, New Zealand Finite Deformation Analysis of Dynamic Behavior of Embankment on Liquefiable Sand Deposit
Impact : Changes to Existing Topography (Less than Significant)
") 4.2 Land Resources 4.2.1 Alternative A Proposed Action Impact 4.2.1-1: Changes to Existing Topography (Less than Significant) Development of the project site would involve grading and other earthwork as
4.2 Land Resources 4.2.1 Alternative A Proposed Action Impact 4.2.1-1: Changes to Existing Topography (Less than Significant) Development of the project site would involve grading and other earthwork as
Address for Correspondence
 Research Paper DYNAMIC ANALYSIS OF KASWATI EARTH DAM 1 Patel Samir K., 2 Prof. C.S.Sanghavi Address for Correspondence 1 Applied Mechanics Department, 2 Professor, L. D. College of Engineering, Gujarat
EFFECTIVE STRESS ANALYSES OF TWO SITES WITH DIFFERENT EXTENT OF LIQUEFACTION DURING EAST JAPAN EARTHQUAKE
 Proceedings of the International Symposium on Engineering Lessons Learned from the 211 Great East Japan Earthquake, March 1-4, 212, Tokyo, Japan EFFECTIVE STRESS ANALYSES OF TWO SITES WITH DIFFERENT EXTENT
NUMERICAL ANALYSIS OF DAMAGE OF RIVER EMBANKMENT ON SOFT SOIL DEPOSIT DUE TO EARTHQUAKES WITH LONG DURATION TIME
 Proceedings of the International Symposium on Engineering Lessons Learned from the 2011 Great East Japan Earthquake, March 1-4, 2012, Tokyo, Japan NUMERICAL ANALYSIS OF DAMAGE OF RIVER EMBANKMENT ON SOFT
HORIZONTAL LOAD DISTRIBUTION WITHIN PILE GROUP IN LIQUEFIED GROUND
 4 th International Conference on Earthquake Geotechnical Engineering June 2-28, 7 Paper No. 127 HORIZONTAL LOAD DISTRIBUTION WITHIN PILE GROUP IN LIQUEFIED GROUND Hiroko SUZUKI 1 and Kohji TOKIMATSU 2
Foundations on Deep Alluvial Soils
 Canterbury Earthquakes Royal Commission Hearings 25 October 2011, Christchurch GEO.CUB.0001.1-35.1 Foundations on Deep Alluvial Soils Misko Cubrinovski, Ian McCahon, Civil and Natural Resources Engineering,
J. Paul Guyer, P.E., R.A.
 J. Paul Guyer, P.E., R.A. Paul Guyer is a registered mechanical engineer, civil engineer, fire protection engineer and architect with over 35 years experience in the design of buildings and related infrastructure.
IN SITU TESTING TECHNOLOGY FOR FOUNDATION & EARTHQUAKE ENGINEERING. Wesley Spang, Ph.D., P.E. AGRA Earth & Environmental, Inc.
 IN SITU TESTING TECHNOLOGY FOR FOUNDATION & EARTHQUAKE ENGINEERING Wesley Spang, Ph.D., P.E. AGRA Earth & Environmental, Inc. Portland, Oregon In situ testing of soil, which essentially consists of evaluating
EVALUATION OF STRENGTH OF SOILS AGAINST LIQUEFACTION USING PIEZO DRIVE CONE
 4 th International Conference on Earthquake Geotechnical Engineering June 25-28, 2007 Paper No. 1146 EVALUATION OF STRENGTH OF SOILS AGAINST LIQUEFACTION USING PIEZO DRIVE CONE Shun-ichi Sawada 1 ABSTRACT
Important Concepts. Earthquake hazards can be categorized as:
 Lecture 1 Page 1 Important Concepts Monday, August 17, 2009 1:05 PM Earthquake Engineering is a branch of Civil Engineering that requires expertise in geology, seismology, civil engineering and risk assessment.
Experimental Study on The Seismic Assessment of Pile Foundation in Volcanic Ash Ground
 Experimental Study on The Seismic Assessment of Pile Foundation in Volcanic Ash Ground Takuya EGAWA, Satoshi NISHIMOTO & Koichi TOMISAWA Civil Engineering Research Institute for Cold Region, Public Works
Evaluation of Geotechnical Hazards
 Evaluation of Geotechnical Hazards by Geoffrey R. Martin Appendix B: Evaluation of Geotechnical Hazards Describes Evaluation Procedures Soil Liquefaction Soil Settlement Surface Fault Rupture Flooding
A COMPARISON BETWEEN IN SITU AND LABORATORY MEASUREMENTS OF PORE WATER PRESSURE GENERATION
 13 th World Conference on Earthquake Engineering Vancouver, B.C., Canada August 1-6, 2004 Paper No. 1220 A COMPARISON BETWEEN IN SITU AND LABORATORY MEASUREMENTS OF PORE WATER PRESSURE GENERATION Kenan
Boreholes. Implementation. Boring. Boreholes may be excavated by one of these methods: 1. Auger Boring 2. Wash Boring 3.
 Implementation Boreholes 1. Auger Boring 2. Wash Boring 3. Rotary Drilling Boring Boreholes may be excavated by one of these methods: 4. Percussion Drilling The right choice of method depends on: Ground
SIMPLIFIED METHOD IN EVALUATING LIQUEFACTION OCCURRENCE AGAINST HUGE OCEAN TRENCH EARTHQUAKE
 October 12-17, 28, Beijing, China SIMPLIFIED METHOD IN EVALUATING LIQUEFACTION OCCURRENCE AGAINST HUGE OCEAN TRENCH EARTHQUAKE ABSTRACT : N. Yoshida 1, S. Sawada 2 and S. Nakamura 3 1 Professor, Dept.
Hazard-Mitigation of Civil Infrastructure through. Dynamic Compaction. Kameron Kaine Raburn
 Hazard-Mitigation of Civil Infrastructure through Dynamic Compaction Kameron Kaine Raburn Effects of Liquefaction http://web.ics.purdue.edu/~braile/edumod/eqphotos/eqphotos2_files/image006.jpg http://s.hswstatic.com/gif/earthquake-4.jpg
SEISMIC PERFORMANCE OF URBAN, RECLAIMED AND PORT AREAS -FULL SCALE EXPERIMENT USING BLAST TECHNIQUE. Takahiro SUGANO 1) and Eiji KOHAMA 2)
 and Eiji KOHAMA 2)") SEISMIC PERFORMANCE OF URBAN, RECLAIMED AND PORT AREAS -FULL SCALE EXPERIMENT USING BLAST TECHNIQUE by Takahiro SUGANO 1) and Eiji KOHAMA 2) ABSTRACT A full scale lateral spreading experiment was carried
SEISMIC PERFORMANCE OF URBAN, RECLAIMED AND PORT AREAS -FULL SCALE EXPERIMENT USING BLAST TECHNIQUE by Takahiro SUGANO 1) and Eiji KOHAMA 2) ABSTRACT A full scale lateral spreading experiment was carried
Presentation Outline. 1. Seismic Soil Liquefaction Explained 2. Presentation of the Software SOILLIQ 3. Illustrative Applications using SOILLIQ
 Presentation Outline 1. Seismic Soil Liquefaction Explained 2. Presentation of the Software SOILLIQ 3. Illustrative Applications using SOILLIQ Foundation Failures in Residential Buildings (1964 Niigata,
Case History of Observed Liquefaction-Induced Settlement Versus Predicted Settlement
 Case History of Observed Liquefaction-Induced Settlement Versus Predicted Settlement M. Lew and L. Tran AMEC Environment & Infrastructure, Inc., Los Angeles, CA USA SUMMARY: A comparison of the predicted
8.1. What is meant by the shear strength of soils? Solution 8.1 Shear strength of a soil is its internal resistance to shearing stresses.
 8.1. What is meant by the shear strength of soils? Solution 8.1 Shear strength of a soil is its internal resistance to shearing stresses. 8.2. Some soils show a peak shear strength. Why and what type(s)
Copyright. Wen-Jong Chang
 Copyright by Wen-Jong Chang 22 The Dissertation Committee for Wen-Jong Chang Certifies that this is the approved version of the following dissertation: Development of an In Situ Dynamic Liquefaction Test
PILE DESIGN IN LIQUEFYING SOIL
 PILE DESIGN IN LIQUEFYING SOIL Vijay K. Puri 1 and Shamsher Prakash 2 1 Professor,Civil and Environmental Engineering, Southern Illinois University, Carbondale, USA 2 Professor Emeritus, Missouri University
LSN a new methodology for characterising the effects of liquefaction in terms of relative land damage severity
 van Ballegooy, S., Lacrosse, V., Jacka, M. & Malan, P. (2013) Proc. 19 th NZGS Geotechnical Symposium. Ed. CY Chin, Queenstown LSN a new methodology for characterising the effects of liquefaction in terms
PRINCIPLES OF GEOTECHNICAL ENGINEERING
 PRINCIPLES OF GEOTECHNICAL ENGINEERING Fourth Edition BRAJA M. DAS California State University, Sacramento I(T)P Boston Albany Bonn Cincinnati London Madrid Melbourne Mexico City New York Paris San Francisco
A Thesis presented to the Faculty of the Graduate School at the University of Missouri-Columbia
 LRFD for Settlement Analyses of Shallow Foundations and Embankments ------ Developed Resistance Factors for Consolidation Settlement Analyses A Thesis presented to the Faculty of the Graduate School at
Earthquakes and Earth s Interior
 - What are Earthquakes? Earthquakes and Earth s Interior - The shaking or trembling caused by the sudden release of energy - Usually associated with faulting or breaking of rocks - Continuing adjustment
LIQUEFACTION STRENGTH OF COARSE WELL GRADED FILL UNDER TORSIONAL SIMPLE SHEAR
 4 th International Conference on Earthquake Geotechnical Engineering June 25-28, 2007 Paper No. 1518 LIQUEFACTION STRENGTH OF COARSE WELL GRADED FILL UNDER TORSIONAL SIMPLE SHEAR Yasuo TANAKA 1, Takashi
Field Testing of Ground Improvement Techniques For Liquefaction Mitigation
 Field Testing of Ground Improvement Techniques For Liquefaction Mitigation H.J. Bowen Tonkin & Taylor Ltd, Christchurch, New Zealand P.J. Millar Tonkin & Taylor Ltd, Auckland, New Zealand SUMMARY: A series
13. Type of Report and Period Covered Final Report California Department of Transportation
 1. Report No. SSRP 21/17 Technical Report Documentation Page 2. Government Accession No. 3. Recipient s Catalog No. 4. Title and Subtitle TILT: The Treasure Island Liquefaction Test 5. Report Date January
Interpretation of Flow Parameters from In-Situ Tests (P.W. Mayne, November 2001)
") Interpretation of Flow Parameters from In-Situ Tests (P.W. Mayne, November 2001) FLOW PROPERTIES Soils exhibit flow properties that control hydraulic conductivity (k), rates of consolidation, construction
Interpretation of Flow Parameters from In-Situ Tests (P.W. Mayne, November 2001) FLOW PROPERTIES Soils exhibit flow properties that control hydraulic conductivity (k), rates of consolidation, construction
SITE INVESTIGATION 1
 SITE INVESTIGATION 1 Definition The process of determining the layers of natural soil deposits that will underlie a proposed structure and their physical properties is generally referred to as site investigation.
SEISMIC EFFECTIVE STRESS ANALYSIS: MODELLING AND APPLICATION
 SEISMIC EFFECTIVE STRESS ANALYSIS: MODELLING AND APPLICATION Misko CUBRINOVSKI 1 ABSTRACT The advanced numerical analysis of liquefaction problems is discussed in this paper. The ability of such analysis
Residual Deformation Analyses to Demonstrate the Effect of Thin Steel Sheet Piles on Liquefaction-Induced Penetration Settlement of Wooden Houses
 6 th International Conference on Earthquake Geotechnical Engineering 1-4 November 2015 Christchurch, New Zealand Residual Deformation Analyses to Demonstrate the Effect of Thin Steel Sheet Piles on Liquefaction-Induced
Seismic Design of a Hydraulic Fill Dam by Nonlinear Time History Method
 Seismic Design of a Hydraulic Fill Dam by Nonlinear Time History Method E. Yıldız & A.F. Gürdil Temelsu International Engineering Services Inc., Ankara, Turkey SUMMARY: Time history analyses conducted
Liquefaction assessments of tailings facilities in low-seismic areas
 Page 1 Liquefaction assessments of tailings facilities in low-seismic areas Holly Rourke SRK Consulting, Perth, WA, Australia Caroline Holmes SRK Consulting, Perth, WA, Australia This paper was first presented
Chapter 1 Introduction
 Chapter 1 Introduction 1.1 Statement of the Problem Engineering properties of geomaterials are very important for civil engineers because almost everything we build - tunnels, bridges, dams and others
MITIGATION OF LIQUEFACTION RISK USING COLLOIDAL SILICA STABILIZER
 13 th World Conference on Earthquake Engineering Vancouver, B.C., Canada August 1-6, 24 Paper No. 59 MITIGATION OF LIQUEFACTION RISK USING COLLOIDAL SILICA STABILIZER J.A. DÍAZ-RODRÍGUEZ 1 and V.M. ANTONIO
Estimation of Multi-Directional Cyclic Shear-Induced Pore Water Pressure on Clays with a Wide Range of Plasticity Indices
 Proceedings of the 2 nd International Conference on Civil, Structural and Transportation Engineering (ICCSTE 16) Ottawa, Canada May 5 6, 216 Paper No. 116 Estimation of Multi-Directional Cyclic Shear-Induced
Unit 7: Dynamic Planet: Earthquakes & Volcanoes
 Unit 7: Dynamic Planet: Earthquakes & Volcanoes Lecture 3 Objectives: E3.4C - Describe the effects of earthquakes and volcanic eruptions on humans. E3.4f - Explain why fences are offset after an earthquake
Numerical modeling of liquefaction effects: Development & initial applications of a sand plasticity model
 4 th IASPEI / IAEE International Symposium Santa Barbara, California, Aug 23-26, 2011 Numerical modeling of liquefaction effects: Development & initial applications of a sand plasticity model Ross W. Boulanger
Advanced Lateral Spread Modeling
 Adv. Liquefaction Modeling Page 1 Advanced Lateral Spread Modeling Reading Assignment Lecture Notes Other Materials Homework Assignment 1. Complete FLAC model 10a.pdf 2. Modify the example in FLAC model
LIQUEFACTION ASSESSMENT BY THE ENERGY METHOD THROUGH CENTRIFUGE MODELING
 LIQUEFACTION ASSESSMENT BY THE ENERGY METHOD THROUGH CENTRIFUGE MODELING Hesham M. Dief, Associate Professor, Civil Engineering Department, Zagazig University, Zagazig, Egypt J. Ludwig Figueroa, Professor
CPT-BASED SIMPLIFIED LIQUEFACTION ASSESSMENT BY USING FUZZY-NEURAL NETWORK
 326 Journal of Marine Science and Technology, Vol. 17, No. 4, pp. 326-331 (2009) CPT-BASED SIMPLIFIED LIQUEFACTION ASSESSMENT BY USING FUZZY-NEURAL NETWORK Shuh-Gi Chern* and Ching-Yinn Lee* Key words:
Liquefaction potential of Rotorua soils
 Pearse-Danker, E. (2013) Liquefaction potential of Rotorua soils Proc. 19 th NZGS Geotechnical Symposium. Ed. CY Chin, Queenstown Liquefaction potential of Rotorua soils E Pearse-Danker Coffey Geotechnics
Chapter 12 Subsurface Exploration
 Page 12 1 Chapter 12 Subsurface Exploration 1. The process of identifying the layers of deposits that underlie a proposed structure and their physical characteristics is generally referred to as (a) subsurface
Assessment of Risk of Liquefaction - A Case Study
 Assessment of Risk of Liquefaction - A Case Study ASHWAI JAI Deptt. of Civil Engineering ational Institute Technology Kurukshetra-136119 IDIA ashwani.jain66@yahoo.com Abstract: - Catastrophic failures
On seismic landslide hazard assessment: Reply. Citation Geotechnique, 2008, v. 58 n. 10, p
 Title On seismic landslide hazard assessment: Reply Author(s) Yang, J; Sparks, A.D.W. Citation Geotechnique, 28, v. 58 n. 1, p. 831-834 Issued Date 28 URL http://hdl.handle.net/1722/58519 Rights Geotechnique.
An Overview of Geotechnical Earthquake Engineering
 An Overview of Geotechnical Earthquake Engineering Sudhir K Jain Slide 1 Outline Introduction to Seismic Design Principle Dynamic Soil Properties Site Effects Soil Structure Interaction Issues for Foundation
Evaluating Soil Liquefaction and Post-earthquake deformations using the CPT
 Evaluating Soil Liquefaction and Post-earthquake deformations using the CPT P.K. Robertson University of Alberta, Dept. of Civil and Environmental Engineering, Edmonton, Canada Keywords: Soil liquefaction,
Validation Protocols for Constitutive Modeling of Liquefaction
 6 th International Conference on Earthquake Geotechnical Engineering 1-4 November 2015 Christchurch, New Zealand Validation Protocols for Constitutive Modeling of Liquefaction K. Ziotopoulou 1 and R. W.
Comparison of different methods for evaluating the liquefaction potential of sandy soils in Bandar Abbas
 Comparison of different methods for evaluating the liquefaction potential of sandy soils in Bandar Abbas M. Mosaffa¹ & M. Rafiee² 1.Geotechnical M.S. student Hormozgan University, Bandar Abbas, Iran(Email:Amestris@gmail.com).Geotechnical