American Earthquake Joint System for Resistance to Earthquake-Induced Ground Deformation
|
|
|
- Shannon Ellis
- 6 years ago
- Views:
Transcription

1 American Earthquake Joint System for Resistance to Earthquake-Induced Ground Deformation Final Report Submitted to: Mr. David Drake American Cast Iron Pipe Company P.O. Box 2727 Birmingham, AL USA By C. Pariya-Ekkasut H. E. Stewart B. P. Wham T.D. O Rourke T.K. Bond C. Argyrou Cornell University School of Civil and Environmental Engineering Hollister Hall Ithaca, NY January, 2017
2 EXECUTIVE SUMMARY American Cast Iron Pipe Company has developed a hazard resistant ductile iron (DI) pipe joint, called the AMERICAN Earthquake Joint System (EJS). Sections of 6-in. (150-mm) ductile iron pipes with the AMERICAN Earthquake Joint Systems were tested at Cornell University to 1) evaluate the stress-strain-strength characteristics of the DI, 2) determine the capacity of the joint in direct tension and compression, 3) evaluate the bending resistance and moment vs. rotation relationship of an AMERICAN Flex-Ring (FR-FRE) joint and the AMERICAN Earthquake Joint System (EJS), and 4) evaluate the capacity of a 6-in. (150-mm) DI pipeline with AMERICAN Earthquake Joint Systems to accommodate fault rupture using the Cornell full-scale split-basin testing facility. Test results are summarized for tensile stress-strain-strength characteristics, direct joint tension and compression, bending test results, pipeline response to fault rupture. Numerical simulations of the large-scale testing are presented, and compared with the results of the physical test. The significance of test results are given under the headings that follow. Tensile Stress-Strain-Strength Characteristics The uniaxial tension testing of ductile iron (DI) from AMERICAN specimens was completed in accordance with ASTM E standards (ASTM, 2013). The ductile iron had a modulus, yield stress, and ultimate stress of 24,200 ksi, 50.6 ksi, and 65.3 ksi (167 GPa, 348 MPa, and 450 MPa), respectively. The specimens exceeded ANSI/AWWA C151/A specifications (AWWA, 2009). The yield and ultimate stresses are 20.5% and 8.8% greater than the specifications, respectively. Direct Joint Tension and Compression Two tension tests and one compression test were performed on the 6-in. (150-mm)-diameter AMERICAN earthquake joint system (EJS) ductile iron pipes. Tension Test 1 reached a maximum force of 155 kips (689 kn) at 0.45 in. (11 mm) of FR joint opening and 5.1 in. (130 mm) of SE joint displacement. The maximum axial load for Tension Test 2 was 144 kips (641 kn) at 0.41 in. (10 mm) of FR joint opening and 5.1 in. (130 mm) of SE joint displacement. In both tests, the FR bell cracked circumferentially at the peak tensile forces resulting in loss of pressure. The average maximum tensile force of the two tension tests was kips (665 kn). This force exceeds Class i
3 A of ISO (ISO, 2006) tensile capacity of 17D, where D is the nominal diameter in inches, and the force is expressed in kips. For the nominal 6-in. (150-mm)-diameter pipe this ISO capacity is 102 kips (450 kn). The compressive testing showed that the AMERICAN EJS was able to accommodate axial loads to a compressive level at about the DI proportional limit. When the test pipe reached a compressive load of 256 kips (1,140 kn), which exceeded the proportional limit of 212 kips (943 kn), localized plastic deformation within the joint occurred, resulting in leakage. Bending Test Results Four-point bending tests were performed on sections of 6 in. (150 mm) ductile iron (DI) with an AMERICAN Flex-Ring (FR-FRE) joint and on a nominal 6-in. (150-mm) section with the AMERICAN Earthquake Joint System (EJS). The purpose of these tests was to develop moment vs. rotation relationships for these types of joints. The first leak of 3.5 ml/min in the FR-FRE joint occurred at a deflection of 7.8 and an applied moment of 155 kip-in. (17.5 kn-m). In the EJS bending test, first leakage of 25 ml/min was observed at the FR joint at an FR joint rotation of 10 and an EJS deflection of EJS = 12.7 with an associated moment of 323 kip-in. (36.5 kn-m). Both of the AMERICAN Flex-Ring joint pipe and the AMERICAN EJS tested at Cornell exceeded the performance criteria for allowable deflection of 5 and 8, respectively, without any leaks or pipe damage. Pipeline Response to Fault Rupture A 36-ft (11-m)-long, five-piece section of a ductile pipeline was tested at the Cornell Large-Scale Lifelines Facility. The pipe had a total of four AMERICAN Earthquake Joint Systems. Two EJS castings were located 5 and 15 ft (1.5 and 3.6 m) north of the fault and two EJS castings at the same distances south of the fault. The pipe was pressurized to approximately 80 psi (550 kpa). The pipe was placed on a bed of compacted partially saturated sand, aligned, instruments checked, and then backfilled with compacted sand to a depth of cover of 31 in. (787 mm) above the pipe crown. The north section of the test basin was displaced along a 50º fault at a rate of 12 in. (300 mm) per minute. At a fault displacement of roughly 36.0 in. (914 mm), the pipe lost pressure. Additional 2.5 in. (63.5 mm) of test basin movement was applied to ensure a complete pressure loss in the system, and the test was then stopped. The 36.0 in. (914 mm) fault displacement ii
4 corresponds to 23.1 in. (587 mm) of axial extension of the test basin. Following excavation, a fracture was observed near the west springline of the FR Bell of the S15 EJS. The test measurements confirm that the pipeline was able to accommodate fault rupture through axial displacements and deflections at all four Earthquake Joint Systems. They also provide a comprehensive and detailed understanding of how the movement was accommodated at each joint, the sequence of movements, and combined axial pullout and rotation at each joint. The combined axial movement of the four joints was 21.5 in. (561 mm), which exceeds the performance criteria of in. (122 mm) = 19.2 in. (488 mm) joint displacement for all four earthquake joint systems. On average, each EJS displaced on the order of 5.4 in. (137 mm). This displacement was close to movement during previous direct tension testing of the AMERICAN EJS. The maximum deflection measured at the EJS closest to the fault was about 9.4 degrees, thus demonstrating the ability of the joints to sustain significant levels of combined axial pullout and deflection. The maximum stresses sustained by the pipeline, corresponding to the largest pipeline deformation, were well within the elastic range of pipeline behavior. The ductile iron pipeline equipped with AMERICAN Earthquake Joint System (EJS) was able to accommodate significant fault movement through axial pullout and rotation of the joints. Fault rupture simulated in the large-scale test is also representative of the most severe ground deformation that occurs along the margins of liquefaction-induced lateral spreads and landslides. Finite Element Simulations Two-dimensional (2D) finite element (FE) analyses were performed for a 6- in. (150-mm)- diameter pipeline with AMERICAN EJS joints. The geometry and material characteristics used for the soil, pipe, and test dimensions were consistent with the large-scale split basin test performed at Cornell University. All pipeline dimensions used in the FE simulations are consistent with those for thickness Pressure Class 350 ductile iron available from AMERICAN. The FE simulation results for joint opening vs. fault displacement and joint rotation vs. fault displacement, respectively, are in close agreement with the experimental measurements from the 6 in. (150 mm) pipeline used in the large-scale split basin test. The FE simulations show that the maximum axial force in the pipe were approximately 87 kips, and those measured approximately 81 kips (385 and 360 kn, respectively.) The maximum bending moments from the analytical iii
5 simulations were approximately 250 kip-in. and those measured were 200 kip-in. (28 and 23 knm, respectively.) The maximum axial strain predicted for the 6-in. (150-mm)-diameter pipelines was approximately 580 (vs. 540 measured), and the maximum predicted bending strains were 1050 (vs. 840 measured). The FE simulations for 6-in. (150-mm)-diameter pipe compare well with the measurements of maximum axial and bending responses measured in the large-scale split basin test at Cornell, thus providing confidence in the FE results. Significance of Test Results The amount of tensile strain that can be accommodated with the ductile iron pipeline will depend on the spacing of the AMERICAN Earthquake Joint Systems and the positioning of the spigot within the bell at the pipeline joints. The four-joint pipeline used in the large-scale split-basin test was able to accommodate at least 21.5 in. (461 mm) of axial extension, corresponding to an average tensile strain of 4.4% along the pipeline. Such extension is large enough to accommodate the great majority (over 99%) of liquefaction-induced lateral ground strains measured by high resolution LiDAR after each of four major earthquakes during the recent Canterbury Earthquake Sequence (CES) in Christchurch, NZ. These high resolution LiDAR measurements for the first time provide a comprehensive basis for quantifying the ground strains caused by liquefaction on a regional basis. To put the CES ground strains in perspective, the levels of liquefaction-induced ground deformation measured in Christchurch exceed those documented in San Francisco during the 1989 Loma Prieta earthquake and in the San Fernando Valley during the 1994 Northridge earthquake. They are comparable to the levels of most severe liquefaction-induced ground deformation documented for the 1906 San Francisco earthquake, which caused extensive damage to the San Francisco water distribution system. The fault rupture test confirms that the ductile iron pipes equipped with the AMERICAN Earthquake Joint Systems are able to sustain without leakage large levels of ground deformation through axial displacement and deflection under fullscale conditions of abrupt ground rupture. iv
6 TABLE OF CONTENTS Executive Summary... i Table of Contents... v List of Figures... vii List of Tables... ix Section v Page 1 Introduction and Organization 1 2 Tensile Coupon Tests Introduction Testing and Procedure Testing Results Stress vs. Strain Curves Young s Modulus, Yield Strength, and Proportional Limit Ultimate Tensile Strength and Strain Poisson s Ratio Comparison of Test Results to ANSI/AWWA C151/A Earthquake Joint System (EJS) Joint Tension and Compression Tests Introduction Tension Test Instrumentation Force vs. Displacement FR Bell Axial Strains SE Spigot Axial Strains SE Spigot Hoop Strains Tension Test 2 and Comparisons Compression Test Instrumentation and Test Procedures Force vs. Displacement SE Spigot Axial Strains FR Bell Axial Strains Summary of Joint Tension and Compression Tests 28 4 Four-Point Bending of Flex-Ring and EJS Pipe Introduction Four-Point Bending of Flex-Ring Joint Pipe Joint Description Instrumentation and Testing Procedures Calculation Approach 32
7 Section TABLE OF CONTENTS (continued) vi Page Test Procedures Pressure String Pot Measurements Moment vs. Rotations Four-Point Bending of Earthquake Joint System Joint Description Instrumentation and Testing Procedures Calculation Approach Test Procedures Pressure String Pot Measurements Moment vs. Rotations Summary of Four-Point Bending Tests 45 5 Large Scale Testing of Fault Rupture Effects Introduction Experimental Setup Test Procedure Instrumentation Soil Preparation Experimental Results of Split Basin Test Test Basin Movements Internal Water Pressure Joint Pullout Joint Rotations (Deflections) End Loads and Pipe Axial Forces Bending Moments Deformed Shape and Pipe Failure Summary of Large-Scale Testing 70 6 Finite Element Simulations Large-Scale Split Basin Test Finite Element Simulations Finite Element Model Characteristics Finite Element Simulation Results Summary of Finite Element Simulations 80 7 Summary 81 References 85
8 Figure TABLE OF CONTENTS (continued) LIST OF FIGURES 2.1 Schematic of Tensile Coupon Specimen Baldwin Testing Apparatus Stress vs. Strain Curve for Specimen Stress vs. Strain Curve for Specimen Stress vs. Strain Curve for Specimen Average Young s Modulus and Yield Stress Stress vs. Strain Curve to Failure Using Clip-on Extensometer Data Specimen 1 Tensile Crack Locations Transverse vs. Axial Strain in Used to Determine Poisson s Ratio in Elastic Range AMERICAN Earthquake Joint System (EJS) Tension Test Layout Pressure vs. Average Joint Opening Tensile Force vs. Average FR Joint Opening Tensile Force vs. Average SE Joint Opening Circumferential Crack on Bell Section in Test Tensile Force vs. FR Spigot Axial Strains FR Spigot Axial Strains vs. Average FR Joint Opening FR Spigot Axial Strains vs. Average SE Joint Opening Tensile Force vs. SE Spigot Axial Strains SE Spigot Axial Strains vs. Average FR Joint Opening Spigot Axial Strains vs. Average SE Joint Opening Tensile Force vs. SE Spigot Hoop Strains SE Spigot Hoop Strains vs. Average FR Joint Opening SE Spigot Hoop Strains vs. Average SE Joint Displacement Tensile Force vs. Average FR Joint Opening for Tests 1 and Tensile Force vs. Average SE Joint Opening for Tests 1 and Tensile Force vs. Average Total Joint Opening for Tests 1 and Compression Test Layout Test Specimen in Compression Frame Internal Pressure vs. Time Actuator Compressive Displacement vs. Time Compressive Force vs. FR Joint Displacement Compressive Force vs. SE Joint Displacement Compressive Force vs. Total Joint Displacement 25 Page vii
9 TABLE OF CONTENTS (continued) Figure Page 3.26 Compressive Force vs. SE Spigot Axial Strains SE Spigot Axial Strains vs. Average FR Joint Closure SE Spigot Axial Strains vs. Average SE Joint Closure Compressive Force vs. FR Bell Axial Strains FR Bell Axial Strains vs. Average FR Joint Closure FR Bell Axial Strains vs. Average SE Joint Closure Cutaway View of AMERICAN Flex-Ring Joint prior to Snap Ring Assembly Schematic of Instrumentation for FR-FRE Bending Test Photo of FR-FRE Bending Specimen before Testing Pressure vs Time for FR-FRE Bending Test VSP Measurements for FR-FRE Bending Test HSP Measurements vs. VSP Rotation for FR-FRE Bending Test Moment vs. Rotation for FR-FRE Bending Test FR-FRE First Leakage of 3.5 ml/min FR-FRE Leakage of 100 ml/min at End of Test AMERICAN Earthquake Joint System (EJS) Schematic of Instrumentation for EJS Bending Test Photo of AMERICAN EJS Bending Specimen before Testing Pressure vs. Time for EJS Bending Test VSP Measurements for EJS Bending Test HSP Measurements vs. VSP Rotation for EJS Bending Test Moment vs. Rotation for EJS Bending Test First Leak (25 ml/min) at FR Joint in EJS Leak (1,430 ml/min) at FR Joint in EJS Pipe Failure at FR Bell in EJS Moment-Rotation Results from Four-Point Bending Tests on American 46 DI Pipe Joints 5.1 Plan View of Pipe Centered EJS Specimen in Test Basin Setup of String Pots Pipe Joints with Protective Shielding Particle Size Distribution of RMS Graded Sand Fault Displacement vs. Time Internal Water Pressure vs. Fault Displacement Average FR Joint Openings vs. Fault Displacement Average SE Joint Openings vs. Fault Displacement Total EJS Openings for All Joints vs. Fault Displacement 57 viii
10 Figure TABLE OF CONTENTS (continued) 5.10 FR Rotations vs. Fault Displacement FR Rotations vs. Fault Displacement Total EJS Deflections vs. Fault Displacement Joint Deflections from Leica Survey Data Comparison of Average End Force from Load Cells and Strain Gages Axial Forces in Pipe vs. Distance from Fault Bending Moments in Pipe vs. Distance from Fault Fault Rupture at Pipe Failure Images of Pipeline (a) before burial and (b) after excavation Ruptured Pipe at S15 FR Bell Following Test without Protective Shield Plan View of Large-Scale Split Basin Test for AMERICAN Test D FE Model Setup for a Pipeline under Fault Rupture Nonlinear Axial Force-Displacement and Moment-Deflection Relationships 76 for EJS Analytical Modeling 6.4 Total EJS Joint Opening vs. Fault Displacement for 6 in. (150 mm) Pipes Total EJS Joint Deflections vs. Fault Displacement for 6 in. (150 mm) Pipes Axial Pipe Forces vs. Fault Displacement Axial Pipe Forces at Fault Crossing vs. Fault Displacement Bending Moment vs. Fault Displacement for 6 in. (150 mm) Pipes 79 Page Table LIST OF TABLES 2.1 Young's Modulus, Yield Stress, and Proportional Limit Summary of Ultimate Tensile Stress and Strain Poisson s Ration in Elastic Range Comparison of Material Strengths to ANSI/AWWA C151/A Instrumentation for AMERICAN EJS Tension Test Instrumentation for AMERICAN EJS Compression Test Instrumentation for AMERICAN FR-FRE Bending Test Instrumentation for AMERICAN EJS Bending Test Results of Four-Point Bending Tests Strain Gage Locations and Coding System for EJS Split-basin Test String Pot Locations and Labeling for EJS Split-basin Test Load Cell Locations and Labeling for EJS Split-basin Test 53 Page ix
11 Table TABLE OF CONTENTS (completed) 5.4 Joint Openings at 36 in. (914 mm) Fault Movement Joint Deflections FEA and Measured Maximum Axial Forces, Moments, and Strains for 6 in. 80 (150 mm) AMERICAN Pipe with EJS Page x
12 Section 1 Introduction and Organization This report is submitted to the American Cast Iron Pipe Company (herein referred to as AMERICAN), and presents the results of physical testing on the standard 6-in. (216-mm)-diameter ductile iron pipe and pipe with an AMERICAN Earthquake Joint System (EJS). The purpose of the testing is to demonstrate the ability of the EJS to accommodate axial pullout and deflection and characterize the pipe mode of failure. The work was undertaken in the Cornell Large Scale Lifelines Testing Facility, which is part of the Bovay Laboratory Complex at Cornell University. The report is organized into seven sections, the first of which provides introductory remarks and describes the report organization. Section 2 presents the results of tensile coupon tests to characterize the basic stress-strain-strength characteristics of the ductile iron. Section 3 presents test results from two direct tension and one compression test on DI pipe section with the Earthquake Joint System (EJS). The tension and compression capacities of the joints are evaluated, and limit conditions of pipe leakage are provided. Section 4 describes and reports on the results of four-point bending tests in standard Flex-Ring pipe with an FR-FRE joint and also a bending test with the EJS. A large-scale split basin test with four AMERICAN EJSs is described in Section 5. Joint extensions, deflections, and pipe strains and forces from the full-scale test are given. Section 6 presents the results of the 2-D finite element simulation of the experimental pipeline. The modeling procedures are discussed, and results compared with key experimental measurements. Section 7 provides a summary of the testing and concluding remarks. 1
13 Section 2 Tensile Coupon Tests 2.1 Introduction This section of the report describes the uniaxial tension testing of ductile iron (DI) specimens provided by the American Cast Iron Pipe Company (AMERICAN). The test results are used to determine the strength and ductility of the material. Tensile coupons were machined from a DI pipe specimen and tested in tension to determine the yield strength, ultimate strength, and ultimate strain of the material. All testing was completed in accordance with ASTM E standards (ASTM, 2013) to ANSI/AWWA C151/A [60 ksi (414 MPa) ultimate tensile strength, 42 ksi (290 MPa) yield, and 10% elongation] specifications (AWWA, 2009.) 2.2 Testing and Procedure The tensile coupons were machined from the pipe to obtain the nominal dimensions shown in Figure 2.1. These dimensions comply with ASTM - E (ASTM, 2013) for large diameter tubes. A Baldwin Hamilton 60 BTE Universal Testing Machine was used to apply tensile loads. This load frame was fitted with a pressure sensor to measure force in the system. The machine was calibrated in April of A photo of the test setup is provided in Figure 2.2. Three tensile coupon specimens were tested. All three specimens were instrumented with axial and transverse strain gages. Bondable axial and transverse strain gages were used in testing to measure small strains. These gages were mounted in the center of the reduced area of the specimen. Strain gages were used to evaluate the stress vs. strain relationship at lower strains because they are considerably more accurate at these levels. These gages debond typically at strains of 2 to 4%, rendering them ineffective at larger strain levels. A clip-on extensometer was used to measure axial strain to failure. This device is not as accurate as the strain gages at smaller strains, but provides for a reliable assessment of strain at larger values, specifically those past the failure of the bonded strain gages. 2

14 2.3 Testing Results Stress vs. Strain Curves The engineering uniaxial stresses vs. axial strains for all three Specimens are shown in Figures 2.3 to 2.5. These figures show both the bondable strain gage and extensometer data. Figure 2.1. Schematic of Tensile Coupon Specimen Figure 2.2. Baldwin Testing Apparatus 3
15 Figure 2.3. Stress vs. Strain Curve for Specimen 1 Figure 2.4. Stress vs. Strain Curve for Specimen 2 Figure 2.5. Stress vs. Strain Curve for Specimen 3 Figure 2.6. Average Young s Modulus and Yield Stress 4
16 Specimen Table 2.1. Young's Modulus, Yield Stress, and Proportional Limit Young s Modulus E (ksi) 5 Offset Yield y (ksi) Proportional Limit prop (ksi) 1 22, , , Average 24, Std. Dev. 1, ksi = 6.89 MPa Young s Modulus, Yield Strength, and Proportional Limit Young s modulus was computed using the elastic region of the stress vs. strain curve and the bonded axial strain gage data. These data are shown to a strain of in Figure 2.6. Young s modulus was determined by performing a linear regression for stress vs. strain from 2 ksi to 30 ksi (14 to 207 MPa). The yield strength, y, was computed using the offset method, in which a line parallel to the linear part of the stress vs. strain plot is projected from 0.2% strain. The intersection of this line and the stress vs. strain curve provides an estimate of the yield stress for each specimen. The yield strains derived from the 0.2% offset are about 0.41%, which is almost double the 0.2% strain. The 0.14% strain is taken as a proportional limit, beyond which the relationship between stresses and the strains is no longer linear. The Young s modulus, yield stress, and proportional limit for the specimens are presented in Table 2.1. The average Young s modulus is 24,200 ksi (169 GPa) with a standard deviation of 1,280 ksi (8.8 GPa). The average yield stress is 50.6 ksi (349 MPa) with a standard deviation of 0.9 ksi (6.2 MPa). The average proportional stress is 34.1 ksi (235 MPa) with a standard deviation of 2.3 ksi (16 MPa) Ultimate Tensile Strength and Strain Axial stress vs. strain data from the clip-on extensometers were used to determine the ultimate strength and strain, as shown in Figure 2.7. Table 2.2 gives the failure tensile stress and failure strain for these three specimens. The average ultimate tensile stress was 65.3 ksi (450 MPa) with a standard deviation of 2.8 ksi (19 MPa). However, the ultimate strain could not be accurately measured because all three specimens broke outside of the clip-on lengths of the extensometers. Figure 2.8 shows the tensile crack location for specimen 1, which is outside the extensometer measurement range.

17 Table 2.2. Summary of Ultimate Tensile Stress and Strain Ultimate Tensile Specimen Strength (ksi) Strain (%) Average 65.3 N/A Std. Dev. 2.8 N/A 1 ksi = 6.89 MPa Figure 2.7. Stress vs. Strain Curve to Failure Using Clip-on Extensometer Data Figure 2.8. Specimen 1 Tensile Crack Locations Poisson s Ratio Poisson s ratio,, is the negative ratio of transverse strain to axial strain for uniaxial loading. Poisson s ratio was derived from the transverse and axial strain gage data while the stresses were in the elastic range, as shown in Figure 2.9. Poisson s ratio data are presented in Table 2.3. Poisson s ratio for all specimens was approximately 0.28 with a very small standard deviation of
18 Table 2.3. Poisson s Ratio in Elastic Range Specimen Poisson s Ratio, Average 0.28 Std. Dev Figure 2.9. Transverse vs. Axial Strain in Used to Determine Poisson s Ratio in Elastic Range 2.4 Comparison of Test Results to ANSI/AWWA C151/A The uniaxial tension testing of ductile iron (DI) from AMERICAN specimens was completed in accordance with ASTM E standards (ASTM, 2013). The yield stress, ultimate stress, and strain at failure are tabulated in Table 2.4 to compare the material properties with ANSI/AWWA C151/A specifications (AWWA, 2009). The yield and ultimate stresses are 20.5% and 8.8% greater than the specifications, respectively. However, the strain at failure could not be measured reliably because the specimens broke outside of the extensometer range. 7
19 Table 2.4. Comparison of Material Strengths to ANSI/AWWA C151/A Parameter AMERICAN ANSI/AWWA specifications Difference (%) Yield Stress (ksi) Ultimate Stress (ksi) Strain at Failure (%) N/A 10 N/A 1 ksi = 6.89 MPa 8
20 Section 3 Earthquake Joint System (EJS) Joint Tension and Compression Tests 3.1 Introduction This section summarizes the results of two tension tests and one compression test on the AMERICAN earthquake joint system (EJS) ductile iron pipes. The deep socket and FR bells have rubber gaskets to prevent leakage. The SE and FRE spigots are equipped with weld rings and iron locking rings. In each joint the weld ring bears against the locking ring preventing joint pullout. A schematic of the EJS is shown in Figure Tension Test 1 The tension test specimens were 15.5 ft. (4.72 m) long with an outside diameter of 6.9 in. (175 mm) and a wall thickness of 0.3 in. (7.6 mm.). The spigot was fully inserted inside the bell at the beginning of the test. Full insertion refers to the position when the ends of the SE and FRE spigots are in contact with the base of the deep socket and FR bell sockets, respectively. Figure 3.2 provides a schematic of the tension test Instrumentation Four strain gages were mounted 40 in. (1016 mm) north of the FR bell face on the FR bell side of the pipe at the positions of 12, 3, 6, and 9 o clock (crown, east springline, invert, and west springline, respectively). Four strain gages were also mounted 51 in. (1295 mm) south of the FR bell face on the FRE spigot side at the same positions. Four string pots were installed at quarter points around the pipe circumference to measure axial pullout of the SE spigot from the deep socket. Four additional string pots were also mounted to measure the FR joint opening. An actuator and load cell were installed on the load frame to apply and measure tensile force at the end of the pipe. An electronic pressure transducer, located at the north end cap, measured internal water pressure during the test sequence. The instrument locations and gage names are listed in Table
21 a) Complete Joint System b) Cutaway Views of AMERICAN EJS Figure 3.1. AMERICAN Earthquake Joint System (EJS) Figure 3.2. Tension Test Layout Force vs. Displacement The specimen was filled with water and pressurized. As the pipe was filled with water, air inside the pipe was released. This procedure was repeated several times to make sure that no air remained in the pipe. The pressurizing sequence is shown in Figure 3.3. As the pressure was increased to approximately 12 psi (62 kpa), there were small pullout movements at both joints. Both joints opened slowly during the pressurization. When the SE joint reached 2.3 in. (58.4 mm), the joint suddenly opened to 4.5 in. (114 mm). The FR and SE joints continued to open slowly to 5.0 and 0.29 in. (127 and 7.4 mm), respectively. At an internal pressure of 80 psi (550 kpa), the axial loads on the pipe end caps were 2.4 kips (13 kn). Axial loading by the actuator was subsequently applied while the pipe was under the initial thrust load. 10
22 Table 3.1. Instrumentation for AMERICAN EJS Tension Test Location Instrument Instrument Name 40 in. North of FR Bell Face Crown, Axial Strain B40C 40 in. North of FR Bell Face Invert, Axial Strain B40I 40 in. North of FR Bell Face East Springline, Axial Strain B40E 40 in. North of FR Bell Face West Springline, Axial Strain B40W 51 in. South of FR Bell Face Crown, Axial Strain S51C 51 in. South of FR Bell Face Invert, Axial Strain S51I 51 in. South of FR Bell Face East Springline, Axial Strain S51E 51 in. South of FR Bell Face West Springline, Axial Strain S51W 51 in. South of FR Bell Face Crown, Circumferential Strain S51CC 51 in. South of FR Bell Face Invert, Circumferential Strain S51IC 51 in. South of FR Bell Face East Springline, Circumferential Strain S51EC 51 in. South of FR Bell Face West Springline, Circumferential Strain S51WC SE Bell Face SE Joint Crown String Pot SE Crown SE Bell Face SE Joint Invert String Pot SE Invert SE Bell Face SE Joint East Springline String Pot SE East SE Bell Face SE Joint West Springline String Pot SE West FR Bell Face FR Joint Crown String Pot FR Crown FR Bell Face FR Joint Invert String Pot FR Invert FR Bell Face FR Joint East Springline String Pot FR East FR Bell Face FR Joint West Springline String Pot FR West Actuator Load Cell Interface Load Actuator Displacement Act. Disp. Internal Pressure Pressure Transducer Pressure 1 in. = 25.4 mm Loading began at a rate of 1 in. (25.4 mm) per minute. Figures 3.4 and 3.5 show the tensile force plotted against FR and SE average joint opening, respectively. Prior to failure the pipe reached a peak load of 155 kips (689 kn) at 0.45 and 5.1 in. (11 and 130 mm) of axial displacement at the FR and SE joints, respectively. The pipe had a large circumferential crack around the FR bell section. Figure 3.6 shows the Test 1 specimen after the test. Figure 3.6 a) is a view looking into the bell. Figure 3.6 b) shows a view of the fracture from inside the bell. Figures 3.6c) to f) show the bell crack starting at the crown (Figure 3.6 c) and rotating to the west springline (Figure 3.6f.) 11
23 a) FR Joint b) SE Joint Figure 3.3. Pressure vs. Average Joint Opening Figure 3.4. Tensile Force vs. Average FR Joint Opening 12
24 a) Full Displacement Range b) Between 4.6 and 5.2 in. (119 to 132 mm) of Joint Opening Figure 3.5. Tensile Force vs. Average SE Joint Opening FR Bell Axial Strains The maximum axial tensile strain on the FR bell side was 1,450 με (0.145%) and developed at the invert when the maximum load of 155 kips (689 kn) was attained at 0.45 and 5.1 in. (11 and 130 mm) of the FR and SE joint opening, respectively. The relationships between FR bell axial strains and the tensile force, FR joint opening, and SE joint opening are shown in Figures 3.7, 3.8, and 3.9, respectively. Recall that there were rapid SE and FR joint displacements of 5.0 and 0.29 in. (127 and 7.4 mm), respectively, as internal pressure was applied SE Spigot Axial Strains The relationships between SE spigot axial strains and the tensile force, FR joint opening, and SE joint opening are shown in Figures 3.10, 3.11, and 3.12, respectively. A maximum axial tensile strain of 1,710 με (0.171%) was measured at the invert of the SE spigot when the maximum load reached 155 kips (689 kn). 13
 Inside")
")
")


25 a) Bell Face b) Inside East Springline c) Crown d) East Springline e) Invert f) West Springline Figure 3.6. Circumferential Crack on Bell Section in Test 1 14
26 Figure 3.7. Tensile Force vs. FR Bell Axial Strains Figure 3.8. FR Bell Axial Strains vs. Average FR Joint Opening a) Full Displacement Range b) Between 4.6 to 5.2 in. (119 to 132 mm) of SE Joint Opening Figure 3.9. FR Bell Axial Strains vs. Average SE Joint Opening 15
27 Figure Tensile Force vs. SE Spigot Axial Strains Figure SE Spigot Axial Strains vs. Average FR Joint Opening a) Full Displacement Range b) Between 4.6 to 5.2 in. (119 to 132 mm) of SE Joint Opening Figure SE Spigot Axial Strains vs. Average SE Joint Opening 16
28 Figure Tensile Force vs. SE Spigot Hoop Strains Figure SE Spigot Hoop Strains vs. Average FR Joint Opening a) Full Displacement Range b) Between 4.6 to 5.2 in. (119 to 132 mm) of SE Joint Opening Figure SE Spigot Hoop Strains vs. Average SE Joint Displacement 17
29 3.2.5 SE Spigot Hoop Strains Figures 3.13, 3.14, and 3.15 show the tensile force vs. the SE spigot hoop strain, the spigot hoop strain vs. the average FR joint opening, and the spigot hoop strain vs. the average SE joint opening, respectively. Spigot hoop strains at four positions (crown, invert, east, and west) were all initially positive (tensile), caused by internal pressure. The actuator then began applying axial displacement to the spigot. When the spigot weld ring made contact with the locking ring, tensile stresses were developed in the longitudinal direction of the pipe with attendant compressive stresses in the hoop direction. As a result, the spigot hoop strain become negative (compressive). The maximum compressive hoop strain of 400 με (0.04%) was measured at the west springline. 3.3 Tension Test 2 and Comparisons A second tension test was performed on the AMERICAN EJS. Its purpose was to provide a replicate test to confirm tensile capacity and axial pullout displacement. The pipe was initially fully inserted. The pipe dimensions and instrumentation were identical to that of Tension Test 1. This section presents a comparison of the two test results. Figures 3.16, 3.17, and 3.18 show nearly identical plots of tensile force vs. average FR, SE, and total joint openings for the two tests, respectively. The FR and SE joints of both tests opened approximately 0.3 and 5 in. (7.6 and 127 mm) upon pressurization, respectively. Test 1 reached a maximum force of 155 kips (689 kn) at 0.45 in. (11 mm) of FR joint opening and 5.1 in. (130 mm) of SE joint displacement. The maximum axial load for Test 2 was 144 kips (641 kn) at 0.41 in. (10 mm) of FR joint opening and 5.1 in. (130 mm) of SE joint displacement. When the maximum tensile load was achieved, the FR bell cracked circumferentially in both tests. The average maximum tensile force of the two tests was kips (665 kn). This force exceeds Class A of ISO (ISO, 2006) tensile capacity of 17D, where D is the nominal diameter in inches, and the force is expressed in kips, which is equivalent to 102 kips (450 kn). The average total joint opening, which is an average of the summation of the FR and SE joint displacements for both tests, was 5.53 in. (140 mm). 18
30 Figure Tensile Force vs. Average FR Joint Opening for Tests 1 and 2 a) Full Displacement Range b) Between 4.6 to 5.2 in. (119 to 132 mm) of SE Joint Opening Figure Tensile Force vs. Average SE Joint Opening for Tests 1 and 2 19
31 a) Full Displacement Range b) Between 4.6 to 5.2 in. (119 to 132 mm) of SE Joint Opening Figure Tensile Force vs. Average Total Joint Opening for Tests 1 and Compression Test The compression test specimen was 13.1 ft. (4.0 m) long with an outside diameter of 6.9 in. (175 mm) and a wall thickness of 0.3 in. (7.6 mm.). The joint was fully extended at the beginning of the test. Full extension refers to the position when the weld rings of the SE and FRE spigots are in contact with the lips of the deep socket and FR bell sockets, respectively. Figure 3.19 provides a schematic of the compression test Instrumentation and Test Procedures Four strain gages were mounted 23 in. (584 mm) north of the FR bell face on the FR bell side of the pipe (B23 in Figure 3.19) at the positions of 12, 3, 6, and 9 o clock (crown, east springline, invert, and west springline, respectively). Four other strain gages were also mounted 38 in. (965 mm) south of the FR bell face on the FRE spigot side (S38 in Figure 3.19) at the same positions. Four string pots were installed at quarter points around the pipe circumference to measure axial movement of the SE spigot into the deep socket. Four additional string pots were also mounted to measure the FR joint axial compressive displacement. An actuator and load cell were installed on the load frame to apply and measure compressive force at the end of the FRE spigot. An electronic 20
32 pressure transducer, located at the north end cap, measured internal water pressure during the test sequence. The instrument locations and gage names are listed in Table 3.2. After the specimen was instrumented and centered in the test frame, the test was initiated by starting the data acquisition system and laboratory hydraulic systems. Figures 3.20 a) and b) show the test specimen mounted in the compression test frame. The specimen was filled with water and pressurized to approximately 80 psi (552 kpa). As the actuator was pushing on the FRE spigot end and closing the joints, the internal pressure was manually readjusted to be within ± 5 psi (34 kpa) of 80 psi (550 kpa). The test was performed under displacement control using the servohydraulic actuator at a rate of 1 in. (25.4 mm) per minute. Compression was applied by the actuator in two discrete steps. The actuator had a range of 3.9 in. (99 mm.) for this test. After the full range of the actuator was reached, the pipe was depressurized, the actuator was retracted, and additional compression displacements were applied to the specimen. Figures 3.21 and 3.22 show the internal pressure and actuator displacement vs. time, respectively Force vs. Displacement Compressive force and joint displacements were measured by the load cell and string potentiometers. Figures 3.23 and 3.24 show the compressive force plotted against the FR and SE average joint displacements, respectively. When the joint was fully engaged at 0.38 and 4.9 in. (9.7 and 124 mm) of FR and SE displacements there was a significant increase of compressive load. The pipe reached a compressive load of 256 kips (1,140 kn) at 0.58 in. (15 mm) of FR joint displacement and 5.3 in. (134 mm) of SE joint displacement before a leak was observed at the SE joint. The relationship of the compressive force vs. total joint displacement is presented in Figure Forces at the proportional limit, Pprop, and yield limit, Py, are shown in Figures 3.23, 3.24, and The axial force, P, is given as: P = σa (3.1) where σ is the proportional stress of 34.1 ksi (235 MPa) or yield stress of 50.6 (349 MPa) based on the tensile coupon test data, and A is the cross-sectional area of the specimen of 6.22 in 2 (4010 mm 2 ). Equation 3.1 gives forces at the proportional limit, Pprop, and yield limit, Py, of 212 kips (943 kn) and 315 kips (1,400 kn), respectively. When the compressive force in the specimen exceeded the proportional limit, localized plastic deformation within the joint occurred, resulting in leakage when the load was about halfway between the proportional and plastic limits. 21
33 Table 3.2. Instrumentation for AMERICAN EJS Compression Test Location Instrument Instrument Name 23 in. North of FR Bell Face Crown, Axial Strain B23C 23 in. North of FR Bell Face Invert, Axial Strain B23I 23 in. North of FR Bell Face East Springline, Axial Strain B23E 23 in. North of FR Bell Face West Springline, Axial Strain B23W 38 in. South of FR Bell Face Crown, Axial Strain S38C 38 in. South of FR Bell Face Invert, Axial Strain S38I 38 in. South of FR Bell Face East Springline, Axial Strain S38E 38 in. South of FR Bell Face West Springline, Axial Strain S38W SE Bell Face SE Joint Crown String Pot SE Crown SE Bell Face SE Joint Invert String Pot SE Invert SE Bell Face SE Joint East Springline String Pot SE East SE Bell Face SE Joint West Springline String Pot SE West FR Bell Face FR Joint Crown String Pot FR Crown FR Bell Face FR Joint Invert String Pot FR Invert FR Bell Face FR Joint East Springline String Pot FR East FR Bell Face FR Joint West Springline String Pot FR West Actuator Load Cell Interface Load Actuator Displacement Act. Disp. Internal Pressure Pressure Transducer Pressure 1 in. = 25.4 mm Figure Compression Test Layout 22


34 a) Looking North b) Looking South Figure Test Specimen in Compression Frame Figure Internal Pressure vs. Time Figure Actuator Compressive Displacement vs. Time 23
35 Figure Compressive Force vs. FR Joint Displacement a) Full Displacement Range b) Between 4.6 to 5.4 in. (119 to 137 mm) of SE Joint Closure Figure Compressive Force vs. SE Joint Displacement 24
36 a) Full Displacement Range b) Between 5 to 6 in. (127 to 152 mm) of Total Joint Closure Figure Compressive Force vs. Total Joint Displacement SE Spigot Axial Strains The relationships between SE spigot axial strains and the tensile force, FR joint closure, and SE joint closure are shown in Figures 3.26, 3.27, and 3.28, respectively. A maximum axial compressive strain of 5,400 με (0.54%) was measured at the west springline of the SE spigot. This level of strain exceeds the proportional strain of 1,400 με (0.14%), which was determined from tensile coupon tests, and indicated the localized plastic deformation FR Bell Axial Strains The maximum axial tensile strain on the FR bell side was 2,300 με (0.23%) and developed at the east springline. The relationships between FR bell axial strains and the tensile force, FR joint opening, and SE joint opening are shown in Figures 3.29, 3.30, and 3.31, respectively. 25
37 Figure Compressive Force vs. SE Spigot Axial Strains Figure SE Spigot Axial Strains vs. Average FR Joint Closure a) Full Displacement Range b) Between 4.6 to 5.4 in. (119 to 137 mm) of SE Joint Opening Figure SE Spigot Axial Strains vs. Average SE Joint Closure 26
38 Figure Compressive Force vs. FR Bell Axial Strains Figure FR Bell Axial Strains vs. Average FR Joint Closure a) Full Displacement Range b) Between 4.6 to 5.4 in. (119 to 137 mm) of SE Joint Opening Figure FR Bell Axial Strains vs. Average SE Joint Closure 27
39 3.5. Summary from Joint Tension and Compression Tests Two tension tests and one compression test were performed on the 6-in. (150-mm)-diameter AMERICAN earthquake joint system (EJS) ductile iron pipes. Both tension tests began with the SE and FRE spigots fully inserted in the deep socket and FR bell sockets, respectively. The compression test began with the SE and FRE spigots fully extended. As the pipe was pressurized in the tension tests, the spigots were displaced from the bell seat at approximately 12 psi (62 kpa) internal pressure. The slip was 0.3 in. (7.6 mm) for the FR joint and 5 in. (127 mm) for the SE joint before the weld rings became engaged with the locking rings. Tension Test 1 reached a maximum force of 155 kips (689 kn) at 0.45 in. (11 mm) of FR joint opening and 5.1 in. (130 mm) of SE joint displacement. The maximum axial load for Tension Test 2 was 144 kips (641 kn) at 0.41 in. (10 mm) of FR joint opening and 5.1 in. (130 mm) of SE joint displacement. In both tests, the FR bells cracked circumferentially at the peak tensile forces resulting in loss of pressure. The average maximum tensile force of the two tension tests was kips (665 kn). This force exceeds Class A of ISO (ISO, 2006) tensile capacity of 17D, where D is the nominal diameter in inches, and the force is expressed in kips, which is equivalent to 102 kips (450 kn). In these tests, the average tensile capacity divided by the nominal pipe diameter of D = 6.9 in. (175 mm) is 21.3 which is substantially greater the ISO specification. The average total joint opening, which is the average sum of the FR and SE joint displacements for both tests, was 5.53 in. (140 mm). The compressive testing showed that the AMERICAN EJS was able to accommodate axial loads to a compressive level at about the DI proportional limit. When pipe reached a compressive load of 256 kips (1,140 kn), which exceeded the proportional limit of 212 kips (943 kn), localized plastic deformation within the joint occurred, resulting in leakage. 28
40 Section 4 Four-Point Bending of Flex-Ring and EJS Pipe 4.1. Introduction This section presents the results of four-point bending tests for 1) sections of nominal 6-in. (150- mm) ductile iron (DI) pipe with an AMERICAN Flex-Ring (FR-FRE) joint and 2) a nominal 6-in. (150-mm) section with the AMERICAN Earthquake Joint System (EJS). The purpose of the tests was to develop moment vs. rotation relationships for these types of joints. The tests, with the experiments described previously to characterize the direct compression and tension capacity of these joints, are used with the results a large-scale split-basin test to evaluate the performance of the EJS under severe earthquake-induced ground deformation. The work was undertaken in the Cornell Large Scale Lifelines Testing Facility, which is part of the Bovay Laboratory Complex at Cornell University Four-Point Bending of Flex-Ring Joint Pipe Joint Description This section summarizes the results of the four-point bending test of a conventional AMERICAN Flex-Ring DI pipe. Figure 4.1 presents a cutaway view of the AMERICAN Flex-Ring joint assembly, showing both the bell (FR) and spigot (FRE) ends. Sections of DI pipe were shipped to Cornell by AMERICAN and were used in a support assembly with a 400 kip (1.78 MN) hydraulic loading capacity. The pipe was a nominal 6-in- (150-mm)-diameter pipe with the FR- FRE bell-spigot ends. The test specimen was assembled using a gasket and lubricant provided by AMERICAN, after which a DI split snap ring was installed to complete the boltless joint. Mechanical joint end caps with Megalug restraints were used on the ends to allow for water pressurization. A nominal internal pressure of 80 psi (550 kpa) was used throughout the bending test Instrumentation and Testing Procedures Figure 4.2 shows a schematic cross-section of the FR-FRE bending test. There were two temporary supports beneath the central loading points. The supports are used to level the test specimen and to support the self-weight of the pipe (including water for pressurized pipe) before vertical loading. Figure 4.3 is a photograph of the test before the central supports were removed. 29

41 Figure 4.1. Cutaway View of AMERICAN Flex-Ring Joint prior to Snap Ring Assembly Figure 4.2. Schematic of Instrumentation for FR-FRE Bending Test 30

42 Figure 4.3. Photo of FR-FRE Bending Specimen before Testing Table 4.1. Instrumentation for AMERICAN FR-FRE Bending Test Location Instrument Description Instrument Name -65 in. from Joint Vertical String Pot on Bell End VSP in. from Joint Vertical String Pot on Bell End VSP in. from Joint Vertical String Pot on Bell End VSP-20 0 in. from Joint Vertical String Pot on Spigot End VSP 0 20 in. from Joint Vertical String Pot on Spigot End VSP in. from Joint Vertical String Pot on Spigot End VSP in. from Joint Vertical String Pot on Spigot End VSP 65 0 in. from Joint Horizontal String Pot at Crown HSP_C 0 in. from Joint Horizontal String Pot at Invert HSP_I -48 in. from Joint Axial Gage at Invert on Spigot End S48I -48 in. from Joint Axial Gage at Crown on Spigot End S48C -12 in. from Joint Axial Gage at Invert on Spigot End S12I -12 in. from Joint Axial Gage at Crown on Spigot End S12C -12 in. from Joint Axial Gage at S Springline on Spigot End S12S -12 in. from Joint Axial Gage at N Springline on Spigot End S12N 31
43 Table 4.1. Instrumentation for AMERICAN FR-FRE Bending Test (completed) Location Instrument Description Instrument Name 12 in. from Joint Axial Gage at Invert on Bell End B12I 12 in. from Joint Axial Gage at Crown on Bell End B12C 12 in. from Joint Axial Gage at S Springline on Bell End B12S 12 in. from Joint Axial Gage at N Springline on Bell End B12N 48 in. from Joint Axial Gage at Invert on Bell End B48I 48 in. from Joint Axial Gage at Crown on Bell End B48C Top Center Load Cell Load East End Cap Pressure Gage Pressure 1 in. = 25.4 mm Table 4.1 lists the location, instrument type, and number for the FR-FRE joint test. The instrumentation consisted of string potentiometers (string pots) to measure horizontal displacements at the crown and invert of the pipe FR bell, which were used to measure the bell rotation, and are referred to as HSPs. Vertical displacements along the length of the specimen were measured using seven vertical string pots (VSPs). The VSPs were used to determine the vertical deformation of the test specimen and to calculate the rotation at various locations along the pipe. Strain gages were installed to measure axial and bending strains in the DI pipe Calculation Approach The length of the test specimens between the outer supports was lt =12 ft (3.66 m). The pipe weight was 15 lb/ft (2.63 kn/m) and the water weight was 16.2 lb/ft (2.84 kn/m.) The combined distributed weight of the pipe and water inside the pipe was w = 31.2 lb/ft (5.46 kn/m.) Using a simply-supported beam approach, the maximum moment at the pipe centerline was: M distrib 2 wlt (4.1) 8 where: w = uniform load due to pipe and water, and lt = the total pipe length between the outer supports. 32
44 The three equal distances between the load and support points each were 48 in. (1.22 m). The additional moment applied to the central portion of the specimen, M central, was calculated as M Pl 6 t central (4.2) where: P = the applied load due to the weight of the spreader beam [W = 216 lb (0.96 kn)] plus the load applied by the hydraulic actuator, P, in the load frame, and lt = the total pipe length between the outer supports. The moment due to the pipe, water, and spreader beam weights are included in the moment vs. rotation calculations. Two methods were used to calculate joint rotations. One method uses the horizontal string pots (HSPs) at the top and bottom of the bell and the vertical separation distance to calculate the joint rotation. Equation 2.3 provides the method used for this approach, as follows 1 invert disp. crown disp. 180 (degrees) tan distance between centers of HSPs = 8.9 in. (4.3) An alternate approach is to assume the pipe sections act as rigid bodies in rotation, take the difference between the vertical string pot measurement (VSPs) at the specimen center and another point along the pipe, and divide by the pot separation distance. The arctangent of this result is the rotation of each side. The overall joint rotation is the sum of the two side angles, as follows (VSP 0) in. (VSP 20) in in. 1 (degrees) FRE side tan (VSP 0) in. (VSP 20) in in. 1 (degrees) FR side tan (4.4) where (VSP 0) in. is at the specimen center, (VSP-20) in. is -20 in. on the FRE side of the joint, and (VSP 20) in. is +20 in. on the FR side Test Procedures The pipe for the bending test was installed in the loading frame, leveled, and all instrumentation and data acquisitions systems were checked. The test was then performed as follows: 33
45 1) Fill the pipe with water, pressurize, and bleed the system to extend fully the bell/spigot connection. An internal pressure of 80 psi (550 kpa) generated approximately 2000 lb (8.8 kn) of axial force, which was sufficient to expand the joint. 2) Remove the temporary supports. 3) Lower the spreader beam onto the pipe. 4) Apply hydraulic force to develop moment and rotation at the joint. Leakage was first observed in the joint at rotation of about 8 degrees. The test was stopped when 100-ml/min leak occurred at a rotation of approximately 10 degrees Pressure The specimen was pressurized with water to approximately 80 psi (552 kpa), and the joint was fully extended. Internal pressure was adjusted during the test to maintain a nearly constant pressure. Figure 4.4 shows the pressure vs. time from the bending test. The test was stopped when a leak of 100 ml/min in the joint developed, and the pipe was depressurized String Pot Measurements The spigot and bell side VSP measurements shown in Figure 4.5 indicate that there is good agreement between vertical movement measurements at equal distances from the center point of the test. The continuous progression of these displacements is a further indication that the assumption of rigid body motion can be used in Equation 4.4 to determine rotations. The horizontal string pots (HSPs) at the crown and invert of the pipe joint provide quantitative data for the evaluation of rotation. Figure 4.6 shows the HSP measurements vs. the VSP rotation for the FR-FRE specimen. The HSP rotations beyond a few degrees are considered less reliable than the VSP rotations. There is an early zero offset of roughly 0.08 in. (2 mm) in the displacements corresponding to the release of the central supports, which allowed the specimen to deflect at the joint under the pipe weight plus water. This force was not measured in the hydraulic load system. The weight of the pipe plus water caused a joint rotation of 1.2 degrees. When the weight of the spreader beam was added, the joint rotated about 5.5. The additional weight of the spreader beam caused substantial rotations at small force. After the full weight of the spreader beam was added, additional forces were applied by the Baldwin system. 34
46 Figure 4.4. Pressure vs. Time for FR-FRE Bending Test Figure 4.5. VSP Measurements for FR-FRE Bending Test Figure 4.6. HSP Measurements vs. VSP Rotation for FR-FRE Bending Test 35
47 Figure 4.7. Moment-Rotation for FR-FRE Bending Test Moment vs. Rotations Joint rotations determined using the VSPs for the FR-FRE specimen are shown in Figure 4.7. Leakage was measured three times during this test as indicated in the figure. The first leak in the FR-FRE joint developed at a rotation of = 7.8 and an applied moment of 155 kip-in. (17.5 knm). The leak rate was 3.5 ml/min (Figure 4.8). When the test was continued, the leakage rate was higher. The leakage of 60 ml/min was measured at a joint rotation of = 9.2 and a moment of 289 kip-in. (32.7 kn-m). The test was continued until continuous flow of 100 ml/min developed at a rotation of = 9.9 and a moment of 337 kip-in. (38.1 kn-m). The test was then stopped. Figure 4.9 presents a photo of the joint with leakage at the end of test. No visible damage was observed. 36


48 a) Side View b) Underside View Figure 4.8. FR-FRE First Leakage of 3.5 ml/min a) Side View b) Underside View Figure 4.9. FR-FRE Leakage of 100 ml/min at End of Test 37
49 4.3. Four-Point Bending of Earthquake Joint System Joint Description This section summarizes the results of the four-point bending test of the AMERICAN Earthquake Joint System (EJS). Figures 4.10 a) and b) show a representative exterior and cutaway view, respectively, of the joint. Sections of DI pipe were shipped to Cornell by AMERICAN and were used in a support assembly with a 400 kip (1.78 MN) hydraulic loading capacity. The pipe was a nominal 6-in.-(150-mm)-diameter pipe with a FE-SE spigot, EJS Deep Socket, and FR-FE bell section. The joint system was assembled with gaskets, lubricant, and DI split snap ring supplied by AMERICAN. Mechanical joint end caps with Megalug restraints were used on the ends to allow for water pressurization. A nominal internal pressure of 80 psi (550 kpa) was used throughout the bending testing Instrumentation and Testing Procedures Figure 4.11 shows a schematic cross-section of the EJS bending test. There were two temporary supports beneath the central loading points similar to those used in the previous test. Figure 4.12 shows the test set-up before the central supports were removed. The test sequence was the same as for the FR-FRE joint. Table 4.2 lists location, instrument type, and number for the EJS instrumentation. a) Complete Joint System b) Cutaway Views of AMERICAN EJS Figure AMERICAN Earthquake Joint System (EJS) 38

50 Figure Schematic of Instrumentation for EJS Bending Test Figure Photo of AMERICAN EJS Bending Specimen before Testing 39
51 Table 4.2. Instrumentation for AMERICAN EJS Bending Test Location Instrument Description Instrument Name -65 in. from Centerline Vertical String Pot on Bell End VSP in. from Centerline Vertical String Pot on Bell End VSP in. from Centerline Vertical String Pot on Bell End VSP in. from Centerline Vertical String Pot on Bell End VSP-10 5 in. from Centerline Vertical String Pot on Spigot End VSP 5 19 in. from Centerline Vertical String Pot on Spigot End VSP in. from Centerline Vertical String Pot on Spigot End VSP in. from Centerline Vertical String Pot on Spigot End VSP in. from Joint Horizontal String Pot at Crown at SE Joint HSP_C -11 in. from Joint Horizontal String Pot at Invert at SE Joint HSP_I 9.6 in. from Joint Horizontal String Pot at Crown at FR Joint B_HSP_C 9.6 in. from Joint Horizontal String Pot at Invert at FR Joint B_HSP_I -45 in. from Centerline Axial Gage at Invert on Spigot End S45I -45 in. from Centerline Axial Gage at Crown on Spigot End S45C 22 in. from Centerline Axial Gage at Invert on Bell End B22I 22 in. from Centerline Axial Gage at Crown on Bell End B22C 22 in. from Centerline Axial Gage at S Springline on Bell End B22S 22 in. from Centerline Axial Gage at N Springline on Bell End B22N 51 in. from Centerline Axial Gage at Invert on Bell End B51I 51 in. from Centerline Axial Gage at Crown on Bell End B51C Top Center Load Cell Load East End Cap Pressure Gage Pressure 1 in. = 25.4 mm Calculation Approach The calculation methods used for determining the joint rotations for the EJS rotation test are similar to those for the FR-FRE joint test, with small differences in instrument locations and specific dimensions. Assuming rigid body rotation of the pipe sections, VSP rotations are calculated by taking the string pot measurement on the FR bell or SE spigot sections divided by its distance from the closest support. The arctangent of this result is the rotation of each side. The deep socket rotation is calculated by taking the difference between the two string pot measurements on the deep socket and dividing by the pot separation distance. Its arctangent gives the deep socket rotation. The FR joint rotation is the sum of the FR bell and deep socket angles, as follows 40
52 θ FR (degrees) = tan -1 (VSP 19) in. [ (72-19) in. ] + tan-1 (VSP 5) in. - (VSP -10) in. [ ] (4.5) 15 in. The SE joint rotation is the SE spigot angle subtracted by the deep socket angle as θ SE (degrees) = tan -1 (VSP -22) in. [ ] tan (72-22) in. -1 (VSP 5) in. - (VSP -10) in. [ ] (4.6) 15 in. The sum of the FR bell and SE spigot gives the total EJS deflection as θ EJS (degrees) = tan -1 (VSP -22) in. [ ] + tan (72-22) in. -1 (VSP 19) in. [ (72-19) in. ] (4.7) where VSPs are the measurements (in inches) of the vertical string posts listed in Table Test Procedures The test procedures for loading the EJS specimen were similar the FR-FRE joint test. The equipment used and general instrumentation were similar Pressure The specimen was pressurized with water to approximately 85 psi (587 kpa). The line transmitting water pressure was open for the duration of the test to be representative of conditions in the field for the EJS as well as conditions associated with the large-scale split-basin test. Figure 4.13 presents the pressure vs. time from the EJS bending test. The test was stopped when the pipe failed at the FR bell String Pot Measurements The VSP measurements on the pipe sections with EJS are shown in Figure measurements show the continuous progression of each pipe segment. Figure 4.15 shows the HSP vs. the VSP rotation for the FR and SE joints. The internal pressure caused the SE joint to open an additional 0.07 in. (1.78 mm) and rotate SE = -0.4 (upward). After the temporary supports had been removed, the weight of the pipe plus water plus spreader beam caused the FR joints to rotate FR = 5.8 while the SE joint angle was still at The 41
53 Figure Pressure vs. Time for EJS Bending Test Figure VSP Measurements for EJS Bending Test a) FR Joint b) SE Joint Figure HSP Measurements vs. VSP Rotation for EJS Bending Test 42
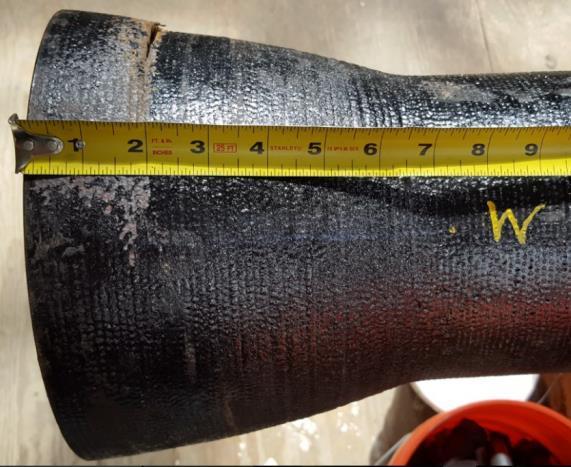
54 Figure Moment vs. Rotation for EJS Bending Test Moment vs. Rotations The moment vs. rotation test results are shown in Figure The rotation at the SE joint is substantially less than that at the FR joint. There was a moment drop from 305 kip-in. (34.5 knm) to 241 kip-in. (27.2 kn-m). This drop was associated by sliding of a rocker support, which stabilized in a new position. A leak first was observed at the FR joint at a rotation of FR = 10 and an EJS deflection of EJS = 12.7 at 323 kips-in. (36.5 kn-m) of applied moment. The leak rate was 25 ml/min (Figure 4.17). As the test continued, leakage rate at the FR joint increased. The second leak of 340 ml/min was measured at the FR joint at a rotation of FR = 10.6 and an EJS deflection of EJS = 13.4 at 360 kips-in. (40.7 kn-m) of moment. Figure 4.18 shows a leak of 1,430 ml/min developed at the FR joint of at a rotation FR = 11 and an EJS deflection of EJS = 13.9 at 386 kips-in. (43.6 kn-m) of moment. The test was stopped when the FR bell cracked causing pipe failure as shown in Figure The maximum EJS deflection at failure was EJS = 16.6 with an associated moment of 491 kips-in. (55.5 kn-m) 43

 at FR Joint")

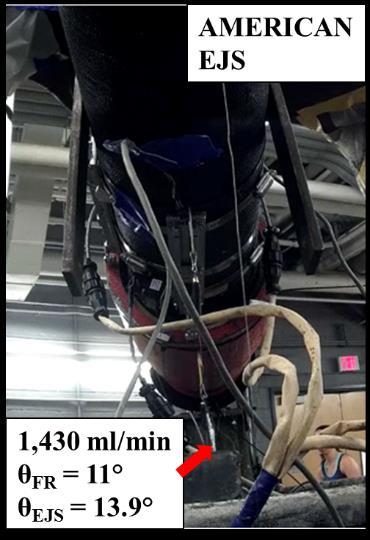
55 a) Side View b) Underside View Figure First Leak (25 ml/min) at FR Joint in EJS a) Side View b) Underside View Figure Leak (1,430 ml/min) at FR Joint in EJS 44
 ductile iron (DI) with an AMERICAN Flex-Ring (FR-FRE) joint and on a nominal 6-in. (150-mm) section with the AMERICAN Earthquake Joint System (EJS.")
 Baldwin hydraulic test frame.")
56 a) Side View b) Underside View Figure Pipe Failure at FR Bell in EJS 4.4. Summary of Four-Point Bending Tests Four-point bending tests were performed on sections of 6 in. (150 mm) ductile iron (DI) with an AMERICAN Flex-Ring (FR-FRE) joint and on a nominal 6-in. (150-mm) section with the AMERICAN Earthquake Joint System (EJS.) The purpose of these tests was to develop moment vs. rotation relationships for these types of joints. Instrumentation to measure joint rotations included horizontally and vertically orientated string potentiometers. The specimens were loaded in a 400 kip (1780 kn) Baldwin hydraulic test frame. One test on the FR-FRE joint and one on the EJS were performed. Table 4.3 summarizes the moment and rotation data when first leakage was observed for each test. The first leak of 3.5 ml/min in the FR-FRE joint occurred at a rotation of = 7.8 and an applied moment of 155 kipin. (17.5 kn-m). The test was stopped when the joint reached a rotation of = 9.9 and a moment of 337 kip-in. (38.1 kn-m) with continuous flow of 100 ml/min. In the EJS bending test, first leakage of 25 ml/min was observed at the FR joint at an FR joint rotation of FR = 10 and an EJS 45
57 deflection of EJS = 12.7 with an associated moment of 323 kip-in (36.5 kn-m). The test was continued until the FR bell cracked at EJS = 16.6 with a moment of 491 kips-in. (55.5 kn-m). Figure 4.3 presents summary moment-rotation relationships for both the 6-in. (150- mm)-diameter FR-FRE jointed pipe sections and those with the EJS. The allowable deflection for the FR-FRE in the AMERICAN Flex-Ring joint pipe is 5 degrees. The combined allowable deflection for the AMERICAN Earthquake Joint System (EJS) is 8 degrees. These limits are shown in Figure Both of the pipe joints tested at Cornell exceeded the allowable deflection without any leaks or pipe damage. Table 4.3. Results of Four-Point Bending Tests Test First Leakage Rate Rotation Moment FR-FRE 3.5 ml/min kip-in. (17.5 kn-m) EJS 25 ml/min FR = kip-in At FR joint EJS = 12.7 (36.5 kn-m) Figure Moment-Rotation Results from Four-Point Bending Tests on American DI Pipe Joints 46
58 Section 5 Large Scale Testing of Fault Rupture Effects 5.1 Introduction This section presents the results of the large-scale fault rupture test performed with a ductile iron pipeline equipped with AMERICAN Earthquake Joint System (EJS). All testing was performed in the large-scale test basin at the Cornell University Large Scale Lifelines Testing Facility. 5.2 Experimental Setup Figure 5.1 is a plan view of the test layout which shows the fault rupture plane and approximate locations of the four actuators generating basin movement. The pipeline consisted of five ductile iron pipe segments with four earthquake joint systems positioned at 5 ft (1.5 m) and 15 ft (4.6 m) on either side of the fault. The intersection angle between the pipe and fault was 50. The objective of the test was to impose abrupt ground deformation on the pipeline, which was representative of left lateral strike slip fault rupture and the most severe ground deformation that occurs along the margins of liquefaction-induced lateral spreads and landslides. The pipeline was constructed to evaluate its capacity to accommodate full-scale fault movement through the simultaneous axial pullout at four different earthquake joint systems. Measuring simultaneous performance of multiple joints allows for confirmation that the pipeline will respond to ground failure as intended, understand the complex interaction among the different joints, and determine the maximum ground deformation and axial pipeline load that can be sustained before joint leakage. The pipeline was buried in the Cornell large-scale test basin in partially saturated sand that was compacted to have an average friction angle of ϕ = 42º, equivalent in strength to that of a medium dense to dense granular backfill. The pipeline was assembled so that the FRE and SE spigots at each EJS could pull from the bells approximately 0.5 and 5 in. (12.7 and 127 mm) before the weld rings made contact with the locking ring. During the test, the south part of the basin remained stationary, while the north part was displaced to the north and west by large-stroke actuators to cause soil rupture and slip at the interface between the two parts of the test basin. 47
-long pipe with an EJS casting was connected at the north end of the pipeline.")
59 Figure 5.1. Plan View of Pipe Centered EJS Specimen in Test Basin A 115-in. (2.92-m)-long pipe section was placed directly over the fault, with an intersection angle of 50 o. Two identical pipes with EJS castings were installed to the north and the south of the center pipe. A 120-in. (3.05-m)-long pipe with an EJS casting was connected at the north end of the pipeline. Lastly, a 95.8-in. (2.43-m)-long pipe with an EJS casting was connected at the south end of the pipeline. The 6.9-in. (175-mm) outer-diameter pipe was placed on a bed of soil 10 in. (254 mm) in depth. The depth of burial to top of pipe was 31 in. (787 mm) resulting in 48 in. (1.22 m) of total soil depth. The simulated fault rupture caused both tensile and bending strains in the pipeline. The length of the pipeline buried in soil, also described as test portion, was approximately 36 ft (11 m) long. The pipe was pressurized with water to approximately 80 psi (552 kpa). The north (movable) portion of the test basin is connected to four MTS hydraulic actuators with load cells controlled by a MTS Flextest GT controller. All actuators were operated in synchronized displacement control. 48
60 5.2.1 Test Procedure The general test procedure, after all instruments were installed, soil placed, and pipe filled with water, was: a) Begin data acquisition and start the servo-controlled hydraulic system, b) Introduce and verify internal water pressure, c) Move the test basin at a rate of 1 ft/minute (305 mm/minute) until pipe failure (full pressure loss), d) Stop basin movement but maintain hydraulic actuator pressure, e) Verify data acquisition, and f) Excavate. At a fault displacement of 36 in. (914 mm), the internal pressure dropped to 25 psi (172 kpa), indicating leakage in the pipeline. Additional 2.5 in. (63.5 mm) of test basin movement was applied resulting in a complete pressure loss in the system. The test was then stopped Instrumentation Figure 5.1, a plan view of the test layout, shows the locations of the instruments along the test pipeline. The instrumentation consisted of strain gages at sixteen locations (gage planes) along the pipeline, load cells at the ends of the pipeline and string pots to measure joint displacements and rotations. Sixty-four strain gages were installed in sixteen locations along the pipeline to measure strains and to evaluate axial forces and bending moments. Strain gages were positioned at the crown (C) and invert (I), and at the east (E) and west (W) springlines of the pipe. Table 5.1 provides the number of strain gage station locations with respect to the fault. Strain gage locations were chosen on the basis of the expected deformed shape and axial behavior of the pipeline as determined from direct tension and four-point bending tests performed at Cornell University as well as the results of finite element analyses of the test. Strain gage stations S215 and N263 were installed to provide redundant measurements of the end loads. Strain gage stations close to the joints, S152, S78, S31, N42, N88, N160, and N215, were placed to assess strain concentration near the EJS castings. 49
61 Table 5.1. Strain Gage Locations and Coding System for EJS Split-basin Test Gage Station Gages Distance from Fault S215 S215E-East Springline, Longitudinal S215C-Crown, Longitudinal S215W-West Springline, Longitudinal 215 in. (5.46 m) south S215I-Invert, Longitudinal S152 S152E-East Springline, Longitudinal S152C-Crown, Longitudinal S152W-West Springline, Longitudinal 152 in. (3.86 m) south S152I-Invert, Longitudinal S120 S120E-East Springline, Longitudinal S120C-Crown, Longitudinal S120W-West Springline, Longitudinal 120 in. (3.04 m) south S120I-Invert, Longitudinal S88 S88E-East Springline, Longitudinal S88C-Crown, Longitudinal S88W-West Springline, Longitudinal 88 in. (2.24 m) south S88I-Invert, Longitudinal S78 S78E-East Springline, Longitudinal S78C-Crown, Longitudinal S78W-West Springline, Longitudinal 78 in. (1.98 m) south S78I-Invert, Longitudinal S31 S31EA-East Springline, Longitudinal S31CA-Crown, Longitudinal S31WA-West Springline, Longitudinal 31 in. (0.79 m) south S13IA-Invert, Longitudinal S15 S15EA-East Springline, Longitudinal S15CA-Crown, Longitudinal S15WA-West Springline, Longitudinal 15 in. (0.38 m) south S5IA-Invert, Longitudinal 0 0E-East Springline, Longitudinal 0C-Crown, Longitudinal 0W-West Springline, Longitudinal 0 0I-Invert, Longitudinal N15 N15E-East Springline, Longitudinal N15C-Crown, Longitudinal N15W-West Springline, Longitudinal 15 in. (0.38 m) north N15I-Invert, Longitudinal N31 N31E-East Springline, Longitudinal N31C-Crown, Longitudinal N31W-West Springline, Longitudinal N31I-Invert, Longitudinal 31 in. (0.79 m) north 50
62 Table 5.1. Strain Gage Locations and Coding System for EJS Split-basin Test (completed) Gage Station Gages Distance from Fault N42 N42EA-East Springline, Longitudinal N42CA-Crown, Longitudinal N42WA-West Springline, Longitudinal 42 in. (1.07 m) north N42IA-Invert, Longitudinal N88 N88E-East Springline, Longitudinal N88C-Crown, Longitudinal N88W-West Springline, Longitudinal 88 in. (2.24 m) north N88I-Invert, Longitudinal N120 N120E-East Springline, Longitudinal N120C-Crown, Longitudinal N120W-West Springline, Longitudinal 120 in. (3.04 m) north N120I-Invert, Longitudinal N160 N160E-East Springline, Longitudinal N160C-Crown, Longitudinal N160W-West Springline, Longitudinal 160 in. (4.06 m) north N160I-Invert, Longitudinal N215 N215E-East Springline, Longitudinal N215C-Crown, Longitudinal N215W-West Springline, Longitudinal 215 in. (5.46 m) north N215I-Invert, Longitudinal N263 N263E-East Springline, Longitudinal N263C-Crown, Longitudinal N263W-West Springline, Longitudinal N263I-Invert, Longitudinal 263 in. (6.68 m) north Figure 5.2 shows the setup of the string potentiometers (pots). Three string pots were placed at each joint to measure the joint pullout and rotation, as well as spigot to bell face relative movement. Table 5.2 provides the locations and the labeling of the joint string pots to measure joint pullout and rotation. Two string pots were mounted at the east and west springlines of the bell. The other string pot was installed at the crown of the bell. The FRE and SE spigots were inserted into the FR and SE bells at each joint approximately 0.5 and 5 in. (12.7 and 127 mm), respectively. After the instrumentation was installed, protective shielding was wrapped around the joint. Figure 5.3 is an overview of the pipe joint with the protective shielding. 51


 intervals.")

63 a) FR Joint b) SE Joint Figure 5.2 Setup of String Pots a) FR Joint b) SE Joint Figure 5.3 Pipe Joints with Protective Shielding Four calibrated load cells were positioned at each end of the test basin. Table 5.3 provides the locations and the labeling of the load cells. Twenty-nine survey marks were scribed along the crown of the specimen at approximately 12-in. (300-mm) intervals. The pipe was surveyed with a total station instrument prior to burial to determine its initial position, and again after the test, to provide a measure of global pipeline deformation. 52
64 Table 5.2. String Pot Locations and Labeling for EJS Split-basin Test Location S15 FR Joint S15 SE Joint S5 FR Joint S5 SE Joint N5 FR Joint N5 SE Joint N15 FR Joint N15 SE Joint 1 in. = 25.4 mm Displacement Measurement Device S15 FR Disp E East Springline S15 FR Disp C Crown S15 FR Disp W West Springline S15 SE Disp E East Springline S15 SE Disp C Crown S15 SE Disp W West Springline S5 FR Disp E East Springline S5 FR Disp C Crown S5 FR Disp W West Springline S5 SE Disp E East Springline S5 SE Disp C Crown S5 SE Disp W West Springline N5 FR Disp E East Springline N5 FR Disp C Crown N5 FR Disp W West Springline N5 SE Disp E East Springline N5 SE Disp C Crown N5 SE Disp W West Springline N15 FR Disp E East Springline N15 FR Disp C Crown N5 FR Disp W West Springline N5 SE Disp E East Springline N5 SE Disp C Crown N5 SE Disp W West Springline Type and Stroke String pot ± 1 in. String pot ± 1 in. String pot ± 1 in. String pot ± 5 in. String pot ± 5 in. String pot ± 5 in. String pot ± 1 in. String pot ± 1 in. String pot ± 1 in. String pot ± 5 in. String pot ± 5 in. String pot ± 5 in. String pot ± 1 in. String pot ± 1 in. String pot ± 1 in. String pot ± 5 in. String pot ± 5 in. String pot ± 5 in. String pot ± 1 in. String pot ± 1 in. String pot ± 1 in. String pot ± 5 in. String pot ± 5 in. String pot ± 5 in. Table 5.3. Load Cell Locations and Labeling for EJS Split-basin Test Location South End North End Load Cell SW Top Ld West, Top SE Top Ld East, Top SW Bot Ld West, Bottom SE Bot Ld East, Bottom NW Top Ld West, Top NE Top Ld Outer, East, Top NW Bot Ld West, Bottom NE Bot Ld East, Bottom 53
65 5.2.3 Soil Preparation The soil used during the test was crushed, washed, glacio-fluvial sand obtained from RMS Gravel, Dryden, NY, consisting of particles mostly passing the ¼ in. (6.35 mm) sieve. Figure 5.4 is the grain size distribution of the RMS graded sand. Approximately 6-in. (152-mm)-thick lifts of soil were placed and compacted until there was 31 in. (787 mm) cover of compacted sand above the pipe crown. Every layer was compacted to the same extent and moistened with water in a similar way to achieve uniformity. Dry density measurements were taken for each layer using a Troxler Model 3440 densitometer. Moisture content measurements were obtained using both soil samples and the densitometer at the same locations. The target value of dry density was γdry = 106 lb/ft 3 (16.7 kn/m 3 ), and the target value of moisture content was w = 4.0 %, corresponding to an angle of shearing resistance (friction angle) of the sand of approximately 42º. Eight measurements of dry unit weight and moisture content were made for each soil lift. The average and standard deviation of all dry unit weight measurements were lb/ft 3 (17.0 kn/m 3 ) and 1.1 lb/ft 3 (0.17 kn/m 3 ), respectively. Moisture content measurement had an average of 4.4% and standard deviation of 0.6%. The angle of shearing resistance of the soil, based on correlations with soil unit weight established at Cornell, was ϕ = The soil strength properties are representative of a well-compacted dense sand. 5.3 Experimental Results of Split Basin Test Test Basin Movements Four actuators are connected between the movable portion of the test basin and the modular reaction wall in the laboratory. From south to north, the actuators are identified as short-stroke actuator 1 (SSA1), short-stroke actuator 2 (SSA2), long-stroke actuator 1 (LSA1), and long-stroke actuator 2 (LSA2). Each SSA actuator has a displacement range of ± 2 ft (± 0.61 m) for a total stroke of 4 ft (1.22 m) and load capacity of 100 kips (445 kn) tension and 145 kips (645 kn) compression. Each LSA actuator has a displacement range of ± 3 ft (0.91 m) for a total stroke of 6 ft (1.83 m) and load capacity of 63 kips (280 kn) tension and 110 kips (489 kn) compression. 54
66 Figure 5.4. Particle Size Distribution of RMS Graded Sand Figure 5.5 shows the average displacement of the four actuators, which is equivalent to the fault displacement, with respect to time. The axial displacement imposed on the pipeline by fault displacement, d f, is shown along the top horizontal axis. It is equal to d f cosβ, in which β = 50 is the angle of intersection between the pipeline and the fault Internal Water Pressure The pipe was initially pressurized to 80 psi (550 kpa) before any basin movement and provided constant pressure during the test from the laboratory water supply. The basin movement caused the pipe to increase in overall length, causing fluctuations in pressure. Figure 5.6 shows the pipe internal pressure vs. fault displacement. At a fault displacement of roughly 36 in. (914 mm) there was a large loss of pressure in the pipe. This fault displacement corresponds to 23.1 in. (587 mm) of axial pipeline displacement. The test basin was moved an additional 2.5 in. (63.5 mm) resulting in a complete pressure loss in the system. At this point the total fault movement was 38.5 in. (978 mm), the test was then stopped, and the water was drained from the pipe. 55
67 Figure 5.5. Fault Displacement vs. Time Figure 5.6 Internal Water Pressure vs. Fault Displacement Joint Pullout The joint pullout movements and rotations were measured using string potentiometers (string pots.) The string pot locations are given in Section and shown in Table 5.2. Each joint has a total of six string pots. Three at the FR bell and three at the SE bell, for a total of six. The positioning and protection of these pots was difficult and required great attention to detail and anticipated rough treatment during the tests. However, these measurements are critical in evaluating the overall behavior of the EJS system. The collective average movements of the FR and SE joints are shown in Figures 5.7 to 5.8, respectively. Figure 5.9 shows the total movements of the S15, S5, N5, and N15 earthquake joint systems. FR and SE joint rotations are provided in Figures 5.10 and 5.11, respectively. Figure 5.12 presented the total EJS deflections at S15, S5, N5, and N15. The movements of each portion of the double-jointed EJS at a fault displacement of 36 in. (914 mm) are given in Table 5.4. This fault movement is that at which the S15 FR bell failed. This corresponds to an axial test basin displacement of (36 in.) cos 50 = 23.1 in. (587 mm.) The failure mode for this test was ductile iron breakage at the FR bell of joint S15. A description of the failure and photos are shown in a later section. 56
68 Figure 5.7. Average FR Joint Openings vs. Fault Displacement Figure 5.8. Average SE Joint Openings vs. Fault Displacement Figure 5.9. Total EJS Openings for All Joints vs. Fault Displacement 57
69 Table 5.4. Joint Openings at 36 in. (914 mm) Fault Movement Joint Extension Test Joint FR (in.) SE (in.) EJS (in.) S S N N Average All four EJS joints Axial Basin Extension (in.) 23.1 Cornell Tension Tests 5.5 in. per EJS 4 joints 22.0 AMERICAN performance criteria 4.8 in. per EJS 4 joints in. = 25.4 mm The S15 SE and S5 SE string pots did not provide consistently accurate measurements after 17.5 and 13.4 in. (445 and 340 mm) of fault displacement, respectively. The survey measurements and basin movement were then used to estimate the S15 SE and S5 SE joint displacements beyond these limits as shown in dashed lines in Figures 5.8, 5.9, 5.11, and In Table 5.4 the openings of each of the joints are given, along with the cumulative opening of all four joints. The average joint opening of all joints at the limit pipe condition was 5.4 in. (137 mm.) The summation of the joint displacements was 21.5 in. (546 mm.) When Cornell performed the direct tension tests on the EJS joint, the extension of the joint system at failure was 5.5 in. (140 mm.). It must be noted that when the FR bell fractured at the S15 joint, none of the other joints had failed. All joints were close to or in exceedance of the anticipated limiting displacement. Also, the performance criteria stated for the AMERICAN EJS is ± 2.4 in. (61 mm) from the midpoint position. The performance limit for four joints would be 19.2 in. (488 mm). Thus, the AMERICAN test specimen total extension exceeded the performance criteria for longitudinal extension, and each joint moved according to the anticipated total extension. 58
70 5.3.4 Joint Rotations (Deflections) Joint rotations (deflections) were determined using the string pots at each joint and using survey measurements. In this report deflection is used to describe the angular deflection of the pipe, consistent with industry usage. It is critical to note that the observed failure during this test was due to rupture of the ductile iron in the FR bell at joint S15, most likely due to high moment and joint restraint due to the proximity of the joint to the fixed end of the test basin. None of the interior joints with high deflections (rotations) failed. Joint rotation is calculated from the string pot measurements at each joint as: -1 East String Pot Displacement West String Pot Displacement 180 Rotation deg = tan Separation Distance between the String Pots (5.1) The joint deflections are shown in Figures 5.10 to Figures 5.10 and 5.11 show deflections at the FR and SE joints, respectively. The total EJS deflection is a sum of FR and SE joint deflections, and is shown in Figure As the test basin was displaced, the S5 EJS moved closer to the fault and accommodated most of the fault offset with maximum deflection of nearly 9.4 degrees without failure. The N5 EJS was second closest to the fault and deflected about 6.7 degrees in the opposite direction to the S5 EJS. The other two EJS deflections were approximately 1 degree. During the beginning part of the test, the N5 and S5 earthquake joint systems accommodated most of the test basin movement. The N5 EJS, however, displaced faster such that the spigot weld ring was in contact with the locking ring at 13 in. (330 mm) of fault displacement, and the S5 EJS was fully extended at 17.5 in. (445 mm) of fault displacement. Subsequently, the S15 EJS opened rapidly and became fully extended when the basin reached 25 in. (635 mm) of movement. Axial displacement was then accommodated by the N15 EJS movement up until 30 in. (762 mm) of fault displacement when all four earthquake joint systems were fully opened. At a fault displacement of approximately 36 in. (914 mm), the S15 FR bell failed and leaked, corresponding to an additional 3.9 in. (99 mm) of axial displacement after all earthquake joint systems were extended to a condition of spigot ring/locking ring contact. 59
71 Figure FR Rotations vs. Fault Displacement Figure SE Rotations vs. Fault Displacement Figure Total EJS Deflections vs. Fault Displacement 60
72 The Bovay Laboratory uses a general coordinate system established in 2012 as part of Cornell s participation in the George E. Brown, Jr. Network for Earthquake Engineering Simulation (NEES). The coordinate system was developed using a Leica Flexline TS02 reflectorless total station to identify baseline positions within the laboratory. When the AMERICAN pipe was placed in the basin and backfilled to approximately the springline depth, survey measurements were taken at marked locations every 12 in. (25 mm) along the pipe crown. These data provide a baseline of the initial pipe position, albeit prior to complete backfill. Following careful pipe excavation with minimal disturbance, these pipe was re-surveyed. These data provide very close locations of the maximum pipe displacement at the maximum basin displacement. The test hydraulics remained on during pipe exposure so as not to allow the entire system to relax. Figures 5.13 a) shows, on a greatly exaggerated scale, the Leica data for the initial and final pipe positions. The data shown in Figure 5.13 were used to estimate the overall joint deflections at the S5 and N5 EJS. The measurements at the other two joints were too small to provide useful information. The apparent center of rotation of the S5 and N5 joints are shown in the figure. The slope of the mid-portion of the pipeline, which contained no joints, was 0 =10.4. The slope of the pipe beyond the S5 but before the S15 joint was 1 =1.0. The combined deflection of the S5 EJS then was S5 =9.4. The slope of the pipe beyond the N5 but before the N15 joint was 2 =1.9. The combined deflection of the N5 EJS then was S5 =8.5. Table 5.5 presents a comparison between the joint deflections determined using the string pot measurements and the survey data. It is believed that the Leica optical survey methods provide a more reasonable overall assessment of the combined joint deflections. Again, it is very important to note that these deflections did not cause any observed leakage or failure at the S5 and N5 joints. These are the joints that accommodated the greatest deflection in response to the large ground displacement. Essentially, these are the two critical joints for the experiment. Both the S5 and N5 AMERICAN EJS experienced joint deflections (rotations) beyond the combined assembly performance limit of 8. 61
73 a) Survey Data b) Method used for Determining Joint Deflections Figure Joint Deflections from Leica Survey Data 62
74 Test Joint FR Rotation (degrees) Table 5.5. Joint Deflections String Potentiometers Data SE Rotation (degrees) EJS Rotation (degrees) S Survey Data a EJS Rotation (degrees) S N N a based on pre- and post-test Leica measurements Positive refers to rotation in counter-clockwise direction End Loads and Pipe Axial Forces The axial tensile loads were measured with four load cells at the south end of the test basin and four load cells at the north end. The sum of the four load cells at each end of the test basin gives the total axial end load. Figure 5.14 shows the total load at the south and north ends of the test basin vs. fault displacement. The initial reduction of approximately 1.5 kip (6.7 kn) in the end loads was caused by internal pressurization. The end loads sharply increased at a fault displacement of approximately 30 in. (762 mm), corresponding to an axial basin displacement of 19.2 in. (620 mm), which is close to the sum of the 5.5 in. (114 mm) pullout settings for the four earthquake joint systems. Also included in Figure 5.14 are axial loads calculated from axial strain gages at planes close to the end of the test specimen. The axial force from average strain gage measurements was calculated as F = AE. The outside diameter of the pipe was OD = 6.9 in. (175 mm) and the average measured wall thickness was t w = 0.3 in. (7.6 mm). This gives a pipe wall cross-sectional area, A = 6.22 in. 2 (4013 mm 2 ). The Young s modulus of the ductile iron was E = 24,200 ksi (169 GPa), which was determined from tensile coupon tests. The axial forces in the pipe near the load cell locations were consistent with forces measured by the load cells. Loads recorded at the south end of the specimen were slightly greater than those recorded at the north end. 63
75 Figure Comparison of Average End Force from Load Cells and Strain Gages The calculated axial loads at each gage plane along the pipeline are presented in Figure 5.15 for various levels of fault displacement. The EJS casting locations are shown in red shaded areas. Figure 5.15 a) shows the tensile forces up to 15 in. (380 mm) of fault movement. Relatively low tensile forces were measured along the pipeline during these initial increments of displacement. The highest axial force was detected near the fault location, and the loads were lower at locations further away from the fault. Figure 5.15 b) (note change in scale for load) shows that tensile forces were generally higher with increasing fault displacement. The highest axial force was detected close to the S5 SE joint. However, a rapid increase in tensile force was observed at -152 plane, which was located near the S15 SE joint. Figure 5.15 c) shows that the loads increased rapidly from 30 in. (762 mm) to 36 in. (914 mm) of fault displacement. All joints attained contact between the spigot weld rings and the locking rings at 30 in. (762 mm) of fault displacement. About the same levels of maximum tensile loads were measured along the pipeline during these displacements, with the loads slightly higher towards the south end of the test basin. The peak forces of approximately 112 kips (498 kn) were found near S15 joints at -215 and -152 planes. The peak forces are consistent with the crack at the S15 FR bell, as shown by photos of the pipe failure (Figure 5.18). 64
76 5.3.6 Bending Moments Bending moments, M, were calculated at each strain gage station along the pipeline as: EI bend M (5.2) c where bending strains, bend, is one half the difference between the springline strains; E is Young s modulus of the ductile iron of 24,200 ksi (169 GPa); I is moment of inertia of 33.9 in 4 (1410 cm 4 ); and c is distance to outer fiber of 3.45 in (87.6 mm). Figure 5.16 presents the bending moments measured along the pipeline corresponding to various levels of fault displacement. The EJS castings are also shown in red shaded areas. Figure 5.16 a) shows that, during the first 15 in. (381 mm) of fault displacement, bending moments along the pipeline were relatively low. The measurements disclose an anti-symmetric pattern of moment distribution centered on the fault. Figure 5.16 b) (note change in scale for moment) shows that the moments were higher as the fault movement increased. The peak moments were detected near S15 and N15 locations. Figure 5.16 c) shows a consistent bending moment distribution for fault movements of 30 in. (762 mm) to 36 in. (914 mm). At a fault displacement of 30 in. (726 mm) the maximum moments are on the order of 200 kip-in. (22.6 kn-m) in the vicinity of S15 and N15 EJS castings. 65
77 Figure Axial Forces in Pipe vs. Distance from Fault 66
78 Figure Bending Moments in Pipe vs. Distance from Fault 67
.")
79 Figure Fault Rupture at Pipe Failure Deformed Shape and Pipe Failure Figure 5.17 shows the fault rupture at pipe failure. Figure 5.18 a) shows a photo of the pipeline before backfilling and burial of the pipe. Failure of the FR bell at EJS S15 was the overall failure mode. After fault rupture, the pipeline was excavated carefully in a manner that preserved its deformed shape as shown in Figure 5.18 b). Angles of S5 and N5 EJS deflection are also illustrated in Figure 5.18 b). These deflection angles were obtained from the Leica data as discussed in Section Figure 5.19 presents the fractured S15 FR bell without the protective shield. The plan and elevation views of the bell crack are illustrated in Figures 5.19 a) and 5.19 b) respectively. 68

 after excavation (angles shown from")
80 a) Before Burial b) After Excavation Figure Images of Pipeline (a) before burial and (b) after excavation (angles shown from total station surveying measurements) 69
-long, five-piece section of a ductile pipeline was tested at the Cornell Large-Scale Lifelines Facility.")
 north of the fault and two EJS castings at the same distances south of the fault. The fault angle was 50º.")
81 a) Plan View of S15 FR Bell b) Elevation View of S15 FR Bell from West Springline Figure Ruptured Pipe at S15 FR Bell following Test without Protective Shield 5.4 Summary of Large-Scale Testing A 36-ft (11-m)-long, five-piece section of a ductile pipeline was tested at the Cornell Large-Scale Lifelines Facility. The pipe had a total of four AMERICAN Earthquake Joint Systems. Two EJS castings were located 5 and 15 ft (1.5 and 3.6 m) north of the fault and two EJS castings at the same distances south of the fault. The fault angle was 50º. The pipe was instrumented with sixtyfour strain gages installed at sixteen locations along the pipeline to measure strains and to evaluate axial forces and bending moments. Strain gages were positioned at the crown (C), invert (I) east (E) springline, and west (W) springline of the pipe. There were three string pots at each joint to measure joint movements and to evaluate joint rotation. Four load cells were placed outside the test basin at each end, reacting between the test basin structural frame and pipe end restraint to measure axial force. The pipe was pressurized to approximately 80 psi (550 kpa.) The pipeline was buried in the Cornell large-scale test basin in partially saturated sand that was compacted to have an average friction angle of ϕ = 42º, equivalent in strength to that of a medium dense to dense granular backfill. The depth of burial to top of pipe was 31 in. (781 mm). During the test, the south part of the basin remained stationary, while the north part was displaced to the north and west by large-stroke actuators to cause soil rupture and slip at the interface between the 70
82 two parts of the test basin. The north section of the test basin was displaced along a 50º fault at a rate of 12 in. (300 mm) per minute. The basin was displaced until the pipe lost pressure at 36 in. (914 mm) fault displacement, which corresponds to 23.1 in. (587 mm) of axial extension of the test basin and pipe. Following excavation, a fracture was observed near the west springline of the FR Bell of the S15 EJS. The end forces at the south and north end of the test basin were about 95 and 90 kips (423 and 400 kn), respectively. The axial force in the pipe, as determined from the strain gage readings, was largest at 215 in. (790 mm) south of the fault at 112 kips (498 kn). It is assumed that the axial force in the pipe was at least 112 kips (498 kn). The test measurements confirm that the pipeline was able to accommodate fault rupture through axial displacements and deflections at all four Earthquake Joint Systems. They also provide a comprehensive and detailed understanding of how the movement was accommodated at each joint, the sequence of movements, and combined axial pullout and rotation at each joint. The total axial movement is 23.1 in. (587 mm), which exceeds the sum of the 5.5 in. (140 mm) joint displacement for all four earthquake joint systems. On average, each EJS displaced on the order of 5.78 in. (147 mm). This displacement was close to movement during previous direct tension testing of the AMERICAN EJS. The maximum deflection measured at the EJS closest to the fault was about 9.6 degrees, thus demonstrating the ability of the joints to sustain significant levels of combined axial pullout and deflection. The maximum stresses sustained by the pipeline, corresponding to the largest pipeline deformation, were well within the elastic range of pipeline behavior. The ductile iron pipeline equipped with AMERICAN Earthquake Joint System (EJS) was able to accommodate significant fault movement through axial pullout and rotation of the joints. Fault rupture simulated in the large-scale test is also representative of the most severe ground deformation that occurs along the margins of liquefaction-induced lateral spreads and landslides. The amount of tensile strain that can be accommodated with the ductile iron pipeline will depend on the spacing of the AMERICAN Earthquake Joint Systems and the positioning of the spigot within the bell at the pipeline joints. The pipeline used in the large-scale split-basin test was able to accommodate a minimum of 21.5 in. (546 mm) of axial extension, corresponding to an average tensile strain of 4.4% along the pipeline. Such extension is large enough to accommodate the great 71
83 majority (over 99%) of liquefaction-induced lateral ground strains measured by high resolution LiDAR after each of four major earthquakes during the recent Canterbury Earthquake Sequence (CES) in Christchurch, NZ (O Rourke, et al., 2014). These high resolution LiDAR measurements for the first time provide a comprehensive basis for quantifying the ground strains caused by liquefaction on a regional basis. To put the CES ground strains in perspective, the levels of liquefaction-induced ground deformation measured in Christchurch exceed those documented in San Francisco during the 1989 Loma Prieta earthquake and in the San Fernando Valley during the 1994 Northridge earthquake. They are comparable to the levels of most severe liquefactioninduced ground deformation documented for the 1906 San Francisco earthquake, which caused extensive damage to the San Francisco water distribution system. The test confirms that the ductile iron pipes equipped with the AMERICAN Earthquake Joint Systems are able to sustain large levels of ground deformation through axial displacement and deflection under full-scale conditions of abrupt ground rupture. 72
84 Section 6 Finite Element Simulations Two-dimensional (2D) finite element (FE) analyses were performed for 6-in. (150-mm)-diameter DI pipeline using soil and geometric parameters consistent with the large-scale test basin experiment presented in Section 5. The purpose of these analyses is to demonstrate the ability to numerically simulate the performance of the AMERICAN EJS to the same ground deformation imposed on the 6-in. (150-mm) pipeline in the large-scale split-basin test. 6.1 Large-Scale Split Basin Test Figure 6.1 is a plan view of the large-scale split basin test layout, which was used to generate fault rupture effects of 6-in. (150-mm)-diameter DI pipeline consisting of five pipe segments connected with AMERICAN EJS joints. The figure shows the fault rupture plane and approximate locations of the four actuators driving the ground failure. A detailed description of the test is provided in Section 5, and only the key features of the testing are summarized in this section of the report. The objective of the test was to impose abrupt ground deformation on the pipeline, which was identical to left lateral strike slip fault rupture and representative of the most severe ground deformation that occurs along the margins of liquefaction-induced lateral spreads and landslides. The pipeline was constructed to evaluate its capacity to accommodate full-scale fault movement through the simultaneous axial pullout at four different joints. Measuring simultaneous performance of multiple joints allows for confirmation that the pipeline will respond to ground failure as intended, understand the complex interaction among the different joints, and determine the maximum ground deformation and axial pipeline load that can be sustained before joint leakage. The full-scale test pipeline was buried in the Cornell large-scale test basin in partially saturated sand that was compacted to have an average friction angle of = 42º, equivalent in strength to that of a medium dense to dense granular backfill. The pipeline was positioned so that the spigot end of the SE section was fully homed in the FR bell, and the FE spigot fully homed in the SE 73
 and 5.0 in.")
 AMERICAN EJS is stated as ± 2.4 in. (61 mm) from the midpoint position. The depth of burial to top of pipe was 31 in. (787 mm).")
85 Figure 6.1. Plan View of Large-Scale Split Basin Test for AMERICAN Test Figure D FE Model Setup for a Pipeline under Fault Rupture bell. This allows the maximum extension of the EJS. The dimensions for allowable extension were based on those measured during the Cornell direct tension tests of 0.5 in. (12.7 mm) and 5.0 in., (127 mm) for the FR and SE joint, respectively, so each joint could pull from the bell approximately 5.5 in. (140 mm) before fully extended. The performance criterion for the 6 in. (150 mm) AMERICAN EJS is stated as ± 2.4 in. (61 mm) from the midpoint position. The depth of burial to top of pipe was 31 in. (787 mm). During the test, the south part of the basin remained stationary, while the north part was displaced to the north and west by large-stroke actuators to cause soil rupture and slip at the interface between the two parts of the test basin. 74
Four-Point Bending and Direct Tension Testing of Twelve Inch TR-XTREME Pipe Joint
 Four-Point Bending and Direct Tension Testing of Twelve Inch TR-XTREME Pipe Joint Submitted to: Russ Huggins PE AVP of Product Development and Quality US Pipe By C. Pariya-Ekkasut H. E. Stewart B. P. Wham
Evaluation of McWane Seismic Flex Coupling for Resistance to Earthquake-Induced Ground Deformation
 Evaluation of McWane Seismic Flex Coupling for Resistance to Earthquake-Induced Ground Deformation Submitted to: Stuart Liddell National Manager - MASD 1201 Vanderbilt Road Birmingham, Alabama 35234 (stuart.liddell@mcwaneductile.com)
Direct Tension and Split Basin Testing of 6-in. (150-mm)- Diameter Kubota Earthquake Resistant Ductile Iron Pipe
- Diameter Kubota Earthquake Resistant Ductile Iron Pipe") Direct Tension and Split Basin Testing of 6-in. (150-mm)- Diameter Kubota Earthquake Resistant Ductile Iron Pipe Submitted to: Mr. Toshio Toshima Kubota Corporation By C. Pariya-Ekkasut H. E. Stewart B.
Direct Tension and Split Basin Testing of 6-in. (150-mm)- Diameter Kubota Earthquake Resistant Ductile Iron Pipe Submitted to: Mr. Toshio Toshima Kubota Corporation By C. Pariya-Ekkasut H. E. Stewart B.
Task 1 - Material Testing of Bionax Pipe and Joints
 Task 1 - Material Testing of Bionax Pipe and Joints Submitted to: Jeff Phillips Western Regional Engineer IPEX Management, Inc. 20460 Duncan Way Langley, BC, Canada V3A 7A3 Ph: 604-534-8631 Fax: 604-534-7616
Performance Evaluation of Bionax SR PVCO Pipeline with Extended Bell Joints under Earthquake-Induced Ground Deformation
 Performance Evaluation of Bionax SR PVCO Pipeline with Extended Bell Joints under Earthquake-Induced Ground Deformation by B. P. Wham B. Berger T. D. O Rourke C. Payiya-Ekkasut H. E Stewart Cornell University
ASIAN JOURNAL OF CIVIL ENGINEERING (BUILDING AND HOUSING) VOL. 10, NO. 5 (2009) PAGES **-**
 VOL. 10, NO. 5 (2009) PAGES **-**") ASIAN JOURNAL OF CIVIL ENGINEERING (BUILDING AND HOUSING) VOL. 10, NO. 5 (2009) PAGES **-** AN EXPERIMENTAL STUDY ON THE ANTI-SEISMIC PERFORMANCE OF A U-PVC WATER SUPPLY PIPELINE WITH ENLARGED EXPANSION
ASIAN JOURNAL OF CIVIL ENGINEERING (BUILDING AND HOUSING) VOL. 10, NO. 5 (2009) PAGES **-** AN EXPERIMENTAL STUDY ON THE ANTI-SEISMIC PERFORMANCE OF A U-PVC WATER SUPPLY PIPELINE WITH ENLARGED EXPANSION
4.MECHANICAL PROPERTIES OF MATERIALS
 4.MECHANICAL PROPERTIES OF MATERIALS The diagram representing the relation between stress and strain in a given material is an important characteristic of the material. To obtain the stress-strain diagram
Lesson 25. Static Pile Load Testing, O-cell, and Statnamic. Reference Manual Chapter 18
 Lesson 25 Static Pile Load Testing, O-cell, and Statnamic Reference Manual Chapter 18 STATIC LOAD TESTING Most accurate method to determine static pile capacity Perform at design or construction stage
Restraining Thrust Forces. DIPRA Member Companies. DIPRA Website (www.dipra.org) DIPRA Computer Programs. AWWA Standards
 DIPRA Computer Programs. AWWA Standards") DIPRA Member Companies 1915 DIPRA Website (www.dipra.org) DIPRA Computer Programs Thickness Design of Ductile Iron PIpe Hydraulic Analysis of Ductile Iron Pipe Thrust Restraint Design for Ductile Iron
DIPRA Member Companies 1915 DIPRA Website (www.dipra.org) DIPRA Computer Programs Thickness Design of Ductile Iron PIpe Hydraulic Analysis of Ductile Iron Pipe Thrust Restraint Design for Ductile Iron
Experimental Investigation of Steel Pipe Pile to Concrete Cap Connections
 Brigham Young University BYU ScholarsArchive All Theses and Dissertations 211-4-19 Experimental Investigation of Steel Pipe Pile to Concrete Cap Connections Ryan S. Eastman Brigham Young University - Provo
Canadian Geotechnical Journal JOINTED PIPELINE RESPONSE TO TUNNELING INDUCED GROUND DEFORMATION
 JOINTED PIPELINE RESPONSE TO TUNNELING INDUCED GROUND DEFORMATION Journal: Manuscript ID cgj-2016-0054.r1 Manuscript Type: Article Date Submitted by the Author: 20-Jun-2016 Complete List of Authors: Wham,
MECHANICS OF MATERIALS Sample Problem 4.2
 Sample Problem 4. SOLUTON: Based on the cross section geometry, calculate the location of the section centroid and moment of inertia. ya ( + Y Ad ) A A cast-iron machine part is acted upon by a kn-m couple.
[5] Stress and Strain
![[5] Stress and Strain](/thumbs/95/123344550.jpg "[5] Stress and Strain") [5] Stress and Strain Page 1 of 34 [5] Stress and Strain [5.1] Internal Stress of Solids [5.2] Design of Simple Connections (will not be covered in class) [5.3] Deformation and Strain [5.4] Hooke s Law
[5] Stress and Strain Page 1 of 34 [5] Stress and Strain [5.1] Internal Stress of Solids [5.2] Design of Simple Connections (will not be covered in class) [5.3] Deformation and Strain [5.4] Hooke s Law
MECE 3321 MECHANICS OF SOLIDS CHAPTER 3
 MECE 3321 MECHANICS OF SOLIDS CHAPTER 3 Samantha Ramirez TENSION AND COMPRESSION TESTS Tension and compression tests are used primarily to determine the relationship between σ avg and ε avg in any material.
EMA 3702 Mechanics & Materials Science (Mechanics of Materials) Chapter 2 Stress & Strain - Axial Loading
 Chapter 2 Stress & Strain - Axial Loading") MA 3702 Mechanics & Materials Science (Mechanics of Materials) Chapter 2 Stress & Strain - Axial Loading MA 3702 Mechanics & Materials Science Zhe Cheng (2018) 2 Stress & Strain - Axial Loading Statics
MA 3702 Mechanics & Materials Science (Mechanics of Materials) Chapter 2 Stress & Strain - Axial Loading MA 3702 Mechanics & Materials Science Zhe Cheng (2018) 2 Stress & Strain - Axial Loading Statics
1.103 CIVIL ENGINEERING MATERIALS LABORATORY (1-2-3) Dr. J.T. Germaine Spring 2004 LABORATORY ASSIGNMENT NUMBER 6
 Dr. J.T. Germaine Spring 2004 LABORATORY ASSIGNMENT NUMBER 6") 1.103 CIVIL ENGINEERING MATERIALS LABORATORY (1-2-3) Dr. J.T. Germaine MIT Spring 2004 LABORATORY ASSIGNMENT NUMBER 6 COMPRESSION TESTING AND ANISOTROPY OF WOOD Purpose: Reading: During this laboratory
1.103 CIVIL ENGINEERING MATERIALS LABORATORY (1-2-3) Dr. J.T. Germaine MIT Spring 2004 LABORATORY ASSIGNMENT NUMBER 6 COMPRESSION TESTING AND ANISOTROPY OF WOOD Purpose: Reading: During this laboratory
Samantha Ramirez, MSE. Stress. The intensity of the internal force acting on a specific plane (area) passing through a point. F 2
 passing through a point. F 2") Samantha Ramirez, MSE Stress The intensity of the internal force acting on a specific plane (area) passing through a point. Δ ΔA Δ z Δ 1 2 ΔA Δ x Δ y ΔA is an infinitesimal size area with a uniform force
Samantha Ramirez, MSE Stress The intensity of the internal force acting on a specific plane (area) passing through a point. Δ ΔA Δ z Δ 1 2 ΔA Δ x Δ y ΔA is an infinitesimal size area with a uniform force
NORMAL STRESS. The simplest form of stress is normal stress/direct stress, which is the stress perpendicular to the surface on which it acts.
 NORMAL STRESS The simplest form of stress is normal stress/direct stress, which is the stress perpendicular to the surface on which it acts. σ = force/area = P/A where σ = the normal stress P = the centric
Technical Note 16 Equivalent Static Method
 Technical Note 16 Equivalent Static Method Contents Technical Note 21 -... 1 1 Introduction... 1 2 Operational Strain in the Pipeline... 2 3 Seismicity... 2 4 Vertical Uplift... 3 5 Vertical Bearing...
ME 243. Mechanics of Solids
 ME 243 Mechanics of Solids Lecture 2: Stress and Strain Ahmad Shahedi Shakil Lecturer, Dept. of Mechanical Engg, BUET E-mail: sshakil@me.buet.ac.bd, shakil6791@gmail.com Website: teacher.buet.ac.bd/sshakil
Evaluation of Water Distribution Jointed Pipe Networks under Transient Ground Motions
 Open Journal of Civil Engineering, 215, 5, 19-22 Published Online June 215 in SciRes. http://www.scirp.org/journal/ojce http://dx.doi.org/1.4236/ojce.215.5219 Evaluation of Water Distribution Jointed Pipe
Technical Note PP TN Engineering Considerations for Temperature Change
 Technical Note PP 814 - TN Engineering Considerations for Temperature Change www.performancepipe.com Like most materials, polyethylene is affected by temperature change. However, polyethylene s response
APPENDIX G I-BEAM SUMMARIES 0.6-IN. STRAND G-1
 APPENDIX G I-BEAM SUMMARIES.6-IN. STRAND G-1 Concrete Compressive Strength Embedment Length(L e ) Span Failure Mode Maximum Load Maximum Shear Maximum Moment Maximum Deflection attained Rebound after complete
Pre-failure Deformability of Geomaterials. Hsin-yu Shan Dept. of Civil Engineering National Chiao Tung University
 Pre-failure Deformability of Geomaterials Hsin-yu Shan Dept. of Civil Engineering National Chiao Tung University Strain Levels Strain at failure Sand Clay Rock Distribution of strain of soil in the field
ME 2570 MECHANICS OF MATERIALS
 ME 2570 MECHANICS OF MATERIALS Chapter III. Mechanical Properties of Materials 1 Tension and Compression Test The strength of a material depends on its ability to sustain a load without undue deformation
Mechanical Properties of Materials
 Mechanical Properties of Materials Strains Material Model Stresses Learning objectives Understand the qualitative and quantitative description of mechanical properties of materials. Learn the logic of
Pullout Tests of Geogrids Embedded in Non-cohesive Soil
 Archives of Hydro-Engineering and Environmental Mechanics Vol. 51 (2004), No. 2, pp. 135 147 Pullout Tests of Geogrids Embedded in Non-cohesive Soil Angelika Duszyńska, Adam F. Bolt Gdansk University of
Elastic Properties of Solids (One or two weights)
") Elastic properties of solids Page 1 of 8 Elastic Properties of Solids (One or two weights) This is a rare experiment where you will get points for breaking a sample! The recommended textbooks and other
Elastic properties of solids Page 1 of 8 Elastic Properties of Solids (One or two weights) This is a rare experiment where you will get points for breaking a sample! The recommended textbooks and other
Solid Mechanics Homework Answers
 Name: Date: Solid Mechanics Homework nswers Please show all of your work, including which equations you are using, and circle your final answer. Be sure to include the units in your answers. 1. The yield
Verification of Numerical Modeling in Buried Pipelines under Large Fault Movements by Small-Scale Experiments
 Verification of Numerical Modeling in Buried Pipelines under Large Fault Movements by Small-Scale Experiments T.J. Lin, G.Y. Liu, L.L. Chung, and C.H. Chou National Center for Research on Earthquake Engineering,
FAULT CROSSING DESIGN OF 66 INCH PIPELINE SAN FRANCISCO HETCH HETCHY WATER SYSTEM. Arne Nervik, P.E. (California) Black & Veatch Corporation
 Black & Veatch Corporation") FAULT CROSSING DESIGN OF 66 INCH PIPELINE SAN FRANCISCO HETCH HETCHY WATER SYSTEM Arne Nervik, P.E. (California) Black & Veatch Corporation AGENDA SFPUC Water System Seismic Hazards Pipeline Response to
FAULT CROSSING DESIGN OF 66 INCH PIPELINE SAN FRANCISCO HETCH HETCHY WATER SYSTEM Arne Nervik, P.E. (California) Black & Veatch Corporation AGENDA SFPUC Water System Seismic Hazards Pipeline Response to
2012 MECHANICS OF SOLIDS
 R10 SET - 1 II B.Tech II Semester, Regular Examinations, April 2012 MECHANICS OF SOLIDS (Com. to ME, AME, MM) Time: 3 hours Max. Marks: 75 Answer any FIVE Questions All Questions carry Equal Marks ~~~~~~~~~~~~~~~~~~~~~~
The science of elasticity
 The science of elasticity In 1676 Hooke realized that 1.Every kind of solid changes shape when a mechanical force acts on it. 2.It is this change of shape which enables the solid to supply the reaction
1.105 Solid Mechanics Laboratory Fall 2003 Experiment 3 The Tension Test
 1.105 Solid Mechanics Laboratory Fall 2003 Experiment 3 The Tension Test Our objective is to measure the Elastic Modulus of steel. The experiment comes in two parts. In the first, you will subject a steel
PES Institute of Technology
 PES Institute of Technology Bangalore south campus, Bangalore-5460100 Department of Mechanical Engineering Faculty name : Madhu M Date: 29/06/2012 SEM : 3 rd A SEC Subject : MECHANICS OF MATERIALS Subject
CHAPTER 4: BENDING OF BEAMS
 (74) CHAPTER 4: BENDING OF BEAMS This chapter will be devoted to the analysis of prismatic members subjected to equal and opposite couples M and M' acting in the same longitudinal plane. Such members are
CTC 460 kcmil ACCC Conductor Stress Strain Tests
 CTC 46 kcmil ACCC Conductor Stress Strain Tests NEETRAC Project Number: 8-45 March, 28 Requested by: Doug Pilling CTC Principal Investigator: Paul Springer, PE Reviewed by: Graham Price CTC 46 kcmil Conductor
NAME: Given Formulae: Law of Cosines: Law of Sines:
 NME: Given Formulae: Law of Cosines: EXM 3 PST PROBLEMS (LESSONS 21 TO 28) 100 points Thursday, November 16, 2017, 7pm to 9:30, Room 200 You are allowed to use a calculator and drawing equipment, only.
INTRODUCTION TO STRAIN
 SIMPLE STRAIN INTRODUCTION TO STRAIN In general terms, Strain is a geometric quantity that measures the deformation of a body. There are two types of strain: normal strain: characterizes dimensional changes,
Mechanics of Materials Primer
 Mechanics of Materials rimer Notation: A = area (net = with holes, bearing = in contact, etc...) b = total width of material at a horizontal section d = diameter of a hole D = symbol for diameter E = modulus
STRAIN ANALYSIS OF HDPE BUTT FUSION JOINT IN SIDE BEND TEST
 STRAIN ANALYSIS OF HDPE BUTT FUSION JOINT IN SIDE BEND TEST Meng Xiangli (Shawn), McElroy Manufacturing, Inc., Tulsa, OK Abstract The standard practice ASTM F3183-16 (F3183) has been developed for conducting
Seismic Pushover Analysis Using AASHTO Guide Specifications for LRFD Seismic Bridge Design
 Seismic Pushover Analysis Using AASHTO Guide Specifications for LRFD Seismic Bridge Design Elmer E. Marx, Alaska Department of Transportation and Public Facilities Michael Keever, California Department
Lab Exercise #5: Tension and Bending with Strain Gages
 Lab Exercise #5: Tension and Bending with Strain Gages Pre-lab assignment: Yes No Goals: 1. To evaluate tension and bending stress models and Hooke s Law. a. σ = Mc/I and σ = P/A 2. To determine material
MATERIALS FOR CIVIL AND CONSTRUCTION ENGINEERS
 MATERIALS FOR CIVIL AND CONSTRUCTION ENGINEERS 3 rd Edition Michael S. Mamlouk Arizona State University John P. Zaniewski West Virginia University Solution Manual FOREWORD This solution manual includes
Purpose of this Guide: To thoroughly prepare students for the exact types of problems that will be on Exam 3.
 ES230 STRENGTH OF MTERILS Exam 3 Study Guide Exam 3: Wednesday, March 8 th in-class Updated 3/3/17 Purpose of this Guide: To thoroughly prepare students for the exact types of problems that will be on
Cone-shaped socket connections for cylindrical members
 NSCC2009 Cone-shaped socket connections for cylindrical members H. Kuwamura 1 & T. Ito 2 1 Department of Architecture, The University of Tokyo, Tokyo, Japan 2 Department of Architecture, Tokyo University
Name :. Roll No. :... Invigilator s Signature :.. CS/B.TECH (CE-NEW)/SEM-3/CE-301/ SOLID MECHANICS
/SEM-3/CE-301/ SOLID MECHANICS") Name :. Roll No. :..... Invigilator s Signature :.. 2011 SOLID MECHANICS Time Allotted : 3 Hours Full Marks : 70 The figures in the margin indicate full marks. Candidates are required to give their answers
Name :. Roll No. :..... Invigilator s Signature :.. 2011 SOLID MECHANICS Time Allotted : 3 Hours Full Marks : 70 The figures in the margin indicate full marks. Candidates are required to give their answers
Solid Mechanics Chapter 1: Tension, Compression and Shear
 Solid Mechanics Chapter 1: Tension, Compression and Shear Dr. Imran Latif Department of Civil and Environmental Engineering College of Engineering University of Nizwa (UoN) 1 Why do we study Mechanics
3 Hours/100 Marks Seat No.
 *17304* 17304 14115 3 Hours/100 Marks Seat No. Instructions : (1) All questions are compulsory. (2) Illustrate your answers with neat sketches wherever necessary. (3) Figures to the right indicate full
Towards The. Design of Super Columns. Prof. AbdulQader Najmi
 Towards The Design of Super Columns Prof. AbdulQader Najmi Description: Tubular Column Square or Round Filled with Concrete Provided with U-Links welded to its Walls as shown in Figure 1 Compression Specimen
Bending Load & Calibration Module
 Bending Load & Calibration Module Objectives After completing this module, students shall be able to: 1) Conduct laboratory work to validate beam bending stress equations. 2) Develop an understanding of
AE3610 Experiments in Fluid and Solid Mechanics TRANSIENT MEASUREMENTS OF HOOP STRESSES FOR A THIN-WALL PRESSURE VESSEL
 Objective AE3610 Experiments in Fluid and Solid Mechanics TRANSIENT MEASUREMENTS OF OOP STRESSES FOR A TIN-WA PRESSURE VESSE This experiment will allow you to investigate hoop and axial stress/strain relations
LABORATORY MEASUREMENTS OF PULLING FORCE AND GROUND MOVEMENT DURING A PIPE BURSTING TEST
 North American Society for Trenchless Technology (NASTT) NO-DIG 2004 New Orleans, Louisiana March 22-24, 2004 LABORATORY MEASUREMENTS OF PULLING FORCE AND GROUND MOVEMENT DURING A PIPE BURSTING TEST Brian
ME 354, MECHANICS OF MATERIALS LABORATORY COMPRESSION AND BUCKLING
 ME 354, MECHANICS OF MATERIALS LABATY COMPRESSION AND BUCKLING PURPOSE 01 January 2000 / mgj The purpose of this exercise is to study the effects of end conditions, column length, and material properties
TOWARDS A VALIDATED PIPELINE DENT INTEGRITY ASSESSMENT MODEL
 Proceedings of IPC 28 International Pipeline Conference 28 September 29-October 3, 28, Calgary Alberta IPC28-64621 TOWARDS A VALIDATED PIPELINE DENT INTEGRITY ASSESSMENT MODEL Brock Bolton 1, Vlado Semiga
IDE 110 Mechanics of Materials Spring 2006 Final Examination FOR GRADING ONLY
 Spring 2006 Final Examination STUDENT S NAME (please print) STUDENT S SIGNATURE STUDENT NUMBER IDE 110 CLASS SECTION INSTRUCTOR S NAME Do not turn this page until instructed to start. Write your name on
Earthquake-resistant design of indeterminate reinforced-concrete slender column elements
 Engineering Structures 29 (2007) 163 175 www.elsevier.com/locate/engstruct Earthquake-resistant design of indeterminate reinforced-concrete slender column elements Gerasimos M. Kotsovos a, Christos Zeris
Mechanics of Materials
 Mechanics of Materials Notation: a = acceleration = area (net = with holes, bearing = in contact, etc...) SD = allowable stress design d = diameter of a hole = calculus symbol for differentiation e = change
RESPONSE OF STEEL BURIED PIPELINES TO THREE-DIMENSIONAL FAULT MOVEMENTS BY CONSIDERING MATERIAL AND GEOMETRICAL NON-LINEARITIES
 3 th World Conference on Earthquake Engineering Vancouver, B.C., Canada August -6, 24 Paper No. 694 RESPONSE OF STEEL BURIED PIPELINES TO THREE-DIMENSIONAL FAULT MOVEMENTS BY CONSIDERING MATERIAL AND GEOMETRICAL
Module 5: Failure Criteria of Rock and Rock masses. Contents Hydrostatic compression Deviatoric compression
 FAILURE CRITERIA OF ROCK AND ROCK MASSES Contents 5.1 Failure in rocks 5.1.1 Hydrostatic compression 5.1.2 Deviatoric compression 5.1.3 Effect of confining pressure 5.2 Failure modes in rocks 5.3 Complete
QUESTION BANK DEPARTMENT: CIVIL SEMESTER: III SUBJECT CODE: CE2201 SUBJECT NAME: MECHANICS OF SOLIDS UNIT 1- STRESS AND STRAIN PART A
 DEPARTMENT: CIVIL SUBJECT CODE: CE2201 QUESTION BANK SEMESTER: III SUBJECT NAME: MECHANICS OF SOLIDS UNIT 1- STRESS AND STRAIN PART A (2 Marks) 1. Define longitudinal strain and lateral strain. 2. State
Experimental Study and Numerical Simulation on Steel Plate Girders With Deep Section
 6 th International Conference on Advances in Experimental Structural Engineering 11 th International Workshop on Advanced Smart Materials and Smart Structures Technology August 1-2, 2015, University of
2. Rigid bar ABC supports a weight of W = 50 kn. Bar ABC is pinned at A and supported at B by rod (1). What is the axial force in rod (1)?
. What is the axial force in rod (1)?") IDE 110 S08 Test 1 Name: 1. Determine the internal axial forces in segments (1), (2) and (3). (a) N 1 = kn (b) N 2 = kn (c) N 3 = kn 2. Rigid bar ABC supports a weight of W = 50 kn. Bar ABC is pinned at
IDE 110 S08 Test 1 Name: 1. Determine the internal axial forces in segments (1), (2) and (3). (a) N 1 = kn (b) N 2 = kn (c) N 3 = kn 2. Rigid bar ABC supports a weight of W = 50 kn. Bar ABC is pinned at
CHAPTER 2 Failure/Fracture Criterion
 (11) CHAPTER 2 Failure/Fracture Criterion (12) Failure (Yield) Criteria for Ductile Materials under Plane Stress Designer engineer: 1- Analysis of loading (for simple geometry using what you learn here
The subject of this paper is the development of a design
 The erformance and Design Checking of Chord-Angle Legs in Joist Girders THEODORE V. GALAMBOS ABSTRACT The subject of this paper is the development of a design checking method for the capacity of the outstanding
Structural Metals Lab 1.2. Torsion Testing of Structural Metals. Standards ASTM E143: Shear Modulus at Room Temperature
 Torsion Testing of Structural Metals Standards ASTM E143: Shear Modulus at Room Temperature Purpose To determine the shear modulus of structural metals Equipment Tinius-Olsen Lo-Torq Torsion Machine (figure
Cite this paper as follows:
 Cite this paper as follows: Naughton P.J. and O Kelly B.C. 2001. An overview of the University College Dublin hollow cylinder apparatus. Proceedings of the 14th Young European Geotechnical Engineer s Conference,
SUBASSEMBLAGE TESTING OF STAR SEISMIC BUCKLING-RESTRAINED BRACES
 STRUCTURAL SYSTEMS RESEARCH PROJECT Report No. TR-23/4 SUBASSEMBLAGE TESTING OF STAR SEISMIC BUCKLING-RESTRAINED BRACES by STEVE MERRITT CHIA-MING UANG GIANMARIO BENZONI Final Report to Star Seismic, LLC.
A UNIQUE PIPELINE FAULT CROSSING DESIGN FOR A HIGHLY FOCUSED FAULT
 Proceedings of IPC 2004 International Pipeline Conference October 4-8, 2004 Calgary, Alberta, Canada IPC04-0102 A UNIQUE PIPELINE FAULT CROSSING DESIGN FOR A HIGHLY FOCUSED FAULT James D. Hart President
Behavior of full scale concrete segmented pipelines under permanent ground displacements
 Behavior of full scale concrete segmented pipelines under permanent ground displacements Junhee Kim a, Sean O Connor a, Sid Nadukuru a, Jerome P. Lynch* a, Radoslaw Michalowski a, Russell A. Green b, Mohammed
This procedure covers the determination of the moment of inertia about the neutral axis.
 327 Sample Problems Problem 16.1 The moment of inertia about the neutral axis for the T-beam shown is most nearly (A) 36 in 4 (C) 236 in 4 (B) 136 in 4 (D) 736 in 4 This procedure covers the determination
Effective stress analysis of pile foundations in liquefiable soil
 Effective stress analysis of pile foundations in liquefiable soil H. J. Bowen, M. Cubrinovski University of Canterbury, Christchurch, New Zealand. M. E. Jacka Tonkin and Taylor Ltd., Christchurch, New
BioMechanics and BioMaterials Lab (BME 541) Experiment #5 Mechanical Prosperities of Biomaterials Tensile Test
 Experiment #5 Mechanical Prosperities of Biomaterials Tensile Test") BioMechanics and BioMaterials Lab (BME 541) Experiment #5 Mechanical Prosperities of Biomaterials Tensile Test Objectives 1. To be familiar with the material testing machine(810le4) and provide a practical
BioMechanics and BioMaterials Lab (BME 541) Experiment #5 Mechanical Prosperities of Biomaterials Tensile Test Objectives 1. To be familiar with the material testing machine(810le4) and provide a practical
Experimental investigation on monotonic performance of steel curved knee braces for weld-free beam-to-column connections
 Experimental investigation on monotonic performance of steel curved knee braces for weld-free beam-to-column connections *Zeyu Zhou 1) Bo Ye 2) and Yiyi Chen 3) 1), 2), 3) State Key Laboratory of Disaster
Supplementary Uniaxial Compressive Strength Testing of DGR-3 and DGR-4 Core
 Technical Report Title: Document ID: Authors: Supplementary Uniaxial Compressive Strength Testing of DGR-3 and DGR-4 Core TR-08-39 B. Gorski, T. Anderson and D. Rodgers CANMET Mining and Mineral Sciences
QUESTION BANK SEMESTER: III SUBJECT NAME: MECHANICS OF SOLIDS
 QUESTION BANK SEMESTER: III SUBJECT NAME: MECHANICS OF SOLIDS UNIT 1- STRESS AND STRAIN PART A (2 Marks) 1. Define longitudinal strain and lateral strain. 2. State Hooke s law. 3. Define modular ratio,
CHAPTER II EXPERIMENTAL INVESTIGATION
 CHAPTER II EXPERIMENTAL INVESTIGATION 2.1 SCOPE OF TESTING The objective of this research is to determine the force distribution between the column web and stiffener when the column flanges are subjected
Laboratory 4 Bending Test of Materials
 Department of Materials and Metallurgical Engineering Bangladesh University of Engineering Technology, Dhaka MME 222 Materials Testing Sessional.50 Credits Laboratory 4 Bending Test of Materials. Objective
Finite Element Modelling with Plastic Hinges
 01/02/2016 Marco Donà Finite Element Modelling with Plastic Hinges 1 Plastic hinge approach A plastic hinge represents a concentrated post-yield behaviour in one or more degrees of freedom. Hinges only
Downloaded from Downloaded from / 1
 PURWANCHAL UNIVERSITY III SEMESTER FINAL EXAMINATION-2002 LEVEL : B. E. (Civil) SUBJECT: BEG256CI, Strength of Material Full Marks: 80 TIME: 03:00 hrs Pass marks: 32 Candidates are required to give their
Appendix A: Laboratory Report Format
 Appendix A: Laboratory Report Format This appendix contains details on the format for formal written laboratory reports in the form of author's instructions. Author's Instructions for ME354 Formal Lababoratory
High Tech High Top Hat Technicians. An Introduction to Solid Mechanics. Is that supposed to bend there?
 High Tech High Top Hat Technicians An Introduction to Solid Mechanics Or Is that supposed to bend there? Why don't we fall through the floor? The power of any Spring is in the same proportion with the
KINGS COLLEGE OF ENGINEERING DEPARTMENT OF MECHANICAL ENGINEERING QUESTION BANK. Subject code/name: ME2254/STRENGTH OF MATERIALS Year/Sem:II / IV
 KINGS COLLEGE OF ENGINEERING DEPARTMENT OF MECHANICAL ENGINEERING QUESTION BANK Subject code/name: ME2254/STRENGTH OF MATERIALS Year/Sem:II / IV UNIT I STRESS, STRAIN DEFORMATION OF SOLIDS PART A (2 MARKS)
Entrance exam Master Course
 - 1 - Guidelines for completion of test: On each page, fill in your name and your application code Each question has four answers while only one answer is correct. o Marked correct answer means 4 points
Failure in Flexure. Introduction to Steel Design, Tensile Steel Members Modes of Failure & Effective Areas
 Introduction to Steel Design, Tensile Steel Members Modes of Failure & Effective Areas MORGAN STATE UNIVERSITY SCHOOL OF ARCHITECTURE AND PLANNING LECTURE VIII Dr. Jason E. Charalambides Failure in Flexure!
ENG1001 Engineering Design 1
 ENG1001 Engineering Design 1 Structure & Loads Determine forces that act on structures causing it to deform, bend, and stretch Forces push/pull on objects Structures are loaded by: > Dead loads permanent
Influence of Relative Compaction on Passive Resistance of Abutments with Mechanically Stabilized Earth (MSE) Wingwalls
 Wingwalls") Brigham Young University BYU ScholarsArchive All Theses and Dissertations 2010-08-11 Influence of Relative Compaction on Passive Resistance of Abutments with Mechanically Stabilized Earth (MSE) Wingwalls
Brigham Young University BYU ScholarsArchive All Theses and Dissertations 2010-08-11 Influence of Relative Compaction on Passive Resistance of Abutments with Mechanically Stabilized Earth (MSE) Wingwalls
An integrated approach to the design of high performance carbon fibre reinforced risers - from micro to macro - scale
 An integrated approach to the design of high performance carbon fibre reinforced risers - from micro to macro - scale Angelos Mintzas 1, Steve Hatton 1, Sarinova Simandjuntak 2, Andrew Little 2, Zhongyi
Theory at a Glance (for IES, GATE, PSU)
") 1. Stress and Strain Theory at a Glance (for IES, GATE, PSU) 1.1 Stress () When a material is subjected to an external force, a resisting force is set up within the component. The internal resistance force
1. Stress and Strain Theory at a Glance (for IES, GATE, PSU) 1.1 Stress () When a material is subjected to an external force, a resisting force is set up within the component. The internal resistance force
Strain Measurement Techniques for Composite Coupon Testing
 Strain Measurement Techniques for Composite Coupon Testing Introduction Characterization of the properties of anisotropic and inhomogeneous composite materials for use in demanding structural applications
Special edition paper
 Development of New Aseismatic Structure Using Escalators Kazunori Sasaki* Atsushi Hayashi* Hajime Yoshida** Toru Masuda* Aseismatic reinforcement work is often carried out in parallel with improvement
PERIYAR CENTENARY POLYTECHNIC COLLEGE PERIYAR NAGAR - VALLAM THANJAVUR. DEPARTMENT OF MECHANICAL ENGINEERING QUESTION BANK
 PERIYAR CENTENARY POLYTECHNIC COLLEGE PERIYAR NAGAR - VALLAM - 613 403 - THANJAVUR. DEPARTMENT OF MECHANICAL ENGINEERING QUESTION BANK Sub : Strength of Materials Year / Sem: II / III Sub Code : MEB 310
FINITE ELEMENT ANALYSIS OF ARKANSAS TEST SERIES PILE #2 USING OPENSEES (WITH LPILE COMPARISON)
") FINITE ELEMENT ANALYSIS OF ARKANSAS TEST SERIES PILE #2 USING OPENSEES (WITH LPILE COMPARISON) Ahmed Elgamal and Jinchi Lu October 07 Introduction In this study, we conduct a finite element simulation
FINITE ELEMENT ANALYSIS OF ARKANSAS TEST SERIES PILE #2 USING OPENSEES (WITH LPILE COMPARISON) Ahmed Elgamal and Jinchi Lu October 07 Introduction In this study, we conduct a finite element simulation
Brittle Deformation. Earth Structure (2 nd Edition), 2004 W.W. Norton & Co, New York Slide show by Ben van der Pluijm
, 2004 W.W. Norton & Co, New York Slide show by Ben van der Pluijm") Lecture 6 Brittle Deformation Earth Structure (2 nd Edition), 2004 W.W. Norton & Co, New York Slide show by Ben van der Pluijm WW Norton, unless noted otherwise Brittle deformation EarthStructure (2 nd
Lecture 6 Brittle Deformation Earth Structure (2 nd Edition), 2004 W.W. Norton & Co, New York Slide show by Ben van der Pluijm WW Norton, unless noted otherwise Brittle deformation EarthStructure (2 nd
PERFORMANCE OF A PIPELINE AT A FAULT CROSSING. Abstract
 PERFORMANCE OF A PIPELINE AT A FAULT CROSSING John M. Eidinger 1, Michael O Rourke 2, Jeff Bachhuber 3 Abstract The 1999 Izmit (Turkey) earthquake subjected a number of welded steel pipelines to fault
Spherical Pressure Vessels
 Spherical Pressure Vessels Pressure vessels are closed structures containing liquids or gases under essure. Examples include tanks, pipes, essurized cabins, etc. Shell structures : When essure vessels
ME Final Exam. PROBLEM NO. 4 Part A (2 points max.) M (x) y. z (neutral axis) beam cross-sec+on. 20 kip ft. 0.2 ft. 10 ft. 0.1 ft.
 M (x) y. z (neutral axis) beam cross-sec+on. 20 kip ft. 0.2 ft. 10 ft. 0.1 ft.") ME 323 - Final Exam Name December 15, 2015 Instructor (circle) PROEM NO. 4 Part A (2 points max.) Krousgrill 11:30AM-12:20PM Ghosh 2:30-3:20PM Gonzalez 12:30-1:20PM Zhao 4:30-5:20PM M (x) y 20 kip ft 0.2
ME 323 - Final Exam Name December 15, 2015 Instructor (circle) PROEM NO. 4 Part A (2 points max.) Krousgrill 11:30AM-12:20PM Ghosh 2:30-3:20PM Gonzalez 12:30-1:20PM Zhao 4:30-5:20PM M (x) y 20 kip ft 0.2
BIAXIAL STRENGTH INVESTIGATION OF CFRP COMPOSITE LAMINATES BY USING CRUCIFORM SPECIMENS
 BIAXIAL STRENGTH INVESTIGATION OF CFRP COMPOSITE LAMINATES BY USING CRUCIFORM SPECIMENS H. Kumazawa and T. Takatoya Airframes and Structures Group, Japan Aerospace Exploration Agency 6-13-1, Ohsawa, Mitaka,
STANDARD SAMPLE. Reduced section " Diameter. Diameter. 2" Gauge length. Radius
 MATERIAL PROPERTIES TENSILE MEASUREMENT F l l 0 A 0 F STANDARD SAMPLE Reduced section 2 " 1 4 0.505" Diameter 3 4 " Diameter 2" Gauge length 3 8 " Radius TYPICAL APPARATUS Load cell Extensometer Specimen
RESEARCH PROJECT NO. 26
 RESEARCH PROJECT NO. 26 DETERMINATION OF POISSON'S RATIO IN AD1 TESTING BY UNIVERSITY OF MICHIGAN REPORT PREPARED BY BELA V. KOVACS and JOHN R. KEOUGH \ MEMBER / / DUCTILE IRON \ SOCIETY Issued by the