Proceedings of the ASME th Joint US-European Fluids Engineering Division Summer Meeting FEDSM2014 August 3-7, 2014, Chicago, Illinois, USA
|
|
|
- Daniel Phelps
- 5 years ago
- Views:
Transcription
1 Proceedings of the ASME th Joint US-European Fluids Engineering Division Summer Meeting FEDSM2014 August 3-7, 2014, Chicago, Illinois, USA FEDSM EXPERIMENTAL AND NUMERICAL INVESTIGATION OF THE EFFECT OF VISCOSITY AND PARTICLE SIZE ON THE EROSION DAMAGE CAUSED BY SOLID PARTICLES A. Mansouri, S. A. Shirazi, B. S. McLaury Erosion/Corrosion Research Center The University of Tulsa 800 S Tucker Drive, Tulsa, OK, amir-mansouri@utulsa.edu ABSTRACT Oil and gas produced from wells usually contain impurities such as sand particles transported by fluid flowing through pipelines. The particles impinge on the pipe walls and fittings removing material from the wall and causes erosion damage. The effect of viscosity and particle size on the local thickness loss and total erosion ratio was investigated by conducting a comprehensive experimental study on the erosion of stainless steel 316 specimens caused by sand entrained in a submerged liquid jet. Two types of sand with sizes of 150 µm and 300 µm were used and added to liquids with 1, 14 and 55 cp viscosities. The tests were carried out for three different nozzle angles: 90 ⁰ (normal to target), 75 ⁰ and 45 ⁰. The results show that for the 90 ⁰ orientation, the total erosion ratio does not change significantly with increase in viscosity. The measurements also show that the erosion ratio for 300 µm sand is approximately two times higher than for 150 µm sand; where the erosion ratio is the mass loss of the target divided by the mass throughput of sand. The local thickness losses on the specimens were measured using a 3D profilometer, and the results show, maximum erosion depth is increasing as viscosity increases. Comparing the Scanning Electron Microscopy (SEM) images of the specimens after the test revealed that the crater sizes do not change very much with increases in viscosity. SEM images for both viscosities of 1 and 55 cp showed that the craters become longer moving radially outward from the the center of the impact zone. Computational Fluid Dynamics (CFD) simulations of erosion patterns are compared with data and they tend to under predict the total erosion ratio and local thickness loss for slurry flows as viscosity increases. NOMENCLATURE d p particle diameter, μm ER erosion ratio, kg/kg M sand sand rate, kg/s Re Reynolds number at the nozzle exit t test duration, second V f average fluid velocity at the nozzle exit, m/s W 1 coupon weight before the test, kg W 2 coupon weight after the test, kg z thickness loss from the coupon surface, μm θ impact angle (angle between nozzle and target surface), degree carrier fluid viscosity, cp μ f INTRODUCTION The erosion phenomenon is the consequence of repetitive impacts of sand particles transported by fluid flow through pipelines, with walls of fittings or other industrial equipment. In the oil and gas industry erosion damage causes leakage and abrupt failure of pipelines, bends and tees without prior warning, and can result in expensive repairs and loss of production time. Therefore, it is extremely crucial to predict the erosion rate and identify the location of the equipment which is most at risk. There are also other types of equipment for operations that involve small particles and consequently experience erosion problem, such as heat exchangers in fluidized bed combustors, steam-turbine blades in electric power generation plants and helicopter engine inlets and blades operating in sandy areas. For decades, significant research has been performed to understand the erosion mechanism and to 1 Copyright 2014 by ASME
![develop erosion models for predicting the erosion rate in various pipe fittings and multiphase production situations [1-3].](/docs-images/95/125808126/images/2-0.jpg "Modeling and prediction of erosion rate is very challenging, since many factors such as particle impact speed, particle impact angle, particle hardness, shape, diameter, strength and material")
2 develop erosion models for predicting the erosion rate in various pipe fittings and multiphase production situations [1-3]. Modeling and prediction of erosion rate is very challenging, since many factors such as particle impact speed, particle impact angle, particle hardness, shape, diameter, strength and material hardness affect the erosion process. Most of the previous studies of erosion rates were concerned with the effects of materials and particle characteristics including particle velocities and did not consider the effects of fluid medium. For example, Finnie [4] developed a theoretical erosion equation for vacuum conditions and proposed that the erosion mechanism for ductile material is micro-cutting, while material lost during erosion of brittle materials is as a result of lateral and radial cracks. Thereafter, numerous theoretical and empirical equations have been developed and reported in the literature. Bitter [5], Neilson and Gilchrist [6], McLaury et al. [7], Grant and Tabakoff [8], Huang et al. [9], Oka et al. [10] and Zhang et al [2] are among the erosion models most commonly reported in the literature which are either purely theoretical or empirical based but again they did not consider the effects of the fluid medium on the erosion process/models. Traditionally standard laboratory tests using a variety of testing devices Coriolis, slurry pot, toroid wheel, jet impingement or pipe loops have been used by researchers to study the erosion rate and develop empirical models [11]. Computational Fluid Dynamics (CFD) is another powerful tool for predicting particle impact velocity that is a common factor used to calculate erosion rates for different operating conditions and geometries. CFD simulations have been widely used to study the erosion rate, but CFD results must be validated by experimental data before they can be used to predict erosion rates accurately. It has been shown that erosion equations developed from either theory or experimental data can be implemented into CFD codes, and in some cases relatively good agreement between the CFD results and erosion measurements for simple geometries has been observed [2, 11, 12]. For instance, Zhang et al. utilized an erosion ratio equation extracted from erosion tests in air, in a commercially available code to predict erosion rates in gas and water. Relatively good agreement was observed between the experimental measurements and CFD results for flat specimens in water or air flow and 90º elbows in air flow. There are a few studies of wear pattern which are limited to water flows [12-14]. Previously, in order to study the effect of viscosity on erosion damage, Okita, et al. [15] measured the total erosion ratio caused by sand particles transported by liquids with various viscosities and compared to CFD results. The results showed that CFD calculations deviate from experimental measurements as viscosity increases. Nidasanametla [16] also measured the erosion damage caused by glass beads instead of sand particles. Glass beads are rounded and produce less damage compared to sand particles which have angular shapes. Similar to Okita s work, Nidasanametla also indicated that CFD results tend to under predict the erosion ratio as compared to experimental results, but the effect of viscosity on the particle impact speed and angle and consequently the local thickness loss has not been studied in the literature. In this study, the influence of carrier fluid viscosity on erosion damage is investigated experimentally and numerically. EXPERIMENTATION In order to improve the understanding of slurry erosion, a comprehensive experimental study on erosion caused by sand entrained in a submerged impinging jet was performed. The schematic of the flow loop is shown in Figure 1. A series of tests were conducted and total erosion ratio and local thickness loss (wear pattern) of the stainless steel (SS316) samples were measured. Two types of sand were used: Oklahoma #1 and California 60 with average sizes of 150 μm and 300 μm. The sand particles were added to liquid with viscosities of 1, 14 and 55 cp. The viscous liquid is prepared in a reservoir tank prior to experiments by mixing CMC (Carboxymethyl Cellulose) and water. CMC increases the viscosity of the liquid without a significant change in the density. Viscosity of the carrier fluid was measured by a vibrational viscometer before and after each test. Then, sand particles were mixed with the solution prepared for the desired viscosity in the reservoir tank. During the experiment, a slurry mixer was used to prevent the settling of the sand particles and maintaining the homogeneity of the mixture. Two pumps were used to maintain an average nozzle exit velocity of 14 m/s during the experiment. Pumps By Pass Valve Slurry Mixer Figure 1. Schematic of Experimental Facility (Submerged Impinging Jet Test). The prepared sand concentration inside the reservoir tank measured by weight was 1%; however, the actual sand concentration measured at the nozzle exit (by passing the mixture through a filter) was less than the sand concentration inside the tank. The sand concentration measured at the nozzle exit was used in the erosion ratio calculations. The total erosion ratio ER is obtained from Eqn. 1. kg W2 W1 ER( ) (1) kg M t sand Nozzle Coupon Reservoir Tank Where, W 1 (kg) and W 2 (kg) are the weight of the coupon before and after the erosion test, respectively. 2 Copyright 2014 by ASME
3 M sand (kg/s) is the sand rate and t (s) represents the duration of the test. The inner diameter of the nozzle used in the test loop was 8 mm, and the distance between the nozzle and coupon was 12.7 mm for all tests. In order to obtain measurable local erosion depth and total erosion ratio for all the tests, each test was performed for 6 hours. The key parameters in the experiments are summarized in Table 1. Figure 2 illustrates the effect of sand size on the erosion ratio, which indicates that the erosion ratio caused by 300 μm sand is approximately twice as high as that for 150 μm sand particles. The results also show that the erosion ratio does not change significantly as viscosity increases. For the results shown in Figure 2 the angle between the nozzle and target surface is maintained at 90º. Table 1. Key Parameters in experimental conditions Volumetric flow rate m 3 /s Average nozzle exit velocity (V f ) 14 m/s Nozzle diameter Nozzle-coupon distance 8 mm 12.7 mm Sand concentration in reservoir tank 1% Sand concentration at nozzle exit 0.5%±0.1 Impact angle (θ) Sand size (d p ) 90, 75 and 45 deg 150, 300 μm Coupon material Stainless Steel 316 Carrier fluid viscosity (μ f ) Test duration (t) 1, 14 and 55 cp 6 hours Based on the results shown in Figure 3, there is no significant difference between the erosion ratio measured for nozzle angles of 75º and 90º, but in the case of 45º, the erosion ratio decreases as viscosity increases. In addition to total erosion ratio calculated by measuring the total mass loss, local erosion depth (wear pattern) was also measured using a 3D profilometer instrument. A sample 3D scan of the specimen after an erosion test is shown in Figure 4. As the slurry flow reaches the target wall, the carrier fluid velocity reduces to zero at the wall. Since the carrier fluid velocity and consequently particle impact speed significantly decrease in this zone, less erosion is observed in this zone which is the called stagnation zone. As shown in Figure 5, after the stagnation zone, the fluid flow and particle impact speed increase and produce a highly eroded zone which is shown in Figure 4. There is also a slight thickness loss on the surface of target material, outside of the highly eroded zone which is marked in Figure 4. A symmetrical wear pattern is expected for normal impingement, but profilometry measurements show that the wear pattern on the specimen for some of the test conditions is not symmetrical (Figure 6). Two reasons might cause this non-symmetrical behavior: (1) small misalignment between the nozzle and specimen, (2) there is also swirling flow inside the nozzle which might be another reason for this behavior. Since studying the overall behavior of the radial erosion pattern is important, in this study a circumferential average of scanned profile every 5º is performed. This average profile for normal impingement, sand size of 300 μm and nozzle velocity of 14 m/s is plotted in Figure 7. As explained earlier, it is also assumed that the erosion depth at the stagnation point is nearly zero. This assumption is used for other results presented below. Error bars in this graph represent the variability of the erosion depths at different angles (as measurements for every 5 degrees are averaged). Figure 8 illustrates the effect of viscosity on the averaged erosion depths measured by 3D profilometry. It is expected that carrier fluids with higher viscosities exert higher drag forces on sand particles and reduce the particle impact speed and consequently cause less erosion damage. In despite of what is expected, the experimental results show that the maximum erosion depth for a carrier fluid with viscosity of 55 cp is higher than 1 cp (Figure 8). The reason for this observation can be explained by the difference in velocity profiles resulting from laminar and turbulent flows within the nozzle. In the case of higher viscosities, for the same average velocity of 14 m/s, the Reynolds number for flow in the nozzle reduces to 2100 which corresponds to laminar flow. For laminar flow at the nozzle exit, the velocity profile is parabolic, and this parabolic velocity profile contributes to higher sand particle speeds at the center of the nozzle which may cause higher impact speeds and consequently higher erosion depths for the case of higher viscosity carrier fluids. As mentioned earlier, one of the factors which can affect the erosion ratio is the particle size. In Figure 9, the effect of particle size on the thickness loss is investigated, and the results show that the maximum thickness loss for d p = 300 μm is approximately twice as high as the thickness loss caused by 150 μm sand particles. This confirms the ER results presented earlier in Figure 2. Erosion is a very complex phenomenon, and it is very important to obtain experimental results which are repeatable. To ensure the results are repeatable, each test is repeated two or three times. For instance, the repeatability of the wear pattern for θ=90º, d p =300 μm and μ f =1 cp is shown in Figure 10. This figure shows that the wear patterns for three different experimental tests with similar test condition are similar. Repeatable results are also obtained for θ=45º, d p =300 μm and μ f =1 cp which are shown in Figure 11. Because the wear patterns especially for non-normal impact angles are not symmetrical, it is better to examine the 3D contour of wear patterns, which are shown in Figure 12, Figure 12, Figure 13 and Figure 14 for different test conditions. The elevation of different zones (stagnation zone, highly eroded zone and coupon surface zone) is also shown in the figures. Comparing the wear pattern of μ f = 1 cp with μ f = 55 cp for normal impingement reveals that higher viscosities can cause higher thickness losses than water. As discussed earlier, the difference between the nozzle velocity profiles of laminar and turbulent flow is the reason of this observation. Wear patterns 3 Copyright 2014 by ASME


4 for θ=45º show that the stagnation point moves off the center of the coupon and oval-shaped profiles are produced. Instead of producing a highly eroded zone with circular shape, the eroded zone moves to the sides for θ=45º. Thickness loss also decreases for θ=45º compared to normal impingement. Stagnation Point Coupon Surface Highly Eroded Zone Figure 4. Different Zones of a Coupon Scanned After the Erosion Test Figure 2. Effect of Sand Size on Erosion Ratio Nozzle Stagnation Zone Highly Eroded Zone Figure 5. CFD Simulation of the Flow Field for the Submerged Impinging Jet Figure 3. Effect of Nozzle Angle on the Total Erosion Ratio Figure 6. Wear Pattern for Normal Impingement (μ f = 1 cp, d p =300 μm and V f =14 m/s) 4 Copyright 2014 by ASME
5 Figure 7. Circumferential Average of the Erosion Depth Profile Figure 10. Repeatability of Wear Profile (θ=90º, d P =300 μm) Viscosity increases Figure 11. Repeatability of Wear Profile (θ=45º, d P =300 μm) Figure 8. Effect of Viscosity on Erosion Depth (d P =300 μm, V f =14 m/s) Figure 9. Effect of Particle Size on Erosion Depth (μ f =1 cp, θ=90º) CFD SIMULATION CFD simulations have been performed for the same conditions as the measurements mentioned in Table 1. In the simulations, the length of the nozzle should be long enough to have a fully developed flow at the outlet of the nozzle. V f =14 m/s is used at the inlet of the nozzle for the inlet boundary condition. No-slip wall boundary condition is also imposed for the coupon surface and nozzle wall. For the cylinder surrounding the nozzle and coupon, a pressure outlet boundary condition is specified. The schematic of the computational domain is shown in Figure 16. The Shear- Stress Transport SST k-ω turbulence model is used for the simulations. In the simulations, the one-way coupling between the sand particles and carrier fluid is assumed, because in dilute suspensions sand particles slightly affect the fluid flow. But it is also worth mentioning that Matas et al. showed that suspended particles can influence the flow field and transition to turbulence [17]. The erosion equation used in this paper to predict erosion was generated at the Erosion/Corrosion Research Center of the University of Tulsa [2] and is provided in Eqns. (2-4): kg 0.59 n ER( ) Fs. C( BH ). V. F( ) (2) kg ( H ) BH V (3) 5 Copyright 2014 by ASME
 Z= 0 μm Z= -8.")

 (a). Top View, (b).")
 (a). Top View, (b).")


6 (a) (a) (b) Z= 0 μm Z= μm (b) Z= 0 μm Z= -8.6 μm Z= -166 μm Z= -118 μm Z= -198 μm Figure 12. Wear Pattern for (θ =90º, d P =300 μm and μ f = 1 cp) (a). Top View, (b). 3D Contour (a) Figure 14. Wear Pattern for (θ =90º, d P =300 μm and μ f = 55 cp) (a). Top View, (b). 3D Contour (a) (b) Z= 0 μm Z= 0 μm (b) Z= 0 μm Z= -27 μm Z= -87 μm Z= -129 μm Z= -84 μm Z= -90 μm Figure 13. Wear Pattern for (θ=45º, d P =300 μm and μ f = 1 cp) (a). Top View, (b). 3D Contour Figure 15. Wear Pattern for (θ =45º, d P =300 μm and μ f = 55 cp) (a). Top View, (b). 3D Contour 6 Copyright 2014 by ASME

 is the impact angle function.")

7 Table 2. Constants for Erosion Equation (Stainless Steel 316) Parameter Value C 1.42E-7 n 2.41 H V (GPa) 1.5 F s 1 A B C D -3.97E-5 E 5.14E-7 F -2.07E-9 Figure 16. The Direct Impinging Jet Geometry, Dimensions and Boundary Conditions Applied in CFD Simulation F s is the sharpness factor of the sand particles, which ranges from 0.2 to 1, but for this type of sand F s =1. BH is the Brinell hardness of the target material which is calculated by H V, Vicker s hardness. V is the particle impact speed and F(θ) is the impact angle function. For these simulations, a polynomial function is used for the particle impact angle function: A B C D E F (4) F( ) C and n are the empirical constants. The values for the constants in the erosion equation are shown in Table 2. The erosion patterns predicted by CFD simulation and measured by 3D profilometry are compared in Figure 19 and Figure 20. As experimental measurement show in the case of θ =90º, a ring of high erosion is generated which is also predicted by the CFD simulation. Figure 19 and Figure 20 show the predicted pattern and measured thickness loss, respectively for θ =45º. In this case, instead of a highly eroded ring, erosion depth increases on the sides of the center plane. As shown, in the case of θ =45º the CFD simulation also agrees well with the experimental data. Figure 21 shows the velocity profile at the jet exit for μ f =1 cp and μ f =55 cp. The results imply that μ f =55 cp leads to laminar flow and parabolic velocity profile at the jet exit. The higher velocities at the center of the jet exit, contributes to higher particle impact speeds and consequently higher erosion depth for the case of higher viscosity carrier fluids. Figure 22 compares the predicted total erosion ratio for μ f =1, 14 and 55 cp with experimental data. In agreement with literature [15, 16], CFD simulations of the present work also under predict the experimental data. This figure also shows that the velocity profile at the jet exit has an important effect on the total erosion ratio calculated by CFD For the CFD results mentioned in [14], [15] uniform velocity profile was assumed at the jet exit, while the current study reveals that solving the fluid flow inside the nozzle and obtaining a fully developed velocity profile at the jet exit can improve the erosion predictions. These results still indicate that CFD simulations predict that erosion rate and ratios are decreasing as fluid viscosity is increased, but the experimental data does not. This difference requires further research and investigation. Erosion rate (kg/m 2 s) Elevation (μm) Figure 17. Erosion Pattern Predicted by CFD Simulation (θ =90º, d P =300 μm and μ f = 1 cp) Figure 18. Thickness Loss Measured by 3D Profilometry (θ =90º, d P =300 μm and μ f = 1 cp) 7 Copyright 2014 by ASME
 Stagnation zone Highly eroded zone Figure 19.")
 Figure 21.")

8 Erosion rate (kg/m 2 s) Elevation (μm) MICROSTRUCTURE Post-test analysis of the coupon surface is performed to investigate the shape and size of the craters in different zones of the coupon. As mentioned earlier, three different zones in terms of thickness loss are produced on the target materials which are shown in Figure 23. Elevation (μm) Stagnation zone Highly eroded zone Figure 19. Erosion Pattern Predicted by CFD Simulation (θ =45º, d P =300 μm and μ f = 55 cp) Figure 20. Thickness Loss Measured by 3D profilometry (θ =45º, d P =300 μm and μ f = 55 cp) Coupon surface Figure 23. Different Zones Produced on Coupon Surface after Erosion Test (θ=90º, μ f =55 cp) Figure 21. Velocity Profile at the Jet exit (μ f =1 cp, μ f =55 cp) Electron Scanning Microscope (SEM) images of the coupon, near the center are shown in Figure 24 and Figure 27and which represent the stagnation zone. Comparing the images for viscosities of 1cP and 55cP reveals that in this region the crater sizes do not change very much with varying fluid viscosity. Figure 25 and Figure 28 are SEM images of the coupon 6 mm from the center representing the highly eroded zone. Figure 26 and Figure 29 are the images of the coupon far enough form the center of the coupon to be considered representative of the coupon surface region. Two points are concluded from the SEM images: (1) crater size and shape for the same distance from the center of the impact area are similar for various viscosities. (2) by moving far away from the center of the impact area, craters become longer and sharper in comparison to the craters caused by sand particles near the stagnation zone. Figure 22. Comparison of Erosion Ratio Predicted by CFD Simulation with Experimental Data 8 Copyright 2014 by ASME

 Figure 25.")
 Figure 28.")

 9")
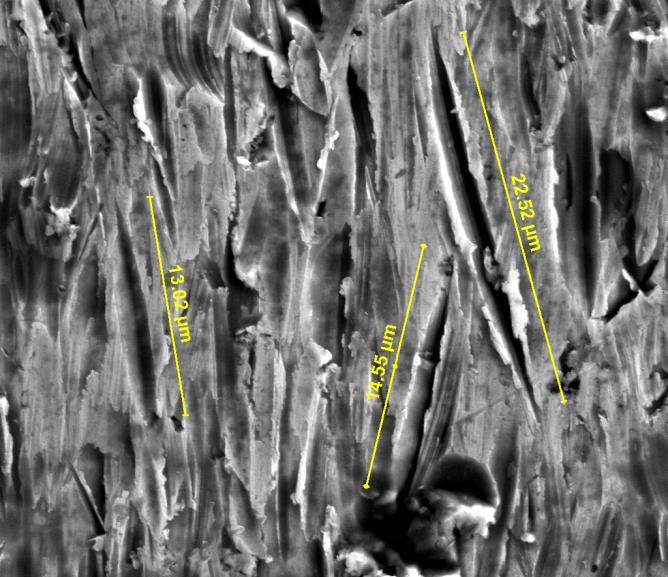
9 Figure 24. SEM Image of Coupon after the Erosion Test near the Center (Sand Size=150 μm, μ f = 1 cp) Figure 27. SEM Image of Coupon after the Erosion Test near the Center (Sand Size=150 μm, μ f = 55 cp) Figure 25. SEM Image of Coupon after the Erosion Test on 6 mm From the Center (Sand Size=150 μm, μ f =1cP) Figure 28. SEM Image of Coupon after the Erosion Test on 6 mm From the Center (Sand Size=150 μm, μ f =55cP) Figure 26. SEM Image of Coupon after the Erosion Test on 12 mm From the Center (Sand Size=150 μm, μ f = 1cP) Figure 29. SEM Image of Coupon after the Erosion Test on 12 mm From the Center (Sand Size=150 μm, μ f = 55 cp) 9 Copyright 2014 by ASME
10 CONCLUSIONS AND SUMMARY 1) A comprehensive experimental study of the influence of the carrier fluid viscosity and sand size on erosion damage is performed. It is found that increasing the viscosity does not have a significant effect on the total erosion ratio, while it increases the maximum erosion depth. Increasing the sand size also increases the erosion damage. 2) CFD simulations were conducted to predict the erosion ratio and erosion pattern for the same conditions that experimental tests were performed. It is shown that CFD simulations are capable of predicting the wear pattern for different impact angles (θ =45º, θ =90º), but CFD tends to under predict the total erosion ratio. It is also found that obtaining a fully developed velocity profile at the jet exit predicts the erosion ratio better, compared to assuming a uniform velocity profile at the jet exit. 3) Post-test analysis of the coupon surface reveals that crater size and shape for the same distance from the center of the impact area do not change for various viscosities. By moving far away from the center of the coupon, craters become longer and sharper as compared to the craters caused by sand impacts near the stagnation zone. ACKNOWLEDGMENTS The authors would like to thank Ed Bowers for his invaluable technical expertise. The authors wish to acknowledge financial support of many oil and gas and service companies that have supported E/CRC research for many years. REFERENCES [1] Chen, X., McLaury, B. S., and Shirazi, S. A., 2004, "Application and Experimental Validation of a Computational Fluid Dynamics (CFD)-Based Erosion Prediction Model in Elbows and Plugged Tees", Comput. Fluids, 33, [2] Zhang, Y., Reuterfors, E.P., McLaury, B.S., Shirazi, S.A., Rybicki, E.F., 2007, "Comparison of Computed and Measured Particle Velocities and Erosion in Water and Air Flows", Wear, 263. [3] Mazumder, Q., Shirazi, S., McLaury, B., Rybicki, E., Shadley, J., 2005, " Development and Validation of a Mechanistic Model to Predict Solid Particle Erosion in Multiphase Flow ", International Journal of Wear, 259, [4] Finnie, I., 1972, "Some Observations on the Erosion of Ductile Materials", Wear, 19. [5] Bitter, J.G.A., 1963, "A Study of Erosion Phenomena Part I", Wear, 6. [6] Neilson, J.H., Gilchrist, A., 1968, "Erosion by a Stream of Solid Particles", Wear, 11. [7] McLaury, B.S., Shirazi, S.A., Shadley, J.R., Rybicki, E.F., 1996, "Modeling Erosion in Chokes", ASME Fluids Engineering, 236(1). [8] Grant, G., Tabakoff, W., 1973, "An Experimental Investigation of the Erosive Characteristics of 2024 Aluminium Alloy", Wear. [9] Huang, C., Chiovelli, S., Minev, P., Luo, J., Nandakumar, K., 2008, "A Comperhensive Phenomenological Model for Erosion of Materials in Jet Flow", Powder Technology, 187(3). [10] Oka, Y.I., Okamura, K., and Yoshida, T., 2005, "Practical Estimation of Erosion Damage Caused by Solid Particle Impact, Part 1: Effects of Impact Parameters on a Predictive Equation", Wear, 259. [11] Gnanavelu, A., Kapur, N., Neville, A., Flores, J.F., 2009, "An Integrated Methodology for Predicting Material Wear Rates Due to Erosion", Wear, 267. [12] Gnanavelu, A., Kapur, N., Neville A., Flores J.F., Ghorbani, N., 2011, "A Numerical Investigation of a Geometry Independent Integrated Method to Predict Erosion Rates in Slurry Erosion", Wear, 271. [13] Wang, M.H., Huang, C., Nandakumar, K., Minev, P., Luo, J., Chiovelli, S., 2009, "Computational Fluid Dynamics Modeling and Experimental Study of Erosion in Slurry Jet Flows", International Journal of Computational Fluid Dynamics, 23(2). [14] Benchaita, M.T., Griffith, P., Rabinowicz, E., 1983, "Erosion of Metallic Plate by Solid Particles entrained in a liquid jet", ASME, 153(8). [15] Okita, R., 2010, "Effect of Viscosity and Particle Size on Erosion Measurements and Predictions", Masters of Science Thesis, The University of Tulsa. [16] Nidasanametla, A. S., 2012, "Effects of viscosity, Particle Size and Shape on Erosion Measurements and Predictions", Masters of Science Thesis, The University of Tulsa. [17] Matas, J. P., Morris, J. F., Guazzelli, E., 2003, "Transition to Turbulence in Particulate Pipe Flow", Physical Review Letters, (90). 10 Copyright 2014 by ASME
T H E U N I V E R S I T Y O F T U L S A THE GRADUATE SCHOOL A COMBINED CFD-EXPERIMENTAL METHOD FOR DEVELOPING AN
 T H E U N I V E R S I T Y O F T U L S A THE GRADUATE SCHOOL A COMBINED CFD-EXPERIMENTAL METHOD FOR DEVELOPING AN EROSION EQUATION FOR BOTH GAS-SAND AND LIQUID-SAND FLOWS by Amir Mansouri A dissertation
PARTICLE TRACKING VELOCIMETRY (PTV) MEASUREMENT OF ABRASIVE MICROPARTICLE IMPACT SPEED AND ANGLE IN BOTH AIR-SAND AND SLURRY EROSION TESTERS
 MEASUREMENT OF ABRASIVE MICROPARTICLE IMPACT SPEED AND ANGLE IN BOTH AIR-SAND AND SLURRY EROSION TESTERS") Proceedings of the ASME 2016 Fluids Engineering Division Summer Meeting FEDSM2016 July 10-14, 2016, Washington, DC, USA FEDSM2016-7768 PARTICLE TRACKING VELOCIMETRY (PTV) MEASUREMENT OF ABRASIVE MICROPARTICLE
Proceedings of the ASME 2016 Fluids Engineering Division Summer Meeting FEDSM2016 July 10-14, 2016, Washington, DC, USA FEDSM2016-7768 PARTICLE TRACKING VELOCIMETRY (PTV) MEASUREMENT OF ABRASIVE MICROPARTICLE
EXECUTIVE SUMMARY EXECUTIVE SUMMARY OF PROGRESS
 ES-1 EXECUTIVE SUMMARY OF PROGRESS The following is the executive summary of progress and/or presentations at the E/CRC meeting. Research Approach: Dr. Siamack A. Shirazi E/CRC has developed Erosion and
T H E U N I V E R S I T Y O F T U L S A THE GRADUATE SCHOOL AND PREDICTIONS. by Risa Okita. A thesis submitted in partial fulfillment of
 T H E U N I V E R S I T Y O F T U L S A THE GRADUATE SCHOOL EFFECTS OF VISCOSITY AND PARTICLE SIZE ON EROSION MEASUREMENTS AND PREDICTIONS by Risa Okita A thesis submitted in partial fulfillment of the
Solid Particle Erosion in Slug Flow. Introduction
 EROSION IN SLUG FLOW Solid Particle Erosion in Slug Flow Introduction Sand produced by oil and gas producers creates many problems such as accumulation of the sand in perforation tunnels, lines and pumps;
THE UNIVERSITY OF TULSA THE GRADUATE SCHOOL APPLICATION OF COMPUTATIONAL FLUID DYNAMICS (CFD) TO FLOW
 TO FLOW") THE UNIVERSITY OF TULSA THE GRADUATE SCHOOL APPLICATION OF COMPUTATIONAL FLUID DYNAMICS (CFD) TO FLOW SIMULATION AND EROSION PREDICTION IN SINGLE-PHASE AND MULTIPHASE FLOW by Xianghui Chen A dissertation
THE UNIVERSITY OF TULSA THE GRADUATE SCHOOL APPLICATION OF COMPUTATIONAL FLUID DYNAMICS (CFD) TO FLOW SIMULATION AND EROSION PREDICTION IN SINGLE-PHASE AND MULTIPHASE FLOW by Xianghui Chen A dissertation
VALIDATION AND IMPROVEMENT OF SPPS IN LOW LIQUID LOADING AND ANNULAR FLOW
 VIII-1 VIII. VALIDATION AND IMPROVEMENT OF SPPS IN LOW LIQUID LOADING AND ANNULAR FLOW Introduction Solid particle erosion of piping and fittings is caused as a result of entrained sand particles in the
SLURRY EROSION IN COMPLEX FLOWS: EXPERIMENT AND CFD
 Seventh International Conference on CFD in the Minerals and Process Industries CSIRO, Melbourne, Australia 9-11 December 009 SLURRY EROSION IN COMPLEX FLOWS: EXPERIMENT AND CFD L.J.W. GRAHAM, D. LESTER
Literature review relevant to particle erosion in complex geometries
 Journal of Physics: Conference Series PAPER OPEN ACCESS Literature review relevant to particle erosion in complex geometries To cite this article: Eirik Volent and Ole Gunnar Dahlhaug 2018 J. Phys.: Conf.
Optimization of the nozzles structure in gas well
 International Forum on Energy, Environment Science and Materials (IFEESM 2017) Optimization of the nozzles structure in gas well Zuwen WANG1, a, Shasha WANG2,b Yihua DOU3,c and Zhiguo WANG4,d 1 CNPC Chuanqing
Numerical simulation of predicting and reducing solid particle erosion of solid-liquid two-phase flow in a choke
 Pet.Sci.(9)6:9-97 DOI.7/s8-9-7-9 9 Numerical simulation of predicting and reducing solid particle erosion of solid-liquid two-phase flow in a choke Li Guomei,, Wang Yueshe, He Renyang, Cao Xuewen 3, Lin
Outlines. simple relations of fluid dynamics Boundary layer analysis. Important for basic understanding of convection heat transfer
 Forced Convection Outlines To examine the methods of calculating convection heat transfer (particularly, the ways of predicting the value of convection heat transfer coefficient, h) Convection heat transfer
Part A: 1 pts each, 10 pts total, no partial credit.
 Part A: 1 pts each, 10 pts total, no partial credit. 1) (Correct: 1 pt/ Wrong: -3 pts). The sum of static, dynamic, and hydrostatic pressures is constant when flow is steady, irrotational, incompressible,
Piping Systems and Flow Analysis (Chapter 3)
") Piping Systems and Flow Analysis (Chapter 3) 2 Learning Outcomes (Chapter 3) Losses in Piping Systems Major losses Minor losses Pipe Networks Pipes in series Pipes in parallel Manifolds and Distribution
Piping Systems and Flow Analysis (Chapter 3) 2 Learning Outcomes (Chapter 3) Losses in Piping Systems Major losses Minor losses Pipe Networks Pipes in series Pipes in parallel Manifolds and Distribution
Applied Fluid Mechanics
 Applied Fluid Mechanics 1. The Nature of Fluid and the Study of Fluid Mechanics 2. Viscosity of Fluid 3. Pressure Measurement 4. Forces Due to Static Fluid 5. Buoyancy and Stability 6. Flow of Fluid and
FE Fluids Review March 23, 2012 Steve Burian (Civil & Environmental Engineering)
") Topic: Fluid Properties 1. If 6 m 3 of oil weighs 47 kn, calculate its specific weight, density, and specific gravity. 2. 10.0 L of an incompressible liquid exert a force of 20 N at the earth s surface.
Topic: Fluid Properties 1. If 6 m 3 of oil weighs 47 kn, calculate its specific weight, density, and specific gravity. 2. 10.0 L of an incompressible liquid exert a force of 20 N at the earth s surface.
Water Circuit Lab. The pressure drop along a straight pipe segment can be calculated using the following set of equations:
 Water Circuit Lab When a fluid flows in a conduit, there is friction between the flowing fluid and the pipe walls. The result of this friction is a net loss of energy in the flowing fluid. The fluid pressure
EROSION ANALYSIS FOR THE MISALIGNED U2 NOZZLE AND ITS CONNECTOR BLOCK
 WSRC-TR-2002-00352 EROSION ANALYSIS FOR THE MISALIGNED U2 NOZZLE AND ITS CONNECTOR BLOCK Si Young Lee and Richard A. Dimenna Westinghouse Savannah River Company Savannah River Site Aiken, SC 29808 Prepared
6th European Sand Management Forum, March 2014, Aberdeen
 6th European Sand Management Forum, 26-27 March 2014, Aberdeen Erosion Management- Using Erosion Testing Combined with Erosion Modelling John Peters, NEL, UK NEL Holds UK National Standards for fluid flow
Figure 3: Problem 7. (a) 0.9 m (b) 1.8 m (c) 2.7 m (d) 3.6 m
 0.9 m (b) 1.8 m (c) 2.7 m (d) 3.6 m") 1. For the manometer shown in figure 1, if the absolute pressure at point A is 1.013 10 5 Pa, the absolute pressure at point B is (ρ water =10 3 kg/m 3, ρ Hg =13.56 10 3 kg/m 3, ρ oil = 800kg/m 3 ): (a)
1. For the manometer shown in figure 1, if the absolute pressure at point A is 1.013 10 5 Pa, the absolute pressure at point B is (ρ water =10 3 kg/m 3, ρ Hg =13.56 10 3 kg/m 3, ρ oil = 800kg/m 3 ): (a)
SPPS USER Manual 1 SPPS USER GUIDE DRAFT VERSION 6/20/2011. Please send comments to
 SPPS USER Manual 1 SPPS USER GUIDE DRAFT VERSION 6/20/2011 Please send comments to Brenton S. McLaury or Siamack A. Shirazi brenton-mclaury@utulsa.edu, siamack-shirazi@utulsa.edu THE EROSION/CORROSION
Lesson 6 Review of fundamentals: Fluid flow
 Lesson 6 Review of fundamentals: Fluid flow The specific objective of this lesson is to conduct a brief review of the fundamentals of fluid flow and present: A general equation for conservation of mass
CFD Simulation of Turbulent Flow Structure in Stratified Gas/Liquid Flow and Validation with Experimental Data
 SPE-174964-MS CFD Simulation of Turbulent Flow Structure in Stratified Gas/Liquid Flow and Validation with Experimental Data Ramin Dabirian, Amir Mansouri, Ram Mohan, and Ovadia Shoham, The University
Chapter 6 Pneumatic Transport
 Chapter 6 Pneumatic Transport 6.1 Pneumatic Transport Use of a gas to transport a particulate solid through pipeline Powder Rotary valve Blower Three major variables for pneumatic conveying - solid mass
Chapter 8: Flow in Pipes
 Objectives 1. Have a deeper understanding of laminar and turbulent flow in pipes and the analysis of fully developed flow 2. Calculate the major and minor losses associated with pipe flow in piping networks
MECHANICS OF EROSION. Shreyansh Patel. Northeastern University. 360 Huntington Avenue, Boston, MA
 Mechanics of Contact and Lubrication, ME5656 Department of Mechanical & Industrial Engineering Northeastern University Fall 009 MECHANICS OF EROSION Shreyansh Patel Northeastern University 360 Huntington
Consider a control volume in the form of a straight section of a streamtube ABCD.
 6 MOMENTUM EQUATION 6.1 Momentum and Fluid Flow In mechanics, the momentum of a particle or object is defined as the product of its mass m and its velocity v: Momentum = mv The particles of a fluid stream
Reynolds, an engineering professor in early 1880 demonstrated two different types of flow through an experiment:
 7 STEADY FLOW IN PIPES 7.1 Reynolds Number Reynolds, an engineering professor in early 1880 demonstrated two different types of flow through an experiment: Laminar flow Turbulent flow Reynolds apparatus
D.R. Rector, M.L. Stewart and A.P. Poloski Pacific Northwest National Laboratory P.O. Box 999, Richland, WA
 Modeling of Sediment Bed Behavior for Critical Velocity in Horizontal Piping 9263 D.R. Rector, M.L. Stewart and A.P. Poloski Pacific Northwest National Laboratory P.O. Box 999, Richland, WA ABSTRACT A
1. Starting of a project and entering of basic initial data.
 PROGRAM VISIMIX TURBULENT SV. Example 1. Contents. 1. Starting of a project and entering of basic initial data. 1.1. Opening a Project. 1.2. Entering dimensions of the tank. 1.3. Entering baffles. 1.4.
Applied Fluid Mechanics
 Applied Fluid Mechanics 1. The Nature of Fluid and the Study of Fluid Mechanics 2. Viscosity of Fluid 3. Pressure Measurement 4. Forces Due to Static Fluid 5. Buoyancy and Stability 6. Flow of Fluid and
ABSTRACT I. INTRODUCTION
 2016 IJSRSET Volume 2 Issue 4 Print ISSN : 2395-1990 Online ISSN : 2394-4099 Themed Section: Engineering and Technology Analysis of Compressible Effect in the Flow Metering By Orifice Plate Using Prasanna
2 Navier-Stokes Equations
 1 Integral analysis 1. Water enters a pipe bend horizontally with a uniform velocity, u 1 = 5 m/s. The pipe is bended at 90 so that the water leaves it vertically downwards. The input diameter d 1 = 0.1
CVE 372 HYDROMECHANICS EXERCISE PROBLEMS
 VE 37 HYDROMEHNIS EXERISE PROLEMS 1. pump that has the characteristic curve shown in the accompanying graph is to be installed in the system shown. What will be the discharge of water in the system? Take
Chapter Four fluid flow mass, energy, Bernoulli and momentum
 4-1Conservation of Mass Principle Consider a control volume of arbitrary shape, as shown in Fig (4-1). Figure (4-1): the differential control volume and differential control volume (Total mass entering
EXPERIMENT No.1 FLOW MEASUREMENT BY ORIFICEMETER
 EXPERIMENT No.1 FLOW MEASUREMENT BY ORIFICEMETER 1.1 AIM: To determine the co-efficient of discharge of the orifice meter 1.2 EQUIPMENTS REQUIRED: Orifice meter test rig, Stopwatch 1.3 PREPARATION 1.3.1
FLOW MEASUREMENT. INC 102 Fundamental of Instrumentation and Process Control 2/2560
 FLOW MEASUREMENT INC 102 Fundamental of Instrumentation and Process Control 2/2560 TABLE OF CONTENTS A. INTRODUCTION B. LOCAL FLOW MEASUREMENT B.1 Particle Image Velocimetry (PIV) B.2 Laser doppler anemometry
FLUID MECHANICS D203 SAE SOLUTIONS TUTORIAL 2 APPLICATIONS OF BERNOULLI SELF ASSESSMENT EXERCISE 1
 FLUID MECHANICS D203 SAE SOLUTIONS TUTORIAL 2 APPLICATIONS OF BERNOULLI SELF ASSESSMENT EXERCISE 1 1. A pipe 100 mm bore diameter carries oil of density 900 kg/m3 at a rate of 4 kg/s. The pipe reduces
Chapter 6 Pneumatic Transport and Standpipes
 Chapter 6 Pneumatic Transport and Standpipes 6.1 Pneumatic Transport Use of a gas to transport a particulate solid through pipeline Powder Rotary valve Blower Three major variables for pneumatic conveying
Applied Fluid Mechanics
 Applied Fluid Mechanics 1. The Nature of Fluid and the Study of Fluid Mechanics 2. Viscosity of Fluid 3. Pressure Measurement 4. Forces Due to Static Fluid 5. Buoyancy and Stability 6. Flow of Fluid and
IHTC DRAFT MEASUREMENT OF LIQUID FILM THICKNESS IN MICRO TUBE ANNULAR FLOW
 DRAFT Proceedings of the 14 th International Heat Transfer Conference IHTC14 August 8-13, 2010, Washington D.C., USA IHTC14-23176 MEASUREMENT OF LIQUID FILM THICKNESS IN MICRO TUBE ANNULAR FLOW Hiroshi
Slurry Pump Mixing Effectiveness in Tank 50H
 WSRC-STI-2008-00151 Si Young Lee and Richard A. Dimenna February 2008 Washington Savannah River Company Savannah River National Laboratory Aiken, SC 29808 Prepared for the U.S. Department of Energy Under
Investigation of Jet Impingement on Flat Plate Using Triangular and Trapezoid Vortex Generators
 ISSN 2395-1621 Investigation of Jet Impingement on Flat Plate Using Triangular and Trapezoid Vortex Generators #1 Sonali S Nagawade, #2 Prof. S Y Bhosale, #3 Prof. N K Chougule 1 Sonalinagawade1@gmail.com
Numerical Simulation of Downhole Completion Equipment via Computational Fluid Dynamics
 , pp.48-52 http://dx.doi.org/10.14257/astl.2014.63.10 Numerical Simulation of Downhole Completion Equipment via Computational Fluid Dynamics Chao Zheng, Yonghong Liu*, Hanxiang Wang, Renjie Ji, Zengkai
4 Mechanics of Fluids (I)
") 1. The x and y components of velocity for a two-dimensional flow are u = 3.0 ft/s and v = 9.0x ft/s where x is in feet. Determine the equation for the streamlines and graph representative streamlines in
1. The x and y components of velocity for a two-dimensional flow are u = 3.0 ft/s and v = 9.0x ft/s where x is in feet. Determine the equation for the streamlines and graph representative streamlines in
Modelling of dispersed, multicomponent, multiphase flows in resource industries. Section 3: Examples of analyses conducted for Newtonian fluids
 Modelling of dispersed, multicomponent, multiphase flows in resource industries Section 3: Examples of analyses conducted for Newtonian fluids Globex Julmester 017 Lecture # 04 July 017 Agenda Lecture
Universal Viscosity Curve Theory
 TM Universal Viscosity Curve Theory Turbine Flow Meters and Flow Viscosity Introduction Like any transducer, a turbine flow meter is sensitive to physical parameters other than the one which is of interest.
Experimental and Numerical Investigation of Two- Phase Flow through Enlarging Singularity
 Purdue University Purdue e-pubs International Refrigeration and Air Conditioning Conference School of Mechanical Engineering 212 Experimental and Numerical Investigation of Two- Phase Flow through Enlarging
Signature: (Note that unsigned exams will be given a score of zero.)
") Neatly print your name: Signature: (Note that unsigned exams will be given a score of zero.) Circle your lecture section (-1 point if not circled, or circled incorrectly): Prof. Dabiri Prof. Wassgren Prof.
Neatly print your name: Signature: (Note that unsigned exams will be given a score of zero.) Circle your lecture section (-1 point if not circled, or circled incorrectly): Prof. Dabiri Prof. Wassgren Prof.
Numerical and Experimental Study on the Effect of Guide Vane Insertion on the Flow Characteristics in a 90º Rectangular Elbow
 Numerical and Experimental Study on the Effect of Guide Vane Insertion on the Flow Characteristics in a 90º Rectangular Elbow Sutardi 1, Wawan A. W., Nadia, N. and Puspita, K. 1 Mechanical Engineering
CHAPTER 3. CONVENTIONAL RHEOMETRY: STATE-OF-THE-ART. briefly introduces conventional rheometers. In sections 3.2 and 3.
 30 CHAPTER 3. CONVENTIONAL RHEOMETRY: STATE-OF-THE-ART This chapter reviews literature on conventional rheometries. Section 3.1 briefly introduces conventional rheometers. In sections 3.2 and 3.3, viscometers
2 Internal Fluid Flow
 Internal Fluid Flow.1 Definitions Fluid Dynamics The study of fluids in motion. Static Pressure The pressure at a given point exerted by the static head of the fluid present directly above that point.
APPLIED FLUID DYNAMICS HANDBOOK
 APPLIED FLUID DYNAMICS HANDBOOK ROBERT D. BLEVINS H imhnisdia ttodisdiule Darmstadt Fachbereich Mechanik 'rw.-nr.. [VNR1 VAN NOSTRAND REINHOLD COMPANY ' ' New York Contents Preface / v 1. Definitions /
where = rate of change of total energy of the system, = rate of heat added to the system, = rate of work done by the system
 The Energy Equation for Control Volumes Recall, the First Law of Thermodynamics: where = rate of change of total energy of the system, = rate of heat added to the system, = rate of work done by the system
ENGINEERING FLUID MECHANICS. CHAPTER 1 Properties of Fluids
 CHAPTER 1 Properties of Fluids ENGINEERING FLUID MECHANICS 1.1 Introduction 1.2 Development of Fluid Mechanics 1.3 Units of Measurement (SI units) 1.4 Mass, Density, Specific Weight, Specific Volume, Specific
INSTITUTE OF AERONAUTICAL ENGINEERING Dundigal, Hyderabad AERONAUTICAL ENGINEERING QUESTION BANK : AERONAUTICAL ENGINEERING.
 Course Name Course Code Class Branch INSTITUTE OF AERONAUTICAL ENGINEERING Dundigal, Hyderabad - 00 0 AERONAUTICAL ENGINEERING : Mechanics of Fluids : A00 : II-I- B. Tech Year : 0 0 Course Coordinator
LECTURE 6- ENERGY LOSSES IN HYDRAULIC SYSTEMS SELF EVALUATION QUESTIONS AND ANSWERS
 LECTURE 6- ENERGY LOSSES IN HYDRAULIC SYSTEMS SELF EVALUATION QUESTIONS AND ANSWERS 1. What is the head loss ( in units of bars) across a 30mm wide open gate valve when oil ( SG=0.9) flow through at a
FE Exam Fluids Review October 23, Important Concepts
 FE Exam Fluids Review October 3, 013 mportant Concepts Density, specific volume, specific weight, specific gravity (Water 1000 kg/m^3, Air 1. kg/m^3) Meaning & Symbols? Stress, Pressure, Viscosity; Meaning
Chapter 7 The Energy Equation
 Chapter 7 The Energy Equation 7.1 Energy, Work, and Power When matter has energy, the matter can be used to do work. A fluid can have several forms of energy. For example a fluid jet has kinetic energy,
CFD ANALYSIS OF TURBULENCE EFFECT ON REACTION IN STIRRED TANK REACTORS
 CFD ANALYSIS OF TURBULENCE EFFECT ON REACTION IN STIRRED TANK REACTORS Udaya Bhaskar Reddy R*, Gopalakrishnan S, Ramasamy E Department of Chemical Engineering, Coimbatore Institute of Technology, Coimbatore-
PIPE FLOW. General Characteristic of Pipe Flow. Some of the basic components of a typical pipe system are shown in Figure 1.
 PIPE FLOW General Characteristic of Pipe Flow Figure 1 Some of the basic components of a typical pipe system are shown in Figure 1. They include the pipes, the various fitting used to connect the individual
Mechanistic model for four-phase sand/water/oil/gas stratified flow in horizontal pipes
 Computational Methods in Multiphase Flow VIII 335 Mechanistic model for four-phase sand/water/oil/gas stratified flow in horizontal pipes B. Moradi, M. Hossain & G. Oluyemi School of Engineering, Robert
CFD ANALYSIS FOR DESIGN OPTIMIZATION OF REVERSE FLOW TYPE CYCLONE SEPARATOR
 International Journal of Mechanical and Production Engineering (IJMPERD) Vol.1, Issue 2 Dec 2011 110-123 TJPRC Pvt. Ltd., CFD ANALYSIS FOR DESIGN OPTIMIZATION OF REVERSE FLOW TYPE CYCLONE SEPARATOR Mr.
External Flow and Boundary Layer Concepts
 1 2 Lecture (8) on Fayoum University External Flow and Boundary Layer Concepts By Dr. Emad M. Saad Mechanical Engineering Dept. Faculty of Engineering Fayoum University Faculty of Engineering Mechanical
Multi-Fidelity Computational Flow Assurance for Design and Development of Subsea Systems and Equipment Simon Lo
 Multi-Fidelity Computational Flow Assurance for Design and Development of Subsea Systems and Equipment Simon Lo CD-adapco, Trident House, Basil Hill Road, Didcot, OX11 7HJ, UK Multi-Fidelity Computational
Conjugate Heat Transfer Simulation of Internally Cooled Gas Turbine Vane
 Conjugate Heat Transfer Simulation of Internally Cooled Gas Turbine Vane V. Esfahanian 1, A. Shahbazi 1 and G. Ahmadi 2 1 Department of Mechanical Engineering, University of Tehran, Tehran, Iran 2 Department
Experiment- To determine the coefficient of impact for vanes. Experiment To determine the coefficient of discharge of an orifice meter.
 SUBJECT: FLUID MECHANICS VIVA QUESTIONS (M.E 4 th SEM) Experiment- To determine the coefficient of impact for vanes. Q1. Explain impulse momentum principal. Ans1. Momentum equation is based on Newton s
EROSION IN SLUG FLOW X-1 EROSION IN SLUG FLOW
 EROSION IN SLUG FLOW X-1 EROSION IN SLUG FLOW Introduction Oil and natural gas providers supply a large percentage of energy that is used to fuel our civilization s growth and prosperity. Foremost, petroleum
Chapter 10 Flow in Conduits
 Chapter 10 Flow in Conduits 10.1 Classifying Flow Laminar Flow and Turbulent Flow Laminar flow Unpredictable Turbulent flow Near entrance: undeveloped developing flow In developing flow, the wall shear
PHEN 612 SPRING 2008 WEEK 12 LAURENT SIMON
 PHEN 612 SPRING 28 WEEK 12 LAURENT SIMON Mixing in Reactors Agitation, Mixing of Fluids and Power requirements Agitation and mixing are two of the most common operations in the processing industries Agitation:
CHAPTER 7 NUMERICAL MODELLING OF A SPIRAL HEAT EXCHANGER USING CFD TECHNIQUE
 CHAPTER 7 NUMERICAL MODELLING OF A SPIRAL HEAT EXCHANGER USING CFD TECHNIQUE In this chapter, the governing equations for the proposed numerical model with discretisation methods are presented. Spiral
Hydraulic Design Of Polyethylene Pipes
 Hydraulic Design Of Polyethylene Pipes Waters & Farr polyethylene pipes offer a hydraulically smooth bore that provides excellent flow characteristics. Other advantages of Waters & Farr polyethylene pipes,
DEVELOPMENT OF CFD MODEL FOR A SWIRL STABILIZED SPRAY COMBUSTOR
 DRAFT Proceedings of ASME IMECE: International Mechanical Engineering Conference & Exposition Chicago, Illinois Nov. 5-10, 2006 IMECE2006-14867 DEVELOPMENT OF CFD MODEL FOR A SWIRL STABILIZED SPRAY COMBUSTOR
Study on Impingement of Air Jet from Orifice on Convex Surface for Unconfined Flow
 Study on Impingement of Air Jet from Orifice on Convex Surface for Unconfined Flow Prof. A. M. Hanchinal 1 Krishna Alias Aditya B. 2 Rahul Torgal 3 Naveed Sudarji 4 Aishwarya Chhapre 5 2, 3, 4, 5 UG Students
CLASS SCHEDULE 2013 FALL
 CLASS SCHEDULE 2013 FALL Class # or Lab # 1 Date Aug 26 2 28 Important Concepts (Section # in Text Reading, Lecture note) Examples/Lab Activities Definition fluid; continuum hypothesis; fluid properties
INTRODUCTION TO MULTIPHASE FLOW. Mekanika Fluida II -Haryo Tomo-
 1 INTRODUCTION TO MULTIPHASE FLOW Mekanika Fluida II -Haryo Tomo- 2 Definitions Multiphase flow is simultaneous flow of Matters with different phases( i.e. gas, liquid or solid). Matters with different
SEM-2017(03HI MECHANICAL ENGINEERING. Paper II. Please read each of the following instructions carefully before attempting questions.
 We RoU No. 700095 Candidate should write his/her Roll No. here. Total No. of Questions : 7 No. of Printed Pages : 7 SEM-2017(03HI MECHANICAL ENGINEERING Paper II Time ; 3 Hours ] [ Total Marks : 0 Instructions
Signature: (Note that unsigned exams will be given a score of zero.)
") Neatly print your name: Signature: (Note that unsigned exams will be given a score of zero.) Circle your lecture section (-1 point if not circled, or circled incorrectly): Prof. Dabiri Prof. Wassgren Prof.
Neatly print your name: Signature: (Note that unsigned exams will be given a score of zero.) Circle your lecture section (-1 point if not circled, or circled incorrectly): Prof. Dabiri Prof. Wassgren Prof.
FLOW IN CONDUITS. Shear stress distribution across a pipe section. Chapter 10
 Chapter 10 Shear stress distribution across a pipe section FLOW IN CONDUITS For steady, uniform flow, the momentum balance in s for the fluid cylinder yields Fluid Mechanics, Spring Term 2010 Velocity
THE EFFECT OF TWO PHASE (AIR-WATER) FLOW CHARACTERISTICS ON MOMENTUM FLUX DUE TO FLOW TURNING ELEMENTS AT ATMOSPHERIC CONDITIONS
 FLOW CHARACTERISTICS ON MOMENTUM FLUX DUE TO FLOW TURNING ELEMENTS AT ATMOSPHERIC CONDITIONS") International Journal of Latest Trends in Engineering and Technology Vol.(8)Issue(1), pp.319-328 DOI: http://dx.doi.org/10.21172/1.81.041 e-issn:2278-621x AN EXPERIMENTAL STUDY OF THE EFFECT OF TWO PHASE
International Journal of Latest Trends in Engineering and Technology Vol.(8)Issue(1), pp.319-328 DOI: http://dx.doi.org/10.21172/1.81.041 e-issn:2278-621x AN EXPERIMENTAL STUDY OF THE EFFECT OF TWO PHASE
ME332 FLUID MECHANICS LABORATORY (PART II)
") ME332 FLUID MECHANICS LABORATORY (PART II) Mihir Sen Department of Aerospace and Mechanical Engineering University of Notre Dame Notre Dame, IN 46556 Version: April 2, 2002 Contents Unit 5: Momentum transfer
ME332 FLUID MECHANICS LABORATORY (PART II) Mihir Sen Department of Aerospace and Mechanical Engineering University of Notre Dame Notre Dame, IN 46556 Version: April 2, 2002 Contents Unit 5: Momentum transfer
Fundamentals of Flow Metering
 Technical Data Sheet 00816-0100-3031 Fundamentals of Flow Metering A reliable flow indication is dependent upon the correct measurement of A and V. If, for example, air bubbles are present in the fluid,
LOCAL VELOCITY MEASUREMENTS AND COMPUTATIONAL FLUID DYNAMICS (CFD) SIMULATIONS OF SWIRLING FLOW IN A CYLINDRICAL CYCLONE SEPARATOR
 SIMULATIONS OF SWIRLING FLOW IN A CYLINDRICAL CYCLONE SEPARATOR") Proceedings of ETCE 001: Engineering Technology Conference on Energy February 5-7, 001, Houston, Texas ETCE 001-17101 LOCAL VELOCITY MEASUREMENTS AND COMPUTATIONAL FLUID DYNAMICS (CFD) SIMULATIONS OF SWIRLING
Proceedings of ETCE 001: Engineering Technology Conference on Energy February 5-7, 001, Houston, Texas ETCE 001-17101 LOCAL VELOCITY MEASUREMENTS AND COMPUTATIONAL FLUID DYNAMICS (CFD) SIMULATIONS OF SWIRLING
Outline. Advances in STAR-CCM+ DEM models for simulating deformation, breakage, and flow of solids
 Advances in STAR-CCM+ DEM models for simulating deformation, breakage, and flow of solids Oleh Baran Outline Overview of DEM in STAR-CCM+ Recent DEM capabilities Parallel Bonds in STAR-CCM+ Constant Rate
COMPUTATIONAL STUDY OF PARTICLE/LIQUID FLOWS IN CURVED/COILED MEMBRANE SYSTEMS
 COMPUTATIONAL STUDY OF PARTICLE/LIQUID FLOWS IN CURVED/COILED MEMBRANE SYSTEMS Prashant Tiwari 1, Steven P. Antal 1,2, Michael Z. Podowski 1,2 * 1 Department of Mechanical, Aerospace and Nuclear Engineering,
Erosion Testing & CFD Erosion Modelling. John Peters, NEL, 29 January 2014
 Erosion Testing & CFD Erosion Modelling John Peters, NEL, 29 January 2014 National Measurement System (NMS) NMS is a network of laboratories and processes Maintains national measurement infrastructure
Available online at ScienceDirect. Procedia Engineering 105 (2015 )
") Available online at www.sciencedirect.com ScienceDirect Procedia Engineering 105 (015 ) 64 69 6th BSME International Conference on Thermal Engineering (ICTE 014) Numerical Study of Sub-Nozzle Flows for
Available online at www.sciencedirect.com ScienceDirect Procedia Engineering 105 (015 ) 64 69 6th BSME International Conference on Thermal Engineering (ICTE 014) Numerical Study of Sub-Nozzle Flows for
Empirical Co - Relations approach for solving problems of convection 10:06:43
 Empirical Co - Relations approach for solving problems of convection 10:06:43 10:06:44 Empirical Corelations for Free Convection Use T f or T b for getting various properties like Re = VL c / ν β = thermal
Microfluidics 1 Basics, Laminar flow, shear and flow profiles
 MT-0.6081 Microfluidics and BioMEMS Microfluidics 1 Basics, Laminar flow, shear and flow profiles 11.1.2017 Ville Jokinen Outline of the next 3 weeks: Today: Microfluidics 1: Laminar flow, flow profiles,
Experimental Investigation of Drag Reduction with polymer of Kerosene flow in a horizontal pipe
 International Journal of Thermal Technologies E-ISSN 2277 4114 2018 INPRESSCO, All Rights Reserved Available at http://inpressco.com/category/ijtt/ Research Article Experimental Investigation of Drag Reduction
Estimation of Flow Accelerated Corrosion (FAC) in Feeder Pipes using CFDd Software Fluent
 in Feeder Pipes using CFDd Software Fluent") Estimation of Flow Accelerated Corrosion (FAC) in Feeder Pipes using CFDd Software Fluent Dheya Al-Othmany Department of Nuclear Engineering, King Abdulaziz University, Jeddah 21589, Saudi Arabia Email
Estimation of Flow Accelerated Corrosion (FAC) in Feeder Pipes using CFDd Software Fluent Dheya Al-Othmany Department of Nuclear Engineering, King Abdulaziz University, Jeddah 21589, Saudi Arabia Email
Investigation into Sand Deposition and Transportation in Multiphase Pipelines Phase 2
 Investigation into Sand Deposition and Transportation in Multiphase Pipelines Phase 2 Matthew Avent Dr Jeremy Leggoe School of Mechanical and Chemical Engineering CEED Client: Woodside Energy Ltd. Abstract
CHAPTER THREE FLUID MECHANICS
 CHAPTER THREE FLUID MECHANICS 3.1. Measurement of Pressure Drop for Flow through Different Geometries 3.. Determination of Operating Characteristics of a Centrifugal Pump 3.3. Energy Losses in Pipes under
A CFD MODEL FOR PREDICTION OF LEAKAGE AND DYNAMIC FORCE COEFFICIENTS IN POCKET DAMPER SEALS: FROM GAS TO A WET GAS
 May 2018 A CFD MODEL FOR PREDICTION OF LEAKAGE AND DYNAMIC FORCE COEFFICIENTS IN POCKET DAMPER SEALS: FROM GAS TO A WET GAS TRC-SEAL-03-18 Dr. Luis San Andrés Mast-Childs Chair Professor Dr. Jing Yang
Chemical and Biomolecular Engineering 150A Transport Processes Spring Semester 2017
 Chemical and Biomolecular Engineering 150A Transport Processes Spring Semester 2017 Objective: Text: To introduce the basic concepts of fluid mechanics and heat transfer necessary for solution of engineering
PERFORMANCE OF A CENTRAL-TYPE JET PUMP II- EXPERIMENTAL STUDY ON WATER FLOW
 Eighth International Water Technology Conference, IWTC8 24, Alexandria, Egypt PERFORMANCE OF A CENTRAL-TYPE JET PUMP II- EXPERIMENTAL STUDY ON WATER FLOW ABSTRACT EL-Otla, F. M. *, EL-Sawaf, I. A. * and
Two-Phase Refrigerant Distribution in a Micro- Channel Manifold
 Purdue University Purdue e-pubs International Refrigeration and Air Conditioning Conference School of Mechanical Engineering 6 Two-Phase Refrigerant Distribution in a Micro- Channel Manifold Chad D. Bowers
UNIT II Real fluids. FMM / KRG / MECH / NPRCET Page 78. Laminar and turbulent flow
 UNIT II Real fluids The flow of real fluids exhibits viscous effect that is they tend to "stick" to solid surfaces and have stresses within their body. You might remember from earlier in the course Newtons
Numerical Simulation of the Hagemann Entrainment Experiments
 CCC Annual Report UIUC, August 14, 2013 Numerical Simulation of the Hagemann Entrainment Experiments Kenneth Swartz (BSME Student) Lance C. Hibbeler (Ph.D. Student) Department of Mechanical Science & Engineering
Proceedings of the 4th Joint US-European Fluids Engineering Division Summer Meeting ASME-FEDSM2014 August 3-7, 2014, Chicago, Illinois, USA
 Proceedings of the 4th Joint US-European Fluids Engineering Division Summer Meeting ASME-FEDSM4 August 3-7, 4, Chicago, Illinois, USA FEDSM4-38 SUPPRESSION OF UNSTEADY VORTEX SHEDDING FROM A CIRCULAR CYLINDER