SUPPLEMENTARY INFORMATION
|
|
|
- Emerald Mason
- 5 years ago
- Views:
Transcription
1 SUPPLEMENTARY INFORMATION Supplementary Figure 1. Preparation line for purifying and separating diatom and radiolarian opal for isotope measurements.

2 Supplementary Figure 2. Examples of different size class fractions of radiolarians obtained through several sieving steps.
 occurrence of thinly silicified but very well preserved diatom Rhizosolenia antarctica together with centric diatoms (A) and Eucampia antarctica (B) indicates excellent preservation of the")
3 Supplementary Figure 3. Scanning Electron Microscope (SEM) images of pure diatom fractions. (A,B) Images from Holocene and glacial diatom fractions from core PS The (rare) occurrence of thinly silicified but very well preserved diatom Rhizosolenia antarctica together with centric diatoms (A) and Eucampia antarctica (B) indicates excellent preservation of the purified diatom assemblages. (C, D) Images from Holocene and glacial diatom fractions from core PS Although the samples were treated 6.5 hours in the ultrasonic bath the presevation of the diatoms is very good. (C) Thalassiosira oliverana and Fragilariopsis kerguelensis (rare occurrence), (D) E. antarctica.
 Images from Holocene and glacial radiolarian fractions (125-250 µm) from core PS1768-8 after 18 hours ultrasonic treatment.")
4 Supplementary Figure 4. Scanning Electron Microscope (SEM) images of pure radiolarian fractions. (A, B) Images from Holocene and glacial radiolarian fractions (>125 µm) from core PS (C, D) Images from Holocene and glacial radiolarian fractions ( µm) from core PS after 18 hours ultrasonic treatment. (E, F) Images from Holocene and glacial radiolarian fractions (> 250 µm) from core PS after 24 hours utrasonic treatment. Although the samples were treated for hours in the ultrasonic bath the presevation of the radiolarians in both cores is very good.
5
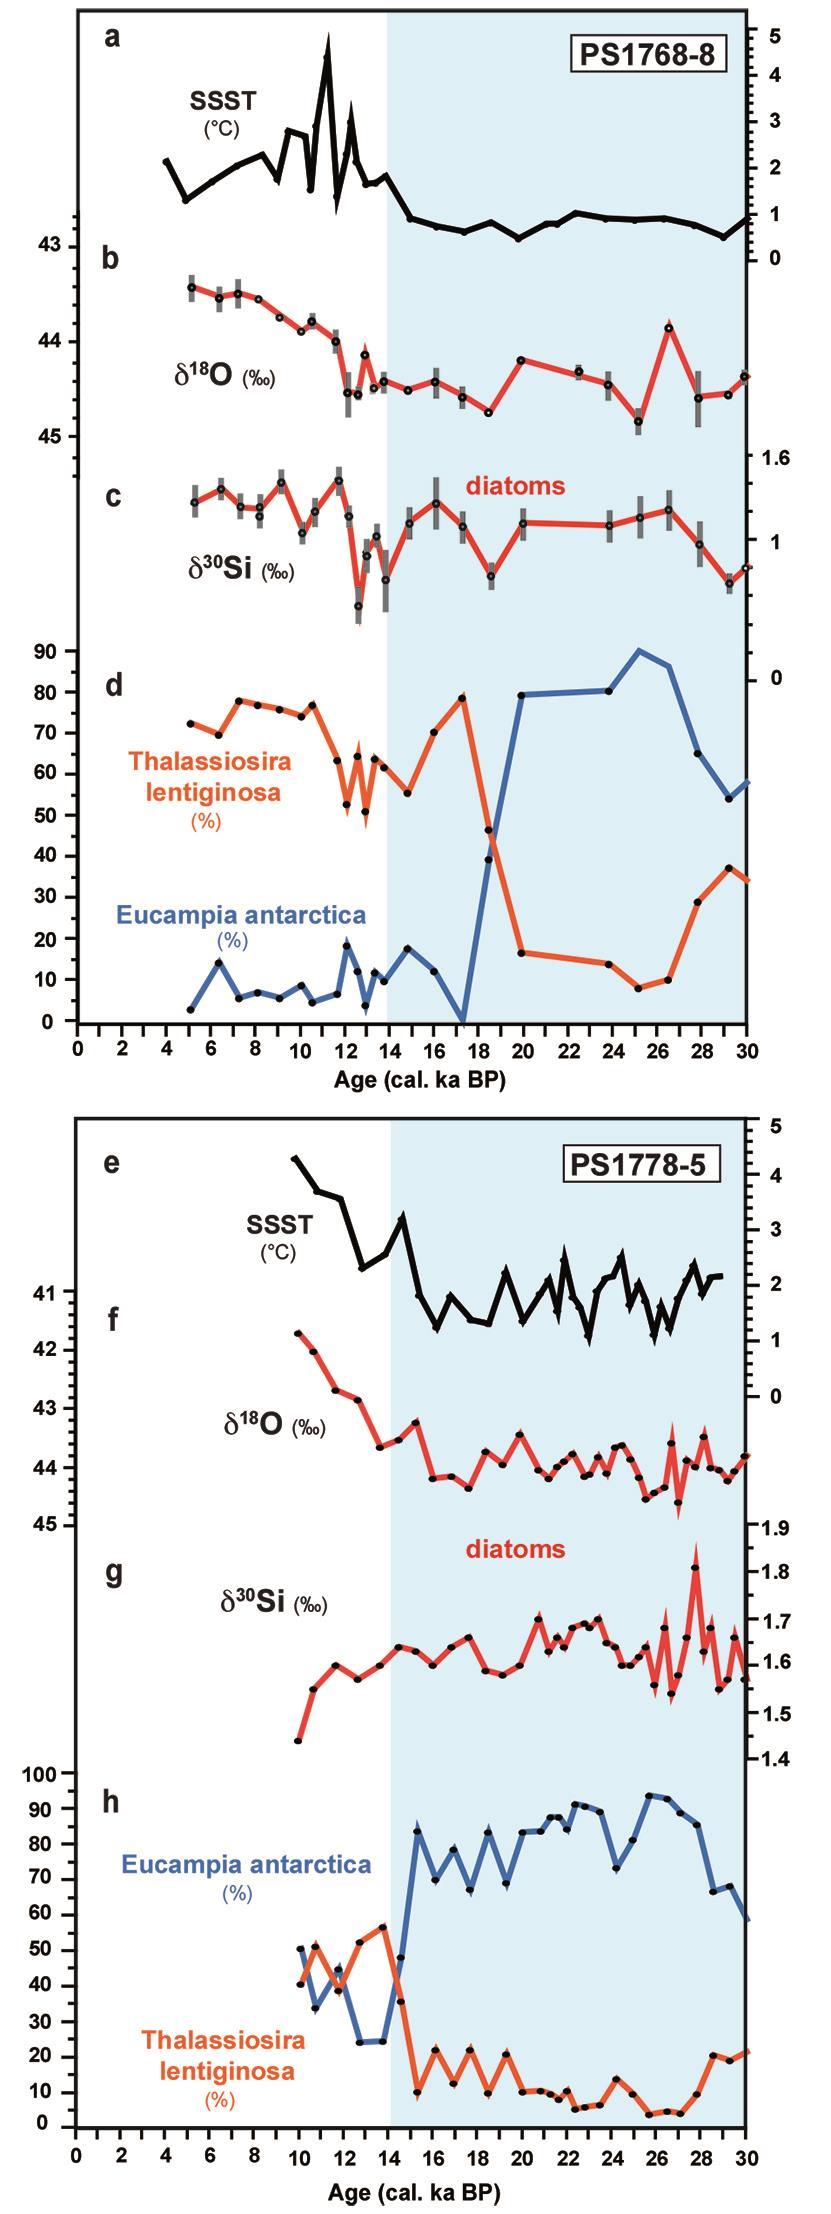
6 Supplementary Figure 5. Variations of the two most abundant diatom species in the diatom fractions used for isotopic measurements. The abundance variations in cores PS and PS are compared to 18 O and 30 Si measurements and summer sea surface temperature (SSST) changes. (a-d) Core PS located in the GSIZ. (a) Diatom transfer-function-based estimates of summer sea-surface temperature (SSST) estimated from diatom assemblage compositions using the Imbrie and Kipp Method (IKM). The transfer function relies on a set up with 336 reference sites, 29 diatom taxa/taxa groups, logarithmictransformed diatom data, quadratic regression and a three-factor model, which results in root mean square errors of prediction (RMSEP) of 0.8 C (ref. S1). (b) δ 18 O and (c) δ 30 Si records measured at the diatom fraction. (d) Relative abundances of the diatom species Thalassiosira lentiginosa and Eucampia antarctica in the diatom fraction extracted for isotope measurements. (e-h) Core PS located close to the glacial winter sea-ice edge. (e) SSST estimations based on diatom IKM transfer function S1. (f) δ 18 O and (g) δ 30 Si records measured at the diatom fraction. (h) Relative abundances of the diatom species T. lentiginosa and E. antarctica in the diatom fraction extracted for isotope measurements. Blue-shaded area delineates MIS2 and the late part of MIS 3.
7 Supplementary Figure 6. Southern Ocean sea-ice distribution as reconstructed for the EPILOG-LGM time slice. Sea-ice distribution from ref. 34 including newly reconstructed winter sea-ice concentration (%) from cores PS and PS averaged over the EPILOG-LGM time slice ( cal. yr BP). Signature legend: (1) concomitant occurrence of cold-water indicator Fragilariopsis obliquecostata (>1% of diatom assemblage) and summer sea ice concentration >0% interpreted to represent (sporadic) occurrence of summer sea ice; (2) presence of winter sea ice based on diatom sea ice indicators and transfer function derived winter sea-ice concentration estimates (values); (3) no sea ice. The modern maximum winter sea ice (M-WSI) is placed at the 15% September concentration according to ref. 67 and the EPILOG-LGM maximum winter sea-ice extent (E-LGM-WSI) follows this definition. This compilation shows that during the glacial site PS was located in the northern seasonal sea-ice zone and site PS was in the area of the sea-ice edge, where sea-ice concentration drops abruptly.
8
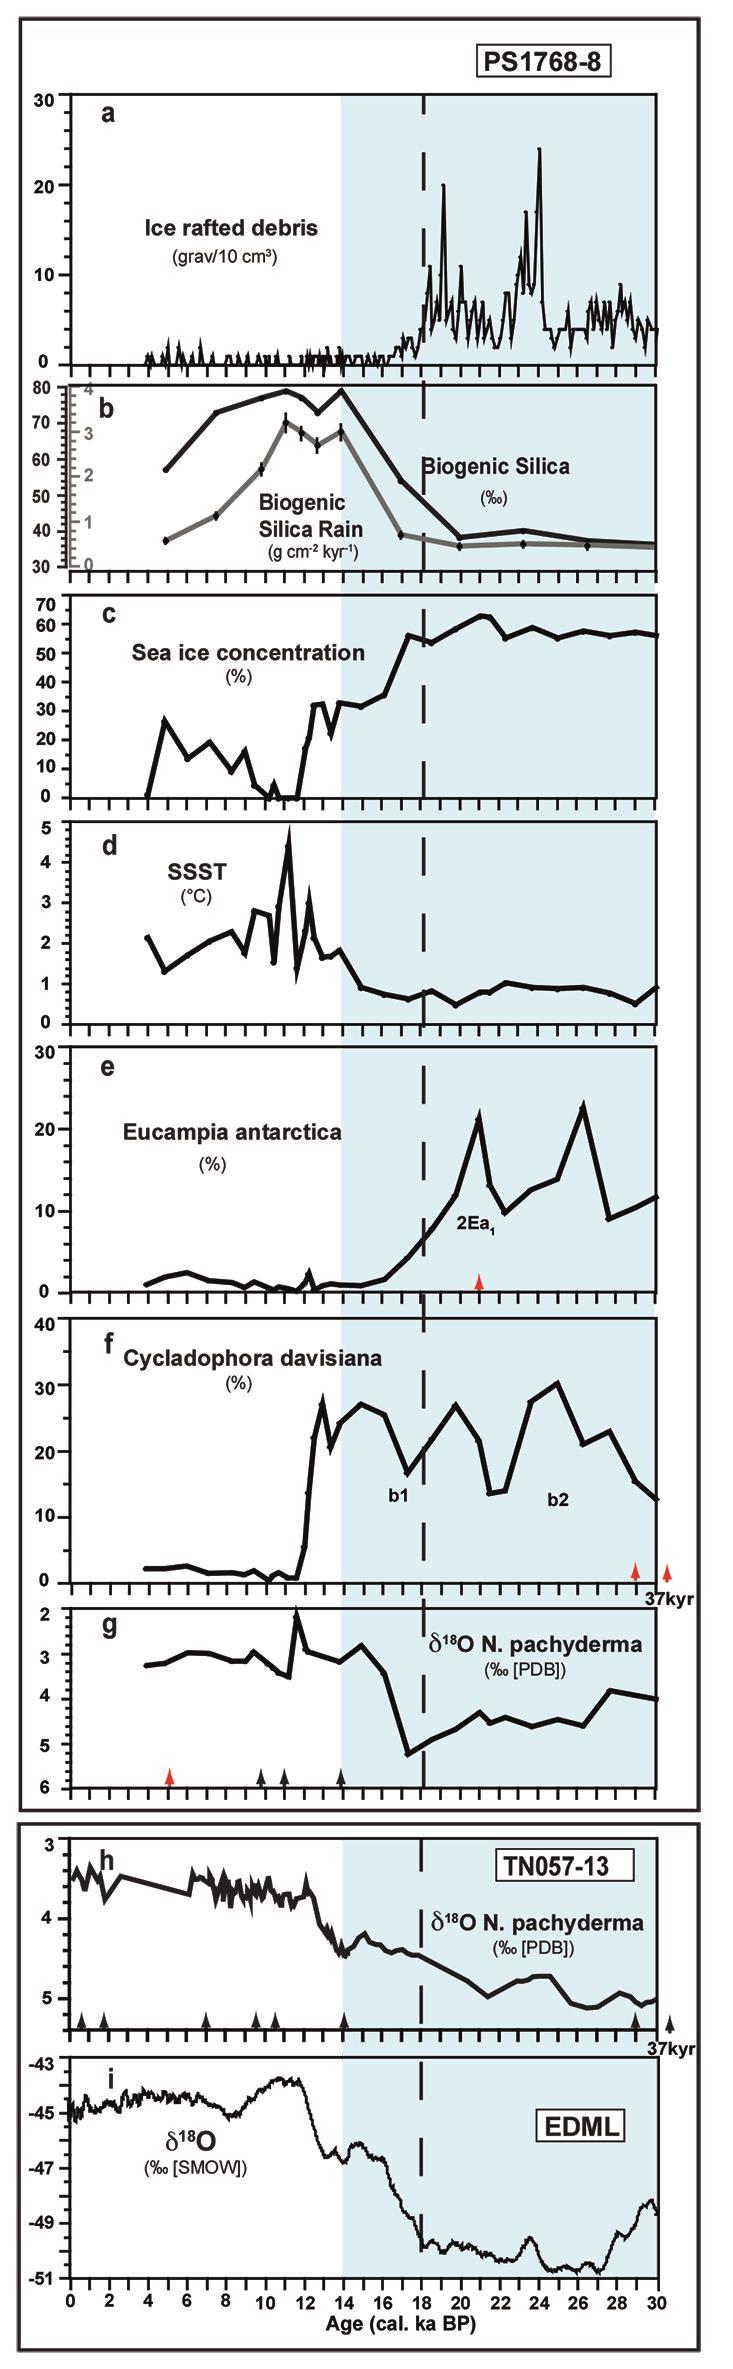
9 Supplementary Figure 7. Proxies of core PS used for dating and paleoceanographic interpretation compared to core TN and the EDML ice core. (a-g) Parameters of core PS1768-8: (a) Ice rafted debris (IRD) derived from the abundance of gravel clasts >2 mm per 10 cm 3, estimated from x-radiograph S2. (b) Biogenic silica percentages and biogenic silica rain rates 50. (c) Diatom transfer function-based estimates of winter sea-ice concentration 35. (d) ) SSST estimations based on diatom IKM transfer function S1. (e) Relative abundances of the diatom Eucampia antarctica 38 (f) Relative abundances of the radiolarian Cycladophora davisiana 5. (g) 18 O record of Neogloboquadrina pachyderma (sinistral) S3. (h) 18 O record of N. pachyderma (sinistral) from core TN (ref. 15). (i) 18 O H2O record from EDML (EPICA Dronning Maud Land) ice core 69 against AICC2012 (Antarctic Ice Core Chronology 2012) 62. Blue-shaded area delineates MIS2 and the late part of MIS 3. Vertical black dashed line marks the onset of warming seen in East Antarctic ice cores 69,S4. Arrows in panels e, f, g and h indicate age pointer (black arrows mark AMS 14 C dates 15,38, red arrows mark ages obtained by diatom and radiolarian stratigraphy, and by 230 Th ex constant flux modeling, see Supplementary Table 5). Foraminiferal-based oxygen isotope records from Quaternary records south of the Subantarctic Front generally rely on the surface-subsurface dwelling planktic foraminifer N. pachyderma (sinistral). Although obtained data may result in stratigraphically useful records 15,S5,S6, N. pachyderma (sinistral) oxygen isotope records may also display high amplitude anomalies during glacials and glacial-interglacial transitions whose nature remains difficult to be explained. Some of this may stem from contamination related to the very low carbonate record S7, but the signals were also interpreted to be influenced by glacial meltwater supply S8. In PS168-8 (g) and PS (Supplementary Fig. 8f) the 18 O records of N. pachyderma (sinistral) display high amplitude signal shifts, e.g. between and cal. yr BP, thus are distinct from the diatom and radiolarian 18 O records (Fig. 3c,g). Interestingly, the diatom and radiolarian 18 O
10 records are similar to a N. pachyderma (sinistral) record reported from core TN (ref. 15) (h).
11
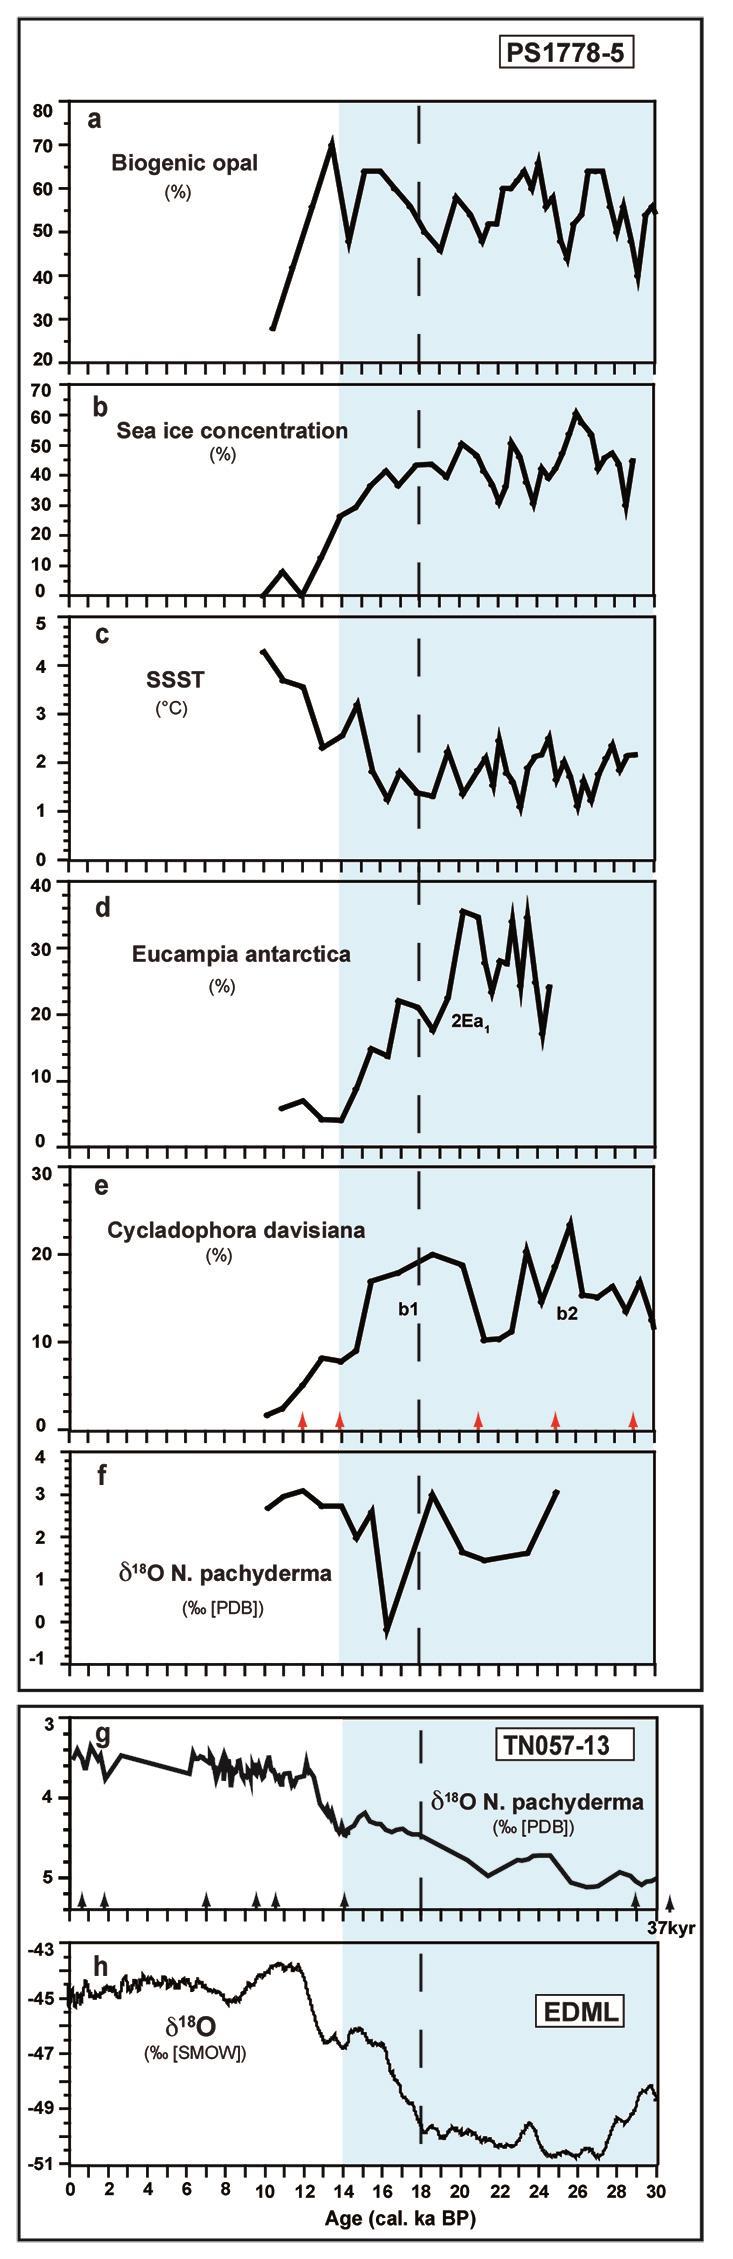
12 Supplementary Figure 8. Proxies of core PS used for dating and paleoceanographic interpretation compared to core TN and the EDML ice core. (a-f) Parameters of Core PS1778-5: (a) Biogenic silica percentages, (b) Transfer functionbased estimates of winter sea-ice concentration 35. (c) Transfer-function based estimates of summer sea-surface temperature (SSST) S1. (d) Relative abundances of the diatom Eucampia antarctica 38. (e) Relative abundances of the radiolarian Cycladophora davisiana S9. (f) 18 O record of N. pachyderma (sinistral). (g) 18 O record of N. pachyderma (sinistral) from core TN (ref. 15). (h) 18 record from EDML (EPICA Dronning Maud Land) ice core 69 against AICC2012 (Antarctic Ice Core Chronology 2012) 62. Blue-shaded area delineates MIS2 and the late part of MIS 3. Vertical black dashed line marks the onset of warming seen in East Antarctic ice cores 69,S4. Arrows in panels e and g indicate age pointer (black arrows mark AMS 14 C dates 15, red arrows mark ages obtained by diatom and radiolarian stratigraphy, see Supplementary Table 6).
 derived from ref.")
13 Supplementary Figure 9. Present day climatological mean sea ice concentration in the Atlantic sector of the Southern Ocean. Shown is the reconstructed average sea ice concentration between A.D (color-shaded area) derived from ref. S10, overlaid with contours of the climatological sea ice distribution as modeled by our AOGCM approach (contour lines).
14 Supplementary Figure 10. Position of the Antarctic Polar Front (PF) in the deglacial sensitivity experiments. Displayed are the relative impact of a deglacial CO 2 increase from 180 ppmv to 240 ppmv (referred to as experiment CO2) and a poleward shift of the Westerlies in the Southern Ocean by 3 in latitude (referred to as experiment WIND) on the annual cycle of the latitudinal position of the Antarctic PF at the longitudes of the core locations (upper panel PS and lower panel PS1778-5). Additionally, the simulated preindustrial (PI) and the LGM positions of the Antarctic PF are shown. The Antarctic PF position is defined by the 2 C-isoline of the averaged temperature between a water depth of m. A comparison of the glacial (LGM) and interglacial (pre-industrial) position of the PF indicates a glacial northward shift of ca Furthermore similar to the response in
, the comparison between experiments CO2 and WIND shows a relatively pronounced southward shift of the")

15 sea-ice cover (Supplementary Fig.11), the comparison between experiments CO2 and WIND shows a relatively pronounced southward shift of the Antarctic PF in experiment CO2. This suggests that the greenhouse-gas induced southward shift of the sea ice-melting zone represents a key control on the deglacial southward migration of the Antarctic PF (see Supplementary Fig.11 and figure caption therein for further details). 1 2
16 Supplementary Figure 11. Mixed layer depth changes and sea-ice concentrations in the deglacial sensitivity experiments. Displayed are the relative impacts on glacial MLD (m) of a deglacial CO 2 increase from 180 ppmv to 240 ppmv (referred to as experiment CO2, upper panel) and a poleward shift of the Westerlies in the Southern Ocean by 3 in latitude (referred to as experiment WIND, lower panel). The MLD changes are shown for the month August during Austral winter conditions. In both panels the MLD changes are overlaid with the same sea ice concentration (15%) of the corresponding month for the glacial state (black line), the WIND experiment (turquoise dotted line) and the CO2 experiment (green line). Areas with a sea-ice concentration of more than 90% in the glacial state are shaded in grey. The sensitivity experiments have been initialized with a glacial equilibrium simulation (simulation LGMW in ref. 23) and integrated for 600 years. The last 100 years of model output have been averaged and are shown as climatological mean values. In both experiments a deepening of the MLD is detected. A comparison between the two sensitivity experiments shows a relatively pronounced sea ice retreat and deeper MLD in experiment CO2. In this experiment the greenhouse-gas induced warming causes the sea ice retreat (region between the black to the green line), which is accompanied by a southward shift of the sea ice melting zone and deeper MLD in this region. A similar southward shift is also detected in the APF as shown in Supplementary Fig.10. Alternative scenarios to the greenhouse-gas induced warming in experiment CO2, might relate deglacial warming in the Southern Ocean e.g. to insolation changes or changes in the Atlantic meridional overturning circulation and associated interhemispheric heat transport.

17 Supplementary Figure 12. Meridional depth sections of Si(OH) 4 concentrations at 0. Stippled black lines indicate the locations of cores PS and PS The nutrient data are from ref. 33 and for imaging we used Ocean Data View S11. Supplementary Figure 13. Location of plankton stations used for determination of radiolarian depth habitats. For data see Supplementary Table 2 (from ref. 25).
18 Supplementary Table 1. ICP-OES and EDS measurements of major elements in core PS Al 2 O 3 concentrations of 0.5 and 0.6% are still in the range, which apparently do not affect the 18 O signal 40. The microscopical inspection of the samples with these Al 2 O 3 concentrations does not indicate contamination by minerals.
19 Supplementary Table 2. Vertical abundances of the radiolarian species Actinomma antarctica and Spongotrochus glacialis from four plankton stations. Data from the four stations in the Atlantic sector of the Southern Ocean are from ref. 25. Supplementary Figure 13 displays the location of the plankton stations. Both species were not encountered in the plankton hauls from the three northern station 25.
20
21 Supplementary Table 3. δ 30 Si rad values from surface sediment samples, δ 30 Si Si(OH)4 and Si(OH) 4 values from nearby water stations and δ 30 Si rad estimations. δ 30 Si rad values are estimated from δ 30 Si rad values obtained from multicorer surface sediments (Fig. 1) and δ 30 Si Si(OH)4 values measured at the nearby water stations 29 according to the equation: δ 30 Si rad =δ 30 Si rad -δ 30 Si Si(OH)4 (ref. 21). Calculations were done for two water depth intervals, the upper ~300 to 400m and ~upper 1000m to cover the depth ranges of all radiolarian species included in the fractions. Obtained δ 30 Si rad values were compared to the Si(OH) 4 concentrations of both water depth intervals of each water station 29. In addition, annual and summer (January-March) Si(OH) 4 concentrations at the surface sediment stations were averaged from two water depth intervals (0-400 m, m), which were taken from the Southern Ocean Atlas 33. For the depth interval m only summer values were available. δ 30 Si rad AVG = averaged δ 30 Si rad.
22 Supplementary Table 4. Parameters used for the estimation of Holocene and Glacial δ 30 Si Si(OH)4 values compared to Si(OH) 4 values from field data. Indicated are δ 30 Si values from diatom and radiolarian fractions of cores PS and PS averaged for the early Holocene (until 12 cal. ka BP) and last glacial period (~19-29 cal. ka BP). The calculation of δ 30 Si Si(OH)4 from δ 30 Si rad data was performed with different fractionation offsets ( δ 30 Si rad = - 0.8, δ 30 Si rad = -1.2, δ 30 Si rad = -1.5, see Methods). For the δ 30 Si Si(OH)4 estimations from δ 30 Si diat data a diatom fractionation offset of -1.1 (ref. 24) was used. The obtained δ 30 Si Si(OH)4 values were related to δ 30 Si Si(OH)4 values from water stations and to their ranges in Si(OH) 4 concentrations 20,28,29 (Fig.4). Note that the δ 30 Si Si(OH)4 values reflect a broad range in Si(OH) 4 concentrations as also indicated in Figure 4.
23 Supplementary Table 5. Age pointers for PS The AMS 14 C dates from ref. 38 were converted to calendar years with CALIB 7.0 using the MARINE13 calibration S12 with a reservoir age of 800 yr according to ref. S13. Pointers based on Eucampia antarctica and Cycladophora davisiana abundance fluctuations, both presenting established stratigraphic tools for the late Quaternary SO and calibrated with oxygen isotope stratigraphy S5, S14-S18, represent an abundance maximum of E. antarctica (upper 2Ea 1 ) S16 at 200 cm, and the midpoint of the C. davisiana increase to its b peak S15 at 260 cm, which marks the Marine Isotope Stage (MIS) 3/2 boundary S18,S19 and the uppermost c1 low of C. davisiana S15,S18. For details on E. antarctica and C. davisiana abundance pattern see Supplementary Fig. 7. The pointer at 12.5 cm was defined by 230 Th ex constant flux modeling considering an age model frame based on a combination of AMS 14 C dates and siliceous microfossil biofluctuation stratigraphies 50.
24 Supplementary Table 6. Age pointer for PS Age assignments of pointers based on E. antarctica and C. davisiana abundance fluctuations S14-S18 are from ref. 38. For details on E. antarctica and C. davisiana abundance pattern see Supplementary Fig. 8. Supplementary Table 7. δ 30 Si diat and δ 30 Si rad values from surface sediments close to the core sites PS and PS
25 Supplementary Table. 8. Oxygen and silicon isotope data from diatom opal (10-40 µm fraction) in core PS
26 Supplementary Table 9. Oxygen isotope data from radiolarian opal of the >250 µm fraction from core PS
27 Supplementary Table 10. Silicon isotope data from radiolarian opal of the >250 µm and µm fractions from core PS
28 Supplementary Table 11. Oxygen and silicon isotope data from diatom opal (10-40 µm fraction) in core PS
29 Supplementary Table 12. Oxygen and silicon isotope data from radiolarian opal of the >125 µm fraction from core PS
30 Supplementary References 1. Esper, O. & Gersonde, R. Quaternary surface water temperature estimations: New diatom transfer functions for the Southern Ocean. Palaeogeography Palaeoclimatology Palaeoecology 414, doi: /j.palaeo (2014). 2. Diekmann et al. in The South Atlantic in the late Quaternary (eds Wefer, G., Mulitza, S., Rathmeyer, V.) (Springer, 2004). 3. Niebler, H. S. Stable isotope record of foraminifera from South Atlantic sediments with reconstruction of paleotemperatures and paleosalinities. doi: /pangaea (1995). 4. WAIS Divide Project Members. Onset of deglacial warming in West Antarctica driven by local orbital forcing. Nature 500, (2013). 5. Charles, C. D. et al. Biogenic opal in Southern Ocean sediments over the last years: implications for surface water chemistry and circulation. Paleoceanography 6, (1991). 6. Bianchi, C. & Gersonde, R. Climate evolution at the last deglacial: The role of the Southern Ocean. Earth and Planetary Science Letters 228, (2004). 7. Charles, C. D. Late Quaternary ocean chemistry and climate change from an Antarctic deep sea sediment perspective. PhD thesis (Columbia University, N.Y., 1991). 8. Labeyrie, L. D., Pichon, J. J. Labracherie, M., Ippolito, P. Duprat, J. & Duplessy, J. C. Melting history of Antarctica during the past 60,000 years. Nature 322, (1986). 9. Brathauer, U. & Abelmann, A. Late Quaternary variations in sea surface temperatures and their relationship to orbital forcing recorded in the Southern ocean (Atlantic sector). Paleoceanography 14, (1999). 10. Hurrell, J. W., Hack, J. J., Shea, D., Caron, J. M. & Rosinski, J. A new sea surface temperature and sea ice boundary dataset for the Community Atmosphere Model. J. Climate 21, (2008). doi:
31 11. Schlitzer, R. Ocean Data View. (2013). 12. Stuiver, M., Reimer, P. J., & Reimer, R. W. CALIB 5.0. (WWW program and documentation) (2005). 13. Bard, E. Correction of accelerator mass spectrometry 14 C ages measured in planktonic foraminifera: paleoceanographic implications. Paleoceanography 3, (1988). 14. Morley, J. J., Hays, J. D. & Robertson, J. H. Stratigraphic framework of the late Pleistocene in the northwest Pacific Ocean. Deep Sea Res. 29, (1982). 15. Hays, J. D., Imbrie, J. & Shackleton, N. J. Variations in the Earth's Orbit: Pacemaker of the Ice Ages. Science 194, (1976) 16. Burckle, L. H. & Cooke, D. W. Late Pleistocene Eucampia antarctica abundance stratigraphy in the Atlantic sector of the Southern Ocean. Micropaleontology 29, 6-10 (1983). 17. Burckle. L. H. & Burak, R. Relative abundance of Eucampia antarctica as a close proxy to 18 O in upper Quaternary sediments of the Southern Ocean. Pact 50, I.1, (1996). 18. Brathauer, U., Abelmann, A., Gersonde, R., Niebler, S. & Fütterer, D. K. Calibration of Cycladophora davisiana events versus oxygen isotope stratigraphy in the subantarctic Atlantic Ocean A stratigraphic tool for carbonate-poor Quaternary sediments. Marine Geology 175, (2001). 19. Martinson, D. G., Pisias, N. G., Hays, J. D., Imbrie, J. D., Moore, T. C. & Shackleton, N. J. Age dating and the orbital theory of the ice ages: development of a high-resolution 0 to 300,000-year chronostratigraphy. Quaternary Research, 27, 1-29 (1987).
Minimal change in Antarctic Circumpolar Current flow speed between the last glacial and Holocene
 Minimal change in Antarctic Circumpolar Current flow speed between the last glacial and I.N. McCave, S.J. Crowhurst, G. Kuhn, C-D. Hillenbrand and M.P. Meredith Methods Cores Twelve cores forming the transect
SUPPLEMENTARY INFORMATION
 SUPPLEMENTARY INFORMATION DOI: 1.138/NGEO168 "Strength and geometry of the glacial Atlantic Meridional Overturning Circulation" S2 Map of core locations Core locations of the Holocene and LGM 231 / 23
Supplementary Figure 1. New downcore data from this study. Triangles represent the depth of radiocarbon dates. Error bars represent 2 standard error
 Supplementary Figure 1. New downcore data from this study. Triangles represent the depth of radiocarbon dates. Error bars represent 2 standard error of measurement (s.e.m.). 1 Supplementary Figure 2. Particle
Air sea temperature decoupling in western Europe during the last interglacial glacial transition
 María Fernanda Sánchez Goñi, Edouard Bard, Amaelle Landais, Linda Rossignol, Francesco d Errico SUPPLEMENTARY INFORMATION DOI: 10.1038/NGEO1924 Air sea temperature decoupling in western Europe during the
A multi-proxy study of planktonic foraminifera to identify past millennialscale. climate variability in the East Asian Monsoon and the Western Pacific
 This pdf file consists of all pages containing figures within: A multi-proxy study of planktonic foraminifera to identify past millennialscale climate variability in the East Asian Monsoon and the Western
JEAN-CLAUDE DUPLESSY, MAURICE ARNOLD, EDOUARD BARD, ANNE JUILLET-LECLERC, NEJIB KALLEL
 [RADIOCARBON, VOL 31, No. 3, 1989, P 493-521 AMS 14C STUDY OF TRANSIENT EVENTS AND OF THE VENTILATION RATE OF THE PACIFIC INTERMEDIATE WATER DURING THE LAST DEGLACIATION JEAN-CLAUDE DUPLESSY, MAURICE ARNOLD,
SUPPLEMENTARY INFORMATION
 SI #1 Sample preparation and analyses New planktonic and benthic foraminiferal radiocarbon ages were generated for late glacial and deglacial intervals from two shallow cores (Table S1). Core RR53 JPC
M. Wary et al. Correspondence to: M. Wary
 Supplement of Clim. Past, 11, 1507 1525, 2015 http://www.clim-past.net/11/1507/2015/ doi:10.5194/cp-11-1507-2015-supplement Author(s) 2015. CC Attribution 3.0 License. Supplement of Stratification of surface
Welcome to ATMS 111 Global Warming.
 Welcome to ATMS 111 Global Warming http://www.atmos.washington.edu/2010q1/111 Isotopic Evidence 16 O isotopes "light 18 O isotopes "heavy" Evaporation favors light Rain favors heavy Cloud above ice is
ATMS 321: Natural Climate Variability Chapter 11
 ATMS 321: Natural Climate Variability Chapter 11 Solar Variability: Total solar irradiance variability is relatively small about a tenth of a percent. Ultraviolet variability is larger, and so could affect
SUPPLEMENTARY INFORMATION
 doi:.38/nature777 Carbonate dissolution in TNO57-21 There are several possible ways to reconstruct the history of carbonate dissolution in marine sediments although each has potential pitfalls, such as
Muted change in Atlantic overturning circulation over some glacial-aged Heinrich events
 SUPPLEMENTARY INFORMATION DOI: 10.1038/NGEO2045 Muted change in Atlantic overturning circulation over some glacial-aged Heinrich events Jean Lynch-Stieglitz 1, Matthew W. Schmidt 2, L. Gene Henry 1,7,
The Tswaing Impact Crater, South Africa: derivation of a long terrestrial rainfall record for the southern mid-latitudes
 The Tswaing Impact Crater, South Africa: derivation of a long terrestrial rainfall record for the southern mid-latitudes T.C. PARTRIDGE Climatology Research Group, University of the Witwatersrand, Johannesburg,
The Ice Age sequence in the Quaternary
 The Ice Age sequence in the Quaternary Subdivisions of the Quaternary Period System Series Stage Age (Ma) Holocene 0 0.0117 Tarantian (Upper) 0.0117 0.126 Quaternary Ionian (Middle) 0.126 0.781 Pleistocene
Supplementary Figure 1. Foraminifer shell weights and coating composition. Correlation of mean foraminiferal shell weights of (a) G.
 G.") Supplementary Figure 1. Foraminifer shell weights and coating composition. Correlation of mean foraminiferal shell weights of (a) G. bulloides and (b) Uvigerina spp. with respective U/Ca cc+c (grey) and
Supplementary Figure 1. Foraminifer shell weights and coating composition. Correlation of mean foraminiferal shell weights of (a) G. bulloides and (b) Uvigerina spp. with respective U/Ca cc+c (grey) and
Supplementary Figure 1: Modern burial of organic carbon in deep sea sediment (gc m -2 a -1 ) 1.
 1.") Supplementary Figure 1: Modern burial of organic carbon in deep sea sediment (gc m -2 a -1 ) 1. Supplementary Figure 2: The 7 province maps used in this study. Each color corresponds to a single province:
Supplementary Figure 1: Modern burial of organic carbon in deep sea sediment (gc m -2 a -1 ) 1. Supplementary Figure 2: The 7 province maps used in this study. Each color corresponds to a single province:
24. COMPARISON OF THE PLEISTOCENE RECORDS OF THE RADIOLARIAN CYCLADOPHORA DAVISIANA AT HIGH-LATITUDE SITES OF THE DEEP SEA DRILLING PROJECT 1
 24. COMPARISON OF THE PLEISTOCENE RECORDS OF THE RADIOLARIAN CYCLADOPHORA DAVISIANA AT HIGH-LATITUDE SITES OF THE DEEP SEA DRILLING PROJECT 1 Joseph J. Morley, Lamont-Doherty Geological Observatory of
Variations in the Earth's Orbit: Pacemaker of the Ice Ages
 Variations in the Earth's Orbit: Pacemaker of the Ice Ages For 500,000 years, major climatic changes have followed variations in obliquity and precession. J. D. Hays, John Imbrie, N. J. Shackleton Science,
Nitrogen isotopic evidence for a poleward decrease in surface nitrate within the ice age Antarctic
 Quaternary Science Reviews 27 (2008) 1076 1090 Nitrogen isotopic evidence for a poleward decrease in surface nitrate within the ice age Antarctic Rebecca S. Robinson a,, Daniel M. Sigman b a Graduate School
Middle Eocene western north Atlantic biostratigraphy and environmental conditions
 Shari Hilding-Kronforst Shari Hilding-Kronforst is currently a Ph.D. candidate at Texas A&M University. Born in Illinois, she received a microscope at age 8 and dinosaur models at age 9. She completed
Ice on Earth: An overview and examples on physical properties
 Ice on Earth: An overview and examples on physical properties - Ice on Earth during the Pleistocene - Present-day polar and temperate ice masses - Transformation of snow to ice - Mass balance, ice deformation,
Speleothems and Climate Models
 Earth and Life Institute Georges Lemaître Centre for Earth and Climate Research Université catholique de Louvain, Belgium Speleothems and Climate Models Qiuzhen YIN Summer School on Speleothem Science,
Ocean & climate: an introduction and paleoceanographic perspective
 Ocean & climate: an introduction and paleoceanographic perspective Edouard BARD Chaire de l évolution du climat et de l'océan du Collège de France CEREGE, UMR CNRS, AMU, IRD, CdF Aix-en-Provence The ocean
ATOC OUR CHANGING ENVIRONMENT
 ATOC 1060-002 OUR CHANGING ENVIRONMENT Class 22 (Chp 15, Chp 14 Pages 288-290) Objectives of Today s Class Chp 15 Global Warming, Part 1: Recent and Future Climate: Recent climate: The Holocene Climate
Introduction to Quaternary Geology (MA-Modul 3223) Prof. C. Breitkreuz, SS2012, TU Freiberg
 Prof. C. Breitkreuz, SS2012, TU Freiberg") Introduction to Quaternary Geology (MA-Modul 3223) Prof. C. Breitkreuz, SS2012, TU Freiberg 1. Introduction: - Relevance, and relations to other fields of geoscience - Lower stratigraphic boundary and
Introduction to Quaternary Geology (MA-Modul 3223) Prof. C. Breitkreuz, SS2012, TU Freiberg 1. Introduction: - Relevance, and relations to other fields of geoscience - Lower stratigraphic boundary and
Father of Glacial theory. First investigations of glaciers and mountain geology,
 First investigations of glaciers and mountain geology, 1750-1800 Glaciation happens! -- Historical perspective It happens in cycles -- How do we know this? What are Milankovitch cycles? Sub-Milankovitch
lecture 12 Paleoclimate
 lecture 12 Paleoclimate OVERVIEW OF EARTH S CLIMATIC HISTORY Geologic time scales http://www.snowballearth.org/index.html Features of the climate during the Cretaceous period the land-sea distribution
Ice Ages and Changes in Earth s Orbit. Topic Outline
 Ice Ages and Changes in Earth s Orbit Topic Outline Introduction to the Quaternary Oxygen isotopes as an indicator of ice volume Temporal variations in ice volume Periodic changes in Earth s orbit Relationship
Supplemental Information for. Persistent intermediate water warming during cold stadials in the SE Nordic seas. during the last 65 kyr
 GSA DATA REPOSITORY2014248 Supplemental Information for Persistent intermediate water warming during cold stadials in the SE Nordic seas during the last 65 kyr By Mohamed M. Ezat, Tine L. Rasmussen, Jeroen
11. DATA REPORT: RELATIVE ABUNDANCE
 Gersonde, R., Hodell, D.A., and Blum, P. (Eds.) Proceedings of the Ocean Drilling Program, Scientific Results Volume 177 11. DATA REPORT: RELATIVE ABUNDANCE AND RANGES OF SELECTED DIATOMS FROM PLIOCENE
: ' N,
 PLANKTIC FORAMINIFER FAUNAL SEA SURFACE TEMPERATURE RECORDS OF THE PAST TWO GLACIAL TERMINATIONS IN THE SOUTH CHINA SEA NEAR WAN-AN SHALLOW (IMAGES CORE MD972151) ABSTRACT The South China Sea is the largest
Geochemical fingerprints of the ice-age (Southern) Ocean
 Ocean") Geochemical fingerprints of the ice-age (Southern) Ocean THE SOUTHERN OCEAN, ITS DYNAMICS, BIOGEOCHEMISTRY AND ROLE IN THE CLIMATE SYSTEM NCAR, Boulder, CO 10-13 April 2017 Bob Anderson Motivation: Ice
Geochemical fingerprints of the ice-age (Southern) Ocean THE SOUTHERN OCEAN, ITS DYNAMICS, BIOGEOCHEMISTRY AND ROLE IN THE CLIMATE SYSTEM NCAR, Boulder, CO 10-13 April 2017 Bob Anderson Motivation: Ice
Development of the Global Environment
 Development of the Global Environment G302: Spring 2004 A course focused on exploration of changes in the Earth system through geological history Simon C. Brassell Geological Sciences simon@indiana.edu
Chapter 15 Millennial Oscillations in Climate
 Chapter 15 Millennial Oscillations in Climate This chapter includes millennial oscillations during glaciations, millennial oscillations during the last 8000 years, causes of millennial-scale oscillations,
Lecture 18 Paleoceanography 2
 Lecture 18 Paleoceanography 2 May 26, 2010 Trend and Events Climatic evolution in Tertiary Overall drop of sea level General cooling (Figure 9-11) High latitude (deep-water) feature Two major step Middle
SUPPLEMENTARY INFORMATION
 SUPPLEMENTARY INFORMATION Site Information: Table S1: Sites Modern Location Modern SST ( C) PO4(µM)-0m PO4(µM)-75m 130-806 0.5N, 159.5E 29.2 0.24 0.34 *(6) 154-925 4.5N, 43.5W 27.4 0.24 0.35 *(S35) 198-1208
North Atlantic Deep Water and Climate Variability During the Younger Dryas Cold Period A.C. Elmore and J.D. Wright
 GSA DATA REPOSITORY 2011052 North Atlantic Deep Water and Climate Variability During the Younger Dryas Cold Period A.C. Elmore and J.D. Wright APPENDIX 1: Methods Data Methods: Jumbo piston core 11JPC
6. What has been the most effective erosive agent in the climate system? a. Water b. Ice c. Wind
 Multiple Choice. 1. Heinrich Events a. Show increased abundance of warm-water species of planktic foraminifera b. Show greater intensity since the last deglaciation c. Show increased accumulation of ice-rafted
SUPPLEMENTARY INFORMATION
 In the format provided by the authors and unedited. SUPPLEMENTARY INFORMATION DOI: 10.1038/NGEO2891 Warm Mediterranean mid-holocene summers inferred by fossil midge assemblages Stéphanie Samartin, Oliver
Geol. 656 Isotope Geochemistry
 STABLE ISOTOPES IN PALEOCLIMATOLOGY I INTRODUCTION At least since the classic work of Louis Agassiz in 1840, geologists have contemplated the question of how the Earth s climate might have varied in the
Biogeochemical changes over long time scales
 Biogeochemical changes over long time scales Eric Galbraith McGill University, Montreal, Canada Overview What is a long time? Long timescale observations from marine sediments Very quick look at biogeochemical
Supplementary Fig. 1. Locations of thinning transects and photos of example samples. Mt Suess/Gondola Ridge transects extended metres above
 Supplementary Fig. 1. Locations of thinning transects and photos of example samples. Mt Suess/Gondola Ridge transects extended 260 24 metres above the modern surface of Mackay Glacier, and included 16
What can we learn from the paleo record about past changes in ocean productivity and controls of atmospheric CO 2?
 What can we learn from the paleo record about past changes in ocean productivity and controls of atmospheric CO 2? QuickTime and a TIFF (Uncompressed) decompressor are needed to see this picture. Bob Anderson,
A Broecker Brief Origin of the Atlantic s glacial age lower deep water
 A Broecker Brief Origin of the Atlantic s glacial age lower deep water Today s deep Atlantic shows no hint of nutrient stratification (see Figure 1). By contrast, during the last glacial maximum (LGM),
PMIP Ocean Workshop 2013 Program Outline
 PMIP Ocean Workshop 2013 Program Outline We, Dec. 4 8:30-9:15 Introductory Discussion 9:15-10:15 Model-Data Comparison 10:30-12:00 Quantifying Uncertainties 1:00-2:30 LGM and Deglacial Changes in the Tropics
General Circulation. Nili Harnik DEES, Lamont-Doherty Earth Observatory
 General Circulation Nili Harnik DEES, Lamont-Doherty Earth Observatory nili@ldeo.columbia.edu Latitudinal Radiation Imbalance The annual mean, averaged around latitude circles, of the balance between the
Natural Climate Variability: Longer Term
 Natural Climate Variability: Longer Term Natural Climate Change Today: Natural Climate Change-2: Ice Ages, and Deep Time Geologic Time Scale background: Need a system for talking about unimaginable lengths
Overview of Glacial Atlantic Ocean Mapping (GLAMAP 2000)
") PALEOCEANOGRAPHY, VOL. 18, NO. 2, 1030, doi:10.1029/2002pa000769, 2003 Overview of Glacial Atlantic Ocean Mapping (GLAMAP 2000) M. Sarnthein, 1 R. Gersonde, 2 S. Niebler, 3 U. Pflaumann, 1 R. Spielhagen,
PALEOCEANOGRAPHY, VOL. 18, NO. 2, 1030, doi:10.1029/2002pa000769, 2003 Overview of Glacial Atlantic Ocean Mapping (GLAMAP 2000) M. Sarnthein, 1 R. Gersonde, 2 S. Niebler, 3 U. Pflaumann, 1 R. Spielhagen,
Sensitivity of the Younger Dryas climate to changes in freshwater, orbital, and greenhouse gas forcing in CESM1.
 OCE-1536630 EAR-0903071 Sensitivity of the Younger Dryas climate to changes in freshwater, orbital, and greenhouse gas forcing in CESM1. The 21 st Annual CESM Workshop Paleoclimate Working Group Taylor
Supplementary Figure S1: Separated benthic 18 O data over 5 Myr. (a) Benthic LR04 benthic 18 O stack 16 ( ) in black with seawater 18 O ( w ) in blue
 Benthic LR04 benthic 18 O stack 16 ( ) in black with seawater 18 O ( w ) in blue") Supplementary Figure S1: Separated benthic 18 O data over 5 Myr. (a) Benthic LR04 benthic 18 O stack 16 ( ) in black with seawater 18 O ( w ) in blue and temperature contribution ( T ) in green. (b) Surface-air
Supplementary Figure S1: Separated benthic 18 O data over 5 Myr. (a) Benthic LR04 benthic 18 O stack 16 ( ) in black with seawater 18 O ( w ) in blue and temperature contribution ( T ) in green. (b) Surface-air
Supporting Online Material for
 www.sciencemag.org/cgi/content/full/316/5829/1303/dc1 Supporting Online Material for 155,000 Years of West African Monsoon and Ocean Thermal Evolution Syee Weldeab,* David W. Lea, Ralph R. Schneider, Nils
Second-Order Draft Chapter 10 IPCC WG1 Fourth Assessment Report
 Second-Order Draft Chapter IPCC WG Fourth Assessment Report Figure... Multi model mean changes in a) zonal mean cloud fraction (in %), shown as a cross section though the atmosphere, and b) total cloud
SUPPLEMENTARY INFORMATION
 SUPPLEMENTARY INFORMATION (d) (e) Figure S1 Timeseries of the sea ice and overturning circulation response to a cessation of CO 2 emissions. Northern Hemisphere March sea ice cover (km 2 ), Northern Hemisphere
M. Ballarotta 1, L. Brodeau 1, J. Brandefelt 2, P. Lundberg 1, and K. Döös 1. This supplementary part includes the Figures S1 to S16 and Table S1.
 Supplementary Information: Last Glacial Maximum World-Ocean simulations at eddy-permitting and coarse resolutions: Do eddies contribute to a better consistency between models and paleo-proxies? M. Ballarotta
The North Atlantic Oscillation: Climatic Significance and Environmental Impact
 1 The North Atlantic Oscillation: Climatic Significance and Environmental Impact James W. Hurrell National Center for Atmospheric Research Climate and Global Dynamics Division, Climate Analysis Section
IODP EXPEDITION 306: NORTH ATLANTIC CLIMATE II SITE U1314 SUMMARY
 IODP EXPEDITION 306: NORTH ATLANTIC CLIMATE II SITE U1314 SUMMARY Hole U1314A Latitude: 56 21.883'N, Longitude: 27 53.309'W Hole U1314B Latitude: 56 21.896'N, Longitude: 27 53.311'W Hole U1314C Latitude:
Supporting Online Material
 Supporting Online Material Materials and Methods Planktonic foraminiferal δ 18 O and Mg/Ca Core MD97-2120 was sampled at 2 cm intervals for stable oxygen isotope analyses on Globigerina bulloides (250-355
Surface and Deep Ocean Circulation in the Subpolar North Atlantic During the Mid- Pleistocene Revolution
 University of South Florida Scholar Commons Marine Science Faculty Publications College of Marine Science 12-18-2002 Surface and Deep Ocean Circulation in the Subpolar North Atlantic During the Mid- Pleistocene
Radiocarbon LATE QUATERNARY PTEROPOD PRESERVATION IN EASTERN NORTH ATLANTIC SEDIMENTS IN RELATION TO CHANGING CLIMATE
 [RADJOCARBON, VOL. 33, NO. 3, 1991, P. 277-282] Radiocarbon 1991 LATE QUATERNARY PTEROPOD PRESERVATION IN EASTERN NORTH ATLANTIC SEDIMENTS IN RELATION TO CHANGING CLIMATE G. M. GANSSEN, S. R. TROELSTRA
Rapid Climate Change: Heinrich/Bolling- Allerod Events and the Thermohaline Circulation. By: Andy Lesage April 13, 2010 Atmos.
 Rapid Climate Change: Heinrich/Bolling- Allerod Events and the Thermohaline Circulation By: Andy Lesage April 13, 2010 Atmos. 6030 Outline Background Heinrich Event I/Bolling-Allerod Transition (Liu et
45 mm VARIABILITY OF THE BRAZIL-MALVINAS CONFLUENCE SINCE THE LAST GLACIAL MAXIMUM
 VARIABILITY OF THE BRAZIL-MALVINAS CONFLUENCE SINCE THE LAST GLACIAL MAXIMUM Cristiano M. Chiessi 1 ; Jeroen Groeneveld 2 ; Stefan Mulitza 3 ; Debora C. Redivo 1 ; Luiz F.C. Sabanay 1 chiessi@usp.br 1
Loess and dust. Jonathan A. Holmes Environmental Change Research Centre
 Loess and dust Jonathan A. Holmes Environmental Change Research Centre Why is dust important? Mineral dust is an important constituent of the solid load in Earth's atmosphere, the total atmospheric aerosol
High-resolution reconstruction of southwest Atlantic sea-ice and its role in the carbon cycle during marine isotope stages 3 and 2
 PALEOCEANOGRAPHY, VOL. 27,, doi:10.1029/2011pa002264, 2012 High-resolution reconstruction of southwest Atlantic sea-ice and its role in the carbon cycle during marine isotope stages 3 and 2 Lewis G. Collins,
We re living in the Ice Age!
 Chapter 18. Coping with the Weather: Causes and Consequences of Naturally Induce Climate Change 지구시스템의이해 We re living in the Ice Age! 1 Phanerozoic Climate 서늘해지고 더웠고 따뜻했고 3 Climate Rollercoaster 4 2 Time
/ Past and Present Climate
 MIT OpenCourseWare http://ocw.mit.edu 12.842 / 12.301 Past and Present Climate Fall 2008 For information about citing these materials or our Terms of Use, visit: http://ocw.mit.edu/terms. Ice Sheet Paleoclimatology
SUPPLEMENTARY INFORMATION
 SUPPLEMENTARY INFORMATION Extreme deepening of the Atlantic overturning circulation during deglaciation Stephen Barker, Gregor Knorr, Maryline Vautravers, Paula Diz and Luke Skinner Supplementary Information
Chapter 6. Antarctic oceanography
 Chapter 6 Antarctic oceanography The region of the world ocean bordering on Antarctica is unique in many respects. First of all, it is the only region where the flow of water can continue all around the
How is abrupt (paleo) climate change transmitted to the mid latitude Southern Hemisphere? Connecting the tropics to polar regions
 climate change transmitted to the mid latitude Southern Hemisphere? Connecting the tropics to polar regions") How is abrupt (paleo) climate change transmitted to the mid latitude Southern Hemisphere? -or - In defense of the wind hypothesis Connecting the tropics to polar regions LDEO, 2-3 June 2014 Bob Anderson
How is abrupt (paleo) climate change transmitted to the mid latitude Southern Hemisphere? -or - In defense of the wind hypothesis Connecting the tropics to polar regions LDEO, 2-3 June 2014 Bob Anderson
Today s Climate in Perspective: Hendrick Avercamp ( ) ~1608; Rijksmuseum, Amsterdam
 ~1608; Rijksmuseum, Amsterdam") Today s Climate in Perspective: Paleoclimate Evidence Hendrick Avercamp (1585-1634) ~1608; Rijksmuseum, Amsterdam Observations Instrumental surface temperature records? (Le Treut et al., 2007 IPCC AR4
Today s Climate in Perspective: Paleoclimate Evidence Hendrick Avercamp (1585-1634) ~1608; Rijksmuseum, Amsterdam Observations Instrumental surface temperature records? (Le Treut et al., 2007 IPCC AR4
Paleoclimatology ATMS/ESS/OCEAN 589. Abrupt Climate Change During the Last Glacial Period
 Paleoclimatology ATMS/ESS/OCEAN 589 Ice Age Cycles Are they fundamentaly about ice, about CO2, or both? Abrupt Climate Change During the Last Glacial Period Lessons for the future? The Holocene Early Holocene
I EOS. TRANSACfIONS. AMERICAN GEOPHYSICAL UNION Natural Variability of Arctic Sea Ice Over the Holocene
 Eos, Vol. 87, No. 28, 11 July 2006 VOLUME 87 NUMBER 28 11 JULY 2006 I EOS. TRANSACfIONS. AMERICAN GEOPHYSICAL UNION Natural Variability of Arctic Sea Ice Over the Holocene PAGES 273,275 The area and volume
Glacial-Interglacial Cycling: Ice, orbital theory, and climate. Dr. Tracy M. Quan IMCS
 Glacial-Interglacial Cycling: Ice, orbital theory, and climate Dr. Tracy M. Quan IMCS quan@marine.rutgers.edu Outline -The past - discovery of glacial periods - introduction of orbital theory -The present
A GCM Reconstruction of the Last Glacial Inception
 A GCM Reconstruction of the Last Glacial Inception Megan Essig 1, Francis Otieno 2, Robert Oglesby 1, David Bromwich 2 1 Department of Geosciences, University of Nebraska, Lincoln 2 Polar Meteorology Group,
Orbital-Scale Interactions in the Climate System. Speaker:
 Orbital-Scale Interactions in the Climate System Speaker: Introduction First, many orbital-scale response are examined.then return to the problem of interactions between atmospheric CO 2 and the ice sheets
Quarternary Climate Variations
 Quarternary Climate Variations EAS 303 Lecture 34 Background and History Louis Agassiz (1840): recognition of Ice Ages Harold Urey (1947): The Thermodynamic Properties of Isotopic Substances calculated
Lake Levels and Climate Change in Maine and Eastern North America during the last 12,000 years
 Maine Geologic Facts and Localities December, 2000 Lake Levels and Climate Change in Maine and Eastern North America during the last 12,000 years Text by Robert A. Johnston, Department of Agriculture,
Outline 23: The Ice Ages-Cenozoic Climatic History
 Outline 23: The Ice Ages-Cenozoic Climatic History Continental Glacier in Antarctica Valley Glaciers in Alaska, note the moraines Valley Glaciers in Alaska, note the moraines Mendenhall Glacier, Juneau,
Underlying causes for long-term global ocean δ 13 C fluctuations over the last 1.20 Myr
 Earth and Planetary Science Letters 248 (2006) 15 29 www.elsevier.com/locate/epsl Underlying causes for long-term global ocean δ 13 C fluctuations over the last 1.20 Myr B.A.A. Hoogakker a,, E.J. Rohling
C
 C 0.8 0.4 0.2 0.0-0.2-0.6 Fig. 1. SST-wind relation in the North Pacific and Atlantic Oceans. Left panel: COADS SST (color shade), surface wind vectors, and SLP regressed upon the Pacific Decadal Oscillation
8. Climate changes Short-term regional variations
 8. Climate changes 8.1. Short-term regional variations By short-term climate changes, we refer here to changes occurring over years to decades. Over this timescale, climate is influenced by interactions
In the new age model developed for MD , vegetation-derived climatic phases
 GSA DATA REPOSITORY 2012185 Sánchez Goñi et al. 1 2 3 4 5 6 7 8 9 10 11 12 13 14 SUPPLEMENTAL INFORMATION Methods Age model In the new age model developed for MD04-2845, vegetation-derived climatic phases
Tracers. 1. Conservative tracers. 2. Non-conservative tracers. Temperature, salinity, SiO 2, Nd, 18 O. dissolved oxygen, phosphate, nitrate
 Tracers 1. Conservative tracers Temperature, salinity, SiO 2, Nd, 18 O 2. Non-conservative tracers dissolved oxygen, phosphate, nitrate Temperature itself is a tracer but other tracers (like oxygen isotopes)
SUPPLEMENTARY INFORMATION
 1. Simulation of Glacial Background Climate Globally averaged surface air is 3 K cooler than in the pre-industrial simulation. This is less than the 4-7 K cooling estimated for the Last Glacial Maximum
software (version 6.1.0, and the Marine09 calibration curve (reservoir age of 400 a).
.") Supplementary Material Table S1: 14 C-AMS dates in cores GeoB3938-1 and GeoB7010-2 Radiocarbon age Calendar age 1 Core Sample Species Depth Mean 1 std dev Mean 1 std dev (cm) (a BP) (a BP) (a BP) (a BP)
Supplementary Material Table S1: 14 C-AMS dates in cores GeoB3938-1 and GeoB7010-2 Radiocarbon age Calendar age 1 Core Sample Species Depth Mean 1 std dev Mean 1 std dev (cm) (a BP) (a BP) (a BP) (a BP)
Chp Spectral analysis a. Requires that the climate record must be at least 4 times longer than the cycled analyzed
 Chp 7 1. Earth s seasons are caused by a. The movement of the Sun from North to South of the equator and back again over a year s time b. The distance between Earth and the Sun c. The rate of Earth s movement
Arctic Paleoclimates
 Arctic Paleoclimates The geologic time scale [from the Geological Society of America, product code CTS004, compiled by A.R. Palmer and J. Geissman, by permission of Geological Society of America]. Paleoclimate
Results of oceanographic analyses conducted under JARPA and possible evidence of environmental changes.
 SC/D06/J30 Results of oceanographic analyses conducted under JARPA and possible evidence of environmental changes. Tomowo Watanabe*, Takashi Yabuki**, Toshio Suga**, Kimio Hanawa**, Koji Matsuoka*** and
Fast and Slow Response of Sea ice and the Southern Ocean to Ozone Depletion
 Fast and Slow Response of Sea ice and the Southern Ocean to Ozone Depletion Annual Minimum Sea ice extent 1979-2013 10 6 km 2 Arctic September Antarctic February Data from in passive microwave satellite
Chapter outline. Reference 12/13/2016
 Chapter 2. observation CC EST 5103 Climate Change Science Rezaul Karim Environmental Science & Technology Jessore University of science & Technology Chapter outline Temperature in the instrumental record
Natural and anthropogenic climate change Lessons from ice cores
 Natural and anthropogenic climate change Lessons from ice cores Eric Wolff British Antarctic Survey, Cambridge ewwo@bas.ac.uk ASE Annual Conference 2011; ESTA/ESEU lecture Outline What is British Antarctic
Ruddiman CHAPTER 13. Earth during the LGM ca. 20 ka BP
 Ruddiman CHAPTER 13 Earth during the LGM ca. 20 ka BP The Last Glacial Maximum When? How much more ice than today? How much colder was it than today (global average)? How much lower were snowlines? Did
From Isotopes to Temperature: Using Ice Core Data!
 From Isotopes to Temperature: Using Ice Core Data! Spruce W. Schoenemann schoes@uw.edu UWHS Atmospheric Sciences 211 May 2013 Dept. of Earth and Space Sciences University of Washington Seattle http://www.uwpcc.washington.edu
Tropical Pacific responses to Neogene Andean uplift and highlatitude. Ran Feng and Chris Poulsen University of Michigan
 Tropical Pacific responses to Neogene Andean uplift and highlatitude sea ice expansion Ran Feng and Chris Poulsen University of Michigan Reconstructions of Neogene equatorial Pacific SSTs SST difference
Deep Ocean Circulation & implications for Earth s climate
 Deep Ocean Circulation & implications for Earth s climate I. Ocean Layers and circulation types 1) Ocean Layers Ocean is strongly Stratified Consists of distinct LAYERS controlled by density takes huge
SUPPLEMENTARY INFORMATION
 SUPPLEMENTARY INFORMATION Supplementary Materials and Methods Stable isotope analyses Where possible two or three separate analyses of different benthic species were made in each sample; a correction factor
Antarctic sea-ice expansion between 2000 and 2014 driven by tropical Pacific decadal climate variability
 Antarctic sea-ice expansion between 2000 and 2014 driven by tropical Pacific decadal climate variability Gerald A. Meehl 1, Julie M. Arblaster 1,2, Cecilia M. Bitz 3, Christine T.Y. Chung 4, and Haiyan
Supporting Information for Glacial Atlantic overturning increased by wind stress in climate models
 GEOPHYSICAL RESEARCH LETTERS Supporting Information for Glacial Atlantic overturning increased by wind stress in climate models Juan Muglia 1 and Andreas Schmittner 1 Contents of this file 1. Figures S1
1. Introduction 2. Ocean circulation a) Temperature, salinity, density b) Thermohaline circulation c) Wind-driven surface currents d) Circulation and
 Temperature, salinity, density b) Thermohaline circulation c) Wind-driven surface currents d) Circulation and") 1. Introduction 2. Ocean circulation a) Temperature, salinity, density b) Thermohaline circulation c) Wind-driven surface currents d) Circulation and climate change e) Oceanic water residence times 3.
1. Introduction 2. Ocean circulation a) Temperature, salinity, density b) Thermohaline circulation c) Wind-driven surface currents d) Circulation and climate change e) Oceanic water residence times 3.
MERIDIONAL OVERTURNING CIRCULATION: SOME BASICS AND ITS MULTI-DECADAL VARIABILITY
 MERIDIONAL OVERTURNING CIRCULATION: SOME BASICS AND ITS MULTI-DECADAL VARIABILITY Gokhan Danabasoglu National Center for Atmospheric Research OUTLINE: - Describe thermohaline and meridional overturning
Broecker Brief #7. June As shown in Figure 1, although similar, the shape for the atmospheric CO 2 content record
 Broecker Brief #7 Elements of the last glacial cycle CO 2 decline and recovery Introduction: June 2017 In an attempt to distinguish between the two major means by which the atmosphere s CO 2 content was