Langdurige metingen Deurganckdok: Opvolging en analyse aanslibbing
|
|
|
- Arthur Carroll
- 5 years ago
- Views:
Transcription


1 VLAAMSE OVERHEID DEPARTEMENT MOBILITEIT EN OPENBARE WERKEN WATERBOUWKUNDIG LABORATORIUM Langdurige metingen Deurganckdok: Opvolging en analyse aanslibbing Bestek 16EB/05/04 Survey vessel Veremans (left) & Deurganckdok (right) Deelrapport u meting springtij ingang Deurganck 22/03/ Veremans Report 2.3 Through Tide Measurement Sediview springtide 22/03/2006 Veremans 30 January 2007 I/RA/11283/06.110/BDC i.s.m. en International Marine and Dredging Consultants (IMDC) Wilrijkstraat Bus Antwerpen België tel: fax: info@imdc.be
2
3 IMDC NV i.s.m. WL Delft Hydraulics Opvolging aanslibbing Deurganckdok en Gems Report 2.3 Through Tide Measurement Sediview Springtide 22/03/06 Veremans Document Identification Document Control Sheet Title: Deelrapport 2.3: 13u meting springtij- ingang Deurganckdok 22/03/ Veremans Project: Langdurige metingen Deurganckdok: Opvolging en analyse aanslibbing Client Waterbouwkundig Laboratorium File reference: I/RA/11283/06.110/BDC File name K:\PROJECTS\11\ Opvolging aanslibbing dgd\10- Rap\RA06110_BDC_22maa\RA06_ _BDCv20.doc Revisions Version Date Author Description /01/07 BDC Final Version /10/06 BDC Concept Distribution List Name # ex. Company/authorities Position in reference to the project Joris Vanlede 1 Waterbouwkundig Laboratorium Approval Version Date Author Project manager Commissioner /01/07 BDC MSA MSA /10/06 BDC MSA MSA I/RA/11283/06.110/BDC I versie /01/07
4
5 IMDC NV i.s.m. WL Delft Hydraulics Opvolging aanslibbing Deurganckdok en Gems Report 2.3 Through Tide Measurement Sediview Springtide 22/03/06 Veremans TABLE OF CONTENTS 1. INTRODUCTION THE ASSIGNMENT PURPOSE OF THE STUDY OVERVIEW OF THE STUDY Reports Measurement actions STRUCTURE OF THE REPORT THE MEASUREMENT CAMPAIGN OVERVIEW OF THE STUDIED PARAMETERS DESCRIPTION OF THE MEASUREMENT CAMPAIGN ON MARCH 22 ND THE EQUIPMENT ADCP OBS - CTD Pump Sampler COURSE OF THE MEASUREMENTS MEASUREMENT PERIODS HYDRO-METEOROLOGICAL CONDITIONS DURING THE MEASUREMENT CAMPAIGN Vertical tide during the measurements Meteorological data NAVIGATION INFORMATION REMARKS ON DATA PROCESSING OF DATASETS CALIBRATION OF THE TURBIDITY SENSORS METHODOLOGY OF PROCESSING OF THE ADCP DATA WITH SEDIVIEW Acoustic backscatter theory Water sampling and transect sailing Calibration for suspended sediment concentration within Sediview Sediview configuration Output PRELIMINARY ANALYSIS OF THE DATA MARCH 22 ND 2006 SURVEY INTERCOMPARISON WITH EARLIER SURVEY ON NOVEMBER 17 TH REFERENCES I/RA/11283/06.110/BDC II versie /01/07
6 IMDC NV i.s.m. WL Delft Hydraulics Opvolging aanslibbing Deurganckdok en Gems Report 2.3 Through Tide Measurement Sediview Springtide 22/03/06 Veremans APPENDICES APPENDIX A. OVERVIEW OF MEASUREMENTS...A-1 A.1 OVERVIEW OF THE MEASUREMENT LOCATIONS FOR THE WHOLE HCBS2 MEASUREMENT CAMPAIGN...A-2 A.2 OVERVIEW OF ALL MEASUREMENT LOCATIONS HCBS MEASUREMENT CAMPAIGN 21/3-23/3...A-6 A.3 MEASUREMENT OVERVIEW DEURGANCKDOK 22/03/ A-7 APPENDIX B. TIDAL DATA... B-1 APPENDIX C. NAVIGATION INFORMATION AS RECORDED ON SITE...C-1 APPENDIX D. CALIBRATION AND CROSS-CALIBRATION GRAPHS FOR OBS DATA D-1 APPENDIX E. UNESCO PPS-78 FORMULA FOR CALCULATING SALINITY... E-1 APPENDIX F. CONTOURPLOTS OF FLOW VELOCITIES, SEDIMENT CONCENTRATION AND SEDIMENT FLUX PER SAILED TRANSECT... F-1 APPENDIX G. DISCHARGE AND SEDIMENT FLUX FOR THE TOTAL CROSS-SECTIONG-1 APPENDIX H. TEMPORAL VARIATION OF TOTAL FLUX AND TOTAL DISCHARGE H-1 APPENDIX I. HCBS2 REPORTS WINTER CAMPAIGN... I-4 I/RA/11283/06.110/BDC III versie /01/07
7 IMDC NV i.s.m. WL Delft Hydraulics Opvolging aanslibbing Deurganckdok en Gems Report 2.3 Through Tide Measurement Sediview Springtide 22/03/06 Veremans LIST OF TABLES TABLE 1-1: OVERVIEW OF DEURGANCKDOK REPORTS... 3 TABLE 2-1TRANSECT OF THE FLOW MEASUREMENTS (UTM31 ED50)... 9 TABLE 2-2: POSITIONS OF THE CALIBRATION POINTS FOR MARCH 22 ND 2006 AT DEURGANCKDOK... 9 TABLE 2-3: MAIN CONFIGURATION SETTINGS OF ADCP 600KHZ WORKHORSE TABLE 3-1: HIGH AND LOW TIDE AT HANDSWEERT, LIEFKENSHOEK AND SCHELLE ON 22/03/ TABLE 3-2: COMPARISION OF THE TIDAL CHARACTERISTICS OF 22/03/2006 WITH THE AVERAGE TIDE, THE AVERAGE NEAP TIDE AND THE AVERAGE SPRING TIDE OVER THE DECADE FOR LIEFKENSHOEK (LIE) AND SCHELLE (SCH) 12 TABLE 4-1: EXTRAPOLATION METHODS FOR TOP AND BOTTOM VARIABLES TABLE 4-2: REFERENCE POINTS AT THE END OF THE MUD FLATS ON LEFT AND RIGHT BANK LIST OF FIGURES FIGURE 2-1: ELEMENTS OF THE SEDIMENT BALANCE... 5 FIGURE 2-2: DETERMINING A SEDIMENT BALANCE... 6 FIGURE 2-3: TRANSPORT MECHANISMS... 7 FIGURE 2-4: MAP OF SAILED TRANSECT AND CALIBRATION POINTS... 9 FIGURE 4-1: UNMEASURED REGIONS IN THE CROSS SECTION (FROM RD INSTRUMENTS, 2003) FIGURE 4-2: MEASURED AND ESTIMATED DISCHARGES AND SEDIMENT FLUXES WITHIN SEDIVIEW (DRL, 2005).. 16 FIGURE 4-3: BOTTOM ESTIMATE OF THE SEDIMENT CONCENTRATION FIGURE 5-1: A) PERPENDICULAR CURRENT VELOCITY ON 22/03/2006 AND B) ON 17/11/2005 C) SUSPENDED SEDIMENT CONCENTRATION ON 22/03/2006 AND D) ON 17/11/2005) AT 3H AFTER HIGH WATER FIGURE 5-2: A) PERPENDICULAR CURRENT VELOCITY ON 22/03/2006 AND B) ON 17/11/2005 C) SUSPENDED SEDIMENT CONCENTRATION ON 22/03/2006 AND D) ON 17/11/2005) AT 1H AFTER HIGH WATER I/RA/11283/06.110/BDC IV versie /01/07
8 IMDC NV i.s.m. WL Delft Hydraulics Opvolging aanslibbing Deurganckdok en Gems Report 2.3 Through Tide Measurement Sediview Springtide 22/03/06 Veremans 1. INTRODUCTION 1.1. The assignment This report is part of the set of reports describing the results of the long-term measurements conducted in Deurganckdok aiming at the monitoring and analysis of silt accretion. This measurement campaign is an extension of the study Extension of the study about density currents in the Beneden Zeeschelde as part of the Long Term Vision for the Scheldt estuary. It is complementary to the study Field measurements high-concentration benthic suspensions (HCBS 2) 1. The terms of reference for this study were prepared by the Departement Mobiliteit en Openbare Werken van de Vlaamse Overheid, Afdeling Waterbouwkundig Laboratorium (16EB/05/04). The repetition of this study was awarded to International Marine and Dredging Consultants NV in association with WL Delft Hydraulics and Gems International on 10/01/2006. Waterbouwkundig Laboratorium Cel Hydrometrie Schelde provided data on discharge, tide, salinity and turbidity along the river Scheldt and provided survey vessels for the long term and through tide measurements. Afdeling Maritieme Toegang provided maintenance dredging data. Agentschap voor Maritieme Dienstverlening en Kust Afdeling Kust and Port of Antwerp provided depth sounding measurements. The execution of the study involves a twofold assignment: Part 1: Setting up a sediment balance of Deurganckdok covering a period of one year Part 2: An analysis of the parameters contributing to siltation in Deurganckdok 1.2. Purpose of the study The Lower Sea Scheldt (Beneden Zeeschelde) is the stretch of the Scheldt estuary between the Belgium-Dutch border and Rupelmonde, where the entrance channels to the Antwerp sea locks are located. The navigation channel has a sandy bed, whereas the shallower areas (intertidal areas, mud flats, salt marshes) consist of sandy clay or even pure mud sometimes. This part of the Scheldt is characterized by large horizontal salinity gradients and the presence of a turbidity maximum with depth-averaged concentrations ranging from 50 to 500 mg/l at grain sizes of µm. The salinity gradients generate significant density currents between the river and the entrance channels to the locks, causing large siltation rates. It is to be expected that in the near future also the Deurganckdok will suffer from such large siltation rates, which may double the amount of dredging material to be dumped in the Lower Sea Scheldt. Results from the study may be interpreted by comparison with results from the HCBS and HCBS2 studies covering the whole Lower Sea Scheldt. These studies included through-tide measurement campaigns in the vicinity of Deurganckdok and long term measurements of turbidity and salinity in and near Deurganckdok. The first part of the study focusses on obtaining a sediment balance of Deurganckdok. Aside from natural sedimentation, the sediment balance is influenced by the maintenance and capital dredging works. This involves sediment influx from capital dredging works in the Deurganckdok, and internal relocation and removal of sediment by maintenance dredging works. To compute a sediment 1 Uitbreiding studie densiteitsstromingen in de Beneden Zeeschelde in het kader van LTV Meetcampagne naar hooggeconcentreerde slibsuspensies I/RA/11283/06.110/BDC 1 versie /01/07
9 IMDC NV i.s.m. WL Delft Hydraulics Opvolging aanslibbing Deurganckdok en Gems Report 2.3 Through Tide Measurement Sediview Springtide 22/03/06 Veremans balance an inventory of bathymetric data (depth soundings), density measurements of the deposited material and detailed information of capital and maintenance dredging works will be made up. The second part of the study is to gain insight in the mechanisms causing siltation in Deurganckdok, it is important to follow the evolution of the parameters involved, and this on a long and short term basis (long term & through-tide measurements). Previous research has shown the importance of water exchange at the entrance of Deurganckdok is essential for understanding sediment transport between the dock and the Scheldt river Overview of the study Reports Reports of the project Opvolging aanslibbing Deurganckdok are summarized in Table 1-1. Reports of the measurement campaign HCBS2 for which the winter campaign has been carried out simultaniously with measurements in this report are listed in APPENDIX I. I/RA/11283/06.110/BDC 2 versie /01/07
10 IMDC NV i.s.m. WL Delft Hydraulics Opvolging aanslibbing Deurganckdok en Gems Report 2.3 Through Tide Measurement Sediview Springtide 22/03/06 Veremans Table 1-1: Overview of Deurganckdok Reports Report Description Sediment Balance: Bathymetry surveys, Density measurements, Maintenance and construction dredging activities Sediment Balance: Three monthly report 1/4/ /06/ (I/RA/11283/06.113/MSA) Sediment Balance: Three monthly report 1/7/ /09/2006 (I/RA/11283/06.114/MSA) Sediment Balance: Three monthly report 1/10/ /12/2006 (I/RA/11283/06.115/MSA) Sediment Balance: Three monthly report 1/1/ /03/2007 (I/RA/11283/06.116/MSA) 1.5 Annual Sediment Balance (I/RA/11283/06.117/MSA) 1.6 Sediment balance Bathymetry: /2006 (I/RA/11283/06.118/MSA) Factors contributing to salt and sediment distribution in Deurganckdok: Salt-Silt (OBS3A) & Frame measurements, Through tide measurements (SiltProfiling & ADCP) Through tide measurement Siltprofiler 21/03/2006 Laure Marie 2.1 (I/RA/11283/06.087/WGO) 2.2 Through tide measurement Siltprofiler Autumn 26-29/09/2006 (I/RA/11283/06.068/MSA) Through tide measurement Sediview spring tide 22/03/2006 Veremans (I/RA/11283/06.110/BDC) Through tide measurement Sediview spring tide 26-29/09/2006 (I/RA/11283/06.119/MSA) Through tide measurement Sediview neap tide (to be scheduled) (I/RA/11283/06.120/MSA) 2.6 Salt-Silt distribution Deurganckdok 13/3/ /05/2006 (I/RA/11283/06.121/MSA) 2.7 Salt-Silt distribution Deurganckdok 15/07/ /10/2006 (I/RA/11283/06.122/MSA) 2.8 Salt-Silt distribution Deurganckdok 15/01/ /03/2007 (I/RA/11283/06.123/MSA) Boundary Conditions: Upriver Discharge, Salt concentration Scheldt, Bathymetric evolution in access channels, dredging activities in Lower Sea Scheldt and access channels Boundary conditions: Three monthly report 1/4/ /06/ (I/RA/11283/06.124/MSA) Boundary conditions: Three monthly report 1/7/ /09/2006 (I/RA/11283/06.125/MSA) Boundary conditions: Three monthly report 1/10/ /12/2006 (I/RA/11283/06.126/MSA) Boundary conditions: Three monthly report 1/1/ /03/2007 (I/RA/11283/06.127/MSA) 3.5 Boundary condtions: Annual report (I/RA/11283/06.128/MSA) I/RA/11283/06.110/BDC 3 versie /01/07
11 IMDC NV i.s.m. WL Delft Hydraulics Opvolging aanslibbing Deurganckdok en Gems Report 2.3 Through Tide Measurement Sediview Springtide 22/03/06 Veremans Report Description Analysis 4 Analysis of Siltation Processes and Factors (I/RA/11283/06.129/MSA) Measurement actions Following measurements have been carried out during the course of this project: 1. Monitoring upstream discharge in the Scheldt river 2. Monitoring Salt and sediment concentration in the Lower Sea Scheldt taken from on permanent data acquisition sites at Lillo, Oosterweel and up- and downstream of the Deurganckdok. 3. Long term measurement of salt distribution in Deurganckdok. 4. Long term measurement of sediment concentration in Deurganckdok 5. Monitoring near-bed processes in the central trench in the dock, near the entrance as well as near the landward end: near-bed turbidity, near-bed current velocity and bed elevation variations are measured from a fixed frame placed on the dock s bed. 6. Measurement of current, salt and sediment transport at the entrance of Deurganckdok for which ADCP backscatter intensity over a full cross section are calibrated with the Sediview procedure and vertical sediment and salt profiles are recorded with the SiltProfiler equipment 7. Through tide measurements of vertical sediment concentration profiles -including near bed highly concentrated suspensions- with the SiltProfiler equipment. Executed over a grid of points near the entrance of Deurganckdok. 8. Monitoring dredging activities at entrance channels towards the Kallo, Zanvliet and Berendrecht locks 9. Monitoring dredging and dumping activities in the Lower Sea Scheldt In situ calibrations were conducted on several dates to calibrate all turbidity and conductivity sensors Structure of the report This report is the factual data report of the through tide measurements at Deurganckdok on the 22 th of March, The first chapter comprises an introduction. The second chapter describes the measurement campaign and the equipment. Chapter 3 describes the course of the actual measurements. The measurement results and processed data are presented in Chapter 4, whereas chapter 5 gives a preliminary analysis of the data. I/RA/11283/06.110/BDC 4 versie /01/07
12 IMDC NV i.s.m. WL Delft Hydraulics Opvolging aanslibbing Deurganckdok en Gems Report 2.3 Through Tide Measurement Sediview Springtide 22/03/06 Veremans 2. THE MEASUREMENT CAMPAIGN 2.1. Overview of the studied parameters The first part of the study aims at determining a sediment balance of Deurganckdok and the net influx of sediment. The sediment balance comprises a number of sediment transport modes: deposition, influx from capital dredging works, internal replacement and removal of sediments due to maintenance dredging (Figure 2-1). Figure 2-1: Elements of the sediment balance A net deposition can be calculated from a comparison with a chosen initial condition t 0 (Figure 2-2). The mass of deposited sediment is determined from the integration of bed density profiles recorded at grid points covering the dock. Subtracting bed sediment mass at t 0 leads to the change in mass of sediments present in the dock (mass growth). Adding cumulated dry matter mass of dredged material removed since t 0 and subtracting any sediment influx due to capital dredging works leads to the total cumulated mass entered from the Scheldt river since t 0. I/RA/11283/06.110/BDC 5 versie /01/07

13 IMDC NV i.s.m. WL Delft Hydraulics Opvolging aanslibbing Deurganckdok en Gems Report 2.3 Through Tide Measurement Sediview Springtide 22/03/06 Veremans Figure 2-2: Determining a sediment balance The main purpose of the second part of the study is to gain insight in the mechanisms causing siltation in Deurganckdok. The following mechanisms will be aimed at in this part of the study: Tidal prism, i.e. the extra volume in a water body due to high tide Vortex patterns due to passing tidal current Density currents due to salt gradient between the Scheldt river and the dock Density currents due to highly concentrated benthic suspensions I/RA/11283/06.110/BDC 6 versie /01/07
14 IMDC NV i.s.m. WL Delft Hydraulics Opvolging aanslibbing Deurganckdok en Gems Report 2.3 Through Tide Measurement Sediview Springtide 22/03/06 Veremans Figure 2-3: Transport mechanisms These aspects of hydrodynamics and sediment transport have been landmark in determining the parameters to be measured during the project. Measurements will be focussed on three types of timescales: one tidal cycle, one neap-spring cycle and seasonal variation within one year. Following data are being collected to understand these mechanisms: Monitoring upstream discharge in the Scheldt river. Monitoring Salt and sediment concentration in the Lower Sea Scheldt at permanent measurement locations at Lillo, Oosterweel, up- and downstream of the Deurganckdok. Long term measurement of salt and suspended sediment distribution in Deurganckdok. Monitoring near-bed processes (current velocity, turbidity, and bed elevation variations) in the central trench in the dock, near the entrance as well as near the current deflecting wall location. Dynamic measurements of current, salt and sediment transport at the entrance of Deurganckdok. Through tide measurements of vertical sediment concentration profiles -including near bed high concentrated benthic suspensions. Monitoring dredging activities at entrance channels towards the Kallo, Zandvliet and Berendrecht locks as well as dredging and dumping activities in the Lower Sea Scheldt. I/RA/11283/06.110/BDC 7 versie /01/07
15 IMDC NV i.s.m. WL Delft Hydraulics Opvolging aanslibbing Deurganckdok en Gems Report 2.3 Through Tide Measurement Sediview Springtide 22/03/06 Veremans 2.2. Description of the measurement campaign on March 22 nd Flow velocity, Turbidity, Salinity and Temperature measurements were conducted on the 22th of March from 8h30 MET until 21h15 MET. The purpose of the measurements was to determine the cross-section distribution of the suspended sediment concentration, the sediment flux and flow velocity during a complete tidal cycle. For measurements in Deurganckddok the terms left bank and right bank will be used to address the North quay wall and South quay wall respectively. From the survey vessel Veremans a measurement cycle was completed every 15 minutes. The vessel with a mounted ADCP sailed a fixed transect from the left bank to the right bank and vice versa (Table 2-1). Profiles were gathered to calibrate the ADCP transects for temperature, salinity and suspended sediment concentration to be used in Sediview. Two calibration profiles were collected for each transect (Table 2-2): One before sailing the transect at the bank where the start of the transect was (Left bank during the flood; Right bank during the ebb) One after sailing the transect at the bank where the transect ended (Right bank during flood, left bank during the ebb). During these calibrations, a fish with a CTD-OBS was lowered to the bottom. The downcast was interrupted at two depths, one in the upper half of the water column (between 4 and 7 m from the water surface), and one at 4 meters above the bottom. At these depths samples were taken for calibration, and are used as ground truth for all suspended sediment concentration measurements (OBS and Sediview). The other instruments logged continuously during the downcast. Conductivity, Temperature and Depth was logged by the CTD-probe, while turbidity was recorded by the OBS. I/RA/11283/06.110/BDC 8 versie /01/07
16 IMDC NV i.s.m. WL Delft Hydraulics Opvolging aanslibbing Deurganckdok en Gems Report 2.3 Through Tide Measurement Sediview Springtide 22/03/06 Veremans Table 2-1Transect of the Flow Measurements (UTM31 ED50) Measurement location Left Bank Easting Left Bank Northing Right Bank Easting Right Bank Northing Avg Length [m] Avg Course [degr.] Transect DGD Measurement point Figure 2-4: Map of sailed transect and calibration points Table 2-2: Positions of the calibration points for March 22 nd 2006 at Deurganckdok. Bank Easting (UTM31 ED50) Northing (UTM31 ED50) Flood DGDau Left DGDbu Right DGDad DGDbd Left Right Ebb I/RA/11283/06.110/BDC 9 versie /01/07
17 IMDC NV i.s.m. WL Delft Hydraulics Opvolging aanslibbing Deurganckdok en Gems Report 2.3 Through Tide Measurement Sediview Springtide 22/03/06 Veremans 2.3. The equipment ADCP The current measurements were conducted using an RD Instruments ADCP 600 khz Workhorse. For positioning the dgps onboard the vessel Veremans was used. For the measurement of the heading a gyrocompass was installed. This 600 KHz ADCP system was mounted on a steel pole underneath the central axis of the vessel The transducer set was looking vertically downwards to the bottom. Transceiver unit and computer system were connected to peripherals such as the differential GPS-receiver, the heave compensator and the gyrocompass. During the measurements the ADCP constantly measured upstream from the vessel. The acquisition software of Winriver was used. The main settings are given in Table 2-3. Correction on acoustic attenuation is carried out afterwards in Sediview by using vertical salinity profiles OBS - CTD Table 2-3: Main Configuration Settings of ADCP 600kHz Workhorse Main configuration settings: Cell depth : 0.5 m Number of Water pings per ensemble: 2 Number of Bottom Track pings per ensemble: 2 Time between ensembles: 0 Averaging: None Speed of Sound: Fixed 1500 m/s Salinity 0 psu 3-beam solution: enabled A D&A type OBS 5 was used to measure depth, conductivity, temperature and turbidity. Measured parameters by the OBS 5 sensor: temperature ( C), conductivity (µs/cm), absolute pressure (m), turbidity (NTU) On the Veremans, the OBS 3A device was mounted on a towfish. The resulting record is filled-up with GPS-time, sample number, and planimetric position of the GPS-receiver. CTD-data are logged together with GPS-time reference (UTC). Sampling frequency is 1 reading per second. The technical details on the ADCP and CTD-OBS are described in IMDC (2006a) Pump Sampler A water sampler was attached nearby the turbidity sensor taking water samples. Samples were collected in 1 litre sampling bottles. The pumping speed of the water sampler was tested at the start of the measurement campaign on board. Dye was used to time the duration between the intake of the dye and exit at the sampling end of the sampler on board. The duration between intake and exit at the end was 32 seconds. I/RA/11283/06.110/BDC 10 versie /01/07
18 IMDC NV i.s.m. WL Delft Hydraulics Opvolging aanslibbing Deurganckdok en Gems Report 2.3 Through Tide Measurement Sediview Springtide 22/03/06 Veremans 3. COURSE OF THE MEASUREMENTS 3.1. Measurement periods At Deurganckdok ADCP tracks were sailed once every 15 minutes for 13 hours, in total 50 crosssections. Calibration profiles were taken at 2 locations (left bank, right bank). During every cycle, 1 calibration profile was taken serving as the second calibration of the previous transect and as the first calibration point of the current transect, resulting in a total of 53 profiles. APPENDIX A gives the start and end points of the tracks, the sailed length and the course Hydro-meteorological conditions during the measurement campaign Vertical tide during the measurements The vertical tide was measured at the Hansweert, Liefkenshoek and Schelle tidal gauges. Graphs of the tide at Hansweert, Liefkenshoek and Schelle on the 22 th of March can be found in APPENDIX B. Table 3-1 gives the most important characteristics (high and low tide) of the tide at those gauges on the 22 th of March Table 3-1: High and low tide at Handsweert, Liefkenshoek and Schelle on 22/03/2006 Time [hh:mm MET] Water level [m TAW] Hansweert Liefkenshoek Schelle Hansweert Liefkenshoek Schelle 22/03/2006 LW (1) 00:50 01:50 02: HW (2) 07:20 07:40 08: LW (3) 13:20 14:00 15: HW (4) 19:30 20:10 21: In the tidal characteristics of the tide on the 22 th of March are compared to the average tide over the decade (AMT, 2003). I/RA/11283/06.110/BDC 11 versie /01/07
19 IMDC NV i.s.m. WL Delft Hydraulics Opvolging aanslibbing Deurganckdok en Gems Report 2.3 Through Tide Measurement Sediview Springtide 22/03/06 Veremans Table 3-2: Comparision of the tidal characteristics of 22/03/2006 with the average tide, the average neap tide and the average spring tide over the decade for Liefkenshoek (Lie) and Schelle (Sch) Water level [mtaw] Neap Tide Avg Tide Spring Tide Tide ( ) ( ) ( ) 21/03/2006 Han Lie Sch Han Lie Sch Han Lie Sch Han Lie Sch LW (1) HW (2) LW (3) HW (4) Tidal difference [m] Han Lie Sch Han Lie Sch Han Lie Sch Han Lie Sch Rising (1 2) Falling (2 3) Rising (3 4) Duration [hh:mm] Han Lie Sch Han Lie Sch Han Lie Sch Han Lie Sch Rising (1 2) 6:14 5:59 5:53 6:02 5:34 5:30 5:54 5:16 5:15 6:10 5:50 5:40 Falling (2 3) 6:25 6:40 6:46 6:23 6:50 6:55 6:26 7:02 7:04 6:10 6:30 6:40 Rising (3 4) :10 5:50 5:40 Tide (1 3) 12:39 12:39 12:39 12:25 12:24 12:25 12:20 12:18 12:19 12:20 12:20 12:20 Tide (2 4) :20 12:20 12:20 Tidal coefficient Han Lie Sch Han Lie Sch Han Lie Sch Han Lie Sch Rising (1 2) Falling (2 3) Rising (3 4) The tidal coefficients from 0.85 up to 0.92 for the measured tide of the 22 nd of March indicate that this tide has a smaller tidal range than the average tide for the decade of Meteorological data Meteorological data at Deurne meteorological station for 22/03/2006 was obtained from KMI (Koninklijk Meteorologisch Instituut = Royal Meteorological Institute of Belgium). On the 22th of March 2006, the air temperature varied between 1.2 and 7.6 C. The wind blew from NNE-NE at an average velocity of 14 km/h. The sky was almost clear and no rainfall occured Navigation information An overview of the navigation at the measurement location is given in APPENDIX C. I/RA/11283/06.110/BDC 12 versie /01/07
20 IMDC NV i.s.m. WL Delft Hydraulics Opvolging aanslibbing Deurganckdok en Gems Report 2.3 Through Tide Measurement Sediview Springtide 22/03/06 Veremans 3.4. Remarks on data Data covering four transects is shown only partially in contour plots in APPENDIX F due to rejected measured profiles. This rejection has been the result of unacceptable error levels caused by high vessel speeds compared to the current velocity. The discharge and sediment flux during the measurement of these specific transects have not been incorporated in flux and discharge timeseries plots and tables. Transects for which such event occurred are those with serial numbers 2056DGDt, 2058DGDt, 2060DGDt and 2100DGDt. I/RA/11283/06.110/BDC 13 versie /01/07
21 IMDC NV i.s.m. WL Delft Hydraulics Opvolging aanslibbing Deurganckdok en Gems Report 2.3 Through Tide Measurement Sediview Springtide 22/03/06 Veremans 4. PROCESSING OF DATASETS 4.1. Calibration of the turbidity sensors A crucial aspect of the accuracy and reliability of the data concerns the calibration of the instruments before the measurement campaign. These calibration procedure is described in Report 6.1 Winter calibration Methodology of processing of the ADCP data with Sediview DRL Software s Sediview was used to process the ADCP data. Sediview is designed to derive estimates of suspended sediment concentration throughout the water column using acoustic backscatter data obtained by ADCPs manufactured by RD Instruments of San Diego, California Acoustic backscatter theory The acoustic theory governing backscatter from particles suspended in the water column is complex, but the following simplified formula serves to introduce the main factors that are relevant: Where: E = echo intensity, SL = SV = α w = transmitted power, E = SL + SV +Constant - 20log (R) - 2α R backscatter intensity due to the particles suspended in the water column, a coefficient describing the absorption of energy by the water, R = the distance from the transducer to the measurement bin. The term 20log(R) is a simple geometric function which accounts for the spherical spreading of the beam. The constant is required because each ADCP has specific performance characteristics. In order to measure the suspended sediment concentration in the water column it is necessary to relate the backscattered sound intensity to the mass concentration in the water. For the purposes of measuring solids concentration on site, it can be shown that the relationship is as follows (derived from Thorne and Campbell, 1992 and Hay, 1991 in DRL (2003)): Log { db + r( α + α ) K } 1 10M r 2 = S Where: M(r) = mass concentration per unit volume at range, r S = relative backscatter coefficient K s = site and instrument constant db = the measured relative backscatter intensity (corrected for beam spreading) α w = water attenuation coefficient α s = sediment attenuation coefficient, which is a function of the effective particle size w s s w In this expression there are four unknowns: S, Ks, α w and α s. These parameters are to be determined within Sediview. I/RA/11283/06.110/BDC 14 versie /01/07
22 IMDC NV i.s.m. WL Delft Hydraulics Opvolging aanslibbing Deurganckdok en Gems Report 2.3 Through Tide Measurement Sediview Springtide 22/03/06 Veremans Water sampling and transect sailing To calibrate Sediview for suspended sediment concentration, two water samples are taken at the beginning and at the end of each transect (see 3.1). Both samples are taken within the range of reliable data of the ADCP. For the near-surface sample this means in bin 3 or 4, for the near-bed sample this means at about one or two meter above the sidelobe. Water sampling is done together with CTD-OBS measurement in order to have two independent suspended sediment concentration measurements for each sample.. OBS measurements were compared to the water samples and recalibrated as mentioned in 4.1. These OBS SS concentrations were recalibrated using the conversion equations in 4.1. The water samples were used for Sediview calibration, while cross-calibrated OBS measurements were used as a back up check. The salinity and temperature was used to compute the acoustic water absorption (water attenuation coefficient). All water samples were analysed as is described in Calibration for suspended sediment concentration within Sediview Calibration workset The calibration workset consists of ADCP-files, sampling times, sampling depths, SSC obtained from water samples and SSC, temperature and salinity obtained from CTD-OBS readings. The suspended sediment concentration of the water samples was determined. One-litre samples were filtered over a preweighed desiccated 0.45 micron filter, after which the filter is dried in an oven at 105 C, cooled and weighed (NEN 6484) SSC calibration per ensemble pair In the Sediview calibration process the following parameters must be defined: the site and instrument constant (Ks), the relative backscatter coefficient (S) and the effective particle size per ensemble-pair (near-surface sample and near-bed sample) in order to fit the Sediview-estimate with the suspended sediment concentration of the water samples. These parameter sets may not differ too much from the previous parameter sets, as the environmental conditions will not change that much over a small time interval. To obtain a smooth progress in time of Ks, S and effective particle size an iterative approach is used Sediview configuration Discharge and suspended sediment concentration estimates The ADCP measures most of the water column from just in front of the ADCP to 6% above the bottom. The shallow layer of water near the bottom is not used to compute discharge and suspended sediment concentration due to side-lobe interference. When the ADCP sends out an acoustic pulse, a small amount of energy is transmitted in side lobes rather than in the direction of the ADCP beam. Side lobe reflection from the bottom can interfere with the water echoes and can give erroneous data. The thickness of the side lobe layer is 6% of the distance from the transducers to the bottom. Near the banks the water depth is too shallow for the ADCP to profile. For each of those unmeasured regions, Sediview will make an estimate of the discharges and suspended sediment concentration. The measured and unmeasured regions in the cross section are shown in Figure 4-1 and Figure 4-2. I/RA/11283/06.110/BDC 15 versie /01/07
 Figure 4-2: Measured and estimated discharges and")

23 IMDC NV i.s.m. WL Delft Hydraulics Opvolging aanslibbing Deurganckdok en Gems Report 2.3 Through Tide Measurement Sediview Springtide 22/03/06 Veremans Figure 4-1: Unmeasured regions in the cross section (from RD Instruments, 2003) Figure 4-2: Measured and estimated discharges and sediment fluxes within Sediview (DRL, 2005) Top/bottom estimates The sediment concentration and discharge at the top of the water column is assumed to be the same as the concentration and discharge in the first measured bin. The sediment concentration between the bottom and the lowest valid bin is assumed to be 125% of the lowest valid bin. Siltprofiles taken by the SiltProfiler on board the Oostende XI near Deurganckdok (IMDC, 2005b) and on board the Laure Marie near Deurganckdok (IMDC 2006d) show that the bottom value of the SSC is approximately 150% of the SSC-value at 2 meter above the bottom (position of the sidelobe). As the concentration grows approximately linear from the lowest valid bin to the bottom, and as Sediview uses a constant concentration factor for these deepest bins, we use a concentration factor of 125% (Figure 4-3). I/RA/11283/06.110/BDC 16 versie /01/07

24 IMDC NV i.s.m. WL Delft Hydraulics Opvolging aanslibbing Deurganckdok en Gems Report 2.3 Through Tide Measurement Sediview Springtide 22/03/06 Veremans Figure 4-3: Bottom estimate of the sediment concentration Table 4-1: Extrapolation methods for top and bottom variables Variable Top Bottom Discharge Method Constant Power Concentration factor 100% 125% The discharge for the bottom water layer is estimated by using the power method. Chen (1991) discusses the theory of power laws for flow resistance. Simpson and Oltmann (1990) discuss Chen s power law equivalent of Manning s formula for open channels (with b=1/6) (RD Instruments, 2003). Where: z = Distance to the channel bed [m] u = Velocity at distance z from bed [m/s] u* = Shear velocity [m/s] z 0 = Bottom roughness height [m] b = Exponent (1/6) u u* = 9.5( z / z ) / Edge estimates The shape of the edges of the cross section is assumed to be near-rectangular due to the quay walls of Deurganckdok. Five data ensembles are to be averaged to determine the left and right bank mean velocities used for calculation of edge estimates. The distance from start- and endpoint to the bank is calculated from the theoretical start- and endpoint at the bank to the effective start- and endpoint. The theoretical points are taken at the quay walls b I/RA/11283/06.110/BDC 17 versie /01/07
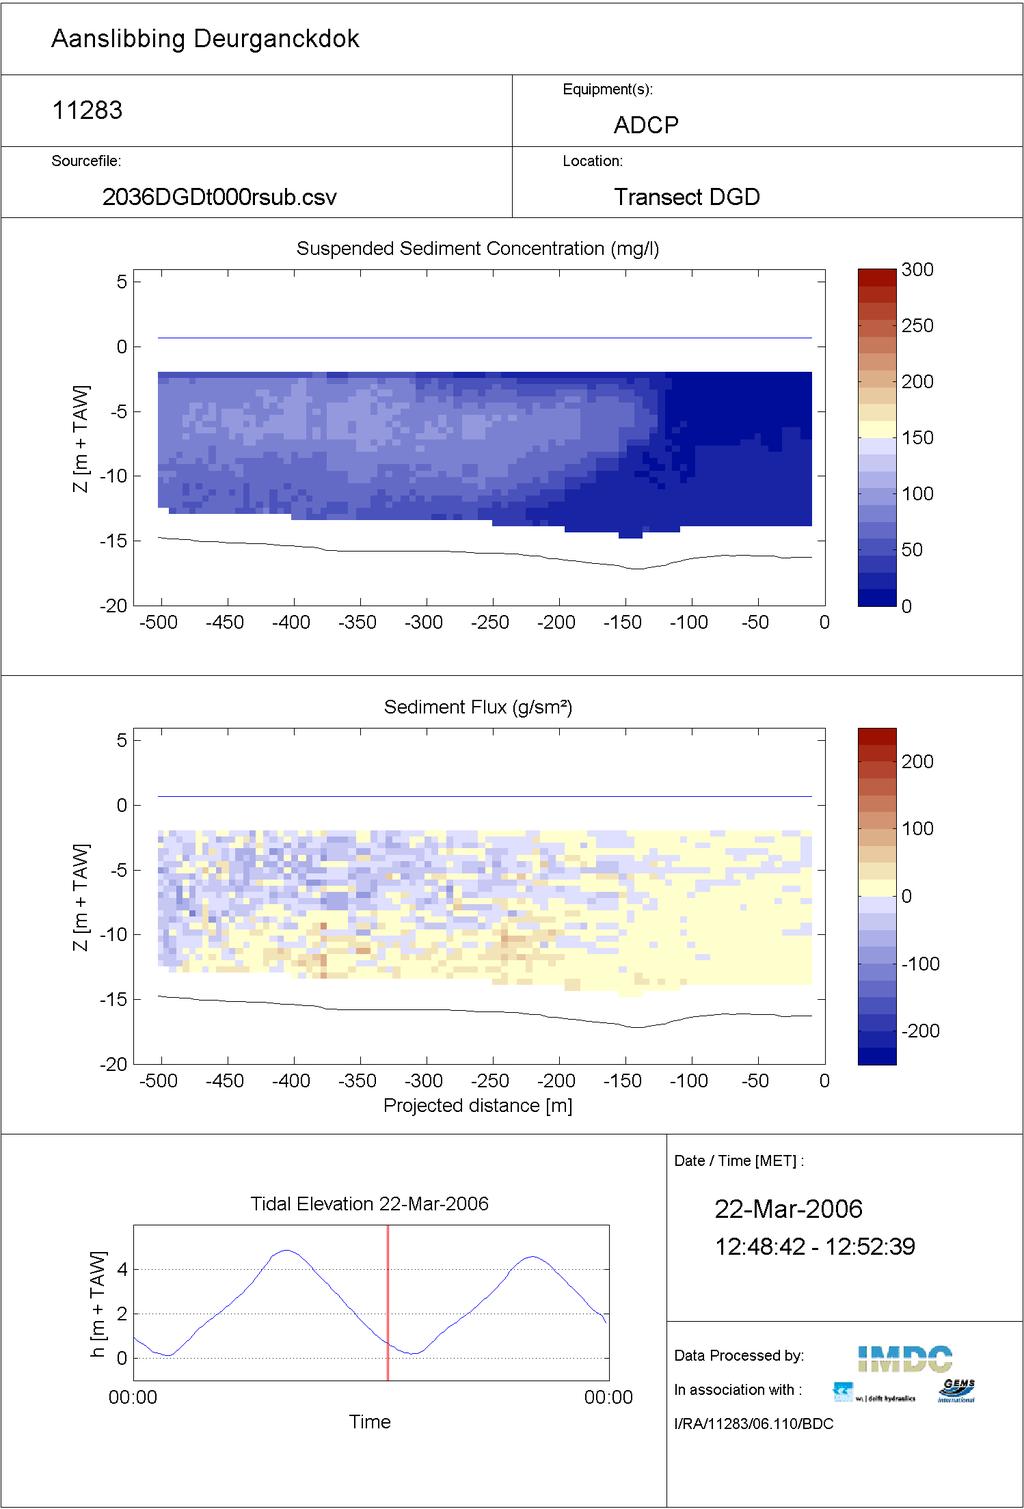
25 IMDC NV i.s.m. WL Delft Hydraulics Opvolging aanslibbing Deurganckdok en Gems Report 2.3 Through Tide Measurement Sediview Springtide 22/03/06 Veremans Table 4-2: Reference points at the end of the mud flats on left and right bank Coordinates (UTM31 ED50) Easting Left bank Northing Left bank Easting Right bank Northing Right bank Zandvliet The formula for determining the near shore discharge is: Q = CV Ld [m³/s] shore Where: C = Coefficient (0.35 for triangular, 0.91 for rectangular shape) V m = Mean water velocity in the first or the last segment [m/s] L = distance from the shore to the first or the last segment specified by the user [m] d m = Depth of the first or the last segment [m] m m The coefficient (C) has been set to 0.91 (rectangular shape of Deurganckdok quay walls) Contour plots of the transects All contour plots show perpendicular and parallel projected values on the straightened sailed transects. The heading of the straightened sailed transect is defined by picking 2 points in the straight part of the line after having corrected the heading of the ADCP compass. The compass offset is derived from a comparison of the ADCPs bottom track with the external GPS data Output General transect information containing start-stop coordinates of each sailed transects with stop time, track length and heading is given in APPENDIX A. In APPENDIX F, four contourplots were generated for each transect showing the distribution of suspended sediment concentration & sediment flux as well as the flow velocity perpendicular and parallel to the transect. The following conventions were used: Distances on the X-axis were referenced to the starting point of the transect, the start of the sailed transect is always at distance equal to zero. Left bank is always shown left, right bank on the right side. For Deurganckdok, left bank was taken to be the western quay wall and the right bank to be the eastern quay wall considering the dock as being a tributuary to the Scheldt river. Perpendicular flow velocities and fluxes are positive for downstream flow (ebb, out of Deurganckdok), negative for upstream flow (flood, inbound). Parallel flow velocities are positive for flow going from the left bank to the right bank, and negative for flow going from the right bank to the left bank. Absolute Depth is given in meters above TAW. Also a depth-averaged velocity plot was generated for the flow velocity perpendicular to the transect. (See APPENDIX F). Tables in APPENDIX G give the values for discharges, sediment fluxes and sediment concentrations for the total cross-section: I/RA/11283/06.110/BDC 18 versie /01/07
26 IMDC NV i.s.m. WL Delft Hydraulics Opvolging aanslibbing Deurganckdok en Gems Report 2.3 Through Tide Measurement Sediview Springtide 22/03/06 Veremans Mid = measured part of the cross-section Top = top part of the cross-section Bottom = bottom part underneath the sidelobe Edge (left, right) = edge estimates to left & right bank Total = Mid+Top+Bottom+ Edge values The graph in APPENDIX H gives the temporal variation of the total flux and total discharge for the whole through tide measurement at Zandvliet. I/RA/11283/06.110/BDC 19 versie /01/07
27 IMDC NV i.s.m. WL Delft Hydraulics Opvolging aanslibbing Deurganckdok en Gems Report 2.3 Through Tide Measurement Sediview Springtide 22/03/06 Veremans 5. PRELIMINARY ANALYSIS OF THE DATA 5.1. March 22 nd 2006 survey As Deurganckdok is situated along the part of the Scheldt river under tidal influence, it is subject to complex current fields near its entrance. The measured current field shows a vortex pattern dependend on the tidal phase. During ebbing tide the vortex at the entrance of the dock is a counter-clockwise one and during rising tide it is a clockwise one. This is shown in the contour plots by inflow (negative) on the western side (left) and outflow on the eastern side of the entrance during ebbing tide and vice versa for flooding tide. (APPENDIX F). During slack water we see a current field with opposing current directions in the upper part of the water column compared to the lower part of the water column. For high water we see inflow (negative) near the bottom and outflow (positive) near the surface. This particular pattern is probably an example of the expected salt density currents occurring near the entrance of Deurganckdok. The same event is seen at low water when the dock contains waters of higher salinity than the river, here we see an outflow near the bottom and inflow near the surface. From the backscatter interpretation into suspended sediment concentration we see in general a higher concentration during slack water and during rising tide compared to during ebbing tide. Especially at about 3 hours after low water a sudden increase in suspended sediment concentration is observed Intercomparison with earlier survey on November 17 th 2005 On November 17 th the same transect has been sailed during through tide measurements, a description is given by IMDC (2006j). Conditions near the entrance of Deurganckdok have been simulated in Delft3D and processed by IMDC (2006k) in order to compare simulation with observed data. The same circulation pattern as described above is found to have occurred at that day. In Figure 5-1 both measurements have been compared for about 3h after high water, sediment distribution as well as current pattern in the cross section are almost identical. Current velocity is about m/s on the right bank side and in the upper part of the water column and about 0.2 m/s on the left bank side. Suspended sediment concentration ranges from 50 to 100 mg/l going up from top right side towards bottom left side. In Figure 5-2 the circulation pattern and sediment concentration have been compared for the same days but at about 1h after high water. Again the current pattern is almost identical on both days with a salt wedge intruding near the bottom of the dock and compensatory outflow of fresher water near the surface. Sediment distribution ranges for both measurements between 50 and 150 mg/l with a very similar pattern across the cross section at the dock s entrance. I/RA/11283/06.110/BDC 20 versie /01/07


 On 17/11/2005 c) Suspended sediment")
28 IMDC NV i.s.m. WL Delft Hydraulics Opvolging aanslibbing Deurganckdok en Gems Report 2.3 Through Tide Measurement Sediview Springtide 22/03/06 Veremans a) b) c) d) Figure 5-1: a) Perpendicular current velocity( m/s) on 22/03/2006 and b) On 17/11/2005 c) Suspended sediment concentration (mg/l)n on 22/03/2006 and d) On 17/11/2005) at 3h after high water I/RA/11283/06.110/BDC 21 versie /01/07


 On 17/11/2005 c) Suspended sediment")
29 IMDC NV i.s.m. WL Delft Hydraulics Opvolging aanslibbing Deurganckdok en Gems Report 2.3 Through Tide Measurement Sediview Springtide 22/03/06 Veremans a) b) c) d) Figure 5-2: a) Perpendicular current velocity (m/s) on 22/03/2006 and b) On 17/11/2005 c) Suspended sediment concentration (mg/l) on 22/03/2006 and d) On 17/11/2005) at 1h after high water I/RA/11283/06.110/BDC 22 versie /01/07
30 IMDC NV i.s.m. WL Delft Hydraulics Opvolging aanslibbing Deurganckdok en Gems Report 2.3 Through Tide Measurement Sediview Springtide 22/03/06 Veremans 6. REFERENCES AMT (2003). Intern rapport, Getij-informatie Scheldebekken DRL (2003). Sediview Procedure Manual Draft for July 03 Issue. IMDC (2002).Studie Densiteitsstroming in het kader van LTV Schelde, Stroom- en saliniteitsmeting t.h.v. Deurganckdok uitgevoerd op 12/06/202, I/RA/11216/02.042/CMA. IMDC (2006a) Uitbreiding studie densiteitsstromingen in de Beneden Zeeschelde in het kader van LTV Meetcampagne naar hooggeconcentreerde slibsuspensies Deelrapport 6.1 Calibration Winter 15 March & 14 April 2006 (I/RA/11291/06.092/MSA). IMDC (2006b) Uitbreiding studie densiteitsstromingen in de Beneden Zeeschelde in het kader van LTV Meetcampagne naar hooggeconcentreerde slibsuspensies Deelrapport March 2006 Scheldewacht Deurganckdok (I/RA/11291/06.094/MSA). IMDC (2006c) Uitbreiding studie densiteitsstromingen in de Beneden Zeeschelde in het kader van LTV Meetcampagne naar hooggeconcentreerde slibsuspensies Deelrapport March 2006 Parel 2 Deurganckdok (downstream) (I/RA/11291/06.095/MSA). IMDC (2006d) Uitbreiding studie densiteitsstromingen in de Beneden Zeeschelde in het kader van LTV Meetcampagne naar hooggeconcentreerde slibsuspensies Deelrapport March 2006 Laure Marie Liefkenshoek (I/RA/11291/06.096/MSA). IMDC (2006e) Uitbreiding studie densiteitsstromingen in de Beneden Zeeschelde in het kader van LTV Meetcampagne naar hooggeconcentreerde slibsuspensies Deelrapport March 2006 Parel 2 Schelle (I/RA/11291/06.097/MSA). IMDC (2006f) Uitbreiding studie densiteitsstromingen in de Beneden Zeeschelde in het kader van LTV Meetcampagne naar hooggeconcentreerde slibsuspensies Deelrapport March 2006 Laure Marie Deurganckdok (downstream) (I/RA/11291/06.098/MSA). IMDC (2006g) Uitbreiding studie densiteitsstromingen in de Beneden Zeeschelde in het kader van LTV Meetcampagne naar hooggeconcentreerde slibsuspensies Deelrapport March 2006 Veremans Waarde (I/RA/11291/06.099/MSA). IMDC(2006h) Langdurige metingen Deurganckdok: Opvolging en analyse aanslibbing. Deelrapport 2.1 Opmeting stroming en zout- en sedimentbeweging aan de ingang van het Deurganckdok (SiltProfiler) (I/RA/11283/06.087/WGO). IMDC(2006i) Langdurige metingen Deurganckdok: Opvolging en analyse aanslibbing. Deelrapport 2.3. Opmeting stroming en zout-en sedimentbeweging aan de ingang van het Deurganckdok (ADCP) (I/RA/11283/06.110/BDC) IMDC(2006j): Studie van de stromingsvelden en sedimentuitwisseling aan de ingang van Deurganckdok. Current and Sediment flux measurements November 17th 2005 (I/RA/15030/06.021/BDC). IMDC(2006k): Studie van de stromingsvelden en sedimentuitwisseling aan de ingang van Deurganckdok. Additional processing of ADCP and salinity data 17/11/2005 and 28/11/2005 (I/RA/15030/06.040/BDC). KMI (2006). Maandbericht Klimatologische waarnemingen Deel II March RD Instruments (October 2003). Winriver User s Guide International Version. Unesco (1991). Processing of Oceanographic Station Data. I/RA/11283/06.110/BDC 23 versie /01/07
31 IMDC NV i.s.m. WL Delft Hydraulics Opvolging aanslibbing Deurganckdok en Gems Report 2.3 Through Tide Measurement Sediview Springtide 22/03/06 Veremans APPENDIX A. OVERVIEW OF MEASUREMENTS I/RA/11283/06.110/BDC A-1 versie /01/07
32
33 IMDC NV i.s.m. WL Delft Hydraulics Opvolging aanslibbing Deurganckdok en Gems Report 2.3 Through Tide Measurement Sediview Springtide 22/03/06 Veremans A.1 Overview of the measurement locations for the whole HCBS2 measurement campaign Overview of the measurement locations I/RA/11283/06.110/BDC A-2 versie /01/07
34 IMDC NV i.s.m. WL Delft Hydraulics Opvolging aanslibbing Deurganckdok en Gems Report 2.3 Through Tide Measurement Sediview Springtide 22/03/06 Veremans Overview of the measurement locations at Deurganckdok I/RA/11283/06.110/BDC A-3 versie /01/07
35 IMDC NV i.s.m. WL Delft Hydraulics Opvolging aanslibbing Deurganckdok en Gems Report 2.3 Through Tide Measurement Sediview Springtide 22/03/06 Veremans Theoretical transect in Schelle I/RA/11283/06.110/BDC A-4 versie /01/07
36 IMDC NV i.s.m. WL Delft Hydraulics Opvolging aanslibbing Deurganckdok en Gems Report 2.3 Through Tide Measurement Sediview Springtide 22/03/06 Veremans Theoretical transect in Waarde I/RA/11283/06.110/BDC A-5 versie /01/07
37 IMDC NV i.s.m. WL Delft Hydraulics Opvolging aanslibbing Deurganckdok en Gems Report 2.3 Through Tide Measurement Sediview Springtide 22/03/06 Veremans A.2 Overview of all measurement locations HCBS measurement campaign 21/3-23/3 Table with coordinates of theoretical transects Transect Start Easting Start Northing End Easting End Northing I K SCHELLE DGD Y WAARDE Table with coordinates of SiltProfiler gauging locations SP EASTING NORTHING I/RA/11283/06.110/BDC A-6 versie /01/07
38 IMDC NV i.s.m. WL Delft Hydraulics Opvolging aanslibbing Deurganckdok en Gems Report 2.3 Through Tide Measurement Sediview Springtide 22/03/06 Veremans A.3 Measurement overview Deurganckdok 22/03/2006 FileName End Time of time HW [hh:mm [hh:mm] MET] Easting start (UTM31 ED50) Northing start (UTM31 ED50) Easting end (UTM31 ED50) Northing end (UTM31 ED50) Transect length [m] Transect heading [ ] 2002DGDt000r 8:30 0: DGDt000r 8:49 1: DGDt000rbis 9:08 1: DGDt000r2 9:41 2: DGDt000rsub2 10:12 2: DGDt000r 10:25 2: DGDt000rsub 10:41 3: DGDt000r 10:58 3: DGDt000r 11:12 3: DGDt000r 11:26 3: DGDt000r 11:41 4: DGDt000r 11:56 4: DGDt000rbis 12:09 4: DGDt000rbis 12:26 4: DGDt000rbissub 12:40 5: DGDt000rsub 12:52 5: DGDt000rbissub 13:11 5: DGDt000r 13:23 5: DGDt000rsub 13:40 6: DGDt000rsub 13:52 6: DGDt000rsub 14:11-5: DGDt000r2 14:23-5: DGDt000rsub 14:43-5: DGDt000rbis 14:58-5: DGDt000r 15:11-4: DGDt000rbis 15:28-4: DGDt000rbissub 15:39-4: DGDt000rbis 15:51-4: DGDt000rsub 16:15-3: DGDt000rsub 16:27-3: DGDt000r 16:40-3: DGDt000rsub 16:54-3: DGDt000rsub 17:10-3: DGDt000rsub 17:22-2: DGDt000rbis 17:39-2: DGDt000rbis2 17:51-2: DGDt000rbissub 18:10-2: DGDt000rsub 18:23-1: DGDt000r 18:41-1: DGDt000r 18:55-1: I/RA/11283/06.110/BDC A-7 versie /01/07
39 IMDC NV i.s.m. WL Delft Hydraulics Opvolging aanslibbing Deurganckdok en Gems Report 2.3 Through Tide Measurement Sediview Springtide 22/03/06 Veremans FileName End Time of time HW [hh:mm [hh:mm] MET] Easting start (UTM31 ED50) Northing start (UTM31 ED50) Easting end (UTM31 ED50) Northing end (UTM31 ED50) Transect length [m] Transect heading [ ] 2086DGDt000rsub2 19:11-0: DGDt000r 19:23-0: DGDt000rsub2 19:40-0: DGDt000r2 19:53-0: DGDt000r2 20:10 0: DGDt000rsub 20:22 0: DGDt000rbis 20:41 0: DGDt000rbis 20:53 0: DGDt000rsub2 21:09 0: DGDt000rsub 21:22 1: Location of start en end points of the sailed tracks I/RA/11283/06.110/BDC A-8 versie /01/07
40
41 IMDC NV i.s.m. WL Delft Hydraulics Opvolging aanslibbing Deurganckdok en Gems Report 2.3 Through Tide Measurement Sediview Springtide 22/03/06 Veremans APPENDIX B. TIDAL DATA I/RA/11283/06.110/BDC B-1 versie /01/07
42
43 IMDC NV i.s.m. WL Delft Hydraulics, Opvolging aanslibbing Deurganckdok R. Kirby en Gems Report 2.3 Through Tide Measurement Sediview Springtide 22/03/06 Veremans Winter 2006 SURVEY 6 Hansweert Liefkenshoek Schelle 5 4 Waterlevel [m TAW] :00 02:24 04:48 07:12 09:36 12:00 14:24 16:48 19:12 21:36 00:00 Time [hh:mm MET] Measured tide on 22/03/2006 Data processed by: Location: River Scheldt Date: In association with: 22/03/2006 I/RA/11283/06.110/BDC I/RA/11283/06.110/BDC B-2 versie /01/07
44
45 IMDC NV i.s.m. WL Delft Hydraulics, Opvolging aanslibbing Deurganckdok R. Kirby en Gems Report 2.3 Through Tide Measurement Sediview Springtide 22/03/06 Veremans APPENDIX C. NAVIGATION INFORMATION AS RECORDED ON SITE I/RA/11283/06.110/BDC C-1 versie /01/07
46
47 IMDC NV i.s.m. WL Delft Hydraulics, Opvolging aanslibbing Deurganckdok R. Kirby en Gems Report 2.3 Through Tide Measurement Sediview Springtide 22/03/06 Veremans Ship: Location: Veremans Deurganckdok Nr. Tijdstip (MET) Name schip Direction 1 8:14 Rijnstroom IN 2 9:00 Hijnika IN 3 9:01 Integro OUT 4 9:08 Noordzee OUT 5 9:09 Camaro OUT 6 10:01 Setus OUT 7 10:15 Rijnstroom OUT 8 12:50 Hijnika IN 9 13:30 Pictunia IN 10 14:14 Orida IN 11 15:50 Vitaja IN 12 17:01 Orida OUT 13 17:38 Karin IN 14 18:50 Karin OUT 15 19:09 Tarkana IN 16 19:10 Riebel OUT 17 21:15 Santina IN I/RA/11283/06.110/BDC C-2 versie /01/07
48
49 IMDC NV i.s.m. WL Delft Hydraulics, Opvolging aanslibbing Deurganckdok R. Kirby en Gems Report 2.3 Through Tide Measurement Sediview Springtide 22/03/06 Veremans APPENDIX D. CALIBRATION AND CROSS-CALIBRATION GRAPHS FOR OBS DATA I/RA/11283/06.110/BDC D-1 versie /01/07
50
51 IMDC NV i.s.m. WL Delft Hydraulics, Opvolging aanslibbing Deurganckdok R. Kirby en Gems Report 2.3 Through Tide Measurement Sediview Springtide 22/03/06 Veremans March 2006 SURVEY OBS y = x x R 2 = SSC [mg/l] Turbidity [Counts] Calibration Graph of OBS-3+ Data processed by: Location: Deurganckdok Date: In association with: 15/03/2006 I/RA/11283/06.110/BDC I/RA/11283/06.110/BDC D-2 versie /01/07
52
53 IMDC NV i.s.m. WL Delft Hydraulics, Opvolging aanslibbing Deurganckdok R. Kirby en Gems Report 2.3 Through Tide Measurement Sediview Springtide 22/03/06 Veremans APPENDIX E. UNESCO PPS-78 FORMULA FOR CALCULATING SALINITY I/RA/11283/06.110/BDC E-1 versie /01/07
54
55 IMDC NV i.s.m. WL Delft Hydraulics, Opvolging aanslibbing Deurganckdok R. Kirby en Gems Report 2.3 Through Tide Measurement Sediview Springtide 22/03/06 Veremans Practical Salinity Scale (PPS 78) Salinity in the range of 2 to 42 Constants from the 19th Edition of Standard Methods C R cond.ratio R = mS / cm C Cond at t 0.5 Input conductivity in ms/cm of sample t deg. C Input temperature of sample solution P dbar 20 Input pressure at which sample is measured in decibars Rp p(e 1 + e2p + e3p ) R p = d1t + d2t + (d 3 + d4t)r rt r t = c 0 + c 1 t + c 2 t2+c 3 t3+c 4 t4 Rt R t R = R p x rt Delta S Delta S = (t-15) 1+k(t-15) (b 0 + b 1 R1/2 t + b 2 R t + b 3 R3/2 t + b 4 R 2 t + b 5 R5/2 t ) S = Salinity a b c d E-02 e E-04 a b c E-02 d E-04 e e-08 a b c E-04 d E-01 e E-12 a b c e-07 d e-03 a b c E-09 a b k R = ratio of measured conductivity to the conductivity of the Standard Seawater Solution Conductivity Ratio R is a function of salinity, temperature, and hydraulic pressure. So that we can factor R into three parts i.e. R = Rt x Rp x rt R = C(S,t,p)/C(35,15,0) S = a 0 + a 1 R 1/2 t + a 2 R t + a 3 R 3/2 t + a 4 R 2 t + a 5 R5/2 t + delta S C = ms/cm at 15 deg C and 0 dbar pressure ie C(35,15,0) where 35 is the salinity Ocean pressure is usually measured in decibars. 1 dbar = 10^-1 bar = 10^5 dyne/cm^2 = 10^4 Pascal. I/RA/11283/06.110/BDC E-2 versie /01/07
56
57 IMDC NV i.s.m. WL Delft Hydraulics, Opvolging aanslibbing Deurganckdok R. Kirby en Gems Report 2.3 Through Tide Measurement Sediview Springtide 22/03/06 Veremans APPENDIX F. CONTOURPLOTS OF FLOW VELOCITIES, SEDIMENT CONCENTRATION AND SEDIMENT FLUX PER SAILED TRANSECT I/RA/11283/06.110/BDC F-1 versie /01/07
58
59 IMDC NV i.s.m. WL Delft Hydraulics, Opvolging aanslibbing Deurganckdok R. Kirby en Gems Report 2.3 Through Tide Measurement Sediview Springtide 22/03/06 Veremans This page is intentionally left blank. I/RA/11283/06.110/BDC F-2 versie /01/07
60
61
62
63
64
65
66
67
68
69
70
71
72
73
74
75
76
77
78
79
80
81
82
83
84
85
86
87
88
89
90
STUDIE DENSITEITSSTROMINGEN IN HET KADER VAN LTV
 Ministerie van de Vlaamse Gemeenschap Departement Leefmilieu en Infrastructuur Afdeling Waterwegen en Zeewezen Afdeling Waterbouwkundig Laboratorium en Hydrologisch Onderzoek STUDIE DENSITEITSSTROMINGEN
STUDIE DENSITEITSSTROMINGEN IN HET KADER VAN LTV SCHELDE
 Ministerie van de Vlaamse Gemeenschap Departement Leefmilieu en Infrastructuur Afdeling Waterwegen en Zeewezen Afdeling Waterbouwkundig Laboratorium en Hydrologisch Onderzoek STUDIE DENSITEITSSTROMINGEN
STUDIE DENSITEITSSTROMINGEN IN HET KADER VAN LTV SCHELDE
 Ministerie van de Vlaamse Gemeenschap Departement Leefmilieu en Infrastructuur Afdeling Waterwegen en Zeewezen Afdeling Waterbouwkundig Laboratorium en Hydrologisch Onderzoek STUDIE DENSITEITSSTROMINGEN
STUDIE DENSITEITSSTROMINGEN IN HET KADER VAN LTV
 Ministerie van de Vlaamse Gemeenschap Departement Leefmilieu en Infrastructuur Afdeling Waterwegen en Zeewezen Afdeling Waterbouwkundig Laboratorium en Hydrologisch Onderzoek STUDIE DENSITEITSSTROMINGEN
STUDIE DENSITEITSSTROMINGEN IN HET KADER VAN LTV
 Ministerie van de Vlaamse Gemeenschap Departement Leefmilieu en Infrastructuur Afdeling Waterwegen en Zeewezen Afdeling Waterbouwkundig Laboratorium en Hydrologisch Onderzoek HANSWEERT getij (meetnet ZEGE)
A lithological map created from multibeam backscatter data in challenging circumstances: the Lower Sea Scheldt estuary
 A lithological map created from multibeam backscatter data in challenging circumstances: the Lower Sea Scheldt estuary Mieke Mathys*, Marc Sas*, Frederik Roose** HYDRO12, Rotterdam, 15/11/2012 *International
SEDIMENT TRANSPORT IN RIVER MOUTH ESTUARY
 SEDIMENT TRANSPORT IN RIVER MOUTH ESTUARY Katsuhide YOKOYAMA, Dr.Eng. dredge Assistant Professor Department of Civil Engineering Tokyo Metropolitan University 1-1 Minami-Osawa Osawa, Hachioji,, Tokyo,
Vlaamse Overheid Departement Mobiliteit en Openbare Werken
 Vlaamse Overheid Departement Mobiliteit en Openbare Werken Waterbouwkundig Laboratorium Langdurige metingen Deurganckdok: Opvolging en analyse aanslibbing Bestek 16EB/05/04 Colofon Ph o to c o ve r s h
Appendix G.19 Hatch Report Pacific NorthWest LNG Lelu Island LNG Maintenance Dredging at the Materials Offloading Facility
 Appendix G.19 Hatch Report Pacific NorthWest LNG Lelu Island LNG Maintenance Dredging at the Materials Offloading Facility Project Memo H345670 To: Capt. David Kyle From: O. Sayao/L. Absalonsen December
Delft3D Zeebrugge model
 Delft3D Zeebrugge model Assessment tool for safety and accessibility studies within the framework of an integral approach Bart De Maerschalck, Joris Vanlede, Arvid Dujardin, Rosalia Delgado, Marc Willems,
Sediment transport in the Schelde-estuary: A comparison between measurements, transport formula and numerical models
 Sustainable Hydraulics in the Era of Global Change Erpicum et al. (Eds.) 2016 Taylor & Francis Group, London, ISBN 978-1-138-02977-4 Sediment transport in the Schelde-estuary: A comparison between measurements,
MORPHODYNAMIC PROCESSES IN ESTUARIES COMPARISON OF MARINE AND LIMNIC TIDAL FLATS
 MORPHODYNAMIC PROCESSES IN ESTUARIES COMPARISON OF MARINE AND LIMNIC TIDAL FLATS Thorsten Albers 1, Dagmar Much 2, Nino Ohle 2, Nicole von Lieberman 1, Eva Falke 1 Tidal flat areas in estuaries are affected
MONITORING SUSPENDED SEDIMENT PLUME FORMED DURING DREDGING USING ADCP, OBS, AND BOTTLE SAMPLES
 MONITORING SUSPENDED SEDIMENT PLUME FORMED DURING DREDGING USING ADCP, OBS, AND BOTTLE SAMPLES Grace M. Battisto 1 and Carl T. Friedrichs 2 Abstract: In this study three independent measures of suspended
HIGH RESOLUTION SEDIMENT DYNAMICS IN SALT-WEDGE ESTUARIES
 HIGH RESOLUTION SEDIMENT DYNAMICS IN SALT-WEDGE ESTUARIES Philip Orton, Dept. of Environmental Science and Engineering, Oregon Graduate Institute Douglas Wilson, Dept. of Environmental Science and Engineering,
Vlaamse Overheid Departement Mobiliteit en Openbare Werken Afdeling Waterbouwkundig Laboratorium
 Vlaamse Overheid Departement Mobiliteit en Openbare Werken Afdeling Waterbouwkundig Laboratorium SOBEK Dremple LTV O&M Actieplan voor morfologisch onderzoek, Modelinstrumentarium MIKE Bestek nr.eb// Scheldt
Appendix O. Sediment Transport Modelling Technical Memorandum
 Appendix O Sediment Transport Modelling Technical Memorandum w w w. b a i r d. c o m Baird o c e a n s engineering l a k e s design r i v e r s science w a t e r s h e d s construction Final Report Don
PIANC. Salinity and Locks. 1. Salinity and nautical aspects 2. Salinity and the environment 3. Salinity and sedimentation 4. Mitigating measures
 PIANC The World Association for Waterborne Transport Infrastructure International Marine and Dredging Consultants (Belgium) PIANC Workshop 15-16th 16th October 2009 2. Salinity and the environment 3. Salinity
Appendix G.18 Hatch Report Pacific NorthWest LNG Lelu Island LNG Potential Impacts of the Marine Structures on the Hydrodynamics and Sedimentation
 Appendix G.18 Hatch Report Pacific NorthWest LNG Lelu Island LNG Potential Impacts of the Marine Structures on the Hydrodynamics and Sedimentation Patterns Project Memo H345670 To: Capt. David Kyle From:
Monitoring of Suspended Sediment Plume Formed During Oyster Shell Dredging in the James River, Virginia, August 2001
 Monitoring of Suspended Sediment Plume ormed uring Oyster Shell redging in the James River, Virginia, ugust 21 inal Report Prepared for the Virginia Marine Resources ommission by arl T. riedrichs and Grace
A Comparison of Predicted Along-channel Eulerian Flows at Cross- Channel Transects from an EFDC-based Model to ADCP Data in South Puget Sound
 A Comparison of Predicted Along-channel Eulerian Flows at Cross- Channel Transects from an EFDC-based Model to ADCP Data in South Puget Sound Skip Albertson, J. A. Newton and N. Larson Washington State
Analysis of Physical Oceanographic Data from Bonne Bay, September 2002 September 2004
 Physics and Physical Oceanography Data Report -1 Analysis of Physical Oceanographic Data from Bonne Bay, September September Clark Richards and Brad deyoung Nov. 9 Department of Physics and Physical Oceanography
Ultrasonic Measuring System for Deposition of Sediments in Reservoirs
 MECAHITECH 11, vol. 3, year: 011 Ultrasonic Measuring System for Deposition of Sediments in Reservoirs M. Mărgăritescu* 1, A. Moldovanu * 1, P. Boeriu *, A.M.E. Rolea* 1 * 1 National Institute of Research
Development and application of demonstration MIKE 21C morphological model for a bend in Mekong River
 Development and application of demonstration MIKE 21C morphological model for a bend in Mekong River September 2015 0 Table of Contents 1. Introduction... 2 2. Data collection... 3 2.1 Additional data...
Monitoring The Sand Extraction On The Belgian Continental Shelf
 Monitoring The Sand Extraction On The Belgian Continental Shelf Methodology, Results And Expectations K. Degrendele and M. Roche Within the framework of a sustainable exploitation of the mineral resources
Summary Results from Horizontal ADCP tests in the Indiana Harbor Canal and the White River
 Summary Results from Horizontal ADCP tests in the Indiana Harbor Canal and the White River This report summarizes results of tests of horizontally deployed ADCPs in the Indiana Harbor Canal and the White
Mound Study Project Cape Fear, North Carolina Report Summary VIMS Reports: CHSD to CHSD EHI Project No
 Mound Study Project Cape Fear, North Carolina Report Summary VIMS Reports: CHSD-2003-02 to CHSD-2003-06 EHI Project No. 6000.21 February 2003 Final VIMS Report CHSD-2003-01 Prepared for Evans-Hamilton,
This file is part of the following reference: Access to this file is available from:
 This file is part of the following reference: Page, Geoff () Mass Transport Evaluation using consolidated VHF Radar and Acoustic Doppler Current Profiler data. Masters (Research) thesis, James Cook University.
UC Berkeley Technical Completion Reports
 UC Berkeley Technical Completion Reports Title Hydrodynamics of shallow water habitats in the Sacramento-San Joaquin Delta Permalink https://escholarship.org/uc/item/3j77h7t6 Author Stacey, Mark T Publication
Sediment Transport Modelling of Proposed Maintenance Dredging of the Outer and Inner Berths at the Aughinish Marine Terminal, Shannon Estuary
 Sediment Transport Modelling of Proposed Maintenance Dredging of the Outer and Inner Berths at the Aughinish Marine Terminal, Shannon Estuary Prepared for Malachy Walsh & Partners On behalf of Aughinish
Comparing suspended sediment concentrations derived from a model and collected in a tidally dominated area
 Comparing suspended sediment concentrations derived from a model and collected in a tidally dominated area Maryam Rahbani, Department of oceanic and atmospheric science University of Hormozgan, maryamrahbani@yahoo.com
A 3D unstructured numerical model of Ems-Dollart estuary Observations and 3-D modeling. Pein JU, Stanev EV, Zhang YJ.
 A 3D unstructured numerical model of Ems-Dollart estuary Observations and 3-D modeling Pein JU, Stanev EV, Zhang YJ. in the framework of Future-Ems project. Model area & general research issues - Ems river
Effects of possible land reclamation projects on siltation in the Rotterdam harbour area. A model study.
 Effects of possible land reclamation projects on siltation in the Rotterdam harbour area. A model study. J.M. de Kok
J.B. Shaw and D. Mohrig
 GSA DATA REPOSITORY 2014008 J.B. Shaw and D. Mohrig Supplementary Material Methods Bathymetric surveys were conducted on 26 June- 4 July, 2010 (Fig. 2A), 7 March, 2011 (Fig. 2B), 11-12 August, 2011 (Figs.
H.A.R.S. PRA #1 (Historic Area Remediation Site)
") H.A.R.S. PRA #1 (Historic Area Remediation Site) 2009 Multibeam Bathymetry TABLE OF CONTENTS Page LIST OF TABLES 2 LIST OF FIGURES 3 1.0 INTRODUCTION 4 2.0 OBJECTIVE 4 3.0 PROCEDURE 4 3.1 DATA ACQUISITION
H.A.R.S. PRA #1 (Historic Area Remediation Site) 2009 Multibeam Bathymetry TABLE OF CONTENTS Page LIST OF TABLES 2 LIST OF FIGURES 3 1.0 INTRODUCTION 4 2.0 OBJECTIVE 4 3.0 PROCEDURE 4 3.1 DATA ACQUISITION
TECHNICAL MEMO: FAR-FIELD SURVEYS OF SUSPENDED SEDIMENT PLUMES ASSOCIATED WITH CUTTERHEAD DREDGING IN JONES INLET, LONG ISLAND, NEW YORK
 TECHNICAL MEMO: FAR-FIELD SURVEYS OF SUSPENDED SEDIMENT PLUMES ASSOCIATED WITH CUTTERHEAD DREDGING IN JONES INLET, LONG ISLAND, NEW YORK Federal Navigation Project FINAL Prepared for U.S. Army Corps of
Bathymetric controls on sediment transport in the Hudson River estuary: Lateral asymmetry and frontal trapping
 JOURNAL OF GEOPHYSICAL RESEARCH, VOL. 117,, doi:10.1029/2012jc008124, 2012 Bathymetric controls on sediment transport in the Hudson River estuary: Lateral asymmetry and frontal trapping David K. Ralston,
Monitoring of sediment dynamics during disposal of dredged harbour sediment in Port of Esbjerg, Denmark
 Monitoring of sediment dynamics during disposal of dredged harbour sediment in Port of Esbjerg, Denmark Ulrik Lumborg, DHI Jacob Vested, DHI Signe Marie Ingvardsen, Kystdirektoratet Agenda Port of Esbjerg
Securing Manoeuverability of a Deep Draft Ship in a Sediment loaded Tidal River Berth
 Securing Manoeuverability of a Deep Draft Ship in a Sediment loaded Tidal River Berth O. Stoschek 1, A. Matheja 1 & C. Zimmermann 1 1 Franzius-Institute for Hydraulic, Waterways and Coastal Engineering,
The investigation of sediment processes in rivers by means of the Acoustic Doppler Profiler
 368 Evolving Water Resources Systems: Understanding, Predicting and Managing Water Society Interactions Proceedings of ICWRS014, Bologna, Italy, June 014 (IAHS Publ. 364, 014). The investigation of sediment
Linking Sediment Transport in the Hudson from the Tidal River to the Estuary
 Linking Sediment Transport in the Hudson from the Tidal River to the Estuary Or, what happened to all the mud from Irene? David Ralston, Rocky Geyer, John Warner, Gary Wall Hudson River Foundation seminar
6.0 SEDIMENT TRANSPORT
 Coastal Geomorphology Study - 74 - November 2004 6.0 SEDIMENT TRANSPORT 6.1 SEDIMENT CHARACTERISTICS 6.1.1 Bed Sediment Properties The size distribution of sediments on Roberts Bank was determined using
Applying Gerris to Mixing and Sedimentation in Estuaries
 Applying Gerris to Mixing and Sedimentation in Estuaries Timothy R. Keen U.S. Naval Research Laboratory Stennis Space Center, Mississippi, U.S.A. 4 July 2011 Université Pierre et Marie Curie Paris, France
Hydrodynamic model of St. Clair River with Telemac-2D Phase 2 report
 Hydrodynamic model of St. Clair River with Telemac-2D Phase 2 report Controlled Technical Report CHC-CTR-084 revision 1 March 2009 NRC-CHC has prepared this report for the International Joint Commission
Modeling the Transport and Fate of Sediments Released from Dredging Projects in the Coastal Waters of British Columbia, Canada
 WEDA Dredging Summit & Expo 18 Modeling the Transport and Fate of Sediments Released from Dredging Projects in the Coastal Waters of British Columbia, Canada David B. Fissel, Yuehua (Andy) Lin and Todd
Sediment Flux and Trapping on the Skagit Tidal Flats
 Sediment Flux and Trapping on the Skagit Tidal Flats W. Rockwell Geyer Woods Hole Oceanographic Institution MS 11, Woods Hole, MA 02543 phone: 508-289-2868 fax: 508-457-2194 email: rgeyer@whoi.edu Peter
Effects burial Borssele export cables
 Appendix A-18 Effects burial Borssele export cables Assessment of siltation in the EPZ intake due to dredging/dumping Client: TenneT TSO BV. Date: 20/06/2018 Clients Reference: 2018B Our Reference: WP2018_1104_R2r1
Applying Electrical Resistivity Methods for Measuring Dredged Material Density in Hopper Bins
 DRP-3-07 November 1992 Dredging Technical Research Notes Applying Electrical Resistivity Methods for Measuring Dredged Material Density in Hopper Bins Purpose This technical note provides information on
Hydrodynamics in Shallow Estuaries with Complex Bathymetry and Large Tidal Ranges
 DISTRIBUTION STATEMENT A: Approved for public release; distribution is unlimited. Hydrodynamics in Shallow Estuaries with Complex Bathymetry and Large Tidal Ranges Stephen G. Monismith Dept of Civil and
Measurements of lateral flow from the Mississippi River at Mardi Gras Pass in the Bohemia Spillway using synoptic ADCP
 Measurements of lateral flow from the Mississippi River at Mardi Gras Pass in the Bohemia Spillway using synoptic ADCP A Technical Report Submitted to: The Lake Pontchartrain Basin Foundation Submitted
Dynamics of the Ems Estuary
 Dynamics of the Ems Estuary Physics of coastal systems Jerker Menninga 0439738 Utrecht University Institute for Marine and Atmospheric research Utrecht Lecturer: Prof. dr. H.E. de Swart Abstract During
Repeated surveys by acoustic Doppler current profiler for flow and sediment dynamics in a tidal river
 Journal of Hydrology 314 (2005) 1 21 www.elsevier.com/locate/jhydrol Repeated surveys by acoustic Doppler current profiler for flow and sediment dynamics in a tidal river R.L. Dinehart*, J.R. Burau US
12.0 COASTAL PROCESSES
 12.0 COASTAL PROCESSES 12.1 Introduction This Chapter of the EIS considers the potential and likely significant effects of the proposed alterations to the permitted development. The purpose of this chapter
MaxDepth Aquatics, Inc.
 MaxDepth Aquatics, Inc. Bathymetry of Mirror Pond From Newport Bridge to Galveston Bridge Prepared for the City of Bend By Joseph Eilers & Benn Eilers MaxDepth Aquatics, Inc. Bend, OR June 2005 INTRODUCTION
Main issues of Deltas
 Global sediment supply to coastal seas and oceans; location of major river deltas RIVER DELTAS Depositional processes - Course Coastal Morphodynamics GEO3-436; lecture 4 Nile Delta, Egypt Solo Delta, Java,
Red Sea - Dead Sea Water Conveyance Study Program Additional Studies
 Red Sea - Dead Sea Water Conveyance Study Program Additional Studies Red Sea Study Final Report Annex 1 Field and laboratory activities carried out during the study and their results July 213 TABLE OF
TECHNICAL MEMO: FAR-FIELD SURVEYS OF SUSPENDED SEDIMENT PLUMES ASSOCIATED WITH HARBOR DEEPENING DREDGING IN ARTHUR KILL. S-AK-2 Contract Area
 TECHNICAL MEMO: FAR-FIELD SURVEYS OF SUSPENDED SEDIMENT PLUMES ASSOCIATED WITH HARBOR DEEPENING DREDGING IN ARTHUR KILL S-AK-2 Contract Area Prepared for U.S. Army Corps of Engineers - New York District
PDCE2007. Possibilities of minimizing sedimentation in harbours in a brackish tidal environment
 PDCE2007 Possibilities of minimizing sedimentation in harbours in a brackish tidal environment Dr.-Ing. Oliver Stoschek DHI Wasser& Umwelt GmbH, Syke, Germany Abstract Sedimentation in harbour entrances
Sessom Creek Sand Bar Removal HCP Task 5.4.6
 Sessom Creek Sand Bar Removal HCP Task 5.4.6 Prepared by: Dr. Thomas Hardy Texas State University Dr. Nolan Raphelt Texas Water Development Board January 6, 2013 DRAFT 1 Introduction The confluence of
Assessment of the performance of a turbulence closure model: along the tidally-influenced Kaipara River to the estuary, NZ
 Assessment of the performance of a turbulence closure model: along the tidally-influenced Kaipara River to the estuary, NZ Berengere S. Dejeans 1, Julia C. Mullarney 2, Iain T. MacDonald 3 and Glen M.
SEDIMINTATION CHALLENGES IN UMM QASR PORT, IRAQ
 Paper No: P021 SEDIMINTATION CHALLENGES IN UMM QASR PORT, IRAQ by C. Jürgensen 1, A.A. Samir 2, S. Salim 3, J.B. Abild 4, M. Hassan 5, H.J. Vested 6, L. Dall 7 and N. Arndal 8 ABSTRACT The paper describes
Note: Deposition/dredging of tidal ferry channel in Dutch Wadden Sea Date: 23 June 2017
 Deposition and dredging of a small tidal ferry channel through sand-mud flats in Dutch Wadden Sea 1. Introduction 2. Ferry channel and long-term morphology 3. Tidal flow and sediment transport 3.1 Tidal
SUBJECT INDEX. ~ ~5 physico-chemical properties 254,255 Redox potential 254,255
 Aggregates: beds formed by deposition 81,82 breakup by fluid shear, introduction 85,86 deposition from flowing water 80 implications in cohesive sediment transport 102-105 needs for further research 83
B-1. Attachment B-1. Evaluation of AdH Model Simplifications in Conowingo Reservoir Sediment Transport Modeling
 Attachment B-1 Evaluation of AdH Model Simplifications in Conowingo Reservoir Sediment Transport Modeling 1 October 2012 Lower Susquehanna River Watershed Assessment Evaluation of AdH Model Simplifications
PRESENTATION TITLE. Regional Sediment Management Application of a Coastal Model at the St. Johns River Entrance BUILDING STRONG
 PRESENTATION TITLE Regional Sediment Management Application of a Coastal Model at the St. Johns River Entrance Steven Bratos Senior Coastal Engineer U.S. Army Corps of Engineers Jacksonville District February
Lower Susquehanna River Integrated Sediment & Nutrient Monitoring Program
 Lower Susquehanna River Integrated Sediment & Nutrient Monitoring Program Presented at the Chesapeake Bay Program Scientific and Technical Advisory Committee (STAC) Workshop January 13, 2016 Background
Estimated Sediment Volume: Bridge Street Dam Impoundment, Royal River, Yarmouth, Maine
 University of Southern Maine USM Digital Commons Publications Casco Bay Estuary Partnership (CBEP) 2015 Estimated Sediment Volume: Bridge Street Dam Impoundment, Royal River, Yarmouth, Maine Stantec Follow
Morphodynamic Response of Tidal Mudflats to Marine Cohesive Sediment Influx
 Morphodynamic Response of Tidal Mudflats to Marine Cohesive Sediment Influx Wongsoredjo Samor Master of Science in Earth Sciences Thesis Utrecht, 2016 Utrecht University, Faculty of Geosciences Morphodynamic
Texas A & M University and U.S. Bureau of Reclamation Hydrologic Modeling Inventory Model Description Form
 Texas A & M University and U.S. Bureau of Reclamation Hydrologic Modeling Inventory Model Description Form JUNE, 1999 Name of Model: Two-Dimensional Alluvial River and Floodplain Model (MIKE21 CHD & CST)
Modelling the estuarine circulation of the Port of Saint John: Visualizing complex sound speed distribution.
 Modelling the estuarine circulation of the Port of Saint John: Visualizing complex sound speed distribution. Ian CHURCH, John HUGHES CLARKE, Susan HAIGH and Reenu TOODESH, Canada Key words: Hydrodynamic
Sediment Transport at Density Fronts in Shallow Water: a Continuation of N
 DISTRIBUTION STATEMENT A. Approved for public release; distribution is unlimited. Sediment Transport at Density Fronts in Shallow Water: a Continuation of N00014-08-1-0846 David K. Ralston Applied Ocean
Field and Numerical Study of the Columbia River Mouth
 DISTRIBUTION STATEMENT A. Approved for public release; distribution is unlimited. Field and Numerical Study of the Columbia River Mouth Guy Gelfenbaum 400 Natural Bridges Dr. Santa Cruz, CA 95060 Phone:
SUSPENDED SEDIMENT PLUMES ASSOCIATED WITH MECHANICAL DREDGING AT THE PORT OF OAKLAND, CALIFORNIA
 SUSPENDED SEDIMENT PLUMES ASSOCIATED WITH MECHANICAL DREDGING AT THE PORT OF OAKLAND, CALIFORNIA D. Clarke 1, A. Martin 2, C. Dickerson 3 and D. Moore 2 ABSTRACT Suspended sediment plumes associated with
Appendix B. Contents. Elliston instrument deployment data report. Olympic Dam Expansion Supplementary Environmental Impact Statement 2010
 Project Alternatives Appendix B Contents B1 Elliston instrument deployment data report 1 Olympic Dam Expansion Supplementary Environmental Impact Statement 2010 Appendix B1 Elliston instrument deployment
7.0 Project Reports 7.1 Geophysical Mapping of Submarine Environments
 7.0 Project Reports 7.1 Geophysical Mapping of Submarine Environments Suzanne Carbotte, Robin Bell, Roger Flood 7.1.1 METHODS In April 2000 we deployed the R/V Onrust, operated by MSRC at SUNY Stony Brook,
Performance of the Nortek Aquadopp Z-Cell Profiler on a NOAA Surface Buoy
 Performance of the Nortek Aquadopp Z-Cell Profiler on a NOAA Surface Buoy Eric Siegel NortekUSA Annapolis, USA Rodney Riley & Karen Grissom NOAA National Data Buoy Center Stennis Space Center, USA Abstract-Observations
Seasonal Changes in the Mekong River Delta's Distributary Channels and Nearshore Sedimentary Environments
 DISTRIBUTION STATEMENT A. Approved for public release; distribution is unlimited. Seasonal Changes in the Mekong River Delta's Distributary Channels and Nearshore Sedimentary Environments Paul Liu & David
Annual transport rates at two locations on the fore-slope.
 Sediment Transport by Currents Fore-slope Sediment transport rates and sediment concentrations were computed from the hydrodynamic model runs as well as from direct measurements of current velocities at
Temporal variability of partially-contaminated sediments in a strongly regulated reservoir of the upper Rhine River
 Temporal variability of partially-contaminated sediments in a strongly regulated reservoir of the upper Rhine River Germain Antoine 1,2,, Thomas Pretet 1,3,, Matthieu Secher 3,, and Anne Clutier 3, 1 Laboratoire
ANALYSIS OF THE TEMPORAL DYNAMICS OF SUSPENDED SEDIMENT FLUXES
 ANALYSIS OF THE TEMPORAL DYNAMICS OF SUSPENDED SEDIMENT FLUXES USING DISCRETE SAMPLING AND CONTINUOUS TURBIDITY MEASUREMENTS IN THE MEUSE AND SCHELDT WATERSHEDS (WALLONIA, BELGIUM) JEAN VAN CAMPENHOUT
Physics and Physical Oceanography Data Report Analysis of Physical Oceanographic Data from Funk Island Bank, August 2004
 Physics and Physical Oceanography Data Report 2004-2 Analysis of Physical Oceanographic Data from Funk Island Bank, August 2004 Nicholas Record, Brad de Young, and Jack Foley 2004 Department of Physics
Appendix I. Dredged Volume Estimates. Draft Contractor Document: Subject to Continuing Agency Review
 Appendix I Dredged Volume Estimates Draft Contractor Document: Subject to Continuing Agency Review Interoffice Correspondence Date: April 6, 2007 To: L. Bossi (WHI) Copy: S. Thompson (WHI), B. Fidler (NNJ)
A STUDY ON HYDRODYNAMIC AND MORPHOLOGICAL BEHAVIOR OF PADMA RIVER USING DELFT3D MODEL
 Proceedings of the 3 rd International Conference on Civil Engineering for Sustainable Development (ICCESD 2016), 12~14 February 2016, KUET, Khulna, Bangladesh (ISBN: 978-984-34-0265-3) A STUDY ON HYDRODYNAMIC
Alternative Dumping Strategy
 Port of Antwerp Expert Team Alternative Dumping Strategy The Feasibility of Morphological Dredging as a Tool for Managing the Westerschelde (Draft for discussion) September 15 th, 2003 I FOREWORD This
impact of human interventions on estuarine dynamics regime shifts
 impact of human interventions on estuarine dynamics regime shifts Han Winterwerp Deltares and Delft University of Technology concentration [mg/l] high and low water level [m] rationale for analysis 8 observations
PENOBSCOT RIVER MERCURY STUDY. Chapter 7. Field Investigations of Hydrodynamics and Particle Transport in Penobscot River and Bay
 PENOBSCOT RIVER MERCURY STUDY Chapter 7 Field Investigations of Hydrodynamics and Particle Transport in Penobscot River and Bay Submitted to Judge John Woodcock United States District Court (District of
MID-TERM CONFERENCE CREST
 MID-TERM CONFERENCE CREST 23 November 2017 Innovation in Coastal Monitoring Alain De Wulf (Ugent, Geography Dept.) Innovation in coastal monitoring Outline Why? How? What (tools do we use to assess)? Conclusion
Fine-scale Survey of Right and Humpback Whale Prey Abundance and Distribution
 DISTRIBUTION STATEMENT A: Approved for public release; distribution is unlimited. Fine-scale Survey of Right and Humpback Whale Prey Abundance and Distribution Joseph D. Warren School of Marine and Atmospheric
GSA DATA REPOSITORY
 GSA DATA REPOSITORY 2009206 Miner et al. Supplemental Material Bathymetric Survey Methods The bathymetric data for the area were gathered using a single-beam bathymetric survey rig mounted aboard a 21-foot
SonTek IQ - Principles of Operation
 SonTek IQ - Principles of Operation SonTek IQ - Principles of Operation This doument introduces the operating principles of the SonTek IQ acoustic Doppler current meter. It does not attempt to provide
CHAPTER 6 RESULTS FIGURE 8.- DATA WORK FLOW FOR BACKSCATTER PROCESSING IN HYPACK
 CHAPTER 6 RESULTS 6.1. Backscatter Workflow Comparison Currently, INOCAR owns and operates RESON and Kongsberg multibeam systems for nearshore surveys. The RESON system is integrated with HYPACK Hysweep
Estimating suspended solids concentrations from backscatter intensity measured by acoustic Doppler current profiler in San Francisco Bay, California
 Marine Geology 211 (2004) 169 187 www.elsevier.com/locate/margeo Estimating suspended solids concentrations from backscatter intensity measured by acoustic Doppler current profiler in San Francisco Bay,
Bathymetric Survey and Sediment Hydroacoustic Study of Canyon Lake. Michael Anderson UC Riverside
 Bathymetric Survey and Sediment Hydroacoustic Study of Canyon Lake Michael Anderson UC Riverside Introduction Canyon Lake was constructed in 1928 as the Railroad Canyon Reservoir as a result of the impoundment
REPORT ON SEA LEVEL MEASUREMENT FOR GHANA
 20TH SEPTEMBER 2006 REPORT ON SEA LEVEL MEASUREMENT FOR GHANA Emmanuel K. Nkebi 1 1 Survey Department of Ghana, P. O. Box CT903, Accra Tel: 233 21 777 334 Fax : 233 21 765687 E-mail: survey@ghana.com E-mail:eknkebi@yahoo.com
Michael Walsworth, Ryan Sullivan, Simi Odueyungbo, William Budd
 Michael Walsworth, Ryan Sullivan, Simi Odueyungbo, William Budd Estuarine Environment At first (Pritchard, 1967), an estuary was defined by the salinity of the water. Then by Clifton (1982) as an inlet
Client RSK Environment Ltd Job No. J387 Date 19/11/2016. Project: Environmental Survey Location: Otranto Vessel: RV Atlante
 FUGRO OCEANSISMICA S.p.A. GEODETIC PARAMETERS Client RSK Environment Ltd Job No. J387 Date 19/11/216 Project: Environmental Survey Location: Otranto Vessel: RV Atlante WGS-84 Geodetic Parameters Datum
Coastal and Hydraulics Laboratory
 ERDC/CHL TR-09-6 Houston-Galveston Navigation Channels, Texas Project Navigation Channel Sedimentation Study, Phase 2 Plan Simulations Jennifer N. Tate and Cassandra G. Ross August 2009 Coastal and Hydraulics
By combining moored measurements at 26N with satellite derived winds
 I work for the Rapid MOC project and basically manage the mooring array in terms of where instruments are going etc Responsible for the mooring designs we use Why giving talk? 1 Opportunity to test current
EVOS Annual Progress Report
 EVOS Annual Progress Report Project Number: # 10100132-E Project Title: PWS Herring Survey: Physical Oceanographic Characteristics of Nursery Habitats of Juvenile Pacific Herring PI Name: Shelton Gay -
Map shows 3 main features of ocean floor
 Map shows 3 main features of ocean floor 2017 Pearson Education, Inc. Chapter 3 Marine Provinces 2017 Pearson Education, Inc. 1 Chapter 3 Overview The study of bathymetry determines ocean depths and ocean