Sager, W.W., Bull, J.M. and Krishna, K.S. (2013) Active faulting on. the Ninetyeast Ridge and its relation to deformation of the Indo-
|
|
|
- Ross Logan
- 5 years ago
- Views:
Transcription
1 Sager, W.W., Bull, J.M. and Krishna, K.S. (2013) Active faulting on the Ninetyeast Ridge and its relation to deformation of the Indo- Australian plate. Journal of Geophysical Research: Solid Earth, 118, (8), (doi: /jgrb.50319) Active Faulting on the Ninetyeast Ridge and its Relation to Deformation of the Indo-Australian Plate 9 W. W. Sager 1,2, J. M. Bull 3, and K. S. Krishna Department of Oceanography, Texas A&M University, College Station, TX, USA, wsager@tamu.edu Now at Department of Earth and Atmospheric Sciences, University of Houston, Houston, TX 77240, wwsager@uh.edu School of Ocean and Earth Science, National Oceanography Centre Southampton, University of Southampton, Southampton SO14 3ZH, UK, bull@noc.soton.ac.uk CSIR - National Institute of Oceanography, Dona Paula, Goa , India, krishna@nio.org 1
2 Abstract The ~4500 km-long Ninetyeast Ridge (NER) in the northeastern Indian Ocean crosses a broad zone of deformation where the Indo-Australian plate is fracturing into three smaller plates (India, Capricorn, Australia) separated by diffuse boundaries whose extents are poorly defined. New multichannel seismic reflection profiles image active faults along the entire length of the NER and show spatial changes in the style of deformation along the ridge. The northern NER (0-5 N) displays transpressional motion along WNW-ESE faults. Observed fault patterns confirm strike-slip motion at the western extent of the April 2012 Wharton Basin earthquake swarm. In the central NER (5-8 S), deformation on WNW-ESE-trending thrust faults implies nearly N-S compression. An abrupt change in fault style occurs between 8 and 11 S, with modest, extension characterizing the southern NER (11-27 S). Although extension is dominant, narrow zones of faults with strike-slip or compressional character also occur in the southern NER, suggesting a complex combination of fault motions. At all sites, active faulting is controlled by the reactivation of original, spreading-center formed, normal faults, implying that deformation is opportunistic and focused along existing zones of weakness, even when original fault trend is oblique to the direction of relative plate motion. Observed faulting can be interpreted as India-Australia deformation in the northern NER and Capricorn-Australia deformation in the southern NER. The India- Capricorn boundary is directly adjacent to the northern NER and this juxtaposition combined with a different style of faulting to the east of the NER imply that the ridge is a tectonic boundary. 2
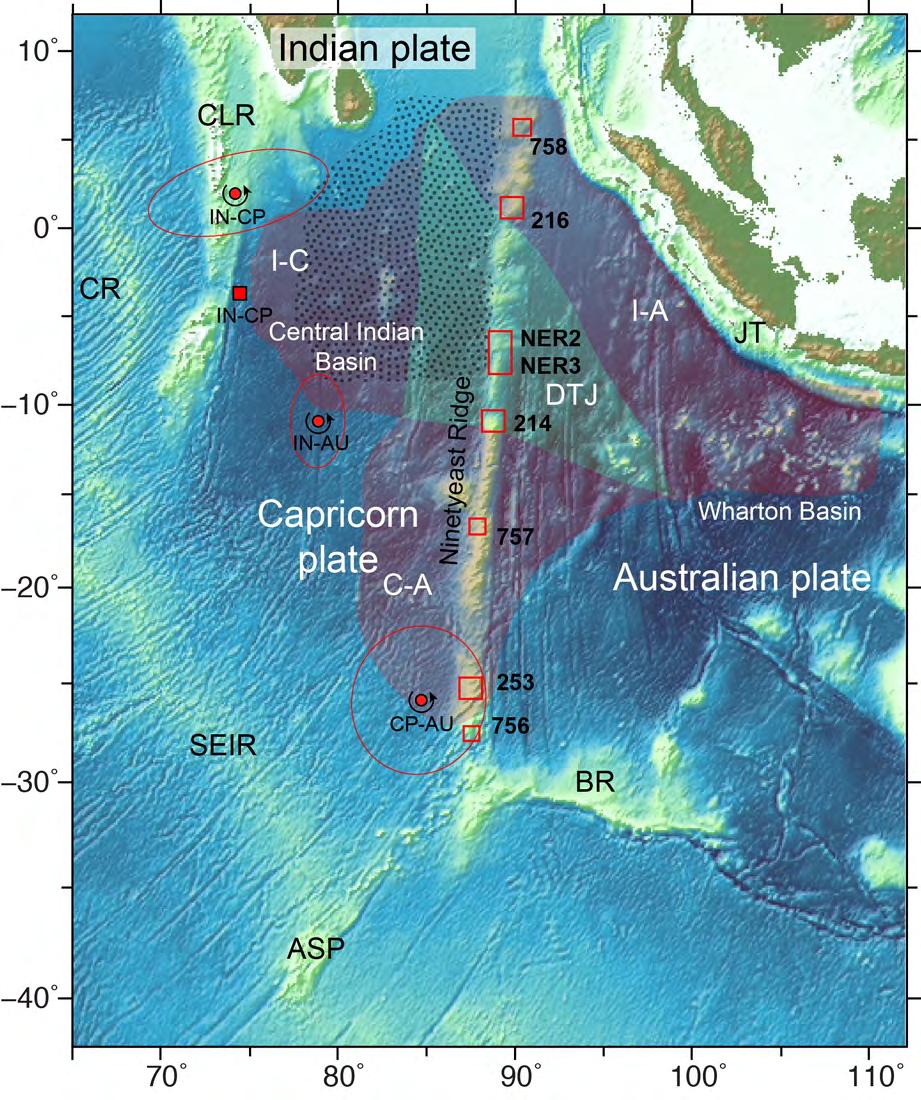
3 Introduction The vast Indo-Australian plate in the central Indian Ocean is breaking into three smaller pieces separated by diffuse boundaries (Fig. 1) [Royer and Gordon, 1997]. Although this location is perhaps the best-documented distributed deformation within an oceanic plate [Gordon, 2000], many details are lacking owing to the large extent and remote location of the affected area. Compressional faults and folds occur in the Central Indian Basin south of India and west of the Ninetyeast Ridge (NER) [Weissel et al., 1980; Petroy and Wiens, 1989; Bull and Scrutton, 1992; Krishna et al., 2001; Delescluse and Chamot Rooke, 2007]. In contrast, deformation is mainly by strike-slip faulting in the Wharton Basin to the east of the NER [Petroy and Wiens, 1989; Stein et al., 1989; Deplus et al., 1998; Deplus, 2001]. In the middle of this deformed zone, the NER is a long (~4500 km) volcanic ridge that displays active seismicity in some locations, but the nature of deformation is unclear because geophysical data are sparse in the region. If the NER is only a passive weal on the oceanic lithosphere, it may simply respond to broadscale tectonic forces with little change to the pattern of faulting extending from adjacent basins. Alternatively, it has been suggested that the NER is a mechanical boundary owing to the apparent change in deformation across it [e.g., Delescluse and Chamot-Rooke, 2007], so faulting may be complex. We examined new multichannel seismic reflection profiles and multibeam bathymetry data from the NER to understand its role in the fracturing of the Indo-Australian plate. We find evidence of active faulting of variable style along its entire length. In this report, we document this faulting and explore implications for the location and style of diffuse plate boundaries. 3
4 Tectonic Development of the Indo-Australian Plate and Formation of the NER The Indo-Australian plate is a Cenozoic amalgamation of two pre-existing plates, India and Australia. During the rifting of Gondwana, both plates formed on the north side of spreading ridges that separated the northward-drifting continents from Antarctica [Norton and Sclater, 1979]. Because both plates drifted almost exactly northward relative to Antarctica and have not rotated significantly, the Indo-Australian plate contains many fracture zones trending approximately N-S with nearly E-W trending magnetic anomalies in between. India and Australia continued as separate plates until the time of anomaly 19 (~42 Ma [Cande and Kent, 1995]) when the Wharton Ridge (located east of the NER, separating India and Australia) jumped southward to form the continuous Southeast Indian Ridge [Royer et al., 1991; Krishna et al., 1995]. At that time, the India and Australia plates were combined. The NER trends nearly N-S and stretches from 31 S at Broken Ridge to 10 N, where it disappears beneath sediments of the Bengal Fan (Fig. 1). Magnetic lineation breaks and satellite altimetry data show that the NER is nearly parallel to fracture zones formed at a paleo-spreading ridge that once separated the India and Australia plates [Royer and Sandwell, 1989; Krishna et al., 1995; 2012]. Many different authors have explained the formation of the NER as a result of various tectonic anomalies [see review by Royer et al., 1991], but the modern consensus is that it was created by hotspot volcanism that emplaced a ridge on the northward drifting Indian plate from Late Cretaceous to early Cenozoic time [Royer et al., 1991; Krishna et al., 2012]. The hotspot was often located near the spreading ridge [Sager et al., 2010; Krishna et al., 2012] and changes in NER morphology may be related to the proximity of the hotspot to the 4
5 spreading ridge [Royer et al., 1991]. Because of its near-ridge location, the hotspot emplaced material on both the Indian and Antarctic plates, with most of the volcanic product ending up on the India plate owing to repeated southward ridge jumps [Krishna et al., 2012]. Nevertheless, the hotspot volcanism produced a remarkably linear age progression that ranges from 77 Ma at Ocean Drilling Program (ODP) Site 758, in the northern NER, to 43 Ma at Deep Sea Drilling Project (DSDP) Site 254 in the southern NER [Krishna et al., 2012]. At ~42 Ma, the large-scale reorganization of spreading centers that brought together the India and Australia plates also moved the hotspot permanently beneath the Antarctic plate, ceasing the NER formation [Royer et al., 1991; Krishna et al., 2012]. 1.2 Diffuse Plate Boundaries in the Central Indian Ocean Plate geometry, seafloor spreading data, and differences in crustal gravity lineations indicate that the northern NER is the location of a diffuse triple junction [Royer and Gordon, 1997] (Fig. 1). Because this triple junction implies that three wide plate boundaries come together, each with different stress fields, different styles of deformation are expected along the NER as it traverses these boundary zones. Euler poles describing relative plate motions occur within two of the diffuse boundaries and as a result, the style of deformation changes along each of these boundaries from extension to compression [Gordon, 2000]. The India-Capricorn Euler pole is located near the equator, close to the Chagos-Laccadive Ridge (Fig. 1) [Royer and Gordon, 1997; DeMets et al., 2010], implying compression south of India and extension between the Chagos-Laccadive Ridge and the Carlsberg Ridge. The Capricorn-Australia pole is located at the southern end of the NER [Royer and Gordon, 1997; DeMets et al., 5
6 ], implying a zone of extension from the Southeast Indian Ridge (SEIR) to the southern NER and compression farther north. In contrast, only compression is expected along the India-Australia boundary, located southwest of the Java Trench, because the Euler pole describing that plate pair is situated in the Central Indian Basin, ~1000 km away from that boundary [Royer and Gordon, 1997; DeMets et al., 2010; Bull et al., 2010]. South of India, distributed deformation occurs within the India-Capricorn plate boundary and is characterized by E-W thrust faults spaced 5-10 km apart and long wavelength ( km) folds [Weissel et al., 1980;Wiens et al., 1986; Bull and Scrutton, 1992]. The thrust faults result from nearly N-S compression reactivating nearly E-W normal faults that were formed in the ocean crust by seafloor spreading [Bull and Scrutton, 1992]. This deformation extends across a broad zone to the west side of the NER (Fig. 1) and began Myr ago [Krishna et al., 2009; Bull et al., 2010]. Earthquakes and seismic reflection profiles in the Wharton Basin imply that it is broken into narrow slivers by reactivation of the nearly N-S trending fracture zones by left-lateral strike-slip motion [Delescluse and Chamot Rooke, 2007; Deplus et al., 1998; Deplus, 2001]. The lateral extent of this reactivation is unclear but has been observed in geophysical data near the equator [Deplus et al., 1998] and in the form of strike-slip earthquakes along fracture zones in the wedge between the Java Trench and the NER [Delescluse and Chamot Rooke, 2007; Satriano et al., 2012]. Although a few NE-SW trending gravity lineations are observed in this region perpendicular to the convergent plate motion direction [Petroy and Wiens, 1989; Stein et al., 1990], the trend of reactivated fracture zones is oblique to the direction of compressive stress and 6
7 presumably this mismatch between stress and fault direction is a result of opportunistic fracturing along inherited zones of weakness caused by original crustal faults. Few earthquakes occur along the southern NER and faulting is poorly documented in this region, so deformation on the Capricorn-Australia boundary is unclear and the boundary may be as much as 2000 km in width [DeMets et al., 2010]. The nature of this boundary in the vicinity of the NER south of the equator is simply not known. 1.3 Seismicity in the Vicinity of the NER Earthquakes occur in a diffuse zone across the Central Indian Basin and Wharton Basin from ~35 S to ~7 N (Fig. 2) [e.g., Delescluse and Chamot Rooke, 2007]. The greatest seismic activity occurs in a band stretching NE-SW from the Java Trench, across the northern NER, into the Central Indian Basin south of India. Near the Java Trench, events are mainly NE thrust faults related to subduction. In the Central Indian Basin, near the equator, these events also display dominantly thrust focal mechanisms, but oriented N-S with some strike-slip mechanisms mixed in (Fig. 2). This pattern is thought to result from compression between the India and Capricorn plates, with thrusting taking place where original normal faults in the oceanic crust are reactivated and strike-slip events occurring on N-S-trending fracture zones [Petroy and Wiens, 1989; Bull and Scrutton, 1990; Delescluse et al., 2008]. South of ~5 S, earthquakes define a sparse NE-SW oriented band that includes the NER. As a result, earthquakes in the Wharton Basin are observed to the north of ~17 S whereas those in the Central Indian Basin are mainly south of ~18 S (Fig. 2). Strike-slip focal mechanisms with WNW-ESE/ENE-WSW nodal planes dominate in the northern Wharton Basin [Petroy and Wiens, 1989; Royer and Gordon, 1997]. They occur mostly 7
8 in the wedge-shaped area from the northern NER to the Java Trench and south to ~15 S and are thought to result mainly from Late Cretaceous and early Cenozoic fracture zones that have been reactivated as left-lateral strike-slip faults [Deplus et al., 1998; Deplus, 2001; Delescluse et al., 2012]. Some of these earthquakes have been remarkably strong for oceanic earthquakes [e.g., Robinson et al., 2001], including a Mw 7.9 shock in 2000 and two recent tremors, Mw 8.6 and 8.2, that occurred on 11 April 2012 [Satriano et al., 2012; McGuire and Beroza, 2012; Meng et al., 2012]. South of ~10 S, focal mechanisms indicate mostly strike-slip and thrust faults, with the former having similar nodal planes to strike-slip mechanisms farther north and the latter showing NW-SE convergence (Fig. 2). At about 10 S, a few thrust focal mechanisms are observed in the Wharton Basin (Fig. 2) near a low SW-NE trending ridge that parallels gravity lineations. These mechanisms may indicate thrust faulting along that feature. A small number of extensional focal mechanisms occur to the southwest of the NER (mostly farther south than the extent of Figure 2), caused by divergence south of the Capricorn-Australia Euler pole [Royer and Gordon, 1987]. Northern NER earthquakes display similar strike-slip mechanisms to nearby Wharton Basin earthquakes and because the nearly N-S nodal plane is close to the trend of the NER, it was proposed that ENE-WSW strike-slip faults occur along the NER [Stein and Okal, 1978]. The seismic energy radiation pattern and aftershock distribution of the 2012 Wharton Basin events indicate that faulting in the northern Wharton Basin and NER is more complex [Satriano et al., 2012; McGuire and Beroza; 2012; Delescluse et al., 2012; Meng et al, 2012]. Although the two main shocks of this cluster align with the expected trend of original Wharton Basin fracture zones, it appears that the 8
9 earthquake swarm activated a lattice of WNW-ESE right lateral strike-slip faults [Meng et al., 2012]. The aftershocks included the northern NER and imply nearly E-W strikeslip faults in that area [Meng et al., 2012]. 1.4 Faulting on the NER Given the diffuse deformation and seismicity in the area, faulting is expected on the NER. Most published observations of NER faults are isolated examples that do not give a comprehensive picture [Veevers, 1974; Naini and Eittreim, 1974; Curray and Munashinge, 1989; Shipboard Scientific Party, 1989a, 1989b]. Virtually all faults reported in prior publications appear to be normal, except for one profile that apparently shows thrust faults on the east side of the southern NER near DSDP Site 214 [Pilipenko, 1996]. E-W trending normal faults have been reported along the length of the NER [Pilipenko, 1996; Sager et al., 2010]. They often form rotated fault blocks and grabens and were probably formed by tension near the spreading ridge during NER formation [Sager et al., 2010]. 2. Data and Methods High-resolution multibeam bathymetry data and 10-fold multichannel seismic (MCS) profiles were collected over the NER during cruise KNOX06RR of the R/V Roger Revelle [Sager et al., 2007]. Multibeam data were acquired using a 12 khz Kongsberg Simrad EM120 sonar system, which yielded swaths of data km in width, allowing detailed imaging of the seafloor at the survey sites. More than 3700 km of MCS data were collected at six sites, four of which are coincident with ODP or DSDP drill sites (Sites 214, 216, 253, and 758). The seismic system used a 48-channel hydrophone array (streamer) and the source consisted of two 9
10 generator-injector (GI) airguns with generator volumes of 45 in 3 (737 cm 3 ) and injector volumes of 105 in 3 (1720 cm 3 ). Seismic data were processed to CDP stack and time migration was produced assuming a single velocity of 1500 ms -1. Acoustic basement was recognized as a strong (high acoustic impedance contrast), widespread reflector beneath which seismic returns were absent, incoherent, or reflectors were intermittent. Throughout much of the study area, acoustic basement was a sharp, well-defined horizon. At a few locations, acoustic basement was absent or extended in depth (i.e., a thick package of reflections) with an appearance similar to sediments in places, perhaps indicating the seismic waves did not reach the igneous pile. In most cases the acoustic basement horizon likely represents the top of the igneous rock beneath the sedimentary section. However, in places where the horizon is thick or has sedimentary characteristics, basement may be volcaniclastic sediments, such as the thick section of volcanic ash cored at DSDP Site 253 [Shipboard Scientific Party, 1974]. Faults were recognized by vertical offsets or discontinuities of sedimentary layers, monoclinal folds, bowing or kinking of sedimentary layers, coherent diffractions cutting sediment horizons, narrow troughs with sediment fill, and narrow grabens. Some faults show extensive deformation over an extended area and are probably the result of fault zones with a number of smaller faults that cannot be recognized individually. Active faults were recognized by the fact that they extend through the sedimentary section from basement to the surface, either causing a seafloor offset or disturbance of recent sediments. Because of the wide spacing of survey sites, we searched for older seismic data that show faults in the NER. Somewhat useful data were collected on three cruises of the 10
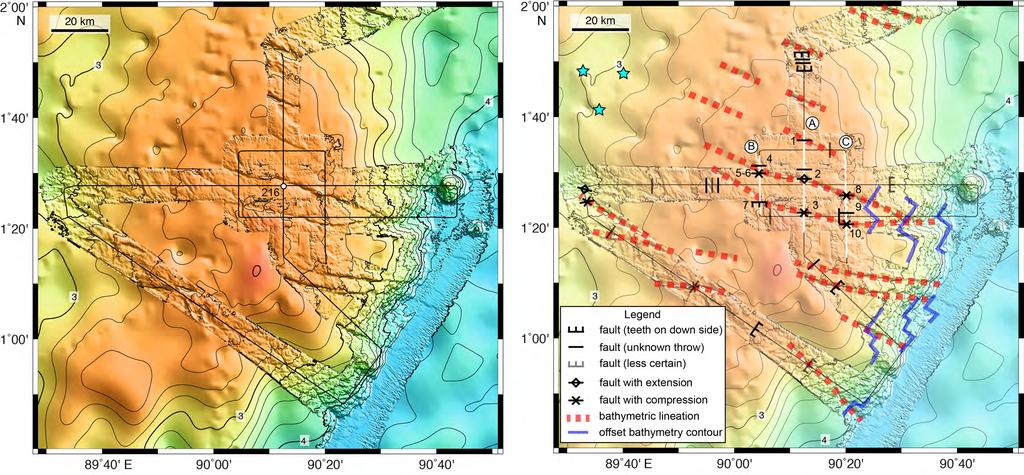
11 R/V Robert Conrad during 1986 that surveyed ODP drill sites (cruises RC2705, RC2707, and RC2708). A single channel streamer was used as the receiver and a single 80 in 3 (1320 cm 3 ) water gun was used as a source [Newman and Sclater, 1988]. Analog seismic profiles from these cruises were obtained from Lamont Doherty Earth Observatory. In addition, a small amount of similar single-channel seismic data collected during ODP Leg 121 was also examined at Site 757 [Shipboard Scientific Party, 1989a; 1989b]. 3. NER Fault Observations Faults were interpreted by observing diagnostic features in seismic sections as described in the previous section and are shown in figures by symbols on bathymetry maps and in seismic sections by arrows that indicate the locations of fault traces near the seafloor. In this section we describe the types of motion inferred from the observed faults. Owing to inadequate imaging or ambiguous geometry, it was not possible to interpret the motions of all faults (usually shown by gray arrows in the figures). 3.1 Site 758 (5.2 N) Site 758 multibeam bathymetry data cover the southern end of a large seamount and two small seamounts to its south (Fig. 3). These data clearly image the fractured nature of the seafloor in the vicinity of the two small seamounts. Approximately 10 bathymetric lineations striking WNW-ESE (~N100 E) are observed crossing almost the entire multibeam data set (Fig. 3). These lineations appear to be small ridges and/or escarpments, often with paired troughs. Bathymetric contours have a jagged appearance, with sharp, nearly right angle offsets of 3-10 km in many places (Fig. 3). These displacements give the appearance that the bathymetric features have been offset. 11
12 Notably, the two small seamounts have nearly N-S trending flank contours that appear to have been offset by ~10 km along the lineation in between them Seismic data show that the NER near Site 758 is extensively faulted (Fig. 4). Faults are apparent on N-S trending seismic lines but are rarely noted on E-W oriented seismic lines, implying that the faults trend nearly E-W, as do the bathymetric lineations. The bathymetric lineations correspond to major faults that show significant offset at the seafloor (e.g., faults 1-2, 6-7, 8; numbers in Fig. 4) Observed faulting at Site 758 implies both compression and strike-slip motion. Compression is indicated by the upwarp of layers (between faults 1-2 and 4-5) and upthrust acoustic basement ( pop-up ) features such as the small block between faults 6-7 and the asymmetric ridge at fault 8. Compression also explains the geometry of fault 3, which shows a break in sediment layers that are upturned at the fault Strike-slip motion is implied by faults that separate sedimentary sections of different thickness and different seismic character, as observed across faults 1-2. In addition, this fault pair is likely a flower structure because the faults appear to converge at depth. Strike-slip motion is also implied by the observed offsets in bathymetric contours Two of the active Site 758 faults connect with offsets of acoustic basement (faults 2, 8). It is difficult to determine whether active faulting is the cause of the offsets because the overlying sediment cover is too thin to compare the sedimentary and basement offsets. 12
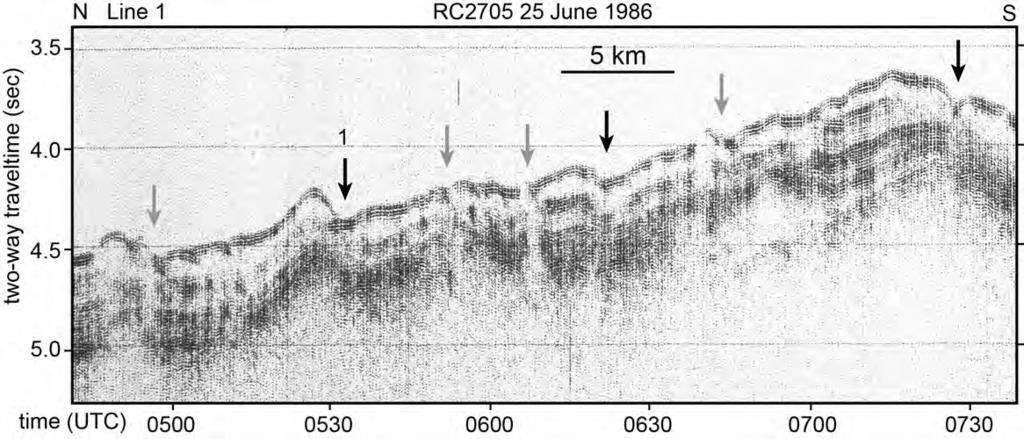
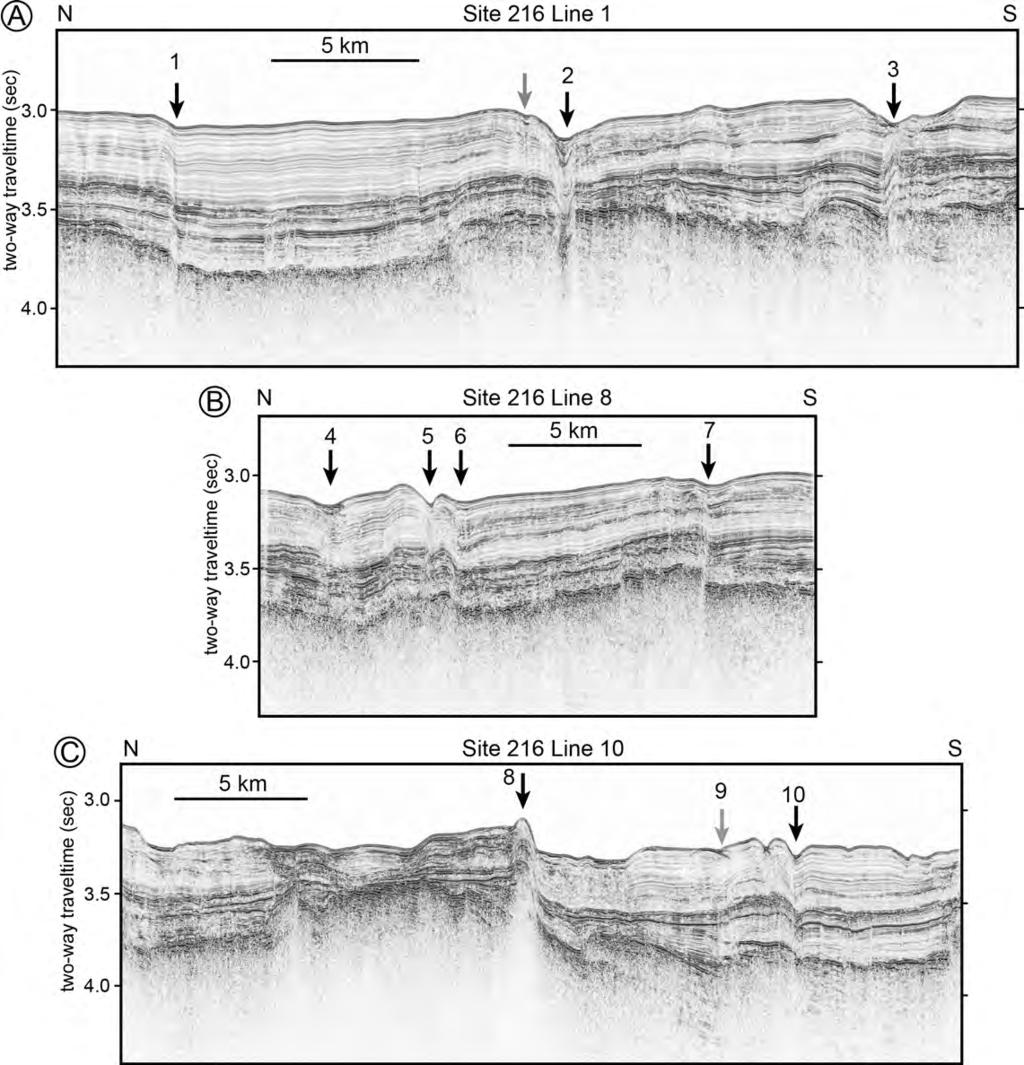
13 Cruise RC2705 seismic data cover a broader area than the KNOX06RR survey and show that faulting is widespread, being observed on all seismic lines (Fig. 5). Where the RC2705 data overlap the multibeam bathymetry, bathymetric lineations correlate with faults (Fig. 4). The resolution of these older data is mediocre and it is difficult to discern details of the faults below the seafloor. Most are recognized only by notches or offsets of the seafloor; although, fault 1 (Fig. 6) displays an asymmetric basement block uplift like that of fault 8 in Figure Site 216 (1.5 N) Multibeam bathymetry data at Site 216 (Fig. 7) show lineations with WNW-ESE trends (~N100 E to N110 E) stretching across the top and east flank of a large seamount. These lineations are mostly troughs incising the sediments. In addition, contours on the eastern flank of the seamount appear jagged, with right angle (mostly left lateral) offsets of a few kilometers, often occurring where intersected by the bathymetric lineations. Seismic sections show that the bathymetric lineations correspond to larger, active faults (faults 2, 3, 5-6, 8; numbers in Fig. 8). Faults are seen most clearly on N-S oriented lines but also are detected on lines with other orientations, consistent with the orientation of the nearly E-W bathymetry lineations Site 216 faulting has similar characteristics to that of Site 758, indicating both compression and strike-slip motion. Compression is indicated by fault 7, which has reversed geometry and occurs at the south edge of a basement pop-up block. Other evidence for compression is the upwarp of sediment layers and acoustic basement observed north of fault 3, between faults 5-6, 9-10, and at fault 8. Fault 3 displays a sharp kink in sediment layering, which may have the same cause. 13
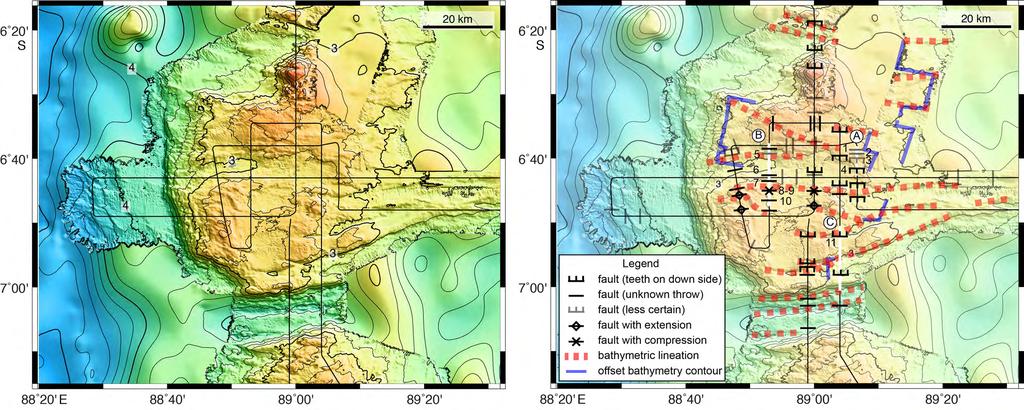
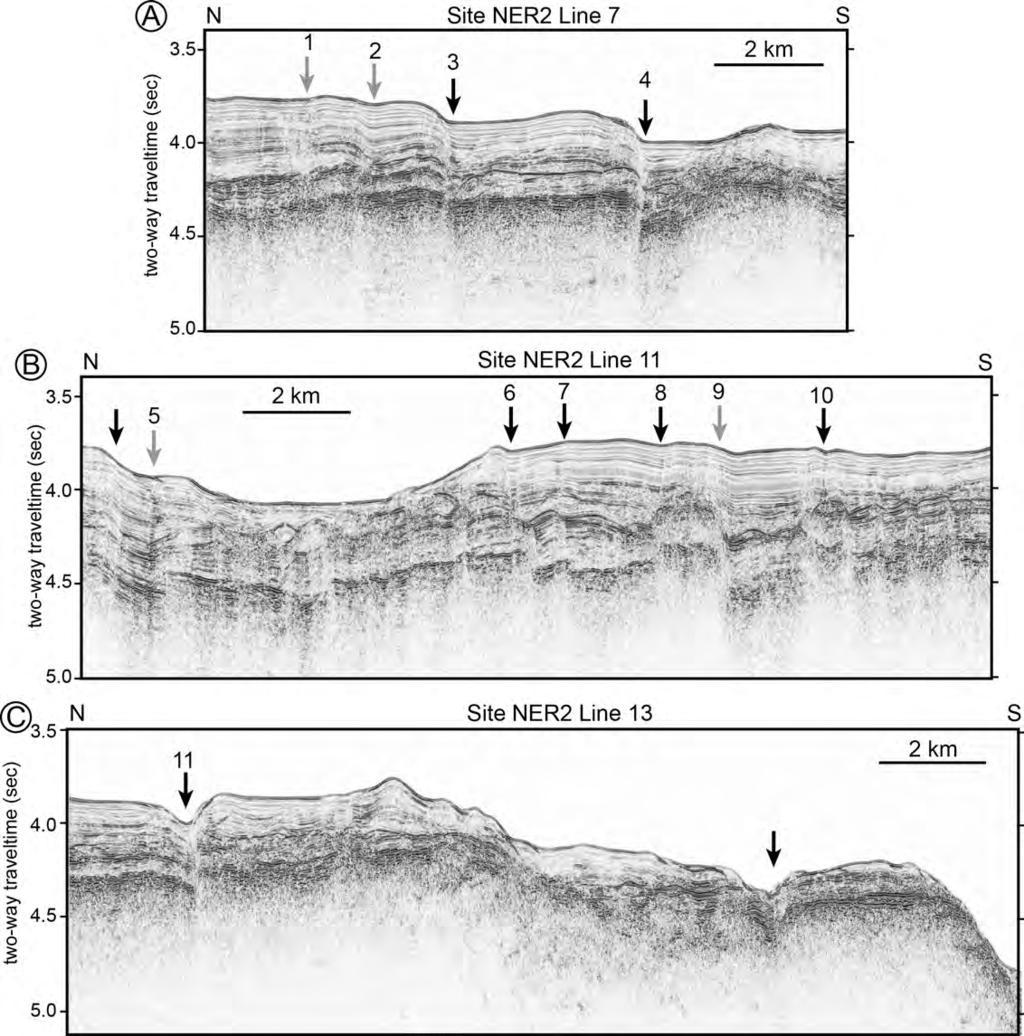
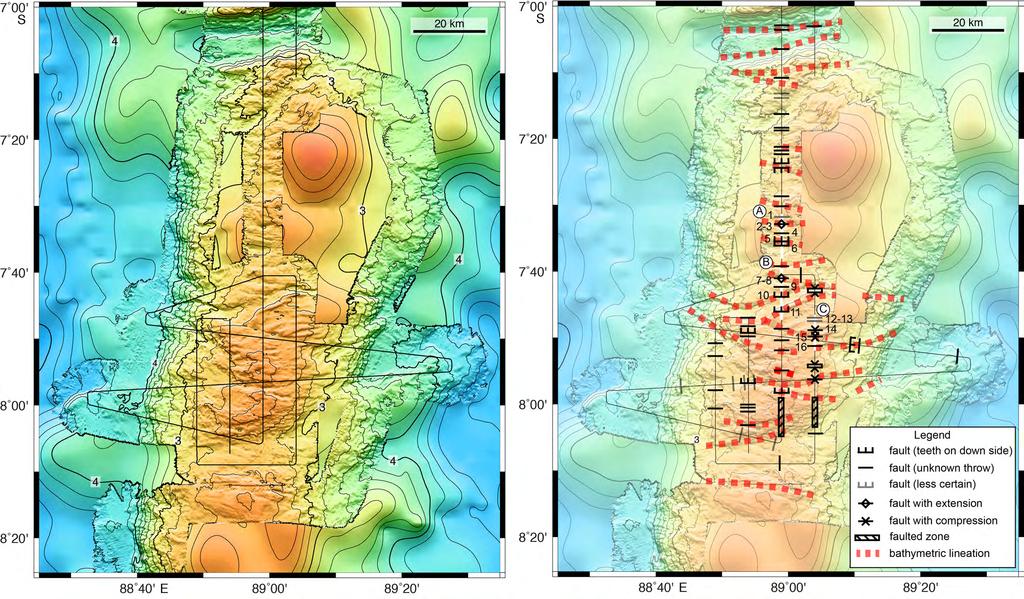
14 The highly-deformed sag trough of fault 2 is a structure commonly observed on strike slip faults. In addition, the sediment layers across this fault have different thicknesses, indicating lateral motion. Sedimentary layers also change thickness and character across faults 4, 7, 8, and 10, likewise implying lateral movements. In the case of fault 8, this observation implies that both reverse and strike-slip motion occurred. Strike-slip faulting is also consistent with the observation of laterally-offset bathymetry contours Offsets of acoustic basement are observed for faults 1, 6, and 7. For the latter two, the acoustic basement offset is larger than the sediment offset, indicating that an older basement fault was reactivated. For fault 1, the offset of acoustic basement and sediment layers is approximately the same, implying that faulting at later stage caused the acoustic basement to develop an offset Site NER2 (6.7 S) Site NER2 encompasses most of a flat-topped seamount with shallow valleys across its top, a steep western flank, and a shallow eastern flank that extends eastward out of the survey (Fig. 9). E-W bathymetric lineations also occur at this site; however, they are not as distinct as at Sites 216 and 758. The most prominent lineation is the trough at the south flank of the seamount, which is a large graben that was probably formed during the construction of the NER [Sager et al., 2010]. Other lineations have similar trends crossing the top of the seamount, with several being traced across the entire summit (Fig. 9). Some seamount bathymetry contours have an angular nature, rather than being rounded, and in several places have right angle bends and offsets similar to those seen at 14
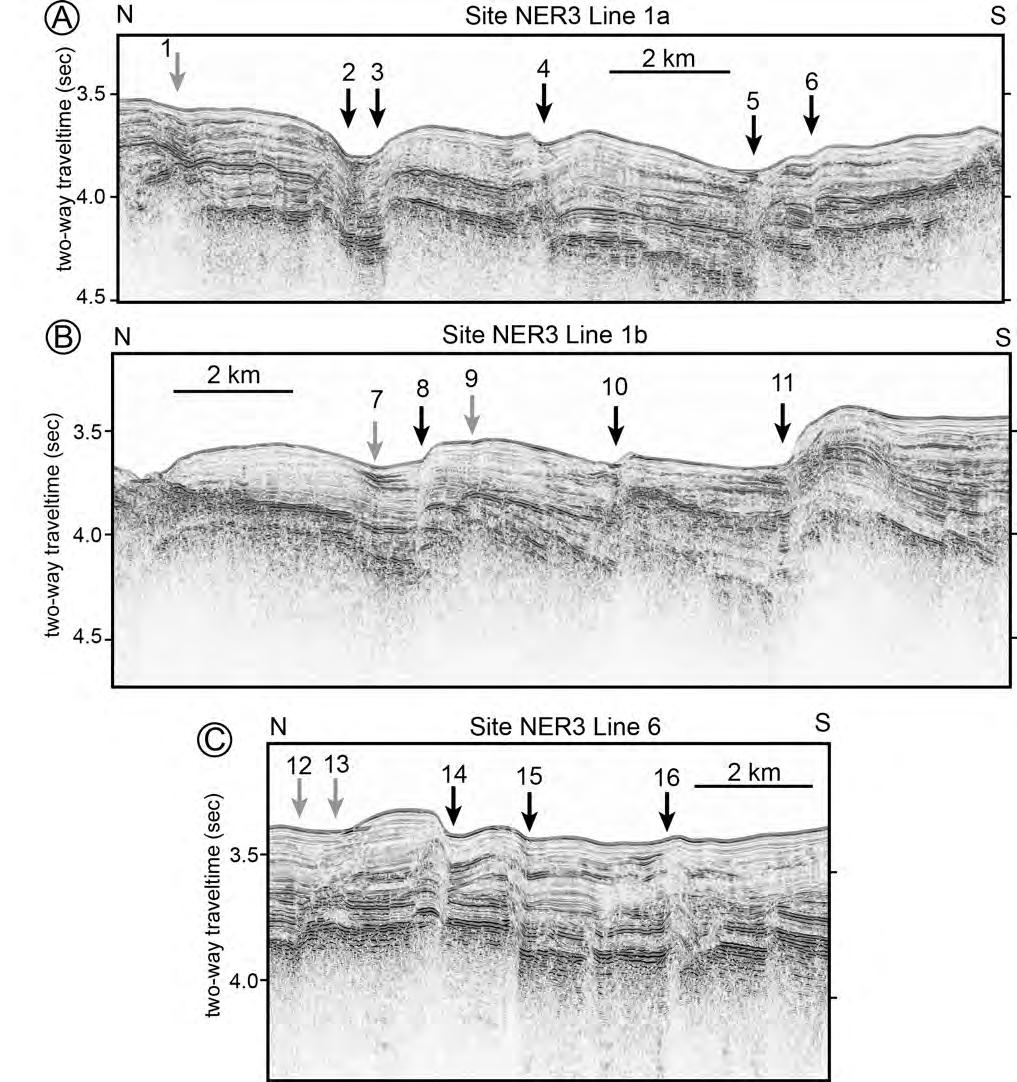
15 sites 758 and 216. These offsets show no consistent trend, some being right-lateral and others left-lateral Seismic lines show that the NER2 seamount is extensively faulted and the bathymetric lineations are correlated with major faults (Figs. 9, 10). Compression is clearly indicated by fault 4, which has a reversed geometry with the hanging wall upthrust and bending of sedimentary layers (Fig. 10). Fault 3 is similar, but the reverse geometry is not as clear. Other evidence of compression is the upwarp of sediment layers observed between faults 1-2, 2-3, 8-9 and near fault 10. Faults 8-9 are associated with a basement pop-up structure. Warping on the north side of fault 11 may also indicate compression. This fault may also have a component of strike-slip motion as indicated by the deformed trough and by slight differences in sediment character across the fault. Fault 6 appears as a small, negative (extensional) flower structure, with two closely spaced faults converging at depth. This fault may indicate strike-slip motion with a small extensional component A number of active faults are rooted in offsets of acoustic basement (faults 4, 5, 7, 8, 9). For most of these, the basement offset is greater than that within the sediments or at the surface, implying reactivation of a pre-existing basement fault Site NER3 (7.7 S) Site NER3 covers much of a small, N-S-trending ridge segment (Fig. 11). Although not as prominent as at other locations, bathymetric lineations are also observed on the summit of the NER3 seamount. Most have nearly E-W trends, but there is significant variability. These lineations correlate with active faults and summit basin 15
16 edges, implying that active deformation affects the seafloor topography. Unlike other sites farther north, there are no apparent offset contours. NER3 acoustic basement is highly dissected and offset, mostly from early extensional faults that formed rotated fault blocks, probably formed during construction [Sager et al., 2010]. These faults strike approximately E-W (Fig. 11) and appear to account for much of the broader topography and the bathymetric lineations, which are formed by fault troughs or ridges Fault geometries imply that both compression and strike-slip faulting occur at this site, with the former being dominant. Compression is indicated by reverse faults 14 and 15 (numbers in Fig. 12). Both faults show hanging walls upthrust relative to footwalls. Fault 3 also appears to be reverse, with basement on the south side upthrust (Fig. 12). Upwarped sediments indicate compression and are observed at faults 4, 10, 11, 14, 16, and perhaps between 5-6 and 8-9. The folds at faults 11 and 14 are large enough to create ridges imaged by the multibeam bathymetry. Compression is also indicated by the basement pop-up feature at fault Strike-slip motion is suggested by subtle differences in sedimentary layer thicknesses across a few faults. This situation occurs at faults 5, 6, 11, perhaps at 14, and across faults 2-3 and 7-8 (Fig. 12). Faults 2-3 form a sag trough similar to features often observed on strike-slip faults. Because fault 3 is a reverse fault, the combination of interpreted compressive and strike-slip motions implies transpression across this set of faults. Faults 7-8 form a graben that is reminiscent of the fault 2-3 trough. Although the sense of motion is not obvious, the upwarp of sediment layers on the south side of this pair likely indicates compression. 16
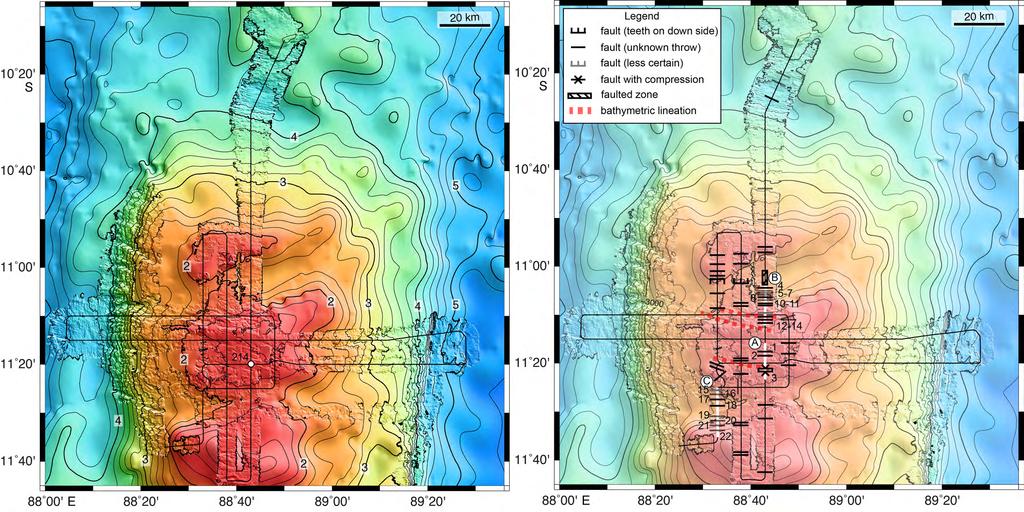
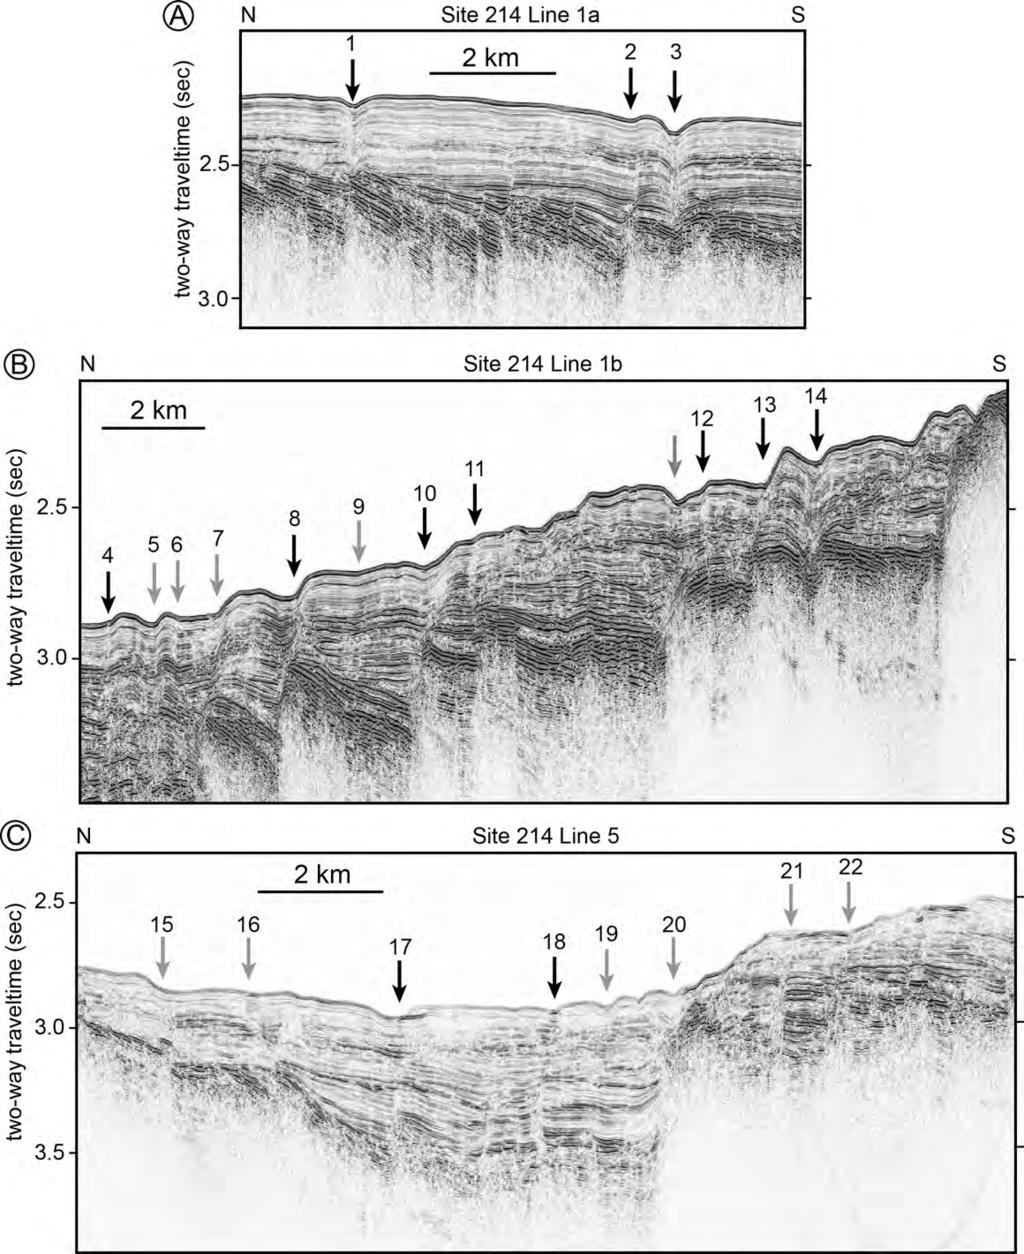
17 Seismic profiles show extensive early deformation of the NER3 ridge in the form of offset and tilted fault blocks that appear normal in nature (Fig. 12B). Many of the active faults connect to these basement offsets. In most cases, the offset of acoustic basement is greater than that of overlying sediments (faults 1, 6, 10, 12-13, 15), implying recent reactivation of an original basement fault. For fault 8, the offset of acoustic basement is similar to that of upper sediment layers, suggesting that the entire basement offset resulted from the active faulting. For fault 14, surface expression appears greater than basement offset because of an expanded recent sediment section caused by recent differential sedimentation Site 214 (11.3 S) The Site 214 survey encompasses a broad area at the northern end of the high, continuous ridge that makes up the southern NER. The surveyed portion of the ridge summit contains three uplifts separated by two swales, both trending ~N70 E (Fig. 13), that apparently formed from extension during formation of the NER [Sager et al., 2010]. Bathymetric lineations are few and no offset bathymetric contours are evident (Fig. 13) Seismic sections in the Site 214 area show extensive faulting and most faults appear to be normal faults as indicated by the hanging wall having moved downward relative to the footwall (e.g., faults 7-11, 12-13, 17, 21, 22; numbers in Fig. 14). Although the stress regime appears dominantly tensional, indications of possible compression and strike-slip are observed. Sediment layer upwarp is noted between faults 2-3 and 4-6, implying compression. Sediment layers at faults 1 and 3 have a v-shape that may indicate strike-slip motion. Thus, it appears that a regime of slight extension is punctuated by zones of compression and strike-slip motion. 17
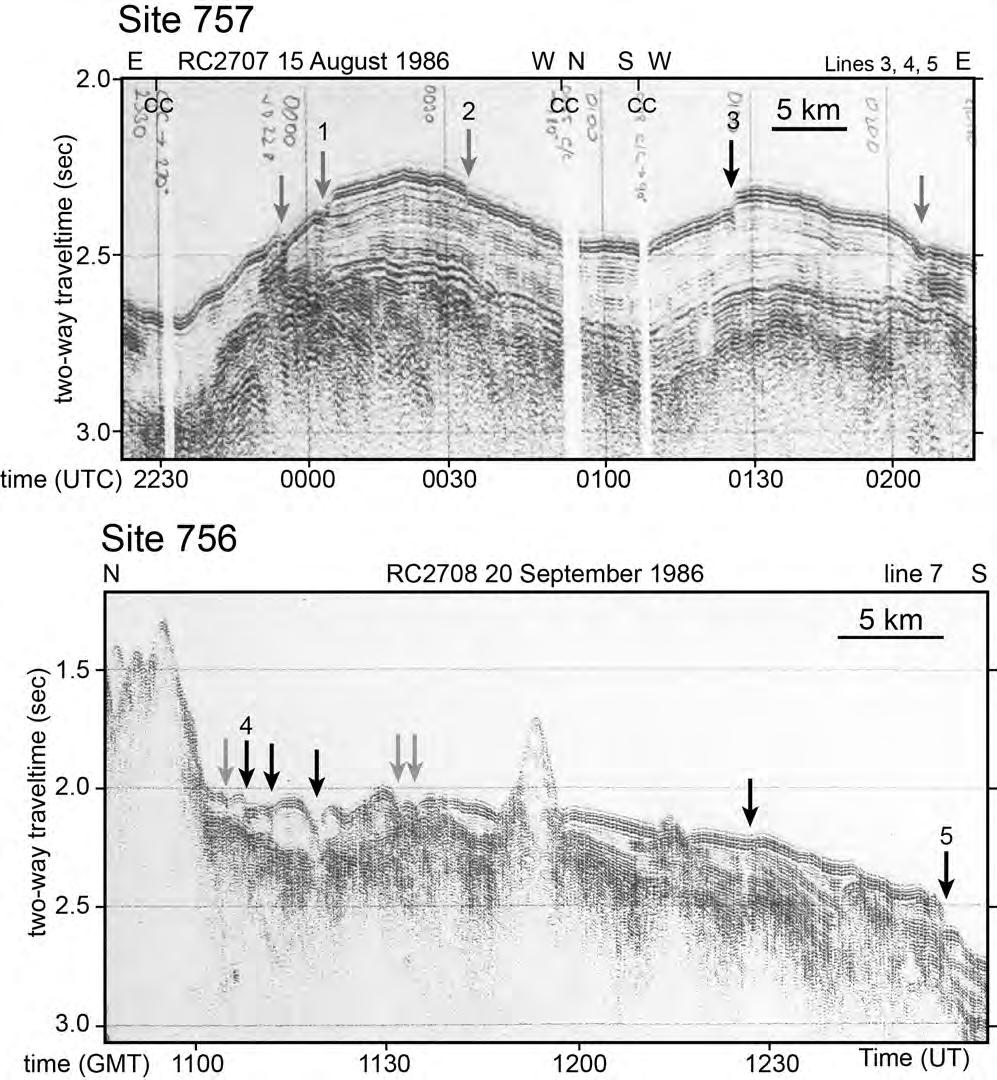
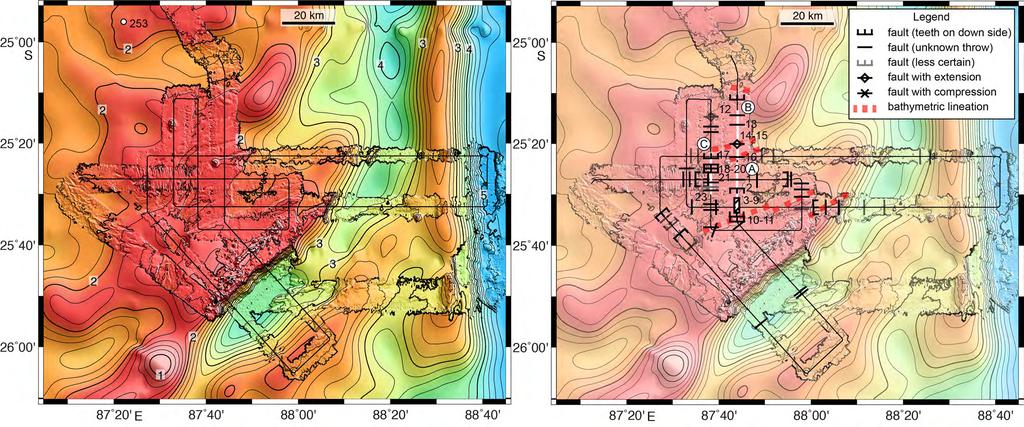
18 Acoustic basement is highly dissected at Site 214, with sediment infill indicating that this intense normal faulting occurred at the time of or soon after ridge construction [Sager et al., 2010]. Many of the active faults are rooted in these original faults. In almost every case an increase in displacement with depth is consistent with basement fault reactivation Site 757 (17.1 S) Multibeam bathymetry data around Site 757 were collected by R/V Sonne [Flueh and Reichert, 1998; Grevemeyer et al., 2001] and single channel seismic data come from cruises RC2707 and ODP Leg 121. The bathymetry map (Fig. 15) shows that the site is located atop the broad dome of a large seamount and there are few bathymetric contours or features of interest. Small (<100 ms TWTT) offsets in the seafloor were mapped (Figs. 15, 16) and are similar to those produced elsewhere by active faulting. Most faults (e.g., numbers 1-3 in Fig. 16) appear to have normal fault geometry, with fallen footwalls creating steep escarpments. Data quality is mediocre, with little detail imaged below the seafloor, so fault interpretation is less certain than sites with recent data Site 253 (25.5 S) The Site 253 survey is slightly offset from the DSDP drill site (Fig. 17) and covers an area of the southern NER that is dissected by a large, NE-trending canyon. Satellite-predicted bathymetry data [Smith and Sandwell, 1997] imply that the ridge is rugged, with number of local highs and lows on the ridge top. Only a few tectonic lineations are noted in the multibeam bathymetry data (Fig. 17), trending NE-SW (~N70 E to N80 E). 18
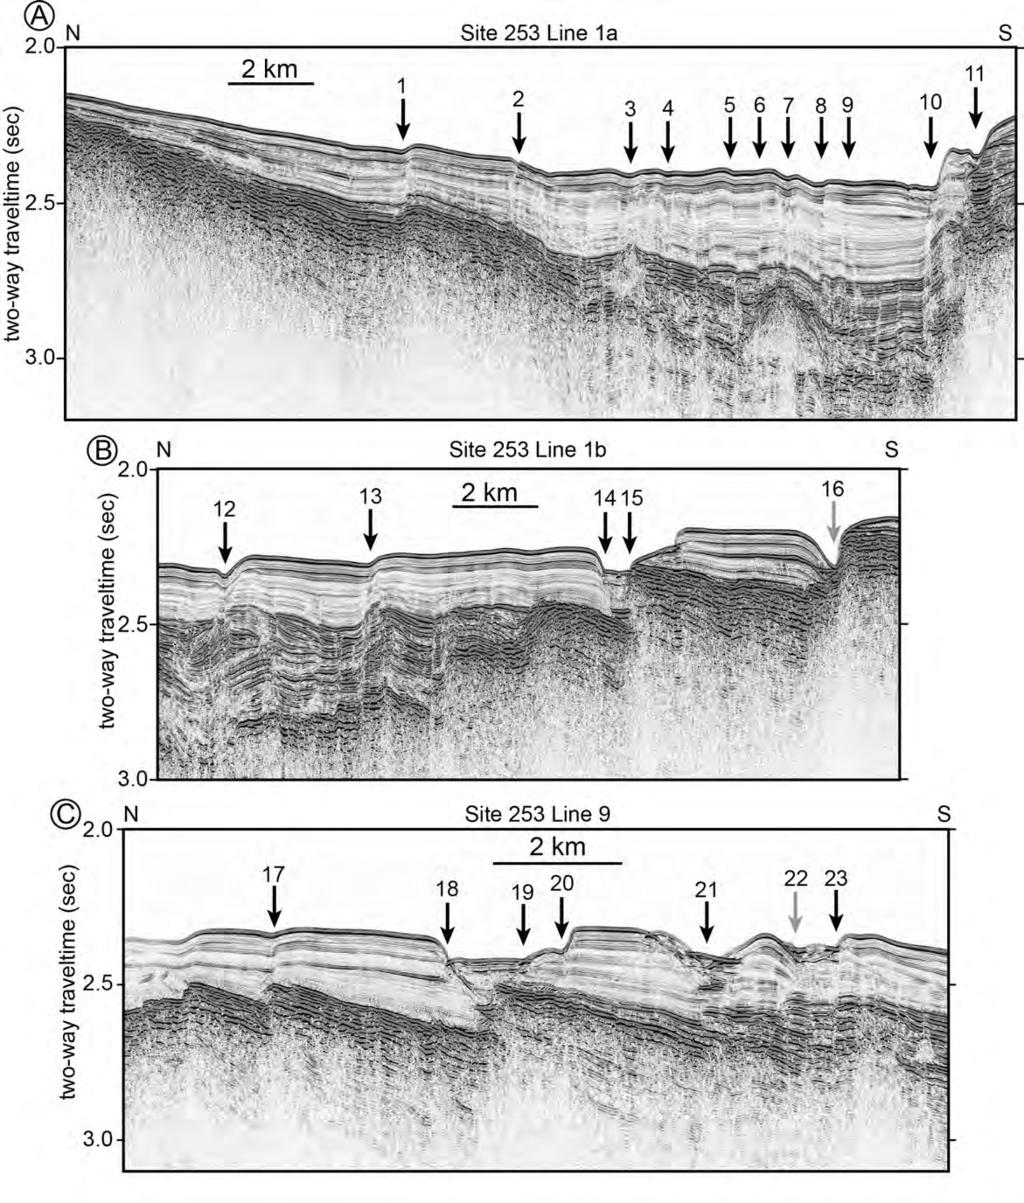
19 Seismic data show that this part of the ridge also experienced extensive early faulting during or shortly after construction, creating large offsets in the acoustic basement as well as large grabens, most of which are filled by sediments (Fig. 18). Seismic sections also show widespread active faulting. Most faults have small offsets (<50 ms TWTT), but a few are larger, especially at the edges of large offset basement fault blocks. Some cause small offsets and undulations of the seafloor (faults 1-9, 13, 17; numbers in Fig. 18) and others are connected with small (fault 12) or large troughs (faults 14-15, 16, 18-20, 21, 22-23). Overall, the faults at Site 253 are mostly normal faults, but there are some indications of other types of motion. Although inter-fault sediment reflectors between faults 1-9 appear to be folded, an observation that could signify compression, we interpret this geometry simply as coeval deformation and sedimentation between closely-spaced normal faults within a zone of intense faulting (at mid-sediment layer depths the faults are clearly normal and layer bending is insignificant). Fault 1 occurs at the edge of a small basement uplift that may have resulted from recent compression because the sediment layer offset is approximately the same as the acoustic basement offset Most active faults are connected to offsets in acoustic basement. For many, the offset of basement or deep sediment layers is approximately the same as that in the upper sediments, implying that the basement offset is a result of the recent faulting (faults 1, 5-8, 13). Fault 17 shows less offset at seafloor than basement offset, whereas faults have more seafloor topography than offset in deep layers. The former observation implies that an original basement fault was reactivated whereas the latter observation suggests that erosion may be a factor in creating these troughs. In some locations, the 19
20 sense of faulting may have changed. Faults 15 and 19 appear to be connected with basement reverse faults, but the seafloor troughs (bounded by faults 14-15, 18-20) indicate extension. These observations imply the reactivation of original basement faults but with a different motion of the active faulting Site 756 (27.3 S) No multibeam bathymetry data are available from Site 756. Satellite-predicted bathymetry data [Smith and Sandwell, 1997] imply that the surface of the NER at this site has significant topography (Figs. 15, 16) similar to nearby Site 253. Single-channel seismic data from R/V Robert Conrad cruise RC2708 show numerous seafloor offsets that are consistent with active faulting (Fig. 16). Although the geometries of most are unclear, faults 4 and 5 (numbers in Fig. 16) appear to have normal geometry. Faults are observed on most seismic lines, both N-S and E-W trending, implying that the fault trends are SW-NE, similar to the bathymetric trends and fault trends at Site 253. Data from Site 756 are of such low quality that little detail is seen below the seafloor, making unique interpretations of fault nature difficult. Active faulting is indicated, but the sense of most faults is uncertain Discussion High-resolution multibeam bathymetry data and 2D multichannel seismic data clearly show active faulting along the entire length of the NER. Although our data have higher resolution than previous NER data sets, both the wide spacing of sites and the coarse spacing of seismic lines at each survey site are limitations to the resolution of the study. Within the survey sites, seismic lines are widely spaced, hampering definition of fault geometry. Many faults have small offsets, are inadequately imaged, or have 20
21 ambiguous geometry, all of which also make some fault interpretations ambiguous. Despite these cautions, the data are far better than any previously available and allow us to make important observations about NER faulting Reactivation of Original NER Faults Active faults visible at the seabed are usually connected with near-vertical steps in the top of acoustic basement (the top of the NER volcanic pile). Analysis of differences in the vertical separation of sediment layers relative to the throw on basement faults indicates whether the recent faulting caused the basement fault or whether a pre-existing fault was reactivated. In some instances the vertical offsets of the sedimentary and basement faults are the same, implying that recent deformation caused the basement offset. For many active faults the basement offset is greater than sediment offset, implying that recent faulting reactivated an original basement fault. The reactivation of pre-existing weaknesses by diffuse plate boundary faulting of the Indo-Australian plate is not a new observation. The same occurs in the Central Indian Basin, where original spreading-ridge-generated normal faults are reactivated as active thrust faults [Bull and Scrutton, 1992]. Similarly, strike-slip faulting in the Wharton Basin is thought to occur by the reactivation of original transform faults [Deplus, 2001; Delescluse et al., 2012]. Evidently the fracturing of the Indo-Australian plate is occurring by opportunistic reactivation of weak zones in the lithosphere created by original faulting. Active fault trends in both the NER and adjacent basins indicate that original fault azimuths, rather than relative plate motion vectors (discussed in the next section) or other factors, determine the pattern and direction of active faulting. 21
22 Deformation within the NER and Implications for Diffuse Plate Boundaries It is expected that observed fault motion could be explained by relative plate motions predicted by the three-plate model of Royer and Gordon [1997], but with uncertainty about the locations of plate boundaries and the response of the lithosphere to the stress field implied by the plate motions. This model is based primarily on seafloor spreading rates and fracture zone trends along central Indian Ocean mid-ocean ridges, which define the plate-pair Euler poles (Fig. 1) [DeMets et al., 2010; Bull et al., 2010]. These poles predict significant variations in relative motions along the NER (Fig. 19A). Predicted motion at a given location depends on the angle that the relative motion vector makes with the plate boundary as well as the assumed plate geometry. Only the most likely combinations are shown in Figure 19A, where it is assumed that the India - Australia and Capricorn - Australia boundaries trend N-S, but the India - Capricorn boundary strikes E- W. Figure 19 shows only the direction of relative motion, but not the magnitude. The amount of movement between the plates is small but greatest for the India-Australia pair (total ~125 km). This is slightly more than twice that for India-Capricorn and roughly five times as much as for Capricorn-Australia [Royer and Gordon, 1997]. Both India- Australia and India-Capricorn Euler poles lie well off the NER, consistent with greater amounts of relative motion (Fig. 1) and greater seismicity (Fig. 2). The Capricorn - Australia Euler pole is near the southern end of the NER and its 95% confidence ellipse encompasses Sites 253 and 756, so the magnitude of relative motion is small and the direction of motion is uncertain at these sites. 22
23 Northern NER (Sites 758 and 216) In the northern NER, prominent WNW-ESE bathymetric lineations are observed at both Sites 758 and 216 and correspond to major active faults that display evidence of strike-slip motion, often with local compression and sometimes extension. Deformation is mostly strike-slip at both sites, consistent with the observed dominance of strike-slip focal mechanisms for northern NER earthquakes (Fig. 2). Compression also occurs at both sites; although, it appears greater at Site 758. Thus, the overall picture in the northern NER is of transpression. Signs of extension occur at both sites, but it is minor in nature. Extension probably occurs on releasing bends where the fault trend deviates from being parallel to the direction of relative motion across the fault, a common feature of strike-slip faults Although all three Euler poles imply NW-SE compression in the northern NER, it is probable that this location is part of the India-Australia plate boundary (Figs. 1, 19) [Royer and Gordon, 1997]. The Euler pole for this plate boundary implies compression at an angle ~45 from the trend of the NER (Fig. 19A, C). This direction is oblique to both the WNW-ESE transform faults observed in the NER and to the ENE-WSW trending fracture zones that are reactivated in the Wharton Basin [Deplus, 2001; Delescluse et al., 2012]. Because the oblique compression is ~45 from the trends of the fracture zones, it makes about the same angle with original spreading-ridge normal faults. Both sets of faults are oriented approximately along Riedel shear directions (Fig. 19C), which likely results in opportunistic reactivation of these faults. Back-projection of the April 2012 Wharton Basin earthquake aftershock pattern suggests that the fault ruptures 23
24 are not exactly parallel to the local magnetic lineations [Meng et al., 2012]. It is unclear whether the small deviation in direction is significant or whether rupturing cuts across the Strike-slip faults with N-S orientations are not observed in the areas of the northern NER that were mapped with multibeam bathymetry data. This finding suggests that prior interpretations of N-S strike-slip motion within the NER [Stein and Okal, 1978; Petroy and Wiens, 1989] are incorrect. Because all observed tectonic lineations in the northern NER are oriented nearly WNW-ESE, it is likely that strike-slip earthquake focal mechanisms in the northern NER indicate motion with that trend. Our data do not cover seafloor in adjacent basins where reactivated, ENE-WSW-oriented fracture zones may exist, so we cannot tell how the NER and Wharton Basin faults connect Strike-slip motion observed within the northern NER is distinct from N-S compression in the Central Indian Basin and ENE-WSW strike-slip in Wharton Basin. These differences imply that this part of NER is indeed a tectonic discontinuity as indicated by Delescluse and Chamot-Rooke [2007]. Because the aftershock distribution related to the April 2012 Wharton Basin earthquake implies a lattice of intersecting WNW-ESE and ENE-WSW strike-slip faults located on the east side of the NER [Meng et al., 2012], it is possible that observed NER faulting is the western edge of that fault pattern Central NER (Sites NER2, NER3) At Sites NER2 and NER3, in the middle of the predicted diffuse triple junction (Fig. 1), active faulting documented by the seismic reflection data is dominantly thrusting on E-W trending faults. Unfortunately, no earthquake focal mechanisms have been 24
25 produced from this portion of the NER (Fig. 2), so such data cannot inform this interpretation. The observation of E-W oriented thrust faults implies N-S compressive stress, which could be a result of either India-Australia or India-Capricorn motion as both vectors have appropriate orientations (Fig. 19A). Capricorn-Australia relative motion is nearly parallel to the observed faults, but significant strike-slip motion is not supported by fault observations. Because these two sites are adjacent to the India-Capricorn deformation zone and have a similar style and direction, the observed Site NER2-NER3 faulting may linked to that in the Central Indian Basin deformation. However, India- Australia relative motion is also plausible as a driver of faulting at this site. An important difference from the Central Indian Basin is that thrust faults at NER2-NER3 have small offsets, but those nearby in the Central Indian Basin can be much larger [Bull and Scrutton, 1992], implying greater strain accumulation in the adjacent basin Evidence of strike-slip motion is observed on some faults within NER2-NER3, suggesting that the relative motion at these sites includes a component parallel to the faults. Strike-slip motion may occur because the relative motion vectors are not-quite perpendicular to the E-W trend of spreading-ridge-formed precursor faults (Fig. 19C). If true, this observation supports the idea that original fault sets localize deformation with recent motions having components both parallel and perpendicular to the fault Southern NER (Sites 214, 757, 253, and 756) In the northern and central NER, observed faulting is well-explained by the predicted relative motions of the three plate system [Royer and Gordon, 1997]. In the southern NER, the translation of relative plate motions into faulting is less clear. One element of uncertainty is the significant shift in plate motions caused by the proximity of 25
26 the Capricorn-Australia pole to the southernmost NER and the fact that the NER crosses from a region of extension to compression in the velocity field of the India-Australia pole. The former situation means that the magnitude of relative motion changes rapidly along the southern NER and the direction is highly uncertain. The latter causes relative motion along a either N-S or E-W oriented faults to shift from convergence north of ~11 S to extension farther south (Fig. 19A, compare Site NER2-NER3 to Site 214). Faults observed in seismic sections at both Sites 214 and 253, at the north and south ends of the high, linear section of the southern NER, mostly have a normal geometry. Data from Sites 757 and 756 are of low quality and do not clearly show the geometry of most observed faults. Although these data are consistent with observations at Sites 214 and 253, we base our interpretations on data from the two recently-surveyed sites. Normal faulting is dominant at both sites, but displacement on active faults appears small, indicating low strain. A few faults at each site show characteristics of possible compression or strike-slip motion. The non-normal faults appear clustered, implying zones of compression or strike-slip motion surrounded by normal faulting. This mixture of fault types suggests that faulting in the southern NER is complex and possibly incompletely defined by the small areas of seismic reflection data available. Normal faulting is unexpected in the southern NER, given that the three focal mechanisms located on this part of the ridge show thrust faulting and strike-slip mechanisms occur in adjacent basins (Fig. 2). Relative plate motions for this part of the NER should be described by the Capricorn-Australia Euler pole (Fig. 1). Although this pole predicts extension for Site 756, it implies compression, not extension, from Site 253 northward (Fig. 19A). Both sites lie within the 95% confidence ellipse of the pole, so 26
27 relative motion predictions are uncertain for these sites. However, if the Euler pole is actually located slightly farther north, then extension is expected at both sites (Fig. 19C), which are then part of a zone of extension extending southwest from the southern NER [Royer and Gordon, 1997] (Fig. 19B). Because of the proximity of the pole and its low rotation rate [Royer and Gordon, 1997], relative motion between the two plates in this area should be very small, but this is consistent with the low strain on observed faults. According to Royer and Gordon [1997], Site 757 is located within the Capricorn- Australia boundary whereas Site 214 is at the junction of that boundary with the diffuse triple junction (Fig. 1). The Capricorn-Australia pole predicts convergence nearly perpendicular to the NER at both locations. Although this prediction is consistent with the thrust fault focal mechanism recorded near Site 757, it does not explain the prevalence of normal faults in seismic sections. In contrast, the India-Australia pole predicts extension at both sites (Fig. 19A), whether or not a fault is oriented N-S or E-W. The abrupt shift from convergence at Site NER2-NER3 to extension at Site 214 could be a result of the former being north of the India-Australia Euler pole and the latter being to the south. For N-S trending faults, the change is small because the relative motion vector has nearly the same orientation, but for E-W oriented faults, the shift is from nearly perpendicular compression to extension. Site 757 is located on a section of the NER that is too far south to be plausibly a part of the India-Australia boundary. Because seismic data are unclear at this site, it is possible that the observed active faulting is compression caused by Capricorn-Australia motion, an interpretation consistent with the thrust focal mechanism located nearby (Fig. 2). 27
28 Tectonic Overview We observe that active faulting within the NER is opportunistic, reactivating original faults mostly in response to regional relative plate motions. It does not seem to matter that the original fault fabric is often at a significant angle from the relative motion vectors, the original faults are weak and therefore break before intact crust. Because the regional stress pattern and relative plate motions are both usually oblique to the fault fabric, many active faults appear to have complex motion. In the northern NER, original normal faults are reactivated mainly as strike-slip faults, but with a component of compression (Fig. 19C, Sites 758, 216). In the central NER, a shift in relative motion directions causes reactivation of early normal faults with mostly compressive motion, but with a component of strike-slip (Fig. 19C, Sites NER2-NER3). The relationship of broad-scale plate motions to active faulting in the southern NER is more complex. Faulting appears a mixture, with widespread extension punctuated with compression or strike-slip motion. This apparent paradox suggests that the southern NER has narrow zones of deformation responding to the regional plate motions with surrounding areas of slight extension. Extension at Sites 253 and 756 may be explained by inclusion in a zone of Capricorn-Australia divergence south of the Euler pole for that plate pair (Fig. 19B). Site 214 is interesting because it shows a dramatic shift from the compressional deformation occurring only a few degrees of latitude farther north at Site NER2-NER3. Given that fault motions at Sites NER2-NER3 and 214 can be explained by the India- Australia pole, we favor the explanation that the NER north of ~11 S is part of the boundary of that plate pair. This abrupt shift could instead represent a more complex blending of deformation in the diffuse triple junction, but we have insufficient data to 28
29 support an explanation of greater complexity. Interestingly, the difference between Sites NER-NER3 and 214 is also apparent in the active strain model of Delescluse and Chamot-Rooke [2007], derived from earthquake focal mechanisms and geodetic GPS measurements. This model shows strong, NNW-SSE compression in the central NER from 3-8 S, but only slight strain south of 8 S. The maximum strain axis direction near Sites NER2-NER3 is coincident with India-Australia motion (Fig. 19A), suggesting this portion of the NER is associated with that boundary. No clear seismic data are available from the ~15 of the southern NER surrounding Site 757. Although existing data show that faulting is occurring at that site, the type of faulting is uncertain. Because earthquake focal mechanisms and the strain model [Delescluse and Chamot-Rooke, 2007] indicate oblique compression approximately coincident with expected Capricorn-Australia motion, it is likely that faulting in this zone is mainly thrust faulting related to the convergence of these two plates. It is clear from seismic data that changes in the style of faulting occur along the NER, sometimes abruptly. Sites 216 and NER2 are separated by ~7 (~780 km) and the mostly strike-slip style of faulting at Sites 758 and 216 is dramatically different from the primarily thrust fault deformation at Sites NER2 and NER3. Between Sites NER3 and 214, separated by only ~2.5 (~260 km), there is an abrupt change from mainly thrust faulting to mainly normal faulting. In addition, several sites (NER3, 214, 253) show evidence of mixed faulting. These changes probably occur because the pre-existing fault fabric at different locations responds to regional changes in relative plate motions and stress orientations. Faulting sometimes appears to change more abruptly than expected 29
30 from the broad shifts in relative motion implied by the three-plate model, an indication that pre-existing structure is an important factor in the fracturing of the plates. Changes in fault style indicate that the NER crosses at least two different diffuse boundaries. The northern NER (Sites 214, NER2-NER3, 216, and 758) appears to show deformation related to the India-Australia plate boundary, whereas the southern NER (Sites 757, 253, 756) shows Capricorn-Australia motion. It is also possible that the diffuse triple junction is more complex and also shows India-Capricorn motion (i.e., Site NER2-NER3). If the NER does not cross the India-Capricorn boundary, it cannot be far away because the thrust faulting in this zone has been observed directly adjacent to the northern NER (Fig. 19B; [Weissel et al., 1980; Bull and Scrutton, 1992]). Such an abrupt change from one relative motion to another is consistent with the observed abrupt change in earthquake style and with deformation models derived from earthquake motion [Deplus, 2001; Delescluse and Chamot-Rooke, 2007]. 5. Conclusions Analyses of seismic reflection data shows that active faulting is found along the entire ~4500 km length of the NER, but with variable intensity and style depending on location relative to diffuse plate boundaries and relative plate motion Euler poles. At all sites, recent deformation has reactivated spreading-center-formed normal faults. Together with similar results in adjacent basins, this finding implies that Indo-Australian plate fracturing occurs mainly by reactivation of faults formed at the time of lithosphere creation. Fault directions are observed to correspond to the original structure rather than the regional plate motion pattern, indicating that pre-existing structure is the most important factor determining fault geometry. 30
31 In the northern NER (north of 1.5 N), the dominant deformation style is transpression on faults having a WNW-ESE trend. The observed direction of strike-slip motion is unexpected because prior interpretations of earthquake focal mechanisms within the northern NER were interpreted to support N-S strike-slip, consistent with reactivation of ancient fracture zones in the nearby Wharton Basin. Apparently NW-SE compression within the India-Australia diffuse plate boundary reactivates original spreading-center normal faults in the NER and fracture zones in the Wharton Basin along oblique Riedel shear directions. In the central NER ( S), deformation shifts to predominantly thrust faulting, similar to that observed in the Central Indian Basin, perhaps with a minor amount of strike-slip motion. Although this deformation could result from either India-Capricorn or India-Australia relative motion, the latter is a simpler explanation because it agrees with interpretations of sites to the north and south. A few faults show evidence of strike-slip motion, suggesting that the stress pattern applied by regional plate motions has a component parallel to the original faults. Deformation style again changes abruptly between 7.7 S to 11.3 S. Southern NER deformation is modest and is expressed mainly as normal faulting, but interrupted by zones of strike-slip or compressional faulting. Extension at the southernmost end of the NER is explained as part of a zone of Capricorn-Australia divergence south of that Euler pole, whereas extension at 11.3 S is explained as part of the India-Australia boundary, as are sites farther north. Although low-resolution seismic data in the gap between these areas show active faulting, the style of faulting is unclear but likely to be Capricorn- Australia convergence consistent with observed thrust fault focal mechanisms. 31
32 Seismic data from the NER indicate that diffuse deformation is widespread and often complex, sometimes with mixtures of different fault types suggesting interplay of regional stresses and pre-existing structures. Our interpretation is that the northern NER shows India-Australia relative motion whereas the southern NER responds to Capricorn- Australia motion. India-Capricorn deformation has been documented to the western edge of the NER, implying that changes in deformation style can be abrupt. This observation agrees with published findings that the northern NER is a break between deformation fields on either side. Although observed deformation can be understood by the framework of larger plate motions, faulting is more complex than existing plate models predict. Acknowledgments. We thank captain Tom Desjardins, seismic technicians Lee Ellett and Brandi Reese, and the crew of the R/V Roger Revelle during cruise KNOX06RR for making data collection possible. We are indebted to Amy Eisin for seismic data processing and Chris Paul, for bathymetry data processing. We thank Halliburton/Landmark for use of ProMAX software and Seismic Micro Technology for use of Kingdom Suite software. We are appreciative of two anonymous reviewers, who provided through and challenging reviews that helped strengthen our analysis. This project was funded by the National Science Foundation (grants OCE and OCE ). 32
33 References Bull, J. M., C. DeMets, K. S. Krishna, D. J. Sanderson, and S. Merkouriev (2010), Reconciling plate kinematic and seismic estimates of lithospheric convergence in the central Indian Ocean, Geology, 38, , doi: /g Bull, J. M., and R. A. Scrutton (1990), Fault reactivation in the central Indian Ocean and the rheology of oceanic lithosphere, Nature, 344, Bull, J. M., and R. A. Scrutton, R. A. (1992), Seismic reflection images of intraplate deformation, central Indian Ocean, and their tectonic significance, Geol. Soc. London J., 149, , doi: /gsjgs Cande, S. C., and D. V. Kent (1995), Revised calibration of the geomagnetic polarity timescale for the Late Cretaceous and Cenozoic, J. Geophys. Res., 100, Curray, J. S., and T. Munasinghe (1989), Timing of intraplate deformation, northeastern Indian Ocean, Earth Planet. Sci. Lett., 94, Delescluse, M., and N. Chamot-Rooke (2007), Instantaneous deformation and kinematics of the India-Australia plate, Geophys. J. Int., 168, , doi: /j X x. Delescluse, M., L. G. J. Montési, and N. Chamot-Rooke (2008), Fault reactivation and selective abandonment in the oceanic lithosphere, Geophys. Res., Lett., 35, 1-5, doi: /2008gl DeMets, D., R. G. Gordon, and D. F. Argus (2010), Geologically current plate motions: Geophys. J. Int., 181, 1-80, doi: /j x x. Deplus, C. (2001), Indian Ocean actively deforms, Science, 292, , doi: /science
34 Deplus, C., M. Diament, H. Hébert, G. Bertrand, S. Dominguez, J. Dubois, J. Malod, P. Patriat, B. Pontoise, and J. J. Sibilla (1998), Direct evidence of active deformation in the eastern Indian oceanic plate, Geology, 26, Flueh, C., and C. Reichert (1998), Cruise report SO131, SINUS seismic investigations at the Ninetyeast Ridge observatory using SONNE and JOIDES RESOLUTION during ODP Leg 179, GEOMAR Rept. 72, Kiel, Germany, 377 pp. Gordon, R. G. (2000), Diffuse oceanic plate boundaries: Strain rates, vertically averaged rheology, and comparisons with narrow plate boundaries and stable plate interiors, in The History and Dynamics of Global Plate Motions, edited by M. A. Richards, R. G. Gordon, and R. D. van der Hilst, R. D., Geophysical Monograph v pp , AGU, Washington, DC. Grevemeyer, I., E. R. Flueh, C. Reichert, J. Bialas, D. Kläschen, and C. Kopp (2001), Crustal architecture and deep structure of the Ninetyeast Ridge hotspot trail from active-source ocean bottom seismology, Geophys. J. Int., 144, International Seismological Centre (2013), On-line Bulletin, Seis. Cent., Thatcham, United Kingdom. Krishna, K. S., H. Abraham, W. W. Sager, M. S. Pringle, F. Frey, D. Gopala Rao, and O. V. Levchenko (2012), Tectonics of the Ninetyeast Ridge derived from spreading records in adjacent ocean basins and age constraints of the ridge, J. Geophys. Res., 117, doi: /2011jb Krishna, K. S., J. M. Bull, and R. A. Scrutton (2001), Evidence for multiphase folding of the central Indian Ocean lithosphere, Geology, 29, , doi: / (2001). 34
35 Krishna, K. S., J. M. Bull, and R. A. Scrutton (2009), Early (pre-8 Ma) fault activity and temporal strain accumulation in the central Indian Ocean, Geology, 37, Krishna, K. S., D. Gopala Rao, M. V. Ramana, V. Subrahmanyam, K. V. L. N. S. Sarma, A. I. Pilipenko, V. S. Scherbakov, and I. V. Radhakrishna Murthy (1995), Tectonic model for the evolution of oceanic crust in the northeastern Indian Ocean from the Late Cretaceous to early Tertiary, J. Geophys. Res., 100, 20,011-20,024. McGuire, J. J., and G. C. Beroza, (2012), A rogue earthquake off Sumatra, Science, 336, Meng, L., J.-P. Ampuero, J. Stock, Z. Duputel, Y. Luo, and V. C. Tsai (2012), Earthquake in a maze: Compressional rupture branching during the 2012 Mw 8.6 Sumatra earthquake, Science, doi: /science Naini, B. R., and S. L. Eittreim (1974), Appendix II. Marine geophysical survey (Site 214 DSDP) on the Ninetyeast Ridge, Indian Ocean, Init. Repts. DSDP, 22, Newman, J. S., and J. G. Sclater (1988), Site surveys of the central and southern Ninetyeast Ridge for the Ocean Drilling Program, Leg 121, UTIG Technical Rept. 74, University of Texas, Austin, TX, 137 pp. Norton, I. O., and J. G. Sclater (1979), A model for the evolution of the Indian Ocean and the breakup of Gondwanaland, J. Geophys. Res., 84, Petroy, D. E., and D. A. Wiens (1989), Historical seismicity and implications for diffuse plate convergence in the northeast Indian Ocean, J. Geophys. Res., 94, 12,301-12,319. Pilipenko, A. I. (1996), Fracture zones of the Ninetyeast Ridge area, Indian Ocean, Geotectonics, 30,
36 Robinson, D. P., C. Henry, S. Das, and J. H. Woodhouse (2001), Simultaneous rupture along two conjugate planes of the Wharton Basin earthquake, Science, 292, Royer, J.-Y., and Gordon, R. G. (1997), The motion and boundary between the Capricorn and Australian plates, Science, 277, Royer, J.-Y., J. W. Peirce, and J. K. Weissel (1991), Tectonic constraints on the hot-spot formation of Ninetyeast Ridge, Proc. ODP, Sci. Res., 121, Royer, J.-Y., and D. T. Sandwell (1989), Evolution of the eastern Indian Ocean since the Late Cretaceous: Constraints from Geosat altimetery, J. Geophys. Res., 94, 13,755-13,782. Sager, W.W. et al. (2007), Cruise Report KNOX06RR R/V Roger Revelle, 82 pp. ( Sager, W. W., C. F. Paul, K. S. Krishna, M. S. Pringle, A. E. Eisin, F. A. Frey, D. Gopala Rao, and O. Levchenko (2010), Large fault fabric of the Ninetyeast Ridge implies near-spreading ridge formation, Geophys. Res. Lett., 37, doi: / 2010GL Satriano, C., E. Kiraly, P. Bernard, and J.-P. Vilotte (2012), The 2012 Mw 8.6 Sumatra earthquake: Evidence of westward sequential seismic ruptures associated to the reactivation of a N-S ocean fabric, Geophys. Res. Lett., 39, doi: /2012gl Shipboard Scientific Party (1974), Site 253, Init. Repts. DSDP, 26, Shipboard Scientific Party (1989a), Ninetyeast Ridge underway geophysics, Proc. ODP, Init. Repts., 121,
37 Shipboard Scientfic Party (1989b), Back pocket foldouts, Proc. ODP, Init. Repts, 121. Smith, W. H. F., and D. T. Sandwell (1997), Global sea floor topography from satellite altimetry and ship depth soundings, Science, 277, Stein, C. A., S. Cloetingh, and R. Wortel (1990), Kinematics and mechanics of the Indian Ocean diffuse plate boundary zone, Proc. ODP. Sci. Res., 116, Stein, C., S. Cloetingh, and R. Wortel (1989), Seasat-derived gravity constraints on stress and deformation in the northeastern Indian Ocean, Geophys. Res. Lett., 16, Stein, S., and E. A. Okal (1978), Seismicity and tectonics of the Ninetyeast Ridge area: evidence for internal deformation of the Indian Plate, J. Geophys. Res., 83, Tinnon, M. J., W. E. Holt, and A. J. Haines (1995), Velocity gradients in the northern Indian Ocean inferred from earthquake moment tensors and relative plate velocities, J. Geophys. Res., 100, 24,315-24,329. Veevers, J. J. (1974), Seismic profiles made underway on Leg 22, Init. Repts. DSDP, 22, Weissel. J. K., R. N. Anderson, and C. A. Gellar (1980), Deformation of the Indo- Australian plate, Nature, 287, Wiens, D. A., S. Stein, C. DeMets, R. G. Gordon, and C. Stein (1986), Plate tectonic models for Indian Ocean "intraplate" deformation, Tectonophysics, 132,
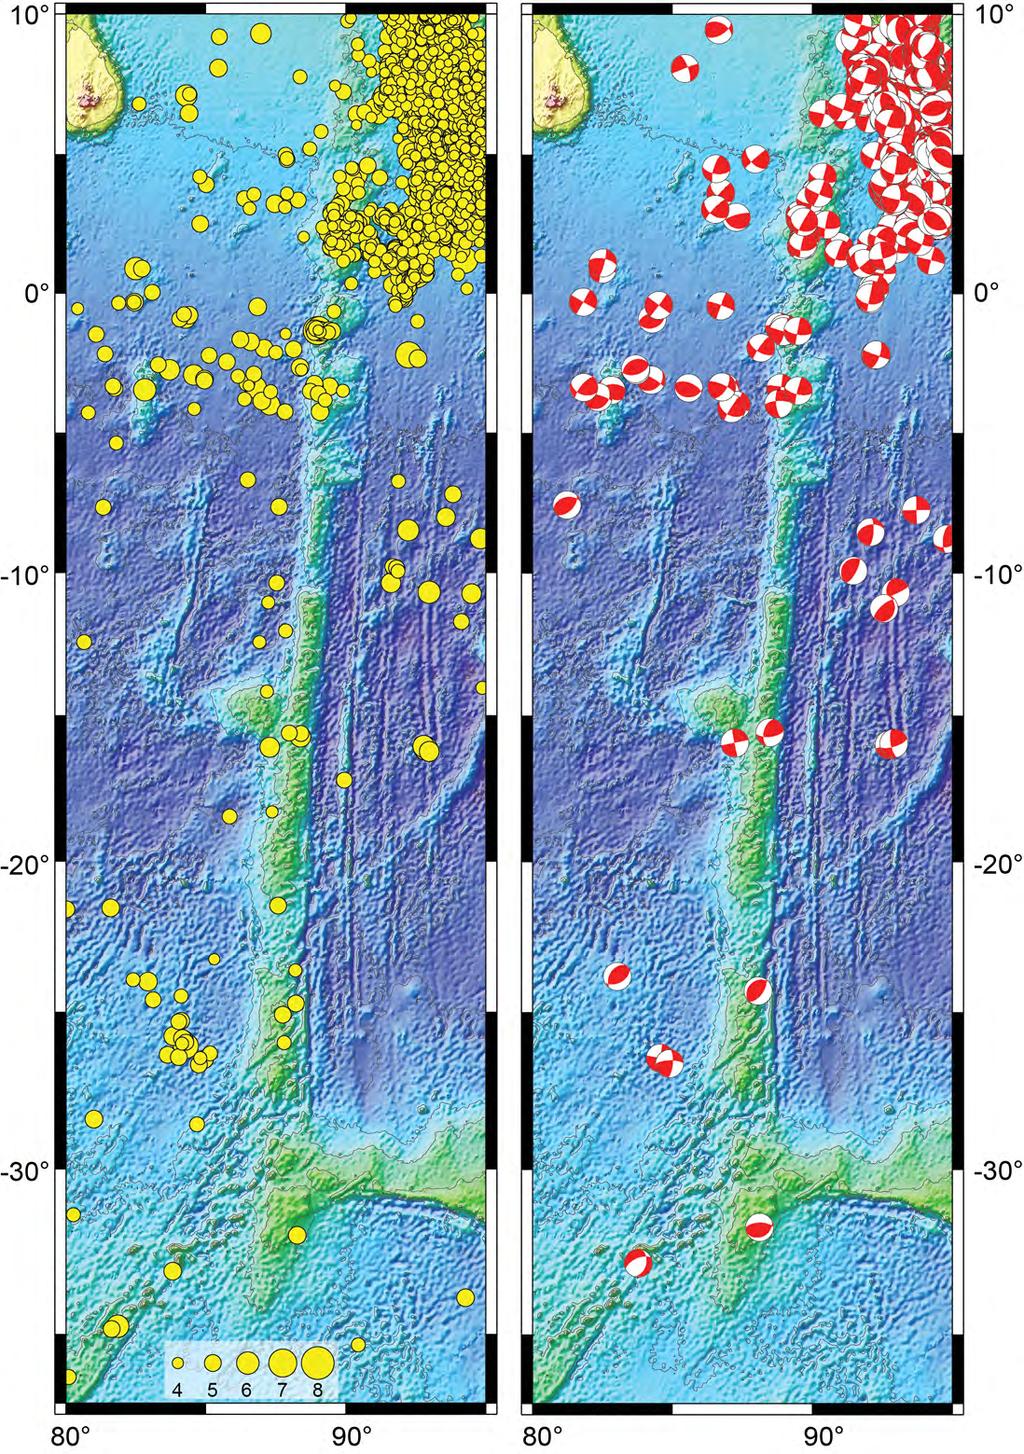
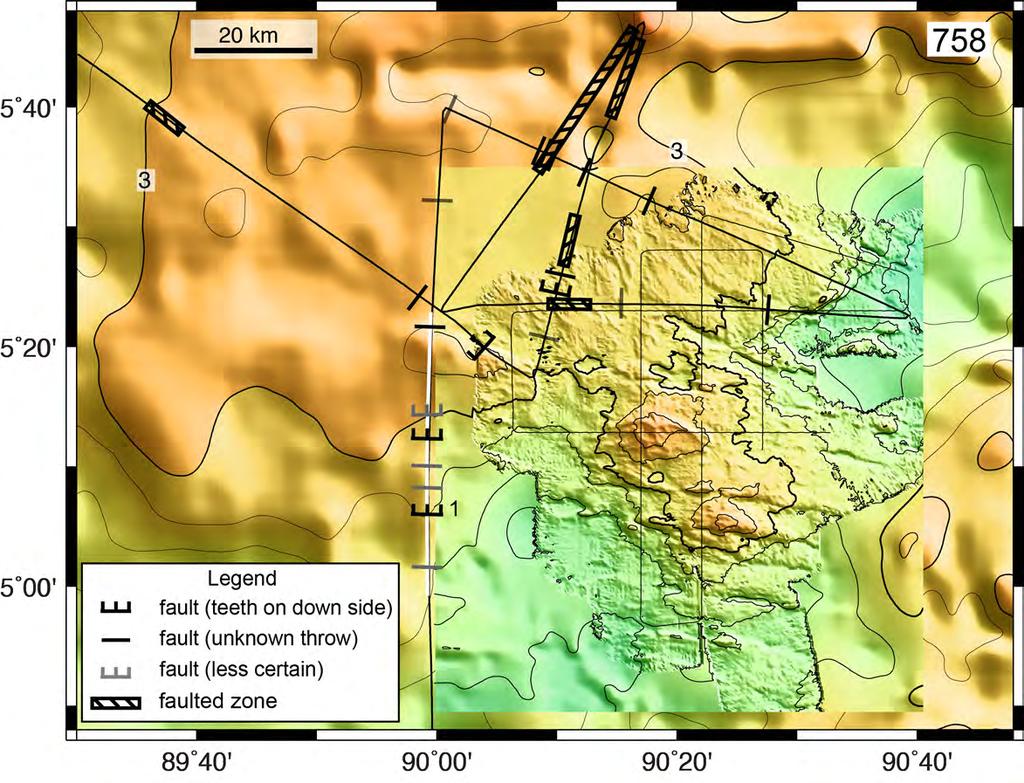
38 Figure Captions Figure 1. Ninetyeast Ridge environs and tectonic setting. Background plot is satellitepredicted bathymetry [Smith and Sandwell, 1997]. Shaded areas around the NER represent diffuse plate boundaries (I-C=India-Capricorn, C-A=Capricorn-Australia, I- A=India-Australia; DTJ=diffuse triple junction) [Royer and Gordon, 1997]. Stippled zone northwest of the NER indicates the area of lithospheric compression resulting from India-Capricorn convergence [Krishna et al., 2001; 2009]. Red boxes show study sites. Red-filled circles denote Euler poles: IN-CP =India-Capricorn, IN-AU=India-Australia, CP-AU=Capricorn-Australia [DeMets et al., 2010]. Red ellipses show pole 95% confidence regions. Red filled square is updated IN-CP pole from Bull et al. [2010]. ASP=Amsterdam-St. Paul Plateau; BR=Broken Ridge; CR=Carlsberg Ridge; CLR=Chagos-Laccadive Ridge; JT=Java Trench; SEIR=Southeast Indian Ridge Figure 2. Earthquakes in the Ninetyeast Ridge vicinity. Left panel shows epicenters from with symbols scaled with body-wave magnitude (scale at bottom). Right panel shows focal mechanisms for the same period. Background is satellite-predicted bathymetry [Smith and Sandwell, 1997]. Data source: International Seismological Centre (2013) Figure 3. Shaded relief bathymetry and tectonic interpretation maps of the Site 758 survey. High detail area is covered with multibeam echosounder data, whereas lowresolution data are satellite predicted depths [Smith and Sandwell, 1997]. (left) Bathymetry. Thin black lines are seismic lines. Open circle shows location of ODP Site 758. Bathymetry contours are at 200-m intervals and contour labels are in km. (right) Tectonic interpretation. Red dashed lines show bathymetric lineaments. Blue lines 38
39 highlight contours with sharp bends. Faults observed in seismic profiles are marked by symbols along seismic track lines; gray symbols denote less certain interpretations. Circled letters identify seismic lines in Figure 4 whereas white track segments denote the extent of the seismic profiles shown in that figure Figure 4. Seismic line examples showing active faults from the Site 758 survey. Seismic sections plot two-way travel time versus distance. Arrows mark faults. Gray arrows denote probable, but less certain fault interpretations. Locations of seismic sections are shown in Figure 3 (letters A, B, C denote line segments labeled in that figure). Numbers identify faults mentioned in the text Figure 5. Fault interpretation map for single-channel seismic data from cruise RC2705 near ODP Site 758. Fault symbols are plotted on seismic lines. High-resolution bathymetry covers the area shown in Figure 3. White line shows the location of the seismic line shown in Figure 6. Low-resolution bathymetry contours are from satellite predicted bathymetry [Smith and Sandwell, 1997] Figure 6. Single channel seismic profile from R/V Robert Conrad cruise RC2705. Conventions as in Figure Figure 7. Shaded relief bathymetry map (left) and tectonic interpretation (right) of the Site 216 survey. White lines denote seismic profiles shown in Figure 8. Open circle shows location of ODP Site 216. Blue stars show locations of aftershock epicenters associated with the 11 April 2012 Wharton Basin earthquake. 39
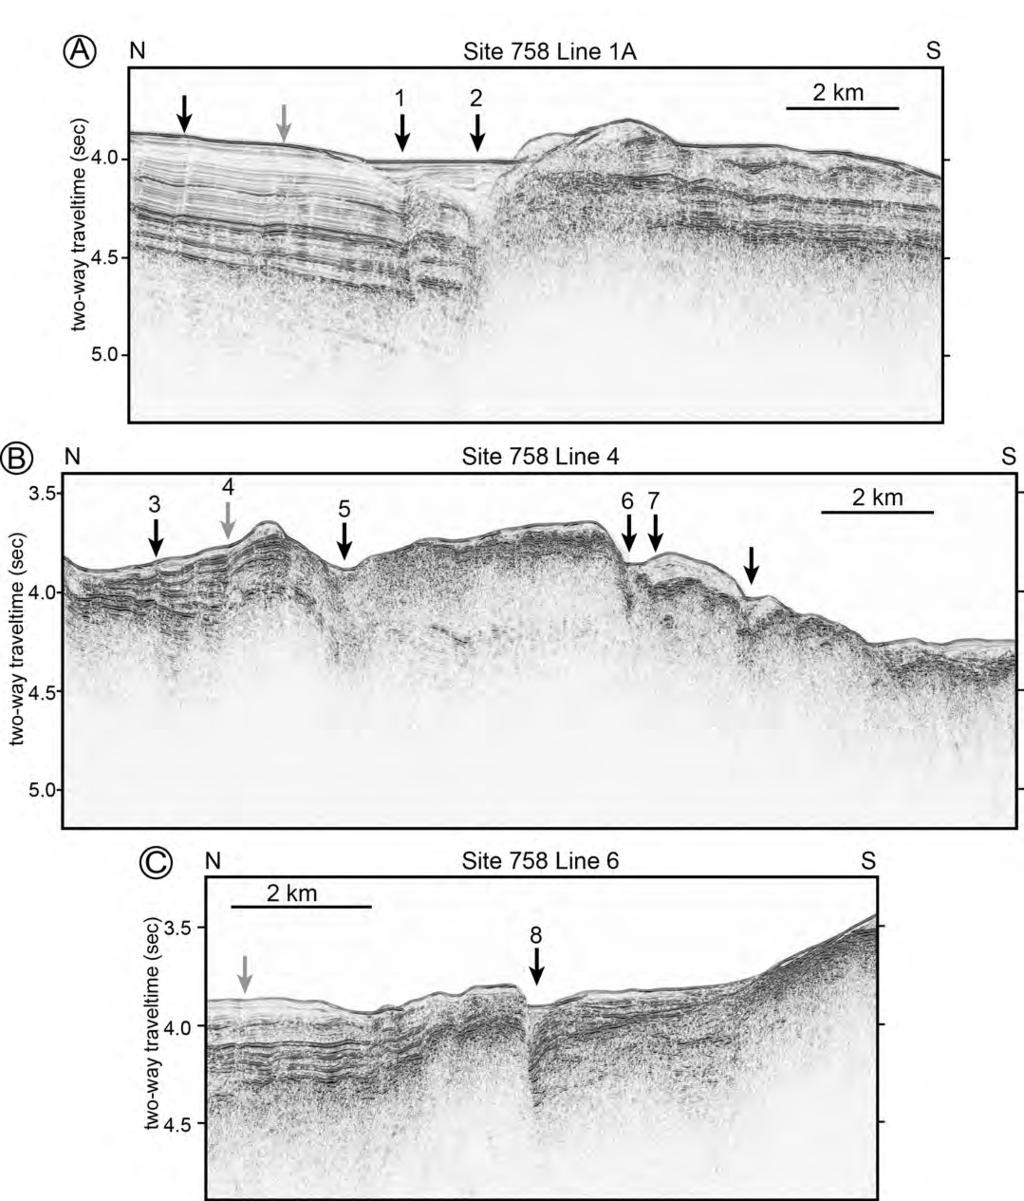
40 Figure 8. Seismic line examples showing active faults from the Site 216 survey. Conventions as in Figure 4. Locations of seismic sections shown in Figure Figure 9. Shaded relief bathymetry map (left) and tectonic interpretation (right) of the Site NER2 survey area. White lines denote seismic profiles shown in Figure Figure 10. Seismic line examples showing active faults from the Site NER2 survey. Conventions as in Figure 4. Locations of seismic sections shown in Figure Figure 11. Shaded relief bathymetry map (left) and tectonic interpretation (right) of the Site NER3 survey. White lines denote seismic profiles shown in Figure Figure 12. Seismic line examples showing active faults from the Site NER3 survey. Conventions as in Figure 4. Locations of seismic sections shown in Figure Figure 13. Shaded relief bathymetry map (left) and tectonic interpretation (right) of the Site 214 survey. White lines denote seismic profiles shown in Figure 14. Open circle shows location of Site Figure 14. Seismic line examples showing active faults from the Site 214 survey. Conventions as in Figure 4. Locations of seismic sections shown in Figure Figure 15. Shaded relief bathymetry around Site 757 (left) and Site 756 (right) and fault interpretations from single-channel seismic data. Heavy line shows ship track of cruises RC2708 (left) and RC2707 (right). Site 757 bathymetry data are multibeam data from R/V Sonne [Flueh and Richert, 1998]. Dashed line in Site 757 survey shows ship track for seismic data collected by the D/V JOIDES Resolution during ODP Leg 121 [Shipboard Scientific Party, 1989a; 1989b]. Site 756 bathymetry is predicted from 40
41 satellite gravity [Smith and Sandwell, 1997]. Interpreted fault symbols are as in other figures (see Figure 3). White portions ship tracks are profiles shown in Figure Figure 16. Single channel seismic profiles from R/V Robert Conrad cruises RC2707 and RC2708. Conventions as in Figure Figure 17. Shaded relief bathymetry (left) and tectonic interpretation (right) maps of the Site 253 survey. White lines show seismic profiles shown in Figure 18. Open circle shows location of Site Figure 18. Seismic line examples showing active faults from the Site 253 survey. Conventions as in Figure 4. Locations of seismic sections shown in Figure Figure 19. Tectonic sketch of relative plate motions, plate boundaries, and inferred fault motions for the Ninetyeast Ridge. (A) Relative plate motions calculated from plate pair Euler poles [DeMets et al., 2010]. Arrows show azimuth and sense of motion. Inward pointing arrows denote compression whereas outward-pointing arrows indicate extension. Black arrows show Capricorn-Australia motion (C-A), middle gray arrows represent India-Australia motion (I-A), and light gray arrows show India-Capricorn motion (I-C). To infer extension and convergence, the plates are assumed to have the configuration shown in Figure 1 with the India-Australia and Capricorn-Australia boundaries oriented N-S but the India-Capricorn boundary trending E-W. In the northernmost NER, Capricorn-Australia motion is not shown because this is an unlikely pairing in this area. The same is true for India-Australia at the southernmost sites. (B) Sketch of plate boundaries around the NER. The large dot pattern shows the zone of India-Capricorn compression [Krishna et al., 2001; 2009], the stippled area denotes the India-Australia 41
42 boundary, and large and small dot patterns indicates the Capricorn-Australia boundary with the latter being a zone of extension and the former, a zone of compression [Royer and Gordon, 1997]. Arrows indicate relative motions predicted by the three plate model. (C) Fault interpretations at survey sites. Boxed diagrams illustrate relative plate motions at the study sites and the fault response. Numbers are site identifiers. The horizontal dashed line represents an E-W fault. Heavy arrows indicate plate motions predicted by three-plate model (IN=India, CP=Capricorn, AU=Australia; Royer and Gordon [1997]). Small arrows indicate motions along the faults; dark arrows denote the sense of primary motion and gray arrows represent secondary sense of motion. Elliptical diagram for Sites shows Riedel shears appropriate for that area
43
44

45
46
47
48
49
50
51
52
53
54
55
56

57
58
59
60

61
Fig Available seismic reflection, refraction, and magnetic profiles from 107 the Offshore Indus Basin close to the representative profile GCDH,
 List of Figures Page No. Fig. 1.1 Generalized physiography of the Indian Ocean along with 2 selected (200 m, 1000 m, 2000 m, and 3000 m) bathymetric contours. Fig. 1.2 Lithospheric plates in the Indian
D. Ravat University of Kentucky Nils Olsen, Chris Finlay, Livia Kother DTU, Technical University of Denmark. With contributions from Mike Purucker
 LCS-1: First lithospheric magnetic field model from CHAMP and Swarm satellites magnetic gradient observations and implications for magnetic anomaly interpretation D. Ravat University of Kentucky Nils Olsen,
Mountains and Mountain Building: Chapter 11
 Mountains and Mountain Building: Chapter 11 Objectives: 1)Explain how some of Earth s major mountain belts formed 2) Compare and contrast active and passive continental margins 3) Explain how compression,
Plate Tectonics - Demonstration
 Name: Reference: Prof. Larry Braile - Educational Resources Copyright 2000. L. Braile. Permission granted for reproduction for non-commercial uses. http://web.ics.purdue.edu/~braile/indexlinks/educ.htm
29. IMPLICATIONS OF DEEP SEA DRILLING, SITES 186 AND 187 ON ISLAND ARC STRUCTURE
 29. IMPLICATIONS OF DEEP SEA DRILLING, SITES 186 AND 187 ON ISLAND ARC STRUCTURE John A. Grow 1, Marine Physical Laboratory, Scripps Institution of Oceanography, La Jolla, California INTRODUCTION Pacific
Chapter 15 Structures
 Chapter 15 Structures Plummer/McGeary/Carlson (c) The McGraw-Hill Companies, Inc. TECTONIC FORCES AT WORK Stress & Strain Stress Strain Compressive stress Shortening strain Tensional stress stretching
Seismotectonics of intraplate oceanic regions. Thermal model Strength envelopes Plate forces Seismicity distributions
 Seismotectonics of intraplate oceanic regions Thermal model Strength envelopes Plate forces Seismicity distributions Cooling of oceanic lithosphere also increases rock strength and seismic velocity. Thus
Chapter 16. Mountain Building. Mountain Building. Mountains and Plate Tectonics. what s the connection?
 Chapter 16 Mountains and Plate Tectonics what s the connection? Mountain Building Most crustal deformation occurs along plate margins. S.2 Active Margin Passive Margin Mountain Building Factors Affecting
What Forces Drive Plate Tectonics?
 What Forces Drive Plate Tectonics? The tectonic plates are moving, but with varying rates and directions. What hypotheses have been proposed to explain the plate motion? Convection Cells in the Mantle
A) B) C) D) 4. Which diagram below best represents the pattern of magnetic orientation in the seafloor on the west (left) side of the ocean ridge?
 B) C) D) 4. Which diagram below best represents the pattern of magnetic orientation in the seafloor on the west (left) side of the ocean ridge?") 1. Crustal formation, which may cause the widening of an ocean, is most likely occurring at the boundary between the A) African Plate and the Eurasian Plate B) Pacific Plate and the Philippine Plate C)
1. Crustal formation, which may cause the widening of an ocean, is most likely occurring at the boundary between the A) African Plate and the Eurasian Plate B) Pacific Plate and the Philippine Plate C)
GEOLOGY MEDIA SUITE Chapter 13
 UNDERSTANDING EARTH, SIXTH EDITION GROTZINGER JORDAN GEOLOGY MEDIA SUITE Chapter 13 Earthquakes 2010 W.H. Freeman and Company Three different types of seismic waves are recorded by seismographs Key Figure
Geologic Structures. Changes in the shape and/or orientation of rocks in response to applied stress
 Geologic Structures Changes in the shape and/or orientation of rocks in response to applied stress Figure 15.19 Can be as big as a breadbox Or much bigger than a breadbox Three basic types Fractures >>>
Answers: Internal Processes and Structures (Isostasy)
") Answers: Internal Processes and Structures (Isostasy) 1. Analyse the adjustment of the crust to changes in loads associated with volcanism, mountain building, erosion, and glaciation by using the concept
Answers: Internal Processes and Structures (Isostasy) 1. Analyse the adjustment of the crust to changes in loads associated with volcanism, mountain building, erosion, and glaciation by using the concept
Pacific Antarctic Australia motion and the formation of the Macquarie Plate
 Geophys. J. Int. (2004) 157, 399 414 doi: 10.1111/j.1365-246X.2004.02224.x Pacific Antarctic Australia motion and the formation of the Macquarie Plate Steven C. Cande 1 and Joann M. Stock 2 1 Scripps Institution
Earth Science, (Tarbuck/Lutgens) Chapter 10: Mountain Building
 Chapter 10: Mountain Building") Earth Science, (Tarbuck/Lutgens) Chapter 10: Mountain Building 1) A(n) fault has little or no vertical movements of the two blocks. A) stick slip B) oblique slip C) strike slip D) dip slip 2) In a(n) fault,
Earth Science, (Tarbuck/Lutgens) Chapter 10: Mountain Building 1) A(n) fault has little or no vertical movements of the two blocks. A) stick slip B) oblique slip C) strike slip D) dip slip 2) In a(n) fault,
SITE SURVEY FOR SITE 410, AN EXAMPLE OF THE USE OF LONG-RANGE SIDE-SCAN SONAR (GLORIA)
") 10. SITE SURVEY FOR SITE 410, AN EXAMPLE OF THE USE OF LONG-RANGE SIDE-SCAN SONAR (GLORIA) R. C. Searle and A. S. Laughton, Institute of Oceanographic Sciences, Wormley, GU8 5UB, UK and B. D. Loncarevic,
10. SITE SURVEY FOR SITE 410, AN EXAMPLE OF THE USE OF LONG-RANGE SIDE-SCAN SONAR (GLORIA) R. C. Searle and A. S. Laughton, Institute of Oceanographic Sciences, Wormley, GU8 5UB, UK and B. D. Loncarevic,
The influence of short wavelength variations in viscosity on subduction dynamics
 1 Introduction Deformation within the earth, driven by mantle convection due primarily to cooling and subduction of oceanic lithosphere, is expressed at every length scale in various geophysical observations.
10. Paleomagnetism and Polar Wandering Curves.
 Map of ocean floor Evidence in Support of the Theory of Plate Tectonics 10. Paleomagnetism and Polar Wandering Curves. The Earth's magnetic field behaves as if there were a bar magnet in the center of
3. The diagram below shows how scientists think some of Earth's continents were joined together in the geologic past.
 1. The map below shows the present-day locations of South America and Africa. Remains of Mesosaurus, an extinct freshwater reptile, have been found in similarly aged bedrock formed from lake sediments
Directed Reading. Section: How Mountains Form MOUNTAIN RANGES AND SYSTEMS. Skills Worksheet
 Skills Worksheet Directed Reading Section: How Mountains Form 1. How high is Mount Everest? a. about 1980 km above sea level b. more than 8 km below sea level c. more than 8 km above sea level d. more
Chapter Review USING KEY TERMS. asthenosphere uplift continental drift. known as. tectonic plates move. object. UNDERSTANDING KEY IDEAS
 Skills Worksheet Chapter Review USING KEY TERMS 1. Use the following terms in the same sentence: crust, mantle, and core. Complete each of the following sentences by choosing the correct term from the
Plate Tectonics. entirely rock both and rock
 Plate Tectonics I. Tectonics A. Tectonic Forces are forces generated from within Earth causing rock to become. B. 1. The study of the origin and arrangement of Earth surface including mountain belts, continents,
Chapter 10: Deformation and Mountain Building. Fig. 10.1
 Chapter 10: Deformation and Mountain Building Fig. 10.1 OBJECTIVES Describe the processes of rock deformation and compare and contrast ductile and brittle behavior in rocks. Explain how strike and dip
11.1 Rock Deformation
 Tarbuck Lutgens Mountain Building 11.1 Rock Deformation Factors Affecting Deformation Factors that influence the strength of a rock and how it will deform include temperature, confining pressure, rock
Crustal Deformation. Earth Systems 3209
 Crustal Deformation Earth Systems 3209 Crustal Deformation pg. 415 Refers to all changes in the original form and/or size of a rock body. May also produce changes in the location and orientation of rocks.
4 Deforming the Earth s Crust
 CHAPTER 7 4 Deforming the Earth s Crust SECTION Plate Tectonics BEFORE YOU READ After you read this section, you should be able to answer these questions: What happens when rock is placed under stress?
Practice Questions: Plate Tectonics
 Practice Questions: Plate Tectonics 1. Base your answer to the following question on The block diagram below shows the boundary between two tectonic plates. Which type of plate boundary is shown? A) divergent
Geological features and geophysical signatures of continental margins of India
 Geological features and geophysical signatures of continental margins of India K. S. Krishna National Institute of Oceanography, Dona Paula, Goa-43 4. krishna@nio.org The shape and classification of continental
Learning Objectives (LO) What we ll learn today:!
 What we ll learn today:!") Learning Objectives (LO) Lecture 13: Mountain Building Read: Chapter 10 Homework #11 due Tuesday 12pm What we ll learn today:! 1. Define the types of stress that are present in the crust! 2. Define the
Learning Objectives (LO) Lecture 13: Mountain Building Read: Chapter 10 Homework #11 due Tuesday 12pm What we ll learn today:! 1. Define the types of stress that are present in the crust! 2. Define the
Global Tectonics. Kearey, Philip. Table of Contents ISBN-13: Historical perspective. 2. The interior of the Earth.
 Global Tectonics Kearey, Philip ISBN-13: 9781405107778 Table of Contents Preface. Acknowledgments. 1. Historical perspective. 1.1 Continental drift. 1.2 Sea floor spreading and the birth of plate tectonics.
Description of faults
 GLG310 Structural Geology Description of faults Horizontal stretch Crustal thickness Regional elevation Regional character Issues Normal Thrust/reverse Strike-slip >1 1 in one direction and < 1 in
Introduction to Oceanography. Chapter 2: Plate Tectonics Overview
 Introduction to Oceanography Chapter 2: Plate Tectonics Overview Much evidence supports plate tectonics theory. The plate tectonics model describes features and processes on Earth. Plate tectonic science
USU 1360 TECTONICS / PROCESSES
 USU 1360 TECTONICS / PROCESSES Observe the world map and each enlargement Pacific Northwest Tibet South America Japan 03.00.a1 South Atlantic Arabian Peninsula Observe features near the Pacific Northwest
CHAPTER 2 THE WAY THE EARTH WORKS: EXAMINING PLATE TECTONICS
 CHAPTER 2 THE WAY THE EARTH WORKS: EXAMINING PLATE TECTONICS Coverage of plate tectonics is required early in introductory Geology as context for the mineralogy, petrology, structure, internal processes,
Seismic stratigraphy, some examples from Indian Ocean, interpretation of reflection data in interactive mode
 Seismic stratigraphy, some examples from Indian Ocean, interpretation of reflection data in interactive mode K. S. Krishna National Institute of Oceanography, Dona Paula, Goa-403 004. krishna@nio.org Seismic
Earthquakes = shaking of Earth because of a rapid release of energy
 There are more than 30,000 earthquakes worldwide each year! Earthquakes = shaking of Earth because of a rapid release of energy usually because of movement of tectonic plates Most earthquakes last for
The Ocean Floor Earth Science, 13e Chapter 13
 The Ocean Floor Earth Science, 13e Chapter 13 Stanley C. Hatfield Southwestern Illinois College The vast world ocean Earth is often referred to as the blue planet Seventy-one percent of Earth s surface
Section 2: How Mountains Form
 Section 2: How Mountains Form Preview Objectives Mountain Ranges and Systems Plate Tectonics and Mountains Types of Mountains Objectives Identify the types of plate collisions that form mountains. Identify
Continental Margin Geology of Korea : Review and constraints on the opening of the East Sea (Japan Sea)
") Continental Margin Geology of Korea : Review and constraints on the opening of the East Sea (Japan Sea) Han-Joon Kim Marine Satellite & Observation Tech. Korea Ocean Research and Development Institute
Continental Margin Geology of Korea : Review and constraints on the opening of the East Sea (Japan Sea) Han-Joon Kim Marine Satellite & Observation Tech. Korea Ocean Research and Development Institute
Chapter. Mountain Building
 Chapter Mountain Building 11.1 Rock Deformation Factors Affecting Deformation Factors that influence the strength of a rock and how it will deform include temperature, confining pressure, rock type, and
Plate Tectonics on a Plane. Observations related to plate tectonics " " Plate tectonic theory types of plate boundaries!
 Plate Tectonics on a Plane Scripps Inst. Of Oceanography" Observations related to plate tectonics " Ocean and continent topography, hypsometry, and crustal thickness. Global seismicity, Benioff zones,
How mountains are made. We will talk about valleys (erosion and weathering later)
") How mountains are made We will talk about valleys (erosion and weathering later) http://www.ilike2learn.com/ilike2learn/mountainmaps/mountainranges.html Continent-continent plate convergence Less dense,
How mountains are made We will talk about valleys (erosion and weathering later) http://www.ilike2learn.com/ilike2learn/mountainmaps/mountainranges.html Continent-continent plate convergence Less dense,
1. occurs when the oceanic crust slides under the continental crust.
 1. occurs when the oceanic crust slides under the continental crust. 2. What type of stress is shown? 3. Where two plates slide past one another is called a boundary. 4. What type of stress is shown? 5.
CRUSTAL DEFORMATION. Chapter 10
 CRUSTAL DEFORMATION and dgeologic Structures t Chapter 10 Deformation Df Deformation involves: Stress the amount of force applied to a given area. Types of Stress: Confining Stress stress applied equally
OCN 201 Seafloor Spreading and Plate Tectonics. Question
 OCN 201 Seafloor Spreading and Plate Tectonics Question What was wrong from Wegener s theory of continental drift? A. The continents were once all connected in a single supercontinent B. The continents
How to Build a Mountain and other Geologic Structures. But first a short review
 How to Build a Mountain and other Geologic Structures But first a short review Where do we see deep earthquakes? What is happening there? What can happen at a plate boundary? 1. Plates can move apart
Stress and Strain. Stress is a force per unit area. Strain is a change in size or shape in response to stress
 Geologic Structures Geologic structures are dynamically-produced patterns or arrangements of rock or sediment that result from, and give information about, forces within the Earth Produced as rocks change
KEY CHAPTER 12 TAKE-HOME QUIZ INTERNAL STRUCTURES AND PROCESSES Score Part B = / 55 PART B
 GEOLOGY 12 KEY CHAPTER 12 TAKE-HOME QUIZ INTERNAL STRUCTURES AND PROCESSES Score Part B = / 55 PART B CHAPTER 12 Isostacy and Structural Geology 1. Using the terms below, label the following diagrams and
Copyright McGraw-Hill Education. All rights reserved. No reproduction or distribution without the prior written consent of McGraw-Hill Education
 Copyright McGraw-Hill Education. All rights reserved. No reproduction or distribution without the prior written consent of McGraw-Hill Education Tibetan Plateau and Himalaya -southern Asia 11.00.a VE 10X
34. THE GEOLOGICAL AND GEOPHYSICAL SETTING NEAR SITE 462 1
 34. THE GEOLOGICAL AND GEOPHYSICAL SETTING NEAR SITE 462 L. K. Wipperman, 2 Hawaii Institute of Geophysics, University of Hawaii, Honolulu, Hawaii R. L. Larson, 3 Lamont-Doherty Geological Observatory
Lab 1: Plate Tectonics April 2, 2009
 Name: Lab 1: Plate Tectonics April 2, 2009 Objective: Students will be introduced to the theory of plate tectonics and different styles of plate margins and interactions. Introduction The planet can be
Chapter Overview. Bathymetry. Measuring Bathymetry. Measuring Bathymetry
 CHAPTER 3 Marine Provinces Chapter Overview The study of bathymetry determines ocean depths and ocean floor topography. Echo sounding and satellites are efficient bathymetric tools. Most ocean floor features
A N 62d. Oceanic Crust. 'hot 7-- Jeffrey A. Karson
 DEFENSE TECHNICAL INFORMATION CENTER 4583 FINAL REI)(.LiT ONR Grant N00014-90-J-1043 Variations in Tectonic Extension Along Slow-Spreading Ridge Axes: Implications for the Internal Structure and Bathymetry.of
Oceanography, An Invitation to Marine Science 9e Tom Garrison. Ocean Basins Cengage Learning. All Rights Reserved.
 Oceanography, An Invitation to Marine Science 9e Tom Garrison 4 Ocean Basins Key Concepts Tectonic forces shape the seabed The ocean floor is divided into continental margins and deep ocean basins The
Section 10.1 The Nature of Volcanic Eruptions This section discusses volcanic eruptions, types of volcanoes, and other volcanic landforms.
 Chapter 10 Section 10.1 The Nature of Volcanic Eruptions This section discusses volcanic eruptions, types of volcanoes, and other volcanic landforms. Reading Strategy Previewing Before you read the section,
Essentials of Oceanography Eleventh Edition
 Chapter Chapter 1 2 Clickers Lecture Essentials of Oceanography Eleventh Edition Plate Tectonics and the Ocean Floor Alan P. Trujillo Harold V. Thurman Chapter Overview Much evidence supports plate tectonics
Structural Style and Tectonic Evolution of the Nakhon Basin, Gulf of Thailand
 Structural Style and Tectonic Evolution of the Nakhon Basin, Gulf of Thailand Piyaphong Chenrai Petroleum Geoscience Program, Department of Geology, Faculty of Science, Chulalongkorn University, Bangkok
Dynamic Crust Practice
 1. Base your answer to the following question on the cross section below and on your knowledge of Earth science. The cross section represents the distance and age of ocean-floor bedrock found on both sides
Mohorovicic discontinuity separates the crust and the upper mantle.
 Structure of the Earth Chapter 7 The Earth is divided into 3 Main Layers 1. Crust outermost layer 1% of the Earth s mass thickness varies: 5 100 km two types: oceanic denser continental Mohorovicic discontinuity
Ocean Basins, Bathymetry and Sea Levels
 Ocean Basins, Bathymetry and Sea Levels Chapter 4 Please read chapter 5: sediments for next class and start chapter 6 on seawater for Thursday Basic concepts in Chapter 4 Bathymetry the measurement of
Alternative Mechanisms for Volcanic Activity in Hotspot-Ridge Systems: The Northern Galapagos Province
 ABSTRACT for the Plume IV Penrose Conference Alternative Mechanisms for Volcanic Activity in Hotspot-Ridge Systems: The Northern Galapagos Province Karen S. Harpp, Colgate University, Department of Geology,
4 Deforming the Earth s Crust
 CHAPTER 7 4 Deforming the Earth s Crust SECTION Plate Tectonics BEFORE YOU READ After you read this section, you should be able to answer these questions: What happens when rock is placed under stress?
UNIT 3 GEOLOGY VOCABULARY FLASHCARDS THESE KEY VOCABULARY WORDS AND PHRASES APPEAR ON THE UNIT 3 CBA
 UNIT 3 GEOLOGY VOCABULARY FLASHCARDS THESE KEY VOCABULARY WORDS AND PHRASES APPEAR ON THE UNIT 3 CBA A map that shows Earth s Topographic Map surface topography, which is Earth s shape and features Contour
Geotechnical Earthquake Engineering Prof. Deepankar Choudhury Department of Civil Engineering Indian Institute of Technology, Bombay
 Geotechnical Earthquake Engineering Prof. Deepankar Choudhury Department of Civil Engineering Indian Institute of Technology, Bombay Module - 3 Lecture - 7 Engineering Seismology (Contd ) Let us start
Chapter 3: Plate Tectonics and Earthquakes Plate Tectonics The lithosphere of Earth is broken into pieces called plates. These gigantic pieces pull
 Chapter 3: Plate Tectonics and Earthquakes Plate Tectonics The lithosphere of Earth is broken into pieces called plates. These gigantic pieces pull apart during seafloor spreading at divergence zones,
Bathymetry Measures the vertical distance from the ocean surface to mountains, valleys, plains, and other sea floor features
 1 2 3 4 5 6 7 8 9 10 11 CHAPTER 3 Marine Provinces Chapter Overview The study of bathymetry determines ocean depths and ocean floor topography. Echo sounding and satellites are efficient bathymetric tools.
Alfred Wegener gave us Continental Drift. Fifty years later...
 CHAPTER 2 Plate Tectonics and the Ocean Floor Plate Tectonics: summary in haiku form Alfred Wegener gave us Continental Drift. Fifty years later... Words Chapter Overview Much evidence supports plate tectonics
UNIT 10 MOUNTAIN BUILDING AND EVOLUTION OF CONTINENTS
 UNIT 10 MOUNTAIN BUILDING AND EVOLUTION OF CONTINENTS ROCK DEFORMATION Tectonic forces exert different types of stress on rocks in different geologic environments. STRESS The first, called confining stress
Geo736: Seismicity along mid-ocean ridges
 Geo736: Seismicity along mid-ocean ridges Course Notes: S. G. Wesnousky Spring 2018 Bathymetric maps show the ocean basins of the world are characteristically divided by a bathymetric ridge. The bathymetric
World Geography 3202 Unit 1. Ch. 1: Landform Patterns and Processes
 World Geography 3202 Unit 1 Ch. 1: Landform Patterns and Processes - Planet Earth is dynamic - behaves as if it s a living organism - some changes are rapid enough for us to see and record - exs. Tidal
Seismic Activity near the Sunda and Andaman Trenches in the Sumatra Subduction Zone
 IJMS 2017 vol. 4 (2): 49-54 International Journal of Multidisciplinary Studies (IJMS) Volume 4, Issue 2, 2017 DOI: http://doi.org/10.4038/ijms.v4i2.22 Seismic Activity near the Sunda and Andaman Trenches
Deformation of the Crust
 Deformation of the Crust Review Choose the best response. Write the letter of that choice in the space provided. 1. The state of balance between the thickness of the crust and the depth at which it rides
Plate Tectonics. Essentials of Geology, 11 th edition Chapter 15
 1 Plate Tectonics Essentials of Geology, 11 th edition Chapter 15 2 3 4 5 6 7 8 9 10 11 12 13 14 15 Plate Tectonics: summary in haiku form Alfred Wegener gave us Continental Drift. Fifty years later...
Prentice Hall EARTH SCIENCE
 Prentice Hall EARTH SCIENCE Tarbuck Lutgens Chapter 9 Plate Tectonics 9.1 Continental Drift An Idea Before Its Time Wegener s continental drift hypothesis stated that the continents had once been joined
Prentice Hall EARTH SCIENCE
 Prentice Hall EARTH SCIENCE Tarbuck Lutgens Chapter 9 Plate Tectonics 9.1 Continental Drift An Idea Before Its Time Wegener s continental drift hypothesis stated that the continents had once been joined
Bonn, Germany MOUTAZ DALATI. General Organization for Remote Sensing ( GORS ), Syria Advisor to the General Director of GORS,
, Syria Advisor to the General Director of GORS,") Bonn, Germany Early Warning System is needed for Earthquakes disaster mitigation in Syria Case Study: Detecting and Monitoring the Active faulting zones along the Afro-Arabian-Syrian Rift System MOUTAZ
Bonn, Germany Early Warning System is needed for Earthquakes disaster mitigation in Syria Case Study: Detecting and Monitoring the Active faulting zones along the Afro-Arabian-Syrian Rift System MOUTAZ
The Dynamic Crust 2) 4) Which diagram represents the most probable result of these forces? 1)
 4) Which diagram represents the most probable result of these forces? 1)") 1. The diagrams below show cross sections of exposed bedrock. Which cross section shows the least evidence of crustal movement? 1) 3) 4. The diagram below represents a section of the Earth's bedrock. The
1. The diagrams below show cross sections of exposed bedrock. Which cross section shows the least evidence of crustal movement? 1) 3) 4. The diagram below represents a section of the Earth's bedrock. The
The anomalous high transverse ridge developed along a transform fault. Speaker: Yen-Fu Chen
 The anomalous high transverse ridge developed along a transform fault Speaker: Yen-Fu Chen Reference Anne E. Deschamps, Serge E. Lallemand, and Jean-Yves Collot, 1998, A detailed study of the Gagua Ridge:
Chapter 2 Plate Tectonics and the Ocean Floor
 Chapter 2 Plate Tectonics and the Ocean Floor Chapter Overview Much evidence supports plate tectonics theory. The plate tectonics model describes features and processes on Earth. Plate tectonic science
Chapter 02 The Sea Floor
 Chapter 02 The Sea Floor Multiple Choice Questions 1. One of the following is not one of the world's major ocean basins: A. Atlantic Ocean B. Arctic Ocean C. Indian Ocean D. Antarctic Ocean E. Pacific
I. Earth s Layers a. Crust: Earth s outside layer. Made of mostly rock. i. Continental: er; made of mostly granite, forms the continents and shallow
 I. Earth s Layers a. Crust: Earth s outside layer. Made of mostly rock. i. Continental: er; made of mostly granite, forms the continents and shallow sea beds, floats! ii. Oceanic: er; dense rock such as
Crustal Deformation Earth - Chapter Pearson Education, Inc.
 Crustal Deformation Earth - Chapter 10 Structural Geology Structural geologists study the architecture and processes responsible for deformation of Earth s crust. A working knowledge of rock structures
Ch. 9 Review. Pgs #1-31 Write Questions and Answers
 Ch. 9 Review Pgs. 356-357 #1-31 Write Questions and Answers 356-357 #1-5 Answers 1. The layer of the upper mantle that can flow is the: A - Asthenosphere 2. Most scientists rejected Wegener s theory of
Chapter 10: Volcanoes and Other Igneous Activity Section 1: The Nature of Volcanic Eruptions I. Factors Affecting Eruptions Group # Main Idea:
 Chapter 10: Volcanoes and Other Igneous Activity Section 1: The Nature of Volcanic Eruptions I. Factors Affecting Eruptions Group # A. Viscosity Group # B. Dissolved Gases Group # II. Volcanic Material
The Puzzling Plates Part I. Follow the steps below while taking notes in your science notebook.
 Procedure Follow the steps below while taking notes in your science notebook. 1. On the table is a pile of cardboard puzzle pieces. Work with your team to assemble the puzzle. The edges of the completed
Comparison of the ancient Keweenaw Mid-Continent Rift System and the active East. African Rift System
 Neier 1 Emily Neier Mentor: Steve Mattox GEO 485 28 April 2016 Comparison of the ancient Keweenaw Mid-Continent Rift System and the active East African Rift System Abstract The active East African Rift
Unit 6: The Sea Floor
 Unit 6: The Sea Floor Turn to Page 62 in Introduction to the World s Oceans Study the bathymetric chart What features do you see? How do the Atlantic and Pacific Oceans differ? What do you think accounts
Lecture Marine Provinces
 Lecture Marine Provinces Measuring bathymetry Ocean depths and topography of ocean floor Sounding Rope/wire with heavy weight Known as lead lining Echo sounding Reflection of sound signals 1925 German
Deformation of Rocks. Orientation of Deformed Rocks
 Deformation of Rocks Folds and faults are geologic structures caused by deformation. Structural geology is the study of the deformation of rocks and its effects. Fig. 7.1 Orientation of Deformed Rocks
Lab 7: STRUCTURAL GEOLOGY FOLDS AND FAULTS
 Lab 7: STRUCTURAL GEOLOGY FOLDS AND FAULTS This set of labs will focus on the structures that result from deformation in earth s crust, namely folds and faults. By the end of these labs you should be able
24. Ocean Basins p
 24. Ocean Basins p. 350-372 Background The majority of the planet is covered by ocean- about %. So the majority of the Earth s crust is. This crust is hidden from view beneath the water so it is not as
Plate Tectonics IDEA THAT EARTH S SURFACE IS BROKEN INTO PLATES THAT MOVE AROUND. Fault = fracture in the crust where the movement has occurred
 Warm-up #14 A mountain range found 100 meters above sea level is measured to be 1,000 meters high from its tallest peak. From the top, the first 500 meters are incredibly steep. After this point, the mountain
Foundations of Earth Science, 6e Lutgens, Tarbuck, & Tasa
 Foundations of Earth Science, 6e Lutgens, Tarbuck, & Tasa Oceans: The Last Frontier Foundations, 6e - Chapter 9 Stan Hatfield Southwestern Illinois College The vast world ocean Earth is often referred
How to Build a Mountain and other Geologic Structures. But first, questions
 How to Build a Mountain and other Geologic Structures But first, questions Questions your students might ask How were Montana s mountains formed? How old are the mountains? What are the different ways
3. PLATE TECTONICS LAST NAME (ALL IN CAPS): FIRST NAME: PLATES
: FIRST NAME: PLATES") LAST NAME (ALL IN CAPS): FIRST NAME: PLATES 3. PLATE TECTONICS The outer layers of the Earth are divided into the lithosphere and asthenosphere. The division is based on differences in mechanical properties
LAST NAME (ALL IN CAPS): FIRST NAME: PLATES 3. PLATE TECTONICS The outer layers of the Earth are divided into the lithosphere and asthenosphere. The division is based on differences in mechanical properties
Mountain Building. Mountain Building
 Mountain Building Mountain building has occurred during the recent geologic past American Cordillera the western margin of the Americas from Cape Horn to Alaska Includes the Andes and Rocky Mountains Alpine
Lithospheric plates. Geology of the Batemans Bay region. Tectonic processes
 1 Lithospheric plates Enormous heat sources in the Earth s deep interior, acquired during the very early history of the planet billions of years ago continue to drive present-day geological at the surface.
FINDING THE CONTINENTAL SHELF EXAMPLES FROM THE NEW ZEALAND REGION
 FINDING THE CONTINENTAL SHELF EXAMPLES FROM THE NEW ZEALAND REGION ABSTRACT New Zealand has nearly completed the surveying phase of its Continental Shelf Project. Some surveys have been designed to fill
Lecture 24: Convergent boundaries November 22, 2006
 Lecture 24: Convergent boundaries November 22, 2006 Convergent boundaries are characterized by consumption of oceaninc crust in subduction zones, with attendant arc volcanism, metamorphism and uplift.
Section 3 Deforming Earth s Crust
 Section 3 Deforming Earth s Crust Key Concept Tectonic plate motions deform Earth s crust. Deformation causes rock layers to bend and break and causes mountains to form. What You Will Learn Stress is placed