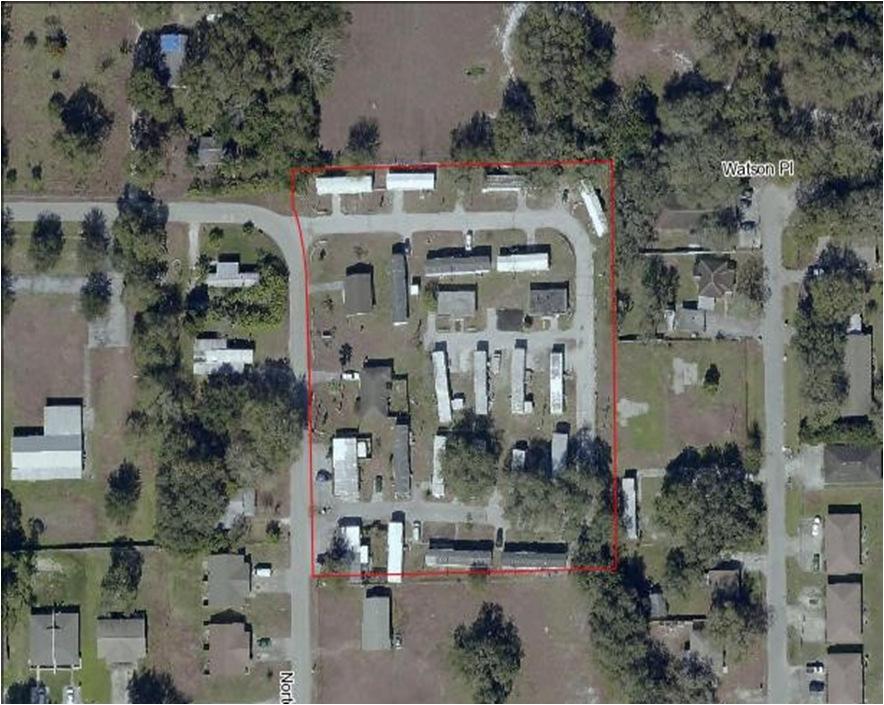
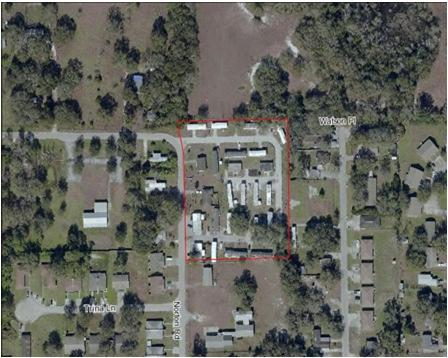
Lakeland Court MHP Norton Rd Lakeland, FL 33809
|
|
|
- Darrell Fletcher
- 6 years ago
- Views:
Transcription
1 23-space/units - 2 Block Homes - 2 Duplexes 75% Occupied - Annual Leases - Long Term Tenants City Water - Septic Possible 3 additional spaces can be added Seller may consider offering Seller Financing to Qualified Purchaser Presented by benny@crescorpllc.com CRES Corp International, LLC 1228 E 7th Ave Tampa, Fl 33605

 $ 133,157 Income per Unit $ 5,923 MIP Payments $ Total Acquisition Cost $ 1,200,000 Expenses per Unit $ (1,331) Annual Reserves: $ Debt Service: $ Mortgage (s) $ Cash Flow Before Taxes $")
2 CRES Corp International, LLC Lakeland Court MHP Income, Expenses & Cash Flow Property Overview Potential Rental Income $ 171,756 Purchase/Asking Price $ 1,200,000 Property Type Mobile Home Parks Other Income - Improvements - No. of Units 29 Total Vacancy and Credits - Other - Price Per Unit $ 41,379 Operating Expenses $ (38,599) Closing Costs - Total Sq Ft - Annual Reserves: $ Finance Points - Price Per Sq Ft $ Net Operating Income (NOI) $ 133,157 Income per Unit $ 5,923 MIP Payments $ Total Acquisition Cost $ 1,200,000 Expenses per Unit $ (1,331) Annual Reserves: $ Debt Service: $ Mortgage (s) $ Cash Flow Before Taxes $ 133,157 Income Taxes: Benefit 0% - Down Payment / Investment $ 1,200,000 Cash Flow After Taxes $ 133,157 Assumptions Loan Information % of Asking % of Cost Rental Growth Rate: 3.00% Down Payment: $ 1,200, % % Expense Growth Rate: 2.00% Initial Loan Balance: $ 0.00% 0.00% Capitalization Rate (Resale): 11.10% Marginal Tax Rate: 0.00% Loan Amount Interest Rate Term Payment Capital Gain Tax Rate: 0.00% $ 8.00% 30 $0 $ 8.00% 30 $0 $ 8.00% 30 $0 Financial Measurements Year 1 Year 3 Year 7 Notes / Discussion Debt Coverage Ratio (DCR) Loan-to-Value Ratio (LVR) 0.0% 0.0% 0.0% Capitalization Rate Based on Cost 11.10% 11.84% 13.47% Capitalization Rate Based on Resale Price 11.10% 11.10% 11.10% Gross Rent Multiplier Net Present Value (NPV) - B/ Taxes Net Present Value (NPV) - A/Taxes 8.00% (10,384) 129, , % (32,014) 64, ,300 Cash on Cash Return - Before Taxes 11.10% 11.84% 13.47% Cash on Cash Return - After Taxes 11.10% 11.84% 13.47% Internal Rate of Return - Before Taxes 12.14% 13.61% Internal Rate of Return - After Taxes 12.14% 13.61% Modified Internal Rate of Return - Before Taxes Modified Internal Rate of Return - After Taxes 11.00% 10.58% 11.00% 10.58% Disclaimer: All information presented is believed to be accurate. The information, calculations and data presented in this report are believed to be accurate but are not guaranteed. The information contained in this report shall not be considered as a substitution for legal, accounting or other professional advice. Please seek proper legal and tax advice as appropriate before making investments.

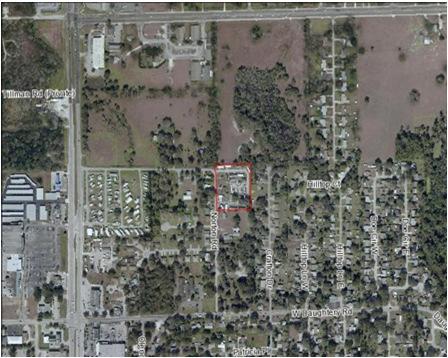
3 Property Description Lakeland Court MHP The Lakeland Court park is located close to the Lakeland Mall with all the shopping and restaurants nearby. This magnificent park consists of: HIGHLIGHTS 29 Rentals - 23-space/Units 2 Block Homes & 2 Duplexes City Water - Septic Long Term Tenants - Annual Lease -2 Block Homes -2 Duplexes -23-spaces/MH Units 75% Occupied -GR = $171,756 -NOI = $133,157 The owners are using a rent ready Doublewide that can be leased for $850/mo. Also, they have completely refurnished a vacant unit from one of the duplexes that will capture $950. Just these two rentals will bring in $21,600/an gross revenue. Price: $1,200,000 Sellers may consider offering Seller Financing to a Qualified Purchaser. Feel free to contact me for further information. 75% Occupied CRES Corp International, LLC benny@crescorpllc.com 1228 E 7th Ave 0 Tampa, Fl 33605
4 Lakeland Court MHP Additional Land for 2-3 more spaces Duplex #1 Duplex Interior Duplex Interior Duplex #2
5
6 Rental Activity Analysis Year 1 Year 2 Year 3 Year 4 Year 5 Potential Rental Income $ 171,756 $ 176,909 $ 182,216 $ 187,682 $ 193,313 Less: Vacancy & Credit Losses Effective Gross Income $ 171,756 $ 176,909 $ 182,216 $ 187,682 $ 193,313 Less: Operating Expenses (38,599) (39,371) (40,158) (40,962) (41,781) Net Operating Income (NOI) $ 133,157 $ 137,538 $ 142,058 $ 146,721 $ 151,532 Less: Annual Debt Service CASH FLOW Before Taxes $ 133,157 $ 137,538 $ 142,058 $ 146,721 $ 151,532 Property Resale Analysis Projected Sales Price $ 1,199,613 $ 1,239,078 $ 1,279,798 $ 1,321,809 $ 1,365,154 Less: Selling Expenses (47,985) (49,563) (51,192) (52,872) (54,606) Adjusted Projected Sales Price $ 1,151,628 $ 1,189,515 $ 1,228,606 $ 1,268,937 $ 1,310,548 Less: Mortgage(s) Balance Payoff SALE PROCEEDS Before Taxes $ 1,151,628 $ 1,189,515 $ 1,228,606 $ 1,268,937 $ 1,310,548 Cash Position Cash Generated in Current Year $ 133,157 $ 137,538 $ 142,058 $ 146,721 $ 151,532 Cash Generated in Previous Years n/a 133, , , ,473 Cash Generated from Property Sale 1,151,628 1,189,515 1,228,606 1,268,937 1,310,548 Original Initial Investment (1,200,000) (1,200,000) (1,200,000) (1,200,000) (1,200,000) Total Potential CASH Generated $ 84,785 $ 260,210 $ 441,358 $ 628,410 $ 821,553 Financial Measurements Capitalization Rate Based on Cost 11.10% 11.46% 11.84% 12.23% 12.63% Capitalization Rate Based on Resale Price 11.10% 11.10% 11.10% 11.10% 11.10% Gross Rent Monthly Multiplier (GRM) Gross Rent Yearly Multiplier (GRM) Value of Property Using this GRM ,202,292 1,238,361 1,275,512 1,313,777 1,353,190 Break-Even Ratio 22.47% 22.25% 22.04% 21.82% 21.61% Operating Expense Ratio 22.47% 22.25% 22.04% 21.82% 21.61% Cash-on-Cash Return with Equity 7.07% 15.23% 15.23% 15.22% 15.22% Cash-on-Cash Return - Before Taxes 11.10% 11.46% 11.84% 12.23% 12.63% 10/10/2017 4:19 PM Cash Flow Analyzer
7 Rental Activity Analysis Potential Rental Income Less: Vacancy & Credit Losses Effective Gross Income Less: Operating Expenses Net Operating Income (NOI) Year 6 Year 7 Year 8 Year 9 Year 10 $ 199,112 $ 205,086 $ 211,238 $ 217,575 $ 224, $ 199,112 $ 205,086 $ 211,238 $ 217,575 $ 224,103 (42,616) (43,469) (44,338) (45,225) (46,129) $ 156,496 $ 161,617 $ 166,900 $ 172,350 $ 177,973 Less: Annual Debt Service CASH FLOW Before Taxes $ 156,496 $ 161,617 $ 166,900 $ 172,350 $ 177,973 Property Resale Analysis Projected Sales Price Less: Selling Expenses Adjusted Projected Sales Price $ 1,409,873 $ 1,456,008 $ 1,503,604 $ 1,552,707 $ 1,603,363 (56,395) (58,240) (60,144) (62,108) (64,135) $ 1,353,478 $ 1,397,768 $ 1,443,460 $ 1,490,599 $ 1,539,228 Less: Mortgage(s) Balance Payoff SALE PROCEEDS Before Taxes $ 1,353,478 $ 1,397,768 $ 1,443,460 $ 1,490,599 $ 1,539,228 Cash Position Cash Generated in Current Year Cash Generated in Previous Years Cash Generated from Property Sale Original Initial Investment Total Potential CASH Generated $ 156,496 $ 161,617 $ 166,900 $ 172,350 $ 177, , ,501 1,029,118 1,196,018 1,368,369 1,353,478 1,397,768 1,443,460 1,490,599 1,539,228 (1,200,000) (1,200,000) (1,200,000) (1,200,000) (1,200,000) $ 1,020,979 $ 1,226,886 $ 1,439,478 $ 1,658,967 $ 1,885,570 Financial Measurements Capitalization Rate Based on Cost Capitalization Rate Based on Resale Price 13.04% 13.47% 13.91% 14.36% 14.83% 11.10% 11.10% 11.10% 11.10% 11.10% Gross Rent Monthly Multiplier (GRM) Gross Rent Yearly Multiplier (GRM) Value of Property Using this GRM 7.00 Break-Even Ratio Operating Expense Ratio ,393,786 1,435,600 1,478,668 1,523,028 1,568, % 21.20% 20.99% 20.79% 20.58% 21.40% 21.20% 20.99% 20.79% 20.58% Cash-on-Cash Return with Equity Cash-on-Cash Return - Before Taxes 15.22% 15.21% 15.21% 15.21% 15.20% 13.04% 13.47% 13.91% 14.36% 14.83% 10/10/2017 4:19 PM Cash Flow Analyzer
8 Expense Description Annual Amount Annual Increase Per Unit Per Sq Ft % of % of Expenses Revenue Insurance Landscaping Maintenance Professional Fees Supplies Property Taxes Trash Removal Gas Electricity Miscellaneous 5, % % 3.1% 3, % % 1.7% 3, % % 2.1% % % 0.1% 1, % % 0.6% 9, % % 5.7% 3, % % 2.1% 4, % % 2.8% 2, % % 1.3% 5, % % 2.9% Total Annual Operating Expenses $ 38,599 $ 1, % 22.5%
9 Annual Property Operating Data 1 2 Year 1 Sq Ft Per Unit Year 2 Sq Ft Per Unit Year 3 Sq Ft Per Unit Year 4 Sq Ft Per Unit Year 5 Sq Ft Per Unit Potential Rental Income $ 171, $ 176, $ 182, $ 187, $ 193, Effective Gross Income $ 171, $ 176, $ 182, $ 187, $ 193, Operating Expenses Insurance 5, , , , , Landscaping 3, , , , , Maintenance 3, , , , , Professional Fees Supplies 1, , , , , Property Taxes 9, , , , , Trash Removal 3, , , , , Gas 4, , , , , Electricity 2, , , , , Miscellaneous 5, , , , , Total Operating Expenses $ 38, $ 39, $ 40, $ 40, $ 41, Net Operating Income (NOI) $ 133, $ 137, $ 142, $ 146, $ 151, Cash Flow Before Taxes $ 133, $ 137, $ 142, $ 146, $ 151, Cash Flow Analyzer
10 Annual Property Operating Data 1 2 Year 6 Sq Ft Per Unit Year 7 Sq Ft Per Unit Year 8 Sq Ft Per Unit Year 9 Sq Ft Per Unit Year 10 Sq Ft Per Unit Potential Rental Income Effective Gross Income $ 199, $ 205, $ 211, $ 217, $ 224, $ 199, $ 205, $ 211, $ 217, $ 224, Operating Expenses Insurance Landscaping Maintenance Professional Fees Supplies Property Taxes Trash Removal Gas Electricity Miscellaneous Total Operating Expenses 5, , , , , , , , , , , , , , , , , , , , , , , , , , , , , , , , , , , , , , , , , , , , , $ 42, $ 43, $ 44, $ 45, $ 46, Net Operating Income (NOI) $ 156, $ 161, $ 166, $ 172, $ 177, Cash Flow Before Taxes $ 156, $ 161, $ 166, $ 172, $ 177, Cash Flow Analyzer
 $ (1,200,000) Year 1 133,157 - - 133,157-133,157 Year 2 137,538 -")

11 Cash Flow After Taxes Cash Flow Before Taxes $180,000 $160,000 $140,000 $120,000 $100,000 $80,000 $60,000 $40,000 $20,000 $ Time Net Operating MIP Payments Debt Cash Flow Incomes Cash Flow Period Income Service Before Tax Taxes After Tax Int Investment $ (1,200,000) $ (1,200,000) Year 1 133, , ,157 Year 2 137, , ,538 Year 3 142, , ,058 Year 4 146, , ,721 Year 5 151, , ,532 Year 6 156, , ,496 Year 7 161, , ,617 Year 8 166, , ,900 Year 9 172, , ,350 Year , , , Cash Flow Analyzer

12 After Taxes Before Taxes 16.00% 14.00% 12.00% 10.00% 8.00% 6.00% 4.00% 2.00% 0.00% Time Initial Investment Cash Flow Cash on Cash Income Cash Flow Cash on Cash Period Adj for Refinance Before Taxes Before Taxes Taxes After Taxes After Taxes Year 1 $ 1,200,000 $ 133, % $ $ 133, % Year 2 1,200, , % - 137, % Year 3 1,200, , % - 142, % Year 4 1,200, , % - 146, % Year 5 1,200, , % - 151, % Year 6 1,200, , % - 156, % Year 7 1,200, , % - 161, % Year 8 1,200, , % - 166, % Year 9 1,200, , % - 172, % Year 10 1,200, , % - 177, % Cash Flow Analyzer
13 16.00% 14.00% 12.00% 10.00% 8.00% 6.00% 4.00% 2.00% 0.00% Time Net Operating Cap Rate on Cost Resale Period Income (NOI) $ 1,200,000 Value Year 1 $ 133, % $ 1,199,613 Year 2 137, % 1,239,078 Year 3 142, % 1,279,798 Year 4 146, % 1,321,809 Year 5 151, % 1,365,154 Year 6 156, % 1,409,873 Year 7 161, % 1,456,008 Year 8 166, % 1,503,604 Year 9 172, % 1,552,707 Year , % 1,603, Cash Flow Analyzer
 Balance Payoff Before Taxes From Sale After Taxes Equity Equity Increase Year 1 $ 1,151,628-4.")
14 $1,600,000 $1,400,000 $1,200,000 $1,000,000 $800,000 $600,000 $400,000 $200,000 $ Time Projected Adj Projected Refi Proceeds Mortgage(s) Sale Proceeds Income Taxes Sale Proceeds Property Year / Year Period Resale Value Increase (if any) Balance Payoff Before Taxes From Sale After Taxes Equity Equity Increase Year 1 $ 1,151, % $ $ $ 1,151,628 $ $ 1,151,628 $ 1,151,628 $ (48,372) Year 2 1,189, % - - 1,189,515-1,189,515 1,189,515 37,887 Year 3 1,228, % - - 1,228,606-1,228,606 1,228,606 39,091 Year 4 1,268, % - - 1,268,937-1,268,937 1,268,937 40,331 Year 5 1,310, % - - 1,310,548-1,310,548 1,310,548 41,611 Year 6 1,353, % - - 1,353,478-1,353,478 1,353,478 42,930 Year 7 1,397, % - - 1,397,768-1,397,768 1,397,768 44,290 Year 8 1,443, % - - 1,443,460-1,443,460 1,443,460 45,692 Year 9 1,490, % - - 1,490,599-1,490,599 1,490,599 47,138 Year 10 1,539, % - - 1,539,228-1,539,228 1,539,228 48, Cash Flow Analyzer
 Sell 6.")
15 Return on Equity (ROE) 16.00% 14.00% 12.00% 10.00% 8.00% 6.00% 4.00% 2.00% 0.00% Required Return on Equity Time Period Rental Annual Change Annual Change Trapped Return on Hold Cash Flow in Equity in Net Worth Equity Equity (ROE) Sell 6.00% A B (A + B) Year 1 133,157 (48,372) 84,785 1,200, % Hold After Year Year 2 137,538 37, ,425 1,151, % Hold 5 Year 3 142,058 39, ,148 1,189, % Hold Year 4 146,721 40, ,052 1,228, % Hold Year 5 151,532 41, ,143 1,268, % Hold Year 6 156,496 42, ,426 1,310, % Hold Year 7 161,617 44, ,907 1,353, % Hold Year 8 166,900 45, ,593 1,397, % Hold Year 9 172,350 47, ,489 1,443, % Hold Year ,973 48, ,603 1,490, % Hold Cash Flow Analyzer
 Occupancy")
 100.00% 22.04% 77.96% 61.55% 38.45% Year 4 187,682 (40,962) 100.00% 21.82% 78.18% 60.19% 39.81% Year 5 193,313 (41,781) 100.00% 21.61% 78.39% 58.86% 41.")
16 BreakEven Occupancy BreakEven Occupancy with Cash on Cash Requirment 70.00% 60.00% 50.00% 40.00% 30.00% 20.00% 10.00% 0.00% Cash on Cash Time Period Potential Operating, Debt, Occupancy BreakEven Max Vacancy BreakEven Max Vacancy Requirement Rental Income Reserve Expenses Rate (Existing) Occupancy Rate BreakEven Rate Occupancy Rate BreakEven Rate 6.00% w/ Cash on Cash w/ Cash on Cash Year 1 171,756 (38,599) % 22.47% 77.53% 64.39% 35.61% Year 2 176,909 (39,371) % 22.25% 77.75% 62.95% 37.05% Year 3 182,216 (40,158) % 22.04% 77.96% 61.55% 38.45% Year 4 187,682 (40,962) % 21.82% 78.18% 60.19% 39.81% Year 5 193,313 (41,781) % 21.61% 78.39% 58.86% 41.14% Year 6 199,112 (42,616) % 21.40% 78.60% 57.56% 42.44% Year 7 205,086 (43,469) % 21.20% 78.80% 56.30% 43.70% Year 8 211,238 (44,338) % 20.99% 79.01% 55.07% 44.93% Year 9 217,575 (45,225) % 20.79% 79.21% 53.88% 46.12% Year ,103 (46,129) % 20.58% 79.42% 52.71% 47.29% Cash Flow Analyzer
17 CRES Corp International, LLC CRES Corp International, LLC 1228 E 7th Ave 0 Tampa, Fl benny@crescorpllc.com Commercial Real Estate Services - Development - Management - Financial Services CRES Corp International, LLC (CCI) is a Commercial Real Estate company offering development, finance and brokerage services. Our Development Teamspecializes in health care construction and offers the latest and most cost effective construction technology. Our Development specializes in health care, medical, Multi-Family & Hospitality operations and development: Construction & Development Project Planning Property Acquisitions Investment Structuring Property Conversion and Repositioning Joint Venture Structuring Medical/Health Care Property Management Financial Arrangement & Consulting To assist our Clients with their development projects and acquisitions we offer affordable financing alternatives to conventional financing methods: Variable Rate Demand Bonds Industrial Revenue & Municipal Bonds Build-to Lease Program Foreign Investment Funds Joint Venture/Equity Partnership Arrangements Our goal is to bring our Clients the lowest interest rates and best leverage on their purchases and projects. We will consider the following properties and projects: Health Care/Medical Offices Multi-Family Schools/Universities Hospitality For further information contact or benny@crescorpllc.com
18 Terms & Definitions Net Operating Income (NOI) is a property s gross rental income reduced by all expenses except for loan payments, income taxes, mortgage insurance premium (MIP) payments and sometimes funded reserves. Debt Coverage Ratio (DCR) is a property s net operating income divided by the amount of debt payments. Lenders use this calculation to determine the remaining operating cash flow after the debt payments. Loan-to-Value Ratio (LTV) is the outstanding debt divided by the value of the property. This ratio is used to determine the amount of leverage and property equity. The debt balance can be the beginning or end-of-year balance. The property value used can be the contract price or the fair market value at the end of the year. Capitalization Rate (Cap Rate) is the net operating income (NOI) divided by either the property s contract purchase price or its fair market value. Cash-on-Cash Return is the net cash flow divided it by the initial investment (down payment). The calculation does not take into account the time value of money or change in the property s equity. Cash-on-Cash Return with Equity Build-up modifies the cash-on-cash return calculation by adding the property s net change in equity for that year to the numerator and adding all previously generated equity to the denominator of the cash-on-cash return ratio. The calculation calculates the return on the property equity, i.e. the return on the cash that is tied up in the property. Net Present Value (NPV) converts future dollars into present-day dollars by discounting (reducing) the future cash flow of a property by a given rate or percentage. The initial investment (down payment) is subtracted from the discounted dollars to derive the NPV. A positive NPV means that the property will generate a higher return than the given rate or percentage used to calculate the NPV amount. Gross Rent Multiplier (GRM) is a property s fair market value divided by its gross rental income. Mortgage Insurance Premium (MIP) Payments are insurance premiums charged by a lender to protect that lender against loss from a mortgager's default. The rates are charged on the balance of the loan and may be paid annually, monthly, or in some combination of the two (split premiums). Internal Rate-of-Return (IRR) is the most widely used method of valuing a property s annual cash flow stream. Since a property s cash flow is earned in the future, those future dollars must be converted to present-day dollars. The IRR calculation discounts (reduces) the property s future cash flow at a rate (i.e. percentage) so that the sum of all cash flow for a specified time period is equal to the initial investment. The rate or percentage needed to do that is the IRR. In other words, IRR is the discount rate at which Net Present Value (NPV) is zero. Modified Internal Rate-of-Return (MIRR) modifies the IRR to avoid the drawbacks of the traditional IRR. The IRR implicitly assumes that all cash flow is either reinvested or discounted at the computed IRR rate. In reality, a property s cash flow probably will not be reinvested at the computed IRR rate, but rather earn zero or a small amount of interest. The MIRR eliminates the reinvestment assumption by utilizing user stipulated reinvestment and borrowing rates. benny@crescorpllc.com CRES Corp International, LLC 1228 E 7th Ave 0 Tampa, Fl 33605
Sunshine City 47-Sp MHP
 Sunshine City 47-Sp MHP 47-sp MHP w/36 POM's Recreation Building used for StorageLaundry Room (Currently not in use) 70% Occupancy - 9-spaces left & 5 MH's left to lease 10 Mobile Homes Newly Rehabbed
Real Estate Investor Calculator Project Workbook. Quick Estimate Factors MAIN DATA ENTRY
 MAIN DATA ENTRY 1 2 Current List / Asking Price: $ 175,000.00 Project Updated: 12/18/17 Original or Current Appraised / Market Value / AsIs: $ 180,000.00 AsIs Date: 12/18/17 Est. Resale Value / Post Renovations
Source: % % FINANCING SHORT TERM HOLDING / RESALE. 30 Maximun Offer to Resell (Fix/Flip): $ 424,000.00
: $ 424,000.00") MAIN DATA ENTRY Current List / Asking Price: $ 499,000.00 Project Updated: 11/15/17 Original or Current Appraised / Market Value / AsIs: $ 520,000.00 AsIs Date: 11/1/17 Est. Resale Value / Post Renovations
MAIN DATA ENTRY Current List / Asking Price: $ 499,000.00 Project Updated: 11/15/17 Original or Current Appraised / Market Value / AsIs: $ 520,000.00 AsIs Date: 11/1/17 Est. Resale Value / Post Renovations
A DISCOUNT MINI STORAGE
 A DISCOUNT MINI STORAGE 3735 Mangum Rd, Houston, TX 77092 High Density Mini Storage in Near NW Houston and close to newly proposed renovated US290 Highway Renovated Living Quarters, Gated Customer Access,
Income Statement Lakeview Accrual Basis Jun 2018
 Lakeview Accrual Basis Jun 2018 Property: Lakeview Income Revenues 4010-0000 Gross Market Rent - 30,656.00 30,656.00 30,656.00 30,656.00 30,563.00 30,499.00 30,467.00 30,403.00 30,403.00 30,339.00 30,307.00
Cash Flow Illustration
 Cash Flow Illustration An Integrated Analysis of LIFETIME CASH FLOWS & NET WORTH AN ANALYSIS PREPARED EXCLUSIVELY FOR Jack Retires at Age 62 & Jill Retires at Age 60 1 Disclaimer This financial plan is
City of Scottsbluff, Nebraska Monday, July 16, 2018 Regular Meeting
 City of Scottsbluff, Nebraska Monday, July 16, 2018 Regular Meeting Item Finance1 Council to receive the 2018 Financial Report. Staff Contact: Liz Hilyard, Finance Director Scottsbluff Regular Meeting
HOW TO USE THE SBDC FINANCIAL TEMPLATE
 HOW TO USE THE SBDC FINANCIAL TEMPLATE It is strongly suggested that, if you are not well acquainted with Financial Statements and their interrelationships, that you seek the assistance of the Small Business
City of Scottsbluff FUND EQUITY IN CASH - YEAR TO DATE FOR THE NINE MONTHS ENDED JUNE 30, 2017 AND 2016
 City of Scottsbluff FUND EQUITY IN CASH - YEAR TO DATE FOR THE NINE MONTHS ENDED JUNE 30, 2017 AND 2016 OCTOBER 1, 2015 OCTOBER 1, 2016 THRU JUNE 30, 2016 THRU JUNE 30, 2017 Fund Fund # NET CHANGE IN CASH
City of Scottsbluff, Nebraska Monday, December 4, 2017 Regular Meeting
 City of Scottsbluff, Nebraska Monday, December 4, 2017 Regular Meeting Item Finance1 Council to review the Financial Report. Staff Contact: Liz Hilyard, Finance Director Scottsbluff Regular Meeting - 12/4/2017
3288 N GERONIMO N Geronimo Ave, Tucson, AZ 85705
 Property Details 16 TOTALLY REMODELED 2 BEDROOM 1 BATH UNITS WITH NEW A/C, FLOORS AND KITCHENS. GREAT RENTAL OCCUPANCY. CENTRAL TUCSON Price: $1,164,996 NEWLY REMODELED NEW A/C NEW KITCHENS SECURITY FENCED
Disclosures - IFFCO TOKIO General Insurance Co. Ltd. for the period 1st April, st December, 2018 S.No. Form No Description
 Disclosures - IFFCO TOKIO General Insurance Co. Ltd. for the period 1st April, 2018-31st December, 2018 S.No. Form No Description 1 NL-1-B-RA Revenue Account 2 NL-2-B-PL Profit & Loss Account 3 NL-3-B-BS
PENNSYLVANIA COMPENSATION RATING BUREAU F CLASS FILING INTERNAL RATE OF RETURN MODEL
 F Class Exhibit 4 Proposed 10/1/16 PENNSYLVANIA COMPENSATION RATING BUREAU F CLASS FILING INTERNAL RATE OF RETURN MODEL The attached pages present exhibits and a description of the internal rate of return
Sensitivity to Market Risk Consolidated Examples
 Sensitivity to Market Risk Consolidated Examples Table of Contents Click the titles below to access the examples or you may scroll through the document. Sample IRRSA IRRSA Earnings Page Example UBPR: Balance
June 2017 YTD Income Statement
 40000.000 Revenue 41000.000 Operations Revenue 41100.000 Tenant Rental Income 41100.150 Gross Potential Rent 78,074.00 78,447.00-373.00-0.48 41100.999 Total Tenant Rental Income 78,074.00 78,447.00-373.00-0.48
PARTICIPATING ORGANISATIONS CIRCULAR
 PARTICIPATING ORGANISATIONS CIRCULAR Date : 24 November 2011 R/R No. : 10 of 2011 DIRECTIVES ON SUBMISSION BY PARTICIPATING ORGANISATIONS OF PERIODIC REPORTS BY ELECTRONIC TRANSMISSION TO BURSA MALAYSIA
 Wausau Community Development Authority Balance Sheet September 30, 2017 Low Rent (46 Scattered Sites) Voucher (Sec 8) Riverview Terrace Business Activity ** Business Activity II Redevelopment (Fund 01)
Jernigans Mobile Home Community 103 Spring Street, Grovetown, GA 30813
 EXECUTIVE SUMMARY OFFERING SUMMARY Sale Price: $600,000 Number Of Units: 21 Cap Rate: 9.4% NOI: $66,895 Lot Size: 2.7 Acres Building Size: 23,000 PROPERTY OVERVIEW 21 Space park. All units are park owned
Sample Institution Memphis, TN
 Morgan Keegan FIXED INCOME RESEARCH Morgan Keegan & Company, Inc. Members New York Stock Exchange Memphis, TN Asset & Liability Analysis MORGAN KEEGAN & COMPANY, INC. Memphis, Tennessee June 2, 2008 The
City of Eagleville Budget Presentation Fiscal Year 2018
 City of Eagleville Budget Presentation Fiscal Year 2018 Work Sessions: March 9, 2017: March 23, 2017: April 13, 2017: General Fund Revenue Estimates Parks & Recreation State Street Aid Revenue and Expenses
City of Scottsbluff. Fund Equity in Cash June 30, 2015
 City of Scottsbluff Fund Equity in Cash 30, 2015 2 YRS PRIOR PRIOR YEAR PRIOR MONTH CURRENT MONTH Fund Fund # 30, 2013 30, 2014 May 31, 2015 30, 2015 3 General 111 $ 4,043,065.42 $ 3,883,397.98 $ 3,583,597.55
Effective Gross Revenue 3,335,005 3,130,591 3,320,552 3,338,276 3,467,475 3,606,962 3,509,653 3,981,103 3,984,065 4,147,197 4,300,790
 Schedule Of Prospective Cash Flow In Inflated Dollars for the Fiscal Year Beginning 1/1/2011 Potential Gross Revenue Base Rental Revenue $3,331,625 $3,318,220 $3,275,648 $3,270,394 $3,368,740 $3,482,312
DELAWARE COMPENSATION RATING BUREAU, INC. Internal Rate Of Return Model
 Exhibit 9 As Filed DELAWARE COMPENSATION RATING BUREAU, INC. Internal Rate Of Return Model The attached pages present exhibits and a description of the internal rate of return model used in deriving the
Rebate Report. $15,990,000 Public Finance Authority Charter School Revenue Bonds (Voyager Foundation, Inc. Project) Series 2012A
 Series 2012A") Rebate Report $15,990,000 Delivery Date: October 9, 2012 Installment Computation Period Ending Date: October 8, 2017 The Bank of New York Mellon Trust Company, N.A. Corporate Trust 5050 Poplar Avenue,
Rebate Report $15,990,000 Delivery Date: October 9, 2012 Installment Computation Period Ending Date: October 8, 2017 The Bank of New York Mellon Trust Company, N.A. Corporate Trust 5050 Poplar Avenue,
Department Mission: Mandated Services: Department Overview:
 Department: Treasurer FY 2019 Proposed Budget Department Mission: Our mission is to provide financial stewardship for Klamath County by safeguarding financial resources while maximizing investment return
12-Unit Apartment Building Along Harlem Avenue In Bridgeview
 12-Unit Apartment Building Along Harlem Avenue In Bridgeview 7740 SOUTH HARLEM AVENUE BRIDGEVIEW, IL 60455 DETAILS Sale Price $799,000 NOI $51,037 Cap Rate 6.4% Occupancy 92% Number Of Units 12 Lot Size
PROJECT PROFILE ON THE ESTABLISHMENT OF RECREATIONAL CENTER
 Investment Office ANRS PROJECT PROFILE ON THE ESTABLISHMENT OF RECREATIONAL CENTER Development Studies Associates (DSA) October 2008 Addis Ababa Table of Contents 1. Executive Summary...1 2. Service Description
F O R S A L E B U R L I N G T O N C O A T F A C T O R Y I N V E S T M E N T O P P O R T U N I T Y REPRESENTATIVE PHOTO
 F O R S A L E REPRESENTATIVE PHOTO B U R L I N G T O N C O A T F A C T O R Y I N V E S T M E N T O P P O R T U N I T Y TABLE OF CONTENTS TABLE OF CONTENTS... 2 EXECUTIVE SUMMARY... 3 OVERVIEW... 4 AERIALS...
Swan Trust Series
 Swan Trust Series 20111 March 1st 2015 30th March 2016 Monthly Information Report Portfolio: Swan Trust Series 20111 Monthly Information Report: March 1st 2015 30th March 2016 Amounts denominated in currency
Fort Wayne Rescue Mission Ministries Balance Sheet As of 1/31/2018. Current Year
 Balance Sheet As of 1/31/2018 Assets Cash Petty Cash 1,550.00 Religious fund account 405,191.94 IAB Saving Account 1,623.95 Treasure House Cash Checking 25,873.27 Well Fargo Saving 500.31 Cash Capital
Swan Trust Series
 Swan Trust Series 20111 1st May 2017 30th May 2017 Monthly Information Report Portfolio: Swan Trust Series 20111 Monthly Information Report: 1st May 2017 30th May 2017 Amounts denominated in currency of
12:45 PM Phoenix Bioinformatics Corporation. 03/27/15 Statement of Financial Income and Expense Accrual Basis January through December 2014
 12:45 PM Phoenix Bioinformatics Corporation 03/27/15 Statement of Financial Income and Expense Jan - Dec 14 Ordinary Income/Expense Income 43400 Direct Public Support 980.00 45000 Investments 1.12 46400
Investors presentation Oddo BHF Forum - January 2019
 Investors presentation Oddo BHF Forum - January 2019 YMAGIS IN A NUTSHELL European leader for digital technologies and services for the cinema industry 26 countries 180m present in 26 countries across
City of Scottsbluff. Fund Equity in Cash June 30, 2014
 City of Scottsbluff Fund Equity in Cash June 30, 2014 2 YRS PRIOR PRIOR YEAR PRIOR MONTH CURRENT MONTH Fund Fund # June 30, 2012 June 30, 2013 May 31, 2014 June 30, 2014 3 General 111 $ 3,292,962.43 $
SECTION DESCRIPTION PAGE I. BUDGET INTRODUCTION... 1 II. FISCAL YEAR 2017 BUDGET ANALYSIS... 2 III. PROPOSED OPERATING BUDGET... 4
 2018 SECTION DESCRIPTION PAGE I. BUDGET INTRODUCTION... 1 II. FISCAL YEAR 2017 BUDGET ANALYSIS... 2 III. PROPOSED OPERATING BUDGET... 4 IV. GENERAL FUND 001 DESCRIPTIONS... 6 V. DEBT SERVICE FUNDS... 9
Term Insurance vs. Indexed Universal Life
 Insurance vs. Indexed Universal Life For: Tom Robinson Presented By: [Licensed user's name appears here] Preface A decision to acquire additional life insurance can represent one of several significant
Total Rental Revenue 353, , , ,708, ,670, , ,065,155.81
 The Meadows (meadows) Page 1 REVENUE Rent Income Rent Revenue 375,500.00 375,249.00 251.00 0.07 2,861,791.81 2,852,686.81 9,105.00 0.32 4,357,760.81 Loss to Lease 561.00-1,887.00 2,448.00 129.73-777.00-9,870.00
Balance Sheet Report Harbour Hill Condominium Apartments Association, Inc. As of December 31, 2015
 Sheet Report As of December 31, 2015 Dec 31, 2015 Nov 30, 2015 Change Assets Operating Funds 1000 - BB&T Operating 6812 38,550.91 75,655.23 (37,104.32) 1010 - Operating Cash Account 11 565.83 0.00 565.83
2017 BLAWNOX PROPOSED BUDGET
 2017 BLAWNOX PROPOSED BUDGET GENERAL FUND Revenue 301 Real Estate Taxes 2016 YTD 2016 Projected YE 2017 Budget 301.10 RE-Current Taxes (8 mills) 554,705.30 564,792.34 578,618.12 301.12 RE-Fire Service
We Care Community Foundation Statement of Financial Income and Expense Accrual Basis January 1 through December 15, 2007
 211 Student Ed 221 Teacher Ed 511 Management 521 Governance 531 Membership de... 100 Research (200 ED) (200 ED) Total 200 ED (500 M&G) (500 M&G) (500 M&G) Ordinary Income/Expense Income 4 Contributed support
FY18 YTD Activity by Fund Group Summary For Fiscal: Period Ending: 11/30/2017
 City of Dana Point, CA FY18 by Fund Group Summary For Fiscal: 2017-2018 Period Ending: 11/30/2017 Fund: 01 - GENERAL Revenue RevenueType: 10 - Taxes & Franchises 6101 - Sec & Unsec Property Taxes 6103
Just a Few Keystrokes Away
 0 8/8/2018 Financial Literacy Just a Few Keystrokes Away 1 Table of Contents Page 0 Page 1 Page 2 Page 3 Page 4 Page 5 Page 6 Page 7 Page 8 Page 9 Page 10 Page 11 Page 12 Page 13 Page 14 Page 1518 Cover
Florida Alliance for Assistive Services and Tec
 Florida Alliance for Assistive Services and Tec 5:09 PM Balance Sheet 08/09/2016 As of June 30, 2016 Accrual Basis ASSETS Current Assets Checking/Savings 1000 Cash - Unrestricted Jun 30, 16 1011 Regions
Swan Trust Series
 Swan Trust Series 20111 31st January 2017 28th February 2017 Monthly Information Report Portfolio: Swan Trust Series 20111 Monthly Information Report: 31st January 2017 28th February 2017 Amounts denominated
Economics and Competitiveness. Cost and Return Benchmarks for Crops and Forages. Brown Soil Zone
 Economics and Competitiveness 2015 Cost and Return Benchmarks for Crops and Forages Brown Soil Zone TABLE OF CONTENTS 2015 Brown Soil Zone OVERVIEW...1 CROPS Spring Wheat...2 FORAGES Roundup Ready Canola...5
Texas Tech University Health Sciences Center (739) Statement of Net Position August 31, 2017 and 2016
 Statement of Net Position August 31, 2017 and 2016") Statement of Net Position August 31, 2017 and 2016 Restated 2017 2016 ASSETS Current Assets: Cash and Cash Equivalents $ 55,910,167.26 $ 58,852,794.43 Restricted Cash and Cash Equivalents 76,001,967.30
Statement of Net Position August 31, 2017 and 2016 Restated 2017 2016 ASSETS Current Assets: Cash and Cash Equivalents $ 55,910,167.26 $ 58,852,794.43 Restricted Cash and Cash Equivalents 76,001,967.30
All Souls Unitarian Universalist Church Statement of Financial Position As of November 30, 2018
 ASSETS Current Assets Checking/Savings Statement of Financial Position As of November 30, 2018 1001 Checking 28,354.47 1002 Minister's Discretionary 12,035.76 11,485.76 550.00 1003 Petty Cash 250.00 1004
J.S. Vaughan Professional Business Support Services 3251 Prices Fork Blvd. Apt. 108 Suffolk VA
 J.S. Vaughan Professional Business Support Services 3251 Prices Fork Blvd. Apt. 108 Suffolk VA 23435 jsvpbss@charter.net 2019 Price List Form Name Per Item Per Form Form Description Form 1040 0.00 $ 200.00
October 2018 Monthly Financial Statements
 October 2018 Monthly Financial Statements Prepared by City Treasurer s Office 11.5.2018 CASH AND INVESTMENTS BY FUND October 31, 2018 GENERAL FUND 10-100000 CASH AND INVESTMENTS 2,148,760 10-100050 SPECIAL
Summary of Main Checking Account
 December 31, 2014 Summary of Main Checking Account Cash In Cash Out Net Change Prior Month Current Pre-Paid Sub Total Current Pre-Paid Sub Total Current Pre-Paid Total Year October 34,667.52 20,265.00
The financial reports included in your board packet represent IHLS Financial Activities through July 31, 2018.
 Attachment 5.1 To: From: Date: RE: IHLS Board of Directors Adrienne L. Elam August 28, 2018 IHLS Financial Reports as of July 31, 2018 FY2017-18 System Area & Per Capita Grant (SAPG) Status As of July
VILLAGE BUDGET. FOR FISCAL YEAR June 1, May 31, 2019 VILLAGE OF FARMINGDALE NASSAU COUNTY CERTIFICATION OF CLERK
 VILLAGE BUDGET FOR FISCAL YEAR June 1, 2018 - May 31, 2019 VILLAGE OF FARMINGDALE NASSAU COUNTY CERTIFICATION OF CLERK I certify that this is a true copy of the budget of the Village of Farmingdale for
SECTION DESCRIPTION PAGE I. BUDGET INTRODUCTION... 1 II. FISCAL YEAR 2017 BUDGET ANALYSIS... 2 III. PROPOSED OPERATING BUDGET... 3
 2018 SECTION DESCRIPTION PAGE I. BUDGET INTRODUCTION... 1 II. FISCAL YEAR 2017 BUDGET ANALYSIS... 2 III. PROPOSED OPERATING BUDGET... 3 IV. GENERAL FUND 001 DESCRIPTIONS... 4 V. DEBT SERVICE FUNDS... 6
State of New Jersey Department of Community Affairs Annual Debt Statement
 State of New Jersey Department of Community Affairs Annual Debt Statement Hanover Township - 2017 Date Prepared: 1/3/2018 Budget Year Ending 12/31/2017 (Month D-D) 2017 (Year) Name: Silvio Esposito Phone:
RESOLUTION NOW, THEREFORE, BE IT RESOLVED BY THE BOARD OF SUPERVISORS OF THE CORKSCREW FARMS COMMUNITY DEVELOPMENT DISTRICT:
 RESOLUTION 2017-08 A RESOLUTION OF THE BOARD OF SUPERVISORS OF THE CORKSCREW FARMS COMMUNITY DEVELOPMENT DISTRICT APPROVING PROPOSED BUDGET(S) FOR FISCAL YEAR 2017/2018 AND SETTING A PUBLIC HEARING THEREON
School Board of Brevard County
 School Board of Brevard County Annual Financial Report For the Year End June 30, 2014 DISTRICT SCHOOL BOARD OF BREVARD COUNTY STATEMENT OF REVENUES, EXPENDITURES AND Exhibit K-1 CHANGES IN FUND BALANCE
Sample Financial Analysis - Strategy 1: Bad Logic
 Sample Financial Analysis - Strategy 1: Bad Logic Presented By: [Licensed user's name appears here] , 55/50 Client Information Summary Current Liquid : Liquid (Taxable Interest) $ 1,000,000 Liquid (Tax
Chris Doerr Phone: Aircraft Cost Calculator, LLC 1341 W. Mequon Road, Suite 205, Mequon, WI Powered by ACC:
 Annual & Hourly Cost Detail Embraer Legacy 650 GENERAL PARAMETERS Min Crew / Max Passengers 2 / 13 Seats Full Range (NM / SM) 3569.48 / 4107.68 Normal Cruise Speed (KTS / MPH) 435.83 / 501.54 Average Pre-Owned
BUDGET FOR YEAR ENDING SEPTEMBER 30, 2018
 Ordinary Income/Expense Income 40000 FRANCHISE FEES 40140 Other Franchise Fees 6,000.00 3,300.00 3,546.87 4,509.57 3,904.82 40100 Bowie Cass Electric 29,400.00 33,360.00 14,694.20 31,090.05 35,560.33 40110
CITY OF OSAGE BEACH. Financial Statements
 CITY OF OSAGE BEACH Financial Statements June 30, 2018 CASH AND INVESTMENTS BY FUND June 30, 2018 GENERAL FUND 10-100000 CASH AND INVESTMENTS 1,966,171 10-100050 SPECIAL POLICE PROJECTS 5,321 10-100141
Association Financials
 Association Financials Understanding Your Association Financial Reports Your Condomimum Homeowner Association Table of Contents 1. Balance Sheet 2. Income Expense Statement 3. Cash Disbursements 4. Receivable
FY ANNUAL FINANCIAL REPORT
 Charter Schools FY 2015-2016 ANNUAL FINANCIAL REPORT Page 1 TOTAL CHARTER FEDERAL ACCOUNT ALL SCHOOLS PROJECTS NO. FUNDS FUND CHS FUND 142 FUND CONDENSED BALANCE SHEET - ALL FUNDS ASSETS 11120 Cash on
Report : Financial Status
 Report : Financial Status Layout Options: Summarized By = Fund, LineItemAccount; Page Break At = Fund Line Item Account Adjusted Budget As of: (50% Elapsed) Accounting Period: OPEN Year-To-Date Actual
MACRO-PRUDENTIAL RULES AND REGULATION (2015): DISCLOSURE REQUIREMENTS ANNEXURE I: FORMAT FOR ANNUAL DISCLOSURES DRUK PNB BANK LTD.
: DISCLOSURE REQUIREMENTS ANNEXURE I: FORMAT FOR ANNUAL DISCLOSURES DRUK PNB BANK LTD.") MACRO-PRUDENTIAL RULES AND REGULATION (2015): DISCLOSURE REQUIREMENTS ANNEXURE I: FORMAT FOR ANNUAL DISCLOSURES DRUK PNB BANK LTD. For the Year ended December 31, 2016 Item 1: Tier I Capital and its Sub-components
MACRO-PRUDENTIAL RULES AND REGULATION (2015): DISCLOSURE REQUIREMENTS ANNEXURE I: FORMAT FOR ANNUAL DISCLOSURES DRUK PNB BANK LTD. For the Year ended December 31, 2016 Item 1: Tier I Capital and its Sub-components
Statement of Financial Position As of June 30, 2017
 Statement of Financial Position As of June 30, 2017 ASSETS Current Assets Checking/Savings 1001 Checking 55,510.59 1002 Minister's Discretionary 6,212.68 1003 Petty Cash 250.00 1004 Demeters Checking Account
E-Community Check Request Checklist
 E-Community Check Request Checklist The E-Community must complete the following information on each business approved for a loan or grant in order for the Kansas Center of Entrepreneurship (KCFE) to disburse
SunCoast Cathedral Metropolitan Community Church, Inc. Balance Sheet As of October 31, 2016 Oct 31, 16
 1:47 PM Balance Sheet As of October 31, 2016 Oct 31, 16 ASSETS Current Assets Checking/Savings General / Design Fd un Tr 5295 20,370.46 BOC- General Operating 2399 31,858.71 BOC - Reserve Bequests. 2381
Sample Statements and Charts
 Sample Statements and Charts Write-Up CS or Trial Balance CS version 2007.x.x TL17346 (04/24/07) Copyright Information Text copyright 1998-2007 by Thomson Tax & Accounting. All rights reserved. Video display
PORTLAND FRIENDS OF THE DHAMMA Financial Statement Narrative
 PORTLAND FRIENDS OF THE DHAMMA Financial Statement Narrative for the Six Months ending June 30, 2017 PROFIT & LOSS BUDGET VS. ACTUAL GENERAL FUND Net Income for the First Half of 2017 exceeded Budget by
Statement of Financial Position As of May 31, 2017
 ASSETS Current Assets Checking/Savings Statement of Financial Position As of May 31, 2017 1001 Checking 59,311.03 1002 Minister's Discretionary 6,212.68 1003 Petty Cash 250.00 1004 Demeters Checking Account
Fairway Estates Community Association. Treasurers Report. October 10, 2018 Covering month ending September 2018
 Fairway Estates Community Association Treasurers Report October 10, 2018 Covering month ending September 2018 $40 was deposited in annual dues, bringing the YTD total to $14,120. Our goal for the year
Total Contribution Income a or 1c subtotal -1f 8 1
 Treasurer's Report Revenue Prior Year 2007 Form 990 -Pt. VIII - Revenue Revenue Current Year Budget Actual 2009 Budget Part A. Income 1. Contributions A. Meeting Grants 5500.00 9000.00 2000.00 1a or 1c
UxÇàÉÇ VÉâÇàç Washington
 UxÇàÉÇ VÉâÇàç Washington Monthly Financial Report July, 2018 Financial Report Prepared by the Benton County Auditor s Office County Auditor: Brenda Chilton Chief Accountant: Van H. Pettey, CPA, MBA Financial
Product Overview EXPLORE. Scholars Choice 529 plan INVESTMENT PRODUCTS: NOT FDIC INSURED NO BANK GUARANTEE MAY LOSE VALUE
 Product Overview EXPLORE Scholars Choice 529 plan INVESTMENT PRODUCTS: NOT FDIC INSURED NO BANK GUARANTEE MAY LOSE VALUE College is within reach. You just need the right partner. With the Scholars Choice
Independent Accountant's Compilation Report
 MILLER, BRUSSELL, EBBEN AND GLAESKE LLC CERTIFIED PUBLIC ACCOUNTANTS POST OFFICE BOX 585 PORTAGE, WISCONSIN 53901 Independent Accountant's Compilation Report Saddle Ridge Association Ltd A Wisconsin Homeowners
All Souls Unitarian Universalist Church Statement of Financial Position As of June 30, 2018
 ASSETS Current Assets Checking/Savings Statement of Financial Position As of June 30, 2018 1001 Checking 86,013.66 1002 Minister's Discretionary 9,365.76 9,365.76 0.00 1003 Petty Cash 250.00 1004 Demeters
SALES OF ELECTRIC ENERGY
 SALES OF ELECTRIC ENERGY 44000 Residential Sales 1,258,127.68 912,731.87 11,422,950.06 11,624,286.42 19,408,954.42 44020 Dusk To Dawn Sales 10,993.16 10,520.24 87,245.86 91,897.67 131,181.78 44200 Commercial
CITY OF OSAGE BEACH. Financial Statements
 CITY OF OSAGE BEACH Financial Statements February 28, 2018 CASH AND INVESTMENTS BY FUND February 28, 2018 GENERAL FUND 10-100000 CASH AND INVESTMENTS 2,085,034 10-100050 SPECIAL POLICE PROJECTS 5,317 10-100141
VIKING INSPECTION PROPERTY 4921 U.S. Hwy. 85, Williston, ND 58801
 SALE PRICE: $799,000 LOT SIZE: +/-2.49 Acres BUILDING SIZE: +/-3,800 SF DRIVE-IN DOORS 2 CEILING HEIGHT: 16' YEAR BUILT: 2007 ZONING: Commercial PROPERTY OVERVIEW Highly visible, hard-to-find small shop/office/apartment
G200 & CL605 Analysis
 G200 & CL605 Analysis Annual & Hourly Cost Detail Gulfstream G200 GENERAL PARAMETERS Min Crew / Max Passengers 2 / 8 Seats Full Range (NM / SM) 3051.75 / 3511.89 Normal Cruise Speed (KTS / MPH) 447.53
Economic, Productive & Financial Performance Of Alberta Cow/Calf Operations
 Benchmarks for Cattlemen Economics & Competitiveness Economic, Productive & Financial Performance Of Cow/Calf Operations Moist Mixed land Production Year - 1999 Nov-03 Foreword This AgriProfit$ & Returns
INVESTOR GUIDE. A development by
 INVESTOR GUIDE A development by Developer: LBS Properties & Xinyuan International Development name: Address: Developer: Local authority: Tenure: Building insurance: The Madison 199 207 Marsh Wall, London
Town of New Haven 2015 Budget
 1 REVENUES TAXES Property Taxes from Local Levy 149,820.00 185,707.00 185,707.00 197,137.00 6.155% Other Taxes (MFL from WI DNR) 33,750.00 684.00 2,000.00 700.00 TOTAL TAXES 183,570.00 186,391.00 187,707.00
Paradise Island Condominium Balance Sheet January 31, Assets Current Assets Operating Cash 3, Total Cash Assets 3,442.
 Balance Sheet January 3, 206 Assets Current Assets Operating Cash 3,442.42 Total Cash Assets 3,442.42 Restricted Deposits & Funded Reserves Accrued Interest on investments 795.00 Unrealized Gain/Loss 4,83.39
How to Calculate Form Line 15
 How to Calculate Form 8621 - Line 15 2013-2015 Comprehensive Example Mary Beth Lougen EA USTCP Chief Operating Officer Expat Tax Tools B.Lougen@f8621.com 1 (844) 312-8670 ext. 402 www.f8621.com www.expattaxtools.com
Chelwood Hills Homeowners Association 2016 Budget Approved at Annual Meeting on January 9, 2016
 DUES PAYING HOMEOWNERS 2016 Budget Approved at Annual Meeting on January 9, 2016 January February March April May June July August September October November December TOTAL Total Number of Dues Payments
Samostalna Liberalna Stranka
 Annual Financial Statements with Independent Auditors Report thereon 01 January 2013-31 December 2013 Table of Contents: Independent Auditors report..... 3 Statement of financial position....... 7 Statement
Jan - Dec 16 Budget $ Over Budget Income 300 TAXES Real Estate Taxes , ,500.00
 Jan - Dec 16 Budget $ Over Budget Income 300 TAXES 301.000 Real Estate Taxes 0.00 182,500.00-182,500.00 302.000 Fire Tax 0.00 30,000.00-30,000.00 310.000 Per Capita Taxes 0.00 0.00 0.00 310.100 Real Estate
Annual & Hourly Cost Detail
 Aircraft Analysis Annual & Hourly Cost Detail Embraer Phenom 100 GENERAL PARAMETERS Min Crew / Max Passengers 1 / 6 Seats Full Range (NM / SM) 896.00 / 1031.10 Normal Cruise Speed (KTS / MPH) 390.00 /
LUCRE O U R M A N I F E S T O COPYRIGHT 2018 LUCRE. ALL RIGHTS RESERVED V E R S I O N 1. 3 J A N
 LUCRE O U R M A N I F E S T O COPYRIGHT 2018 LUCRE. ALL RIGHTS RESERVED V E R S I O N 1. 3 J A N 2 0 1 8 Contents 0 6 INTRODUCTION A quick snapshot of our vision for Lucre and how we feel it will benefit
Sheet1. Total Unreserved Net Assets/Retained Earnings
 WYSOX TOWNSHIP GENERAL FUND BUDGET Fund 01 2015 EQUITY 289.000 Unreserved Net Asset/Retained Earnings 289.990 Unreserved Retained Earnings 650303.44 Total 289.000 Unreserved Net Assets/Retained Earnings
Case Doc 496 Filed 04/26/12 Entered 04/26/12 15:39:11 Desc Main Document Page 1 of 17
 Document Page 1 of 17 Document Page 2 of 17 DEBTOR: MID-AMERICA CEDAR, INC. CASE NO: 11-45203 Form 2-B CASH RECEIPTS AND DISBURSEMENTS STATEMENT For Period: _3/1/2012_ to _3/31/2012_ CASH FLOW SUMMARY
VHDA dba Jefferson South of the James (jsoj) Budget Comparison (with PTD) Period = Jul 2012-May 2013 Book = Accrual
 Budget Comparison (with PTD) Period = Jul 2012-May 2013 Book = Accrual") 5000-0000 REVENUES 5102-0000 GROSS POTENTIAL/LEASING REVENUE 5103-0000 Gross Potential Rent 95,220.00 147,600.00-52,380.00-35.49 1,226,664.20 1,623,600.00-396,935.80-24.45 5120-0000 Tenant Rents 0.00 0.00
5000-0000 REVENUES 5102-0000 GROSS POTENTIAL/LEASING REVENUE 5103-0000 Gross Potential Rent 95,220.00 147,600.00-52,380.00-35.49 1,226,664.20 1,623,600.00-396,935.80-24.45 5120-0000 Tenant Rents 0.00 0.00
Name of Bank BASEL III LEVERAGE RATIO REPORT As of 30 Sep 2018
 PART I. CALCULATION OF BASEL III LEVERAGE RATIO Item Nature of Item Reference Account Code Amount A. CAPITAL MEASURE 300000000000900000 741,513,309.86 A.1 Tier 1 Capital Basel III CAR Report (Version 3)
Statement of Financial Position As of February 28, 2017
 6:47 AM Statement of Financial Position As of February 28, 2017 Feb 28, 2017 ASSETS Current Assets Checking/Savings 1001 Checking 8,608.21 1002 Minister's Discretionary 6,277.30 1003 Petty Cash 250.00
Fairway Estates Community Association. Treasurers Report. November 14, 2018 Covering month ending October 2018
 Fairway Estates Community Association Treasurers Report November 14, 2018 Covering month ending October 2018 $40 was deposited in annual dues, bringing the YTD total to $14,160. Our goal for the year is
Town of Williamston Revenue & Expense - Detail January 31, 2019 Revenues
 Revenues 001 000 4000 PROPERTY TAXES - CURRENT 411,099.17 703,421.43 983,500.00 280,078.57 001 000 4010 PROPERTY TAXES - DELINQUENT 1,001.32 108,417.11 35,000.00 (73,417.11) 001 000 4030 MOTOR VEHICLE
SCHOOLING FOR LIFE FOUNDATION FINANCIAL STATEMENT FOR THE MONTH OF
 SCHOOLING FOR LIFE FOUNDATION FINANCIAL STATEMENT FOR THE MONTH OF MAY 2014 TO JUNE 2015 SCHOOLING FOR LIFE FOUNDATION CONTENTS: PAGE GENERAL INFORMATION 3 REPORT ON THE ACCOUNT DEPT. 4 FINANCIAL STATEMENT
Summary of All Units Change In Net Position For the Four Months Ending Tuesday, July 31, Annual Budget
 Summary of All Units Customer Billings 4001 Customer Billings $19,603,438.00 $6,675,236.00 $6,812,439.85 $137,203.85 4004 Dark Fiber Billings 122,480.00 40,828.00 21,720.00 (19,108.00) 4005 Capital Billings
Working budget 2019 for Assembly review
 INCOME: Contributions: 1 Collections 4,000.00 3,584.09 3,600.00 3,724.09 3,000.00 3,266.94 7th Tradition, silent auction Increase for 2019 seems likely proceeds, donation can given YTD figure. amounts