Uchiyama, Yuta & Okabe, Akiko Categorization of 48 Mega-Regions by Spatial Patterns of Population Distribution 48 th ISOCARP Congress 2012
|
|
|
- Beryl Chandler
- 6 years ago
- Views:
Transcription
1 Categorization of 48 Mega-Regions by Spatial Patterns of Population Distribution: The Relationship between Spatial Patterns and Population Change Comparative Study of Mega-regions: Toward a Dynamic Observation of Transformation Yuta Uchiyama, Graduate School of Engineering, Chiba University, Japan Akiko Okabe, Graduate School of Engineering, Chiba University, Japan 1. Introduction Megacities, defined as urban agglomerations that have more than 10 million inhabitants, often face difficulties related to physical management. Their size, heterogeneity, and accelerated speed of change often go beyond what can be managed through urban planning. Cities also must take into account global influences such as migration and the investment of external capital. In addition, recent shifts in priority from economic growth to sustainability present the integrated challenge of maximizing quality of life while minimizing impact on climate change. These facts make it crucial that the governance of megacities by multiple-actors is strongly required to complement the actual governmental management led by planning. The activities of these actors should be based on shared observation and understanding of the realities of megacities and involve information that makes global comparisons possible. Even if megacities have quantitatively similar populations, their urban requirements are rather diverse. Megacities in Africa and Asia are not only increasing in number, but in population size as well, with an estimated population growth of more than 2% per year expected until the year 2025 at least (UN DESA 2011). Only in some cases, such as those of New York or Tokyo, are large urban agglomerates not expected to grow. Some megacities must prioritize issues of overcrowding, traffic congestion, and social divisions, while others struggle with sprawl, expansion of artificial land use, climate change, and the degradation of central areas (Sorensen & Okata 2011). Sharing the assumption that urban form or spatial patterns must deal a lot with urban problems, the polycentric structure is discussed widely with the expectation to solve the contemporary problems of megacities, not only hyper-growth megacities but also mature megacities as well (Camagni & Salone 1993, McGee & Robinson 1996, Davoudi 2003). Because megacities have huge extended areas, spatial pattern is an important attribute for comparison. While many attempts have been made to compare megacities around the world, the majority involve comparison on the basis of indicators such as population, GDP, or emissions (Susteren 2005, UN HABITAT 2008). Analyses of spatial patterns are rather scarce, and those that exist are mainly qualitative and include a limited sample of megacities. For example, Burdett and Sudjic (2008, 2011) have compared nine cities by visualizing spatial patterns of population distribution and urban fabric involving three-dimensional representations. Similar three-dimensional representations of 10 cities have been introduced in the report of the World Bank (World Bank 2010). In this paper, we attempt to categorize megacities by their spatial characteristics in order to provide a platform for global comparison. Then, we analyze the categorized groups by spatial patterns and speed of growth. 1
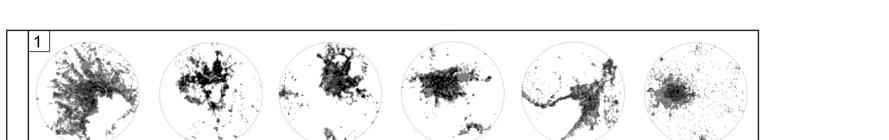
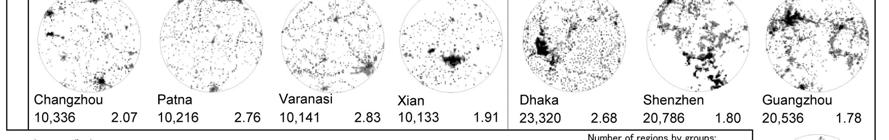
2 2. Data and Mega-Regions There are two critical barriers preventing the categorization of megacities by spatial patterns. First, the real agglomeration areas of megacities often extend over several administrative units, and no common global standard has been established for identifying megacity areas. Second, while collecting data through individual primary census units or smallest units is indispensable to the analysis of spatial patterns, it is almost impossible to do so in megacities, particularly in emerging urban agglomerations in Africa and Asia that are experiencing rapid growth. In order to overcome the first barrier, recognizing that megacities have two-dimensional expanses, we have defined mega-regions on the basis of the level of population in an area of the same size 1. In order to overcome the second barrier, we relied on population distribution patterns in analyzing spatial characteristics. We adopted a high-resolution population data set 2, which was created through the use of remote sensing imagery, to estimate population distribution. While we are well aware that spatial characteristics of mega-regions can be explained not only in terms of population but also land cover, built environment, and traffic networks, among others, we consider population distribution to reflect to a certain extent other elements that determine spatial characteristics. Further, on a pragmatic level, population data is the most accessible data and can be found for all cities worldwide. This paper is based on LandScan population data set (grid resolution: 30 arc seconds). LandScan is different from nighttime population by census. It shows population over an average span of 24 hours, not only in residential areas, but also in business. Developed by using population censuses for each country, as well as traffic networks, remote sensing imagery, etc., it is updated more frequently than other world population data sets. We identified mega-regions through three steps. 3 First, all areas that have more than 10 million people within a radius of 50 km were identified; the centers of these circular areas were denominated central grids (each of the red grid areas in fig. 1, below, is a central grid). Then, from these grids, the central grid with the largest population within a radius of 50km was chosen and denominated the peak grid. Finally, the circular area within a radius of 50km from the peak grid was defined as the mega-region. Based on this process, we were able to identify 48 mega-regions around the world (see Table 1). These mega-regions did not necessarily contain megacities (cities with a population of more than 10 million people) as a core. Approximately 70% (34 regions) of 48 megaregions were found to be located in Asia. India has the largest number of mega-regions (11 mega-regions), with China following in the second place (9 mega-regions). Mega-regions are found worldwide, except on the Australian continent. For this study, we defined urban areas as areas that comprise grids that have 20 people/ha or more. Half of the world s population lives in urban areas. 4 2
3 Fig. 1: Identification of mega-region: Tokyo region (left); Shenzhen region and Guangzhou region (right) 3. Indicators of Characteristics of Population Distribution We developed a categorization of mega-regions on the basis of the following two aspects: Distribution diversity among different ranges of population density Two-dimensional distribution patterns The former aspect was examined by using M- and N-values, as defined below, while the latter was examined by using indicators of Moran's I and gravity of main urban area. Before conducting our examination, we confirmed that there was no strong correlation between these indicators and population numbers. 3
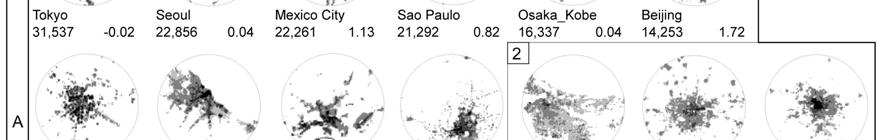
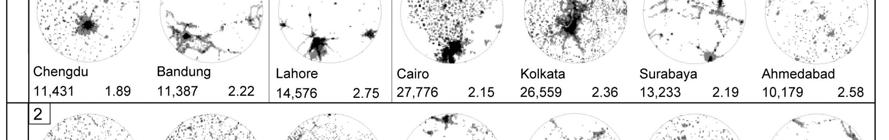
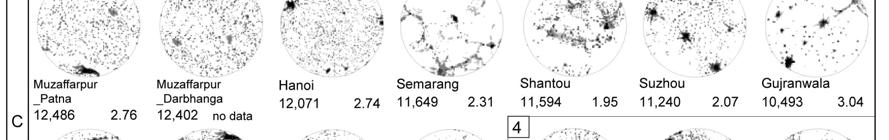
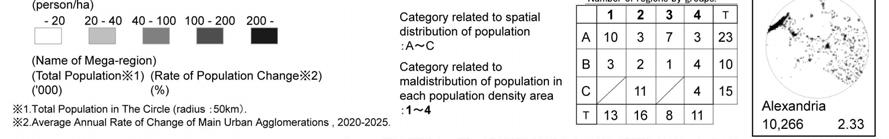
4 Region Country Mega-Region Total Population ('000) Population in Urban Area ('000) Urban Area (sqkm) Average Density in Urban Area (people/sqkm) Main Urban Area (sqkm) Rate of Population Change*(%) Africa Nigeria Lagos 10,459 8, , Bangladesh Dhaka 23,319 18,941 2,324 8, Beijing 14,252 10,687 1,551 6,891 1, Changzhou 10,335 6,733 1,099 6, Chengdu 11,430 7,860 1,074 7, Guangzhou 20,536 17,499 2,301 7, China Shanghai 18,650 15,688 1,918 8,180 1, Shantou 11,593 8,690 1,527 5, Shenzhen 20,786 18,839 2,032 9, Suzhou 11,240 8,014 1,141 7, Xian 10,132 6, , Ahmedabad 10,178 7, , Bangalore 10,218 7, , Chennai 10,931 8, , Delhi 25,013 21,254 1,943 10,939 1, Kolkata 26,559 22,796 3,012 7,568 1, India Lucknow-Kanpur 11,157 8,091 1,088 7, Asia Mumbai 22,050 20,593 1,281 16, Muzaffarpur-Darbhanga 12,401 7,873 1,693 4, no data Muzaffarpur-Patna 12,486 8,285 1,499 5, Patna 10,216 6,444 1,190 5, Varanasi 10,140 6,055 1,356 4, Bandung 11,386 7,952 1,296 6, Indonesia Jakarta 24,374 21,221 2,917 7,275 2, Semarang 11,648 7,996 1,346 5, Surabaya 13,233 9,822 1,241 7, Japan Osaka-Kobe 16,337 14,932 1,978 7,550 1, Tokyo 31,536 29,732 3,796 7,833 3, Gujranwala 10,493 6, , Pakistan Karachi 12,256 11, , Lahore 14,575 11, , Philippines Manila 20,751 19,485 1,533 12,711 1, South Korea Seoul 22,856 21,146 1,807 11,703 1, Thailand Bangkok 10,891 8,589 1,122 7, Vietnam Hanoi 12,071 7,701 1,731 4, Middle East Europe Latin America North America Egypt Alexandria 10,266 8,127 1,053 7, Cairo 27,776 25,005 2,729 9, Iran Tehran 11,989 11, , Turkey Istanbul 11,137 10, , France Paris 11,275 9,215 1,300 7,089 1, Russia Moscow 13,870 12,509 1,424 8,785 1, UK London 11,990 9,588 1,876 5,111 1, Argentina Buenos Aires 13,778 12,965 1,794 7,227 1, Brasil Rio de Janeiro 12,562 11,479 1,436 7, Sao Paulo 21,292 19,820 1,866 10,622 1, Mexico Mexico City 22,260 21,092 1,918 10,997 1, USA Los Angeles 12,346 10,491 2,673 3,925 2, New York 15,481 12,417 1,912 6,494 1, * (/year) Table 1: 48 mega-regions Sources: Rate of population change: World Urbanization Prospects: The 2011 Revision, other figures: ORNL LandScan TM 2007/UT-Battelle, LLC. 3.1 Distribution Diversity among Different Ranges of Population Density We created bar charts (see fig. 2) for each of the 48 mega-regions to describe distribution diversity among different ranges of population density. i) Maldistribution among different ranges of population density (M-value) 4
5 In order to compute this indicator on the basis of population amounts among different ranges of population density in each mega-region, we first calculated the mean of the population amount in each range of population density, except ranges that had no population. Second, we calculated the absolute values of differences between the mean and the population amounts in each range of population density, except ranges that had no population. Third, we calculated the sum of the absolute values and divided the sum by the total population amount in order to obtain the M-value. The higher this indicator was, the more unequal distribution among different ranges of density was shown. Hanoi was found to have the highest M-value (1.21) among the 48 mega-regions, while Tehran had the lowest (0.29). The mean value was 0.76, which was also the value for Alexandria. ii) Number of ranges of population density (N-value) This indicator shows how diverse ranges of population density are. N-value represents the number of different ranges of density in a mega-region, except for ranges with no population. Ranges of low density exist in almost all mega-regions, which means that the N-values were greater for mega-regions in which a higher percentage of the total population was living in relatively high-density areas. Of the 48 mega-regions, Dhaka was found to have the highest N-value (85), while Varanasi had the lowest (18). The mean value was 48.5, which was almost the same as Seoul s value (49). 3.2 Two-dimensional Distribution Patterns i) Global Moran's I Moran's I is defined as : Population density of gird i : Mean of : An element of a matrix of spatial weights. : ( A matrix of spatial weights) (Cliff & Ord 1973, Tsai 2005) We used an inverse of distance between grids as the element of a matrix of spatial weights. The value of Moran's I ranges from -1 to 1. If the value is near 1, the densities of neighboring grids tend to be similar. This indicator shows how grids of different densities are spatially intermingled. Paris was found to have the highest value (0.91) of the 48 mega-regions, while Muzaffarpur-Darbhanga had the lowest (0.18). The mean was 0.77, which was also the value for Surabaya. ii) Gravity of main urban area This indicator is the percentage of the largest continuous urban area (main urban area) in all urban areas in the region. The higher this indicator is, the more monocentric the urban form is; on the other hand, the lower the indicator is, the more diffused the urban form is. Jakarta was found to have the highest value (95%) among the 48 mega-regions, while Muzaffarpur- Darbhanga had the lowest (3%). The mean was 51%, which was almost the same as the value for Lahore (52%). 5
6 4. Result of Categorization 4.1 Distribution Diversity among Different Ranges of Population Density Hierarchical cluster analysis (Ward's method) has been used and, four categories (1, 2, 3, and 4) have been detected (see figs. 2, 3, and 4). The regions nearest to the centre of the set for each category were Moscow (1), Shantou (2), Lahore (3), and Shanghai (4). i) Category 1 (M-value: low, N-value: low): Moderate and narrow distribution among different ranges of density, high percentage of population in middle density area In this category, more than 50% of the total population was in areas of 40 to 200 people/ha. Approximately 20% of the total population was in low density (40 people/ha or less) or high density (200 people/ha or more) areas. People in mega-regions in this category were concentrated in relatively medium density areas. ii) Category 2 (M-value: high, N-value: low): Unequal and narrow distribution among different ranges of density, high percentage of population in low density area In this category, roughly 50% of the total population was in areas of 40 people/ha or less, and only roughly 10% of the total population was in areas of 200 people/ha or more. In this category, the highest percentage of people were in areas of 40 people/ha or less. Most of the people in mega-regions in this category were concentrated in relatively low density areas. iii) Category 3 (M-value: low, N-value: high): Equal and wide distribution among different ranges of density, high percentage of people in high density area In this category, roughly 50% of the total population was in areas of 200 people/ha or more, with people concentrated in relatively high density areas and across a relatively wide range of densities. iv) Category 4 (M-value: high, N-value: high): Unequal and wide distribution among different ranges of density, high percentage of people in low and high density areas In this category, 30% of the total population was in limited low density areas (40 people/ha or less) and the same percentage of total people were in high density areas (200 people/ha or more). 6
7 Uchiyama, Yuta & Okabe, Akiko Categorization of 48 Mega-Regions by Spatial Patterns of Population Distribution 48th ISOCARP Congress 2012 Fig. 2: Distribution diversity among different ranges of density in four categories (1,2,3,and 4) Fig. 3: Percentages of population in 3 ranges of density among total population Fig.4: Four categories (1,2,3,and 4) by M and N-values. Fig.5: Three categories (A, B, and C) by Moran's I and Gravity of main urban area. 4.2 Two-dimensional Distribution Patterns Hierarchical cluster analysis (Ward's method) has been used and, three categories A, B, and C have been detected (see fig. 5). 7
8 i) Category A (Moran's I: high, gravity of main urban area: high): Not very intermingled different density grids, not so diffused urban form Mega-regions in this category contain a megacity, as defined by the UN, or a capital city as a core. In this category, populations in mega-regions are concentrated in a core and their spatial patterns of population distribution are relatively simple. ii) Category B (Moran's I: high, gravity of main urban area: medium): Not very intermingled different density grids, diffused urban form Some mega-regions in this category contain a megacity, as defined by the UN, or a capital city, but they also include other cores or high density areas around their main core. For example, in Lahore, at least two cores are contained around the main core in what seems to be a polycentric urban form. Cairo and Kolkata contain many small, separate urban areas. These small urban areas demonstrate the importance of high density farming villages; moreover, almost all land cover in these urban areas is not built-up, but is made up of farm land, paddy fields, or other agricultural land. iii) Category C (Moran's I: low, gravity of main urban area: low): Intermingled different density grids, very diffused urban form Numerous mega-regions in this category do not have a clear main urban area. They have small, separate urban areas and some have several significant urban cores. Their spatial patterns of population distribution are very complicated, and each urban area is not corelated with a clear regional structure like the mega-regions in category A. Category A represents the simplest urban form, while category C represents the most complex one. Karachi or Paris of category A contrast sharply with Muzaffarpur-Darbhanga or Varanasi of category C. 4.3 Integrating Two Areas of Categorization By integrating the two areas of categorization mentioned above, we obtained 10 groups of mega-regions (see fig. 6), from A-1 to C-4, ranging from less to more diversity in population distribution among different ranges of density, and from less to more complex in urban form. Category A comprises 23 mega-regions, and 17 out of these 23 fall into categories 1 and 3. They tend to have a high percentage of their population concentrated in the center of the main urban area, and their urban forms are not so diffused. Their density tends to gradually get lower from the center to the periphery, and grids with different densities do not tend to be intermingled. All three mega-regions in group A-2 are in developed countries. Category B comprises 10 mega-regions and these can be sub-distributed into categories 1, 2, 3, and 4. We did not observe any common tendencies in distribution diversity among different ranges of density. Category C comprises 15 mega-regions and out of these, 11 have been classified as part of category 2. These tend to have high percentages of the population concentrated in low density areas and have diffused urban forms. The remaining four mega-regions of C-4 do not only involve maldistribution into different ranges of population density but also in terms of complexity of urban form. Different density grids tend to be intermingled in the mega-regions of category C. 5. Discussion 5.1 Population Size and Ten Categorized Groups There are 13 mega-regions with more than 20 million inhabitants. Out of these 13, 8 megaregions belong to category A and involve single large urban agglomerates. These are subdivided into three groups, four for A-1, three for A-3, and one for A-4. 8
9 All 5 mega-regions with populations of over 20 million in categories B and C belong to category 4 (high percentage of people living in both extremes of density, low and high). In particular, 3 out of 4 mega-regions in C-4 (most heterogeneous) have more than 20 million inhabitants. There is no mega-region with a population of over 20 million in category Regional Specifics and Ten Categorized Groups The 34 mega-regions in Asia (11 in India and 9 in China) fall into all 10 groups except A-2, which consists exclusively of two European cities and one American. Out of 15 mega-regions in category C, 14 are in Asia, and all 11 mega-regions in C-2 are in Asia. Further, 8 megaregions of 11 in category 4 are also Asian. Category C involves the most complex urban form, and category 4 indicates variety in the range of population density. Therefore, the megaregions whose characteristics are most complicated are concentrated in Asia. Eleven Indian mega-regions are distributed among four groups, with three in A-3, two in B-1, two in B-4, and four in C-2. Mega-regions in C-2 or A-3 tend to have a high percentage of population in either low or high density areas. In the mega-regions of B-4, population is widely distributed at both extremes of density and the urban form is diffused and complex. Nine Chinese mega-regions are distributed among five groups. More than half of them (six) are in category C, while Shanghai and Beijing are in A and Chengdu is in B. All four Latin American mega-regions are in A-1 and include single large urban agglomerates. 9
10 Fig. 6: Categorization of ten groups Sources: *1. ORNL LandScan TM 2007/UT-Battelle, LLC. *2. World Urbanization Prospects: The 2011 Revision. 10
11 5.3 Population Change and Ten Categorized Groups The mega-regions of A-1 and A-2 are predicted to experience low growth (average 0.79% per year for the period ). Out of these 13 regions, 7 are mega-regions in developed countries; all 4 Latin American mega-regions within the group have an estimated annual growth rate of around 1%. They have high shares of their populations in relatively medium density ranges and simple population distribution patterns. These can be called mature mega-regions, as their speed of growth has already slowed down. In contrast, the population of mega-regions in C-2 tends to grow fast (average 2.47% per year for the period ). If this high-speed growth tendency continues, their populations will be more than 1.4 times larger after 15 years. All 11 mega-regions in this group are Asian. Four of them are Chinese, and these have lower growth estimates than the rest 5. They have high percentages of their populations in the low density range and have complex urban forms. C-2 could become the next generation of mega-regions. The A-3 group also expects similar high growth. Out of seven mega-regions in this group, five are Asian. These mega-regions include large urban agglomerates, while mega-regions in the C-2 group do not. 6. Conclusion In this study, four categories (1, 2, 3, and 4) were identified by examining distribution diversity among different ranges of population density. Then, three categories (A, B, and C) were identified on the basis of two indicators related to two-dimensional distribution patterns Moran's I and gravity of main urban area. By integrating the two category areas, we obtained 10 groups of mega-regions. While mega-regions in groups A-1 (e.g. Tokyo) and A-2 (e.g. Paris) have urban forms that are relatively easy to recognize, most mega-regions at the other end of the spectrum in groups C-4 and B-4 have very complicated and heterogeneous urban forms. The megaregions in these latter groups that have populations of over 20 million are Dhaka, Shenzhen, and Guangzhou in C-4 and Cairo and Kolkata in B4. In mega-regions in categories 4 (A-4, B-4, C-4) and 3 (A-3, B-3,) populations tend to be divided into both extremes of density. This suggests the possibility of socially divided urban forms, including very high density slum areas and low density gated communities for highincome groups. These mega-regions are located in Asia and the Middle East, with the exception of New York. A high population growth of over 2% annually is expected in these regions during the period , except for the Chinese mega-regions and Istanbul. None of the 11 mega-regions of C-2 contain a dominant megacity, and several urban cores are scattered throughout these regions. Their populations are slightly over 10 million and not yet large in size. However, the population growth of most of these regions is over 2.5%, except for four Chinese regions. This study reveals that the emerging groups C-4, C-2, and B-4 have different urban forms from the mature mega-regions of A-1 and A-2. This suggests that the growing mega-regions of the new generation are unlikely to develop into the mature mega-regions. While the absence of a clear urban core could make it more difficult to elaborate a future vision for urban form, the multi-core structure could potentially lead toward polycentric mega-regions that avoid the problems of enormous single agglomerates. Appropriate urban strategies, different from those of the mature mega-regions, will be required to cope with the accelerated speed of transformation and severely divided societies of emerging mega-regions. 11
12 7. Further Research The categorization of mega-regions developed in this paper reveals that mega-regions with similar populations can have relatively diverse spatial characteristics. As such, it will contribute to coping effectively with urban issues and forecasting the future of mega-regions with regard to their spatial potentiality. This research has focused exclusively on distribution patterns of population on the basis of the premise that this must be closely related to land use patterns, urban fabric patterns, and traffic networks. However, further research that clarifies the relation between population distribution patterns and other spatial attributes will be required for the categorization developed in this paper to be applied to the dynamic observation of the transformation of mega-regions, which will involve monitoring on-going urban policies and managing megaregions strategically beyond physical master plans. Acknowledgements This paper is a part of the project entitled Megacities and the Global Environment, implemented by the Research Institute of Humanity and Nature (RIHN) in Kyoto, Japan. The authors would like to thank the RIHN, Professor Shin Muramatsu (project leader), Mr. Kengo Hayashi (sub-leader), Professor Norihisa Shima, and other project members. Endnote 1. In a former study (Uchiyama & Okabe 2011), we have developed a similar categorization of megacities, adopting a list provided by UN. In this study, we developed a new methodology for more precisely detecting mega-regions in order to improve comparability of spatial form and analyzed the categorized groups by spatial patterns and speed of growth. 2. LandScan 2007 < > accessed on July 9, In a case that two or more peak grids that are more than 50km apart have been detected in an agglomeration of central grids, mega-regions have been identified by each peak grid. For example, in the Pearl River Delta, there is a large agglomeration. It has two peak grids, corresponding to Shenzhen and Guangzhou. According to this definition, the Shenzhen and Guangzhou megaregions are connected and partially overlap. The pair of Jakarta and Bandung (Indonesia) is a similar case. The Muzaffarpur-Patna region and Muzaffarpur-Darbhanga region (India) are also connected to each other. If the circular area within a radius of 50km drawn from the peak grid in an agglomeration that comprises 20 or more central grids does not overlap with the circular area from another peak grid in another agglomeration and, the latter circular area does not have more five million people than the former circular area, the former one is defined as a mega-region. If a small agglomeration, which comprises less than 20 central grids, exists more than 50km away from an agglomeration with 20 or more grids, the circular area around the peak grid in the former small agglomeration is defined as a mega-region. 4. According to UNFPA, half of the world s population is found in urban areas, as of the year (UNFPA 2009) 5. The average estimated growth for Chinese mega-regions for the period is roughly 1.9% per year. Shanghai (A-4) and Beijing (A-1) are estimated to experience lower growth rates of roughly 1.7%. References United Nations Department of Economic and Social Affairs Population Division (2010) World Urbanization Prospects, The 2011 Revision. Sorensen, A. & Okata, J. (eds) (2011) Megacities: Urban Form, Governance and Sustainability, Springer. Camagni, R. & Salone, C. (1993) Network urban structures in northern Italy: Elements for a theoretical framework, Urban Studies, 30(6), pp
13 McGee, T.G. & Robinson, I. M. (1996) The Mega-Urban Regions of Southeast Asia, University of British Columbia Press. Davoudi, S. (2003) Polycentricity in European spatial planning: from an analytical tool to a normative agenda, European Planning Studies, 11(8), pp Susteren, A. (2005) Metropolitan World Atlas, 010 publishers. United Nations Human Settlements Programme (2008) State of the World s Cities 2008/ Harmonious Cities. Burdett, R. & Sudjic, D. (2008) The Endless City, Phaidon Press. Burdett, R. & Sudjic, D. (2011) Living in the Endless City, Phaidon Press. World Bank (2010) Cities and Climate Change: An Urgent Agenda. Tsai, Y. H. (2005) Quantifying urban form: Compactness versus sprawl, Urban Studies, 42(1), pp Cliff, A.D. & Ord, J. K. (1973) Spatial Autocorrelation, Pion. Uchiyama, Y. & Okabe, A. (2011) Study on categorization of megacities by their characteristics of distribution of population Categorization of 35 megacities, Journal of the City Planning Institute of Japan, 46(3), pp , (in Japanese). United Nations Population Fund (2009) State of World Population Facing a changing world: women, population and climate. 13
SDI Developments in the World s Currently Existing Mega Cities
 SDI Developments in the World s Currently Existing Mega Cities Silke Boos and Hartmut Müller FIG Working Week 2009 Surveyors Key Role in Accelerated Development, Eilat, Israel, 3-8 May 2009 TS 1B SDI in
Migration and Urban Decay
 Migration and Urban Decay Asian Experiences Shekhar Mukherji RAWAT PUBLICATIONS Jaipur New Delhi Bangalore Mumbai Contents Preface List of Tables List of Figures ix xv xix Introduction 1 Very Crucial Urban
ia PU BLi s g C o M Pa K T Wa i n CD-1576
 M h M y CD-1576 o M Pa g C n ar ia PU BLi s in K T Wa i n ed National Geography Standards National Geography Standards Teachers leading discussions while completing units and activities is a prerequisite
Operational Definitions of Urban, Rural and Urban Agglomeration for Monitoring Human Settlements
 Operational Definitions of Urban, Rural and Urban Agglomeration for Monitoring Human Settlements By Markandey Rai United Nations Human Settlements Programme PO Box-30030 Nairobi, Kenya Abstract The United
UPSTREAM-DOWNSTREAM CONTAMINATION GRADIENT OF THE FLUVIAL URBAN SYSTEM IN CHENNAI (Tamil Nadu, India)
") UPSTREAM-DOWNSTREAM CONTAMINATION GRADIENT OF THE FLUVIAL URBAN SYSTEM IN CHENNAI (Tamil Nadu, India) Saravanan S.P. a,b, Desmet. M. a, Ambujam N.K. b, Thenmozhi D. b, Manikandabharath K. b, Rukkumany
UPSTREAM-DOWNSTREAM CONTAMINATION GRADIENT OF THE FLUVIAL URBAN SYSTEM IN CHENNAI (Tamil Nadu, India) Saravanan S.P. a,b, Desmet. M. a, Ambujam N.K. b, Thenmozhi D. b, Manikandabharath K. b, Rukkumany
Urbanisation & Economic Geography (2)
") GEOG1101: Introduction to Economic Geography Tuesday 20 October, 2009 Urbanisation & Economic Geography (2) Kevon Rhiney Department of Geography and Geology University of the West Indies, Mona Lecture
GEOG1101: Introduction to Economic Geography Tuesday 20 October, 2009 Urbanisation & Economic Geography (2) Kevon Rhiney Department of Geography and Geology University of the West Indies, Mona Lecture
Developing a global, peoplebased definition of cities and settlements
 Developing a global, peoplebased definition of cities and settlements By Lewis Dijkstra, Lewis.Dijkstra@ec.europa.eu Head of the Economic Analysis Sector DG for Regional and Urban Policy, Regional & Urban
Developing a global, people-based definition of cities and settlements
 Developing a global, people-based definition of cities and settlements Cooperation between: Directorate General for Regional and, Joint Research Centre, EUROSTAT (European Commission, European Union) OECD,
2/25/2019. Taking the northern and southern hemispheres together, on average the world s population lives 24 degrees from the equator.
 Where is the world s population? Roughly 88 percent of the world s population lives in the Northern Hemisphere, with about half north of 27 degrees north Taking the northern and southern hemispheres together,
City definitions. Sara Ben Amer. PhD Student Climate Change and Sustainable Development Group Systems Analysis Division
 City definitions Sara Ben Amer PhD Student Climate Change and Sustainable Development Group Systems Analysis Division sbea@dtu.dk Contents 1. Concept of a city 2. Need for the city definition? 3. Challenges
DEFINING AND MEASURING WORLD-METRO REGIONS FOR INTERNATIONAL COMPARISONS
 DEFINING AND MEASURING WORLD-METRO REGIONS FOR INTERNATIONAL COMPARISONS Mario Piacentini, OECD 27th Scorus Conference, 11-13 August 2010, Latvia Why we need comparable measures of city performance Growing
Urbanization and spatial policies. June 2006 Kyung-Hwan Kim
 Urbanization and spatial policies June 2006 Kyung-Hwan Kim stamitzkim@gmail.com 1 Urbanization Urbanization as a process of development Stages of urbanization Trends of world urbanization Dominance of
Can I have a similar please. Sorry Mister that s the last one
 Can I have a similar please Sorry Mister that s the last one Mega cities 1950 New York London Rhine-Ruhr Moscow Tokyo Shanghai Paris Buenos Aires Mega cities 2015 Population worldwide in cities Tokyo Los
What is a compact city? How could it be measured?
 What is a compact city? How could it be measured? Madhu Singh Transport Planner Directorate of Urban Land Transport, Bangalore Guided By: Professor H. M. Shivanand Swamy CEPT University, Ahmedabad Cities
São Paulo Metropolis and Macrometropolis - territories and dynamics of a recent urban transition
 São Paulo Metropolis and Macrometropolis - territories and dynamics of a recent urban transition Faculty of Architecture and Urbanism of São Paulo University Prof. Dr. Regina M. Prosperi Meyer WC2 - World
Title<Presentations Day1>Comment.
 TitleComment Author(s) OKABE, Akiko CIRAS discussion paper No.81 : Arch Cultures Across Regions --Digital H Citation Towards Knowledge Integration = 地域を計画文化 --デジタル ヒューマニティーズから学知創成へ
Multitemporal RADARSAT 2 Fine Beam Polarimetric SAR for Urban Land Cover Mapping
 Multitemporal RADARSAT 2 Fine Beam Polarimetric SAR for Urban Land Cover Mapping Yifang Ban & Xin Niu KTH Royal Institute of Technology Stockholm, Sweden Introduction Urban represents one of the most dynamic
By Geri Flanary To accompany AP Human Geography: A Study Guide 3 rd edition By Ethel Wood
 Session 1 By Geri Flanary To accompany AP Human Geography: A Study Guide 3 rd edition By Ethel Wood WHAT IS DEMOGRAPHY? It is the scientific or statistical study of population. It comes from the Greek
9/19/2018. Dr. Hoch. RGPL 103 Global Cities: Planning and Development.
 Dr. Hoch RGPL 103 Global Cities: Planning and Development Dr. Hoch Email: rhoch@iup.edu 1 2 Earth s Orbit Around Sun Aphelion July 6 (12:00) Perihelion Jan 3 (00:00) EARTH 152.5 Million Km 147.5 Mil. Km
Global City Definition
 Regional Training Workshop on Human Settlement Indicators Global City Definition Dennis Mwaniki Global Urban Observatory, Research and Capacity Development Branch, UN-Habitat Bangkok, Thailand Outline
Urbanization in Japan since 1960 viewed from the DID Statistics
 Institute of Geography, Asahikawa Campus Hokkaido University of Education Asahikawa, 070-8621, Japan 1. Introduction Urban expansion is one of the most important features of land use/cover changes in the
Spatial Analysis of Population Distribution by Employment Sectors in Tokyo Metropolitan Area
 1 Spatial Analysis of Population Distribution by Employment Sectors in Tokyo Metropolitan Area MONZUR, Tawhid Abstract This research is focused on analyzing the urban spatial structure of the Tokyo metropolitan
Population distribution
 Population distribution Ernesto F. L. Amaral December 5, 2018 Population and Society (SOCI 312) Outline Introduction World population distribution Residential distribution and urbanization Economic distribution
Global Data Catalog initiative Christophe Charpentier ArcGIS Content Product Manager
 Global Data Catalog initiative Christophe Charpentier ArcGIS Content Product Manager ccharpentier@esri.com We are in a global economy Global Economy Business and Operations are now global Strategic need
Hazard and Vulnerability of Moderate Seismicity Regions
 Hazard and Vulnerability of Moderate Seismicity Regions presented by Professor Tso-Chien PAN Dean, College of Engineering Director, 25 October 2010 DRM GDLN Session on Earthquake Vulnerability Reduction
ISTAMBUL April 22, pm
 Global Urban Data Initiative ISTAMBUL April 22, 11-12.30 pm Tokyo Ho Chi Minh Moscow Global Urban Data Initiative Global Urban and DRM Unit LEARN ABOUT: Data Access through PUMA Portal and ESA Urban Thematic
World Bank Group GEF Program
 World Bank Group GEF Program Global Environment Facility: -Transport World Bank GEF Coordination Team Content How does GEF work? World Bank s role in the GEF partnership The GEF transport activities What
Meeting the Challenges of Earthquake Risk Dynamics and Globalisation
 Check Against Delivery. Embargoed until 4:15 PM, 5 November 2010 Meeting the Challenges of Earthquake Risk Dynamics and Globalisation by Jochen Zschau GFZ German Research Centre for Geosciences, Potsdam,
Megalopolis: An Assay for the Identification of the World Urban Mega-structures
 55th Congress Megalopolis: An Assay for the Identification of the World Urban Mega-structures ARELLANO, Blanca & ROCA, Josep blanca.arellano@upc.edu, josep.roca@upc.edu http://www.upc.edu/cpsv/ Lisbon,
Cambridge International Examinations Cambridge International General Certificate of Secondary Education
 Cambridge International Examinations Cambridge International General Certificate of Secondary Education *1869999605* GEOGRAPHY 0460/11 Paper 1 October/November 2017 Candidates answer on the Question Paper.
URBAN CHANGE DETECTION OF LAHORE (PAKISTAN) USING A TIME SERIES OF SATELLITE IMAGES SINCE 1972
 USING A TIME SERIES OF SATELLITE IMAGES SINCE 1972") URBAN CHANGE DETECTION OF LAHORE (PAKISTAN) USING A TIME SERIES OF SATELLITE IMAGES SINCE 1972 Omar Riaz Department of Earth Sciences, University of Sargodha, Sargodha, PAKISTAN. omarriazpk@gmail.com ABSTRACT
URBAN CHANGE DETECTION OF LAHORE (PAKISTAN) USING A TIME SERIES OF SATELLITE IMAGES SINCE 1972 Omar Riaz Department of Earth Sciences, University of Sargodha, Sargodha, PAKISTAN. omarriazpk@gmail.com ABSTRACT
Households or locations? Cities, catchment areas and prosperity in India
 Households or locations? Cities, catchment areas and prosperity in India Yue Li and Martin Rama World Bank July 13, 2015 Motivation and approach (Some) cities are drivers of prosperity in India Because
Motorization in Asia: 14 countries and three metropolitan areas. Metin Senbil COE Researcher COE Seminar
 Motorization in Asia: 14 countries and three metropolitan areas Metin Senbil COE Researcher COE Seminar - 2006.10.20 1 Outline Background Motorization in Asia: 14 countries Kuala Lumpur, Manila, Jabotabek
MULTIPLE CHOICE. Choose the one alternative that best completes the statement or answers the question.
 Exam Name MULTIPLE CHOICE. Choose the one alternative that best completes the statement or answers the question. 1) One important feature of the world's population with the most significant future implications
Cotton Economics Research Institute CERI Outlook Report
 2006 Global Cotton Outlook Cotton Economics Research Institute CERI Outlook Report 06-02 www.ceri.ttu.edu/policy CERI (Policy Modeling Group) Samarendu Mohanty, Associate Professor Suwen Pan, Research
Cities, Countries, and Population
 Cities, Countries, and Population After the world industrialized, better food, improved sanitation, and new medicines caused the world population to soar. To understand how heavily populated an area is,
Improving rural statistics. Defining rural territories and key indicators of rural development
 Improving rural statistics Defining rural territories and key indicators of rural development Improving rural statistics Improving Rural Statistics In 2016, the Global Strategy to improve Agricultural
Historical Assessment of Spatial Growth of Built-ups and Metropolitan areas of Delhi and Mumbai in India and Dhaka in Bangladesh
 Historical Assessment of Spatial Growth of Built-ups and Metropolitan areas of Delhi and Mumbai in India and Dhaka in Bangladesh Tomas Soukup, GISAT World Bank HQ, Washington DC Date : 12 April 2011 Introduction
Reshaping Economic Geography
 Reshaping Economic Geography Three Special Places Tokyo the biggest city in the world 35 million out of 120 million Japanese, packed into 4 percent of Japan s land area USA the most mobile country More
Dar es Salaam - Reality Check Workshop
 Dar es Salaam - Reality Check Workshop hosted by GIZ and Dar es Salaam City Council Introduction: Key Urban Characteristics of Dar es Salaam Challenges and Opportunities for Resilient Development in the
Urban Geography. Unit 7 - Settlement and Urbanization
 Urban Geography Unit 7 - Settlement and Urbanization Unit 7 is a logical extension of the population theme. In their analysis of the distribution of people on the earth s surface, students became aware
Selected Papers from the 2 nd World Forum on China Studies (Abstracts) Panel 12 Shanghai's Development in Multi-scaled Perspectives
 Panel 12 Shanghai's Development in Multi-scaled Perspectives") Shanghai Academy of Social Sciences World Forum on China Studies Selected Papers from the 2 nd World Forum on China Studies (Abstracts) Panel 12 Shanghai's Development in Multi-scaled Perspectives Contents:
Shanghai Academy of Social Sciences World Forum on China Studies Selected Papers from the 2 nd World Forum on China Studies (Abstracts) Panel 12 Shanghai's Development in Multi-scaled Perspectives Contents:
ANALYSING THE DIVERSITY OF DEPRIVED AREAS IN MUMBAI, INDIA
 ANALYSING THE DIVERSITY OF DEPRIVED AREAS IN MUMBAI, INDIA MONIKA KUFFER (M.KUFFER@UTWENTE.NL) KARIN PFEFFER, RICHARD SLIUZAS, ISA BAUD, MARTIN VAN MAARSEVEEN Source: Google Earth CONTENT OF PRESENTATION
Prentice Hall. World Explorer: People, Places, Cultures Grade 7. Oklahoma Priority Academic Student Skills (PASS) for Grade 7 World Geography
 for Grade 7 World Geography") Prentice Hall World Explorer: People, Places, Cultures 2007 Grade 7 C O R R E L A T E D T O for Grade 7 1. Locate, gather, analyze, and apply information from primary and secondary sources. WORLD GEOGRAPHY
Prentice Hall World Explorer: People, Places, Cultures 2007 Grade 7 C O R R E L A T E D T O for Grade 7 1. Locate, gather, analyze, and apply information from primary and secondary sources. WORLD GEOGRAPHY
2. What characteristics of population are important to demography? 3. Describe what overpopulation looks like at a local or regional level.
 Ch. 2: Population Name: Introduction & Case Study (p. 44-47) 1. Why is the study of population so critical? 2. What characteristics of population are important to demography? 3. Describe what overpopulation
Central Valley School District Social Studies Curriculum Map Grade 7. August - September
 August - September Geographical/Historical Skills Identify and analyze timelines. Construct and use cause and effect charts. Differentiate between fact and opinion. Use of word webs, flip charts, outlines
Chapter 10 Human Settlement Geography Book 1 Class 12
 CHAPTER 10 HUMAN SETTLEMENTS 1. RURAL, SUB URBAN AND URBAN SETTLEMENTS: This classification is common worldwide but the criteria differ from country to country. 5. Criteria for classification differs from
GEORGIA CITIES IN EUROPE AND CENTRAL ASIA METHODOLOGY. Public Disclosure Authorized. Public Disclosure Authorized. Public Disclosure Authorized
 Public Disclosure Authorized Public Disclosure Authorized Public Disclosure Authorized Public Disclosure Authorized CITIES IN EUROPE AND CENTRAL ASIA GEORGIA METHODOLOGY This Country Snapshot was produced
22 cities with at least 10 million people See map for cities with red dots
 22 cities with at least 10 million people See map for cities with red dots Seven of these are in LDC s, more in future Fastest growing, high natural increase rates, loss of farming jobs and resulting migration
LEARNING OUTCOMES SST (G1-G12)
") LEARNING OUTCOMES SST (G1-G12) Grade 1 Learning Outcomes Students will be expected to: - demonstrate an understanding of the importance of interactions between people - demonstrate an understanding of
LEARNING OUTCOMES SST (G1-G12) Grade 1 Learning Outcomes Students will be expected to: - demonstrate an understanding of the importance of interactions between people - demonstrate an understanding of
The Spatial Structure of Cities: International Examples of the Interaction of Government, Topography and Markets
 Module 2: Spatial Analysis and Urban Land Planning The Spatial Structure of Cities: International Examples of the Interaction of Government, Topography and Markets Alain Bertaud Urbanist Summary What are
International Journal of Scientific & Engineering Research, Volume 4, Issue 12, December-2013 ISSN
 29 Assessment of Green Space Requirement and Site Analysis in Colombo, Sri Lanka A Remote Sensing and GIS Approach I.P. Senanayake*1, W.D.D.P. Welivitiya1, P.M. Nadeeka1 ABSTRACT - Green space distribution
AP Human Geography Free Response Questions Categorized
 AP Human Geography Free Response Questions Categorized 2002-2010 2. Population (13-17%) 3. Over the past 150 years, Europe has changed from a source to a destination region for international migration.
GLOBAL PERSPECTIVES IN HEALTH Vol. II - Urban Growth and Health - Yola L.G. Verhasselt
 URBAN GROWTH AND HEALTH Yola L.G. Verhasselt Geografisch Instituut, Vrije Universiteit Brussel, Belgium Keywords: Urbanization, city size, urban growth, health, health transition, environment Contents
Cultural Diffusion. AP HG SRMHS Mr. Hensley
 Cultural Diffusion AP HG SRMHS Mr. Hensley Space-time compression: The reduction in time it takes for something to reach another place Because of technology, connections have reduced distance (not literally
TYPES OF GOVERNMENTS
 While the terms country, state, and nation are often used interchangeably, there is a difference. A State (note the capital "S") is a self-governing political entity. The term State can be used interchangeably
Urban Land Growth Mapping of South-East Asia Cities
 Urban Land Growth Mapping of South-East Asia Cities This document represents additional information accompanying the poster ID 1143 in session "Land Posters" Authors: Jan Kolomazník, Václav Stonáček, Tomáš
Chapter 13 Study Guide: Urban Geography Cities in the periphery, Latin America, and Europe
 Chapter 13 Study Guide: Urban Geography Cities in the periphery, Latin America, and Europe Compared to the private automobile, public transportation offers more energy efficiency. Public transit is more
Population And Settlement Part I
 Population And Settlement Part I 0011 0010 1010 1101 0001 0100 1011 4 12 Think of the earth as a living organism that is being attacked by billions of bacteria whose numbers double every forty years. Either
SDG s and the role of Earth Observation
 SDG s and the role of Earth Observation Christian Heipke IPI - Institute for Photogrammetry and GeoInformation Leibniz Universität Hannover Germany Secretary General, ISPRS 1. No Poverty 2. Zero Hunger
Module 3 Indicator Land Consumption Rate to Population Growth Rate
 Regional Training Workshop on Human Settlement Indicators Module 3 Indicator 11.3.1 Land Consumption Rate to Population Growth Rate Dennis Mwaniki Global Urban Observatory, Research and Capacity Development
GCSE 4231/01 GEOGRAPHY (Specification A) FOUNDATION TIER UNIT 1: Core Geography
 FOUNDATION TIER UNIT 1: Core Geography") Surname Centre Number Candidate Number Other Names 0 GCSE 4231/01 GEOGRAPHY (Specification A) FOUNDATION TIER UNIT 1: Core Geography S16-4231-01 P.M. TUESDAY, 24 May 2016 1 hour 45 minutes For s use Question
Surname Centre Number Candidate Number Other Names 0 GCSE 4231/01 GEOGRAPHY (Specification A) FOUNDATION TIER UNIT 1: Core Geography S16-4231-01 P.M. TUESDAY, 24 May 2016 1 hour 45 minutes For s use Question
Urban Expansion. Urban Expansion: a global phenomenon with local causes? Stephen Sheppard Williams College
 Urban Expansion: a global phenomenon with local causes? Stephen Sheppard Williams College Presentation for World Bank, April 30, 2007 Presentations and papers available at http://www.williams.edu/economics/urbangrowth/homepage.htm
Spatiotemporal Analysis of Noida, Greater Noida and Surrounding Areas (India) Using Remote Sensing and GIS Approaches
 Using Remote Sensing and GIS Approaches") Spatiotemporal Analysis of Noida, Greater Noida and Surrounding Areas (India) Using Remote Sensing and GIS Approaches Gopal Krishna* Indian Agricultural Research Institute, New Delhi, India ABSTRACT Spatiotemporal
Spatiotemporal Analysis of Noida, Greater Noida and Surrounding Areas (India) Using Remote Sensing and GIS Approaches Gopal Krishna* Indian Agricultural Research Institute, New Delhi, India ABSTRACT Spatiotemporal
Latitude & Longitude. Worksheets & activities to teach latitude & longitude. Includes notes, activities, review & all answer keys. 11 pages!
 Latitude & Longitude Worksheets & activities to teach latitude & longitude. Includes notes, activities, review & all answer keys. 11 pages! Lines of Latitude & Longitude Name: Lines of latitude and longitude
Geography. Total marks 100. Section I Pages marks Attempt Questions 1 15 Allow about 25 minutes for this section
 2006 HIGHER SCHOOL CERTIFICATE EXAMINATION Geography Total marks 100 General Instructions Reading time 5 minutes Working time 3 hours Write using black or blue pen Board-approved calculators may be used
INTERNATIONAL JOURNAL OF GEOMATICS AND GEOSCIENCES Volume 7, No 1, 2016
 INTERNATIONAL JOURNAL OF GEOMATICS AND GEOSCIENCES Volume 7, No 1, 2016 Copyright by the authors - Licensee IPA- Under Creative Commons license 3.0 Research article ISSN 0976 4380 Urban sprawl and urban
Figure 10. Travel time accessibility for heavy trucks
 Figure 10. Travel time accessibility for heavy trucks Heavy truck travel time from Rotterdam to each European cities respecting the prescribed speed in France on the different networks - Road, motorway
What on Earth is Geography? Using the Five Themes of Geography to Study the Continent of Asia.
 What on Earth is Geography? Using the Five Themes of Geography to Study the Continent of Asia. Name Date Essential questions: 1. How can we study the geography of our Earth? a. What are the five themes
ANALYZING CITIES & POPULATION: POPULATION GEOGRAPHY
 ANALYZING CITIES & POPULATION: POPULATION GEOGRAPHY Population Geography Population Geography study of the number, contribution, and distribution of human populations Demography the study of the characteristics
Urban Integrated Services and Multi-Hazard Early Warning Systems
 WMO for UN New Urban Agenda Urban Integrated Services and Multi-Hazard Early Warning Systems Gregory R. Carmichael WMO WMO Priority: Urbanization - Research and services for megacities and large urban
Proposal for International Workshop on Defining and Measuring Metropolitan Regions. II. Definition and Measurement of Metropolitan Area in Japan
 November 20, 2006 Proposal for International Workshop on Defining and Measuring Metropolitan Regions Japanese Government I. Introduction II. Definition and Measurement of Metropolitan Area in
1 Study the map of Cornwall below. Answer the question that follows.
 Distance and direction 1 Study the map of Cornwall below. Answer the question that follows. five statements that are correct. Lanreath is about 22 km from Plymouth Lanreath is about 28 km from Plymouth
ESPON evidence on European cities and metropolitan areas
 BEST METROPOLISES Final Conference 18 April 2013, Warsaw ESPON evidence on European cities and metropolitan areas Michaela Gensheimer Structure of Intervention Content Part I: What is the ESPON 2013 Programme?
Defining KBD and KCities
 Defining KBD and KCities Francisco Javier Carrillo World Capital Institute and Center for Knowledge Systems fjcarrillo@itesm.mx Contents Demarcation and units of analysis Synthetic demarcation Analytic
UN-GGIM: An Overview Stefan Schweinfest, Director (UNSD) Bangkok, 27 March 2015
 Bangkok, 27 March 2015") UN-GGIM: An Overview Stefan Schweinfest, Director (UNSD) Bangkok, 27 March 2015 ggim.un.org UN-GGIM: A global initiative Formal inter-governmental UN Committee of Experts to: Discuss, enhance and coordinate
UN-GGIM: An Overview Stefan Schweinfest, Director (UNSD) Bangkok, 27 March 2015 ggim.un.org UN-GGIM: A global initiative Formal inter-governmental UN Committee of Experts to: Discuss, enhance and coordinate
Important Developments in International Coke Markets
 Important Developments in International Coke Markets Andrew Jones Resource-Net South Africa China Coke Market Congress Xuzhou, Jiangsu September 2018 Introduction to Presentation Resource-Net produces
Ch. 13: Urban Patterns
 Ch. 13: Urban Patterns Name: Introduction & Case Study (p. 430-432) 1. Describe some differences between urban and rural environments. 2. Why do MDCs have a higher percentage of people living in urban
Land Use Change Patterns and Sustainable Urban Development in China
 Land Use Change Patterns and Sustainable Urban Development in China Haiyan Zhang* 1, Michinori Uwasu 2, Keishiro Hara 3 and Helmut Yabar 2 1 Research Fellow, Research Institute for Sustainability Science,
Spatial Analysis and Modeling of Urban Land Use Changes in Lusaka, Zambia: A Case Study of a Rapidly Urbanizing Sub- Saharan African City
 Spatial Analysis and Modeling of Urban Land Use Changes in Lusaka, Zambia: A Case Study of a Rapidly Urbanizing Sub- Saharan African City January 2018 Matamyo SIMWANDA Spatial Analysis and Modeling of
Urban Economics SOSE 2009
 Urban Economics SOSE 2009 Urban Economics SOSE 2009 The course will be part of VWL-B (together with the course: Unternehmen in einer globalisierten Umwelt) There will be a 90-minute final exam Urban Economics
Deborah Balk 1,2 Gordon McGranahan 3 Bridget Anderson 2
 Preference and Risks of Coastal Population Distribution: A systematic assessment of population and land area in urban and rural areas of coastal zones. Deborah Balk 1,2 Gordon McGranahan 3 Bridget Anderson
AP Human Geography Free-response Questions
 AP Human Geography Free-response Questions 2000-2010 2000-preliminary test 1. A student concludes from maps of world languages and religions that Western Europe has greater cultural diversity than the
January 2018 Special Preview Edition
 January 2018 Special Preview Edition What s inside this booklet? The contents you ll explore 2 Americas 4 Europe 6 Far East & Oceania 8 Central & South Asia 10 Africa & Middle East 12 International 14
Phase 1 Cards. Phase 1. Phase 1. How many picnic areas does the park have? Write the answer near the legend.
 S T U D E N T H A N D O U T F Cards Write the map s title in the northwest corner above the map. How many picnic areas does the park have? Write the answer near the legend. 1 2 Draw a compass rose near
Proposed AKS for 6 th Grade Social Studies
 Proposed AKS for 6 th Grade Social Studies A. Map and Globe Skills 1. use cardinal directions 2. use intermediate directions 3. use a letter/number grid system to determine location 4. compare and contrast
Population Density and Growth. Distribution of people on Earth
 Population Density and Growth Distribution of people on Earth Population Density! Terminology!! Population density is a measure of how compact or concentrated a population is. It takes area of land into
DEPARTMENT OF GLOBAL STUDIES AND GEOGRAPHY COURSES OFFERED - SPRING 17 SEMESTER GEOGRAPHY
 DEPARTMENT OF GLOBAL STUDIES AND GEOGRAPHY COURSES OFFERED - SPRING 17 SEMESTER What Should You Take First? GEOGRAPHY Besides our Senior Seminars (and Geog 160), our classes can be taken at any time, whether
Year 34 B2 Geography - Continents and Oceans 2018 Key Skills to be covered: Taken from Level 3 Taken from Level 4
 Key Skills to be covered: Taken from Level 3 Taken from Level 4 Geographical Enquiry: I ask, Which PHYSICAL features does this place have? I ask, Which HUMAN features does this place have? I give reasons
Urbanisation Dynamics in West Africa AFRICAPOLIS I, 2015 UPDATE
 Public Disclosure Authorized Public Disclosure Authorized Urbanisation Dynamics in West Africa 1950 2010 AFRICAPOLIS I, 2015 UPDATE uy François Moriconi-Ebrard, Dominique Harre, Philipp Heinrigs Washington
The European Commission s science and knowledge service. Joint Research Centre
 The European Commission s science and knowledge service Joint Research Centre Global Urbanisation Pattern observed with EO data Thomas Kemper & GHSL team Urban Studies Symposium, University of Twente,
Vincent Goodstadt. Head of European Affairs METREX European Network
 Vincent Goodstadt Head of European Affairs METREX European Network METREX (Network of 50 European Metropolitan Regions and Areas ) Exchanging Knowledge (e.g. Benchmarking) Climate Change CO2/80/50 Expertise
LandScan Global Population Database
 LandScan Global Population Database The World s Finest Population Distribution Data Uncommon information. Extraordinary places. LandScan Global Population Database East View Cartographic is now offering
Urban Climate Resilience
 Urban Climate Resilience in Southeast Asia Partnership Project Introduction Planning for climate change is a daunting challenge for governments in the Mekong Region. Limited capacity at the municipal level,
September 14, 2013 Objective: How does geography impact history? What important features exist that have shaped societies?
 Lowenhaupt 1 September 14, 2013 Objective: How does geography impact history? What important features exist that have shaped societies? Warm-Up: In your binder, answer the following question: Imagine you
Daylight, Latitude, and Traditional Japanese Clocks
 The School and University Partnership for Educational Renewal in Mathematics An NSF-funded Graduate STEM Fellows in K 12 Education Project University of Hawai i at Manoa, Department of Mathematics Daylight,
2012 Global Cities Index and Emerging Cities Outlook
 2012 Global Cities Index and Emerging Cities Outlook New York, London, Paris, and Tokyo remain today s leading cities, but an analysis of key trends in emerging cities suggests that Beijing and Shanghai
Student Handout. Write the map s title in the northwest corner of the map. How many picnic areas does the park have? Write the answer near the legend.
 Student Handout 1F Cards Write the map s title in the northwest corner of the map. How many picnic areas does the park have? Write the answer near the legend. 1 2 Draw a compass rose near the west edge
Spatio-temporal dynamics of the urban fringe landscapes
 Spatio-temporal dynamics of the urban fringe landscapes Yulia Grinblat 1, 2 1 The Porter School of Environmental Studies, Tel Aviv University 2 Department of Geography and Human Environment, Tel Aviv University
10.2 Fitting a Linear Model to Data
 Name Class Date 10.2 Fitting a Linear Model to Data Essential Question: How can you use the linear regression function on a graphing calculator to find the line of best fit for a two-variable data set?