Preliminary Site Selection of Pumped Storage Hydropower Plants - A GIS-based approach
|
|
|
- Philip Jackson
- 6 years ago
- Views:
Transcription
1 Preliminary Site Selection of Pumped Storage Hydropower Plants - A GIS-based approach Hassan Ahmadi i, Abolfazl Shamsai ii ABSTRACT The first stage in development and design of Pumped Storage Hydropower Plants (PSHP) is finding the optimum location. This paper presents a methodology for preliminary site selection of PSHP with the help of geospatial data analysis in a Geographic Information System (GIS) environment. The conventional method of PSHP site selection has certain limitations and is not cost and time effective. The volume of data and the criteria for the site selection of PSHP causes a lot of difficulties for decision making. However, with the help of GIS as an information technology and with its analytical ability for decision making optimization, we can overcome these difficulties. Every criterion in a GIS can be illustrated as a separate data layer and site selection can be done according to the defined criteria. Overlay is one of the spatial functions that can combine spatial data layers from different sources for the site selection applications. In the process of site selection of suitable PSHP, various factors with different importance are considered.the Zayanderud pumped storage hydropower has been investigated as a case study. Suitable sites were identified based on spatial analysis in GIS environment. The Zayanderud PSHP is located in a dry and hot zone in central Iran and uses the existing Zayanderud dam lake as the lower reservoir. During this study, sites for upper reservoir location have been defined according to the artificial upper reservoir on the bank of the zayanderud reservoir. In this case study, at first, effective criteria for PSHP site location and corresponsive data layers have been defined. Then, data layers have been classified and prepared with respect to main criteria. Finally, results of overlay have been evaluated. The main factors used in PSHP site selection process were; development pattern (using existing lake, rivers, sea, natural and artificial pools, etc. as upper or lower reservoirs), head, conveyance length-head ratio, slope, power grid situation, roads accessibility, geology and other technical points of view. The above mentioned factors were entered in GIS as data layers. Results of this investigation indicate that by using GIS, more suitable sites can be selected and verified and the feasibility study process can be done in more precise manner. This method can save more time and cost compared to the conventional approach. KEYWORDS: Hydropower, Pumped Storage, Site Selection, Geographic Information System (GIS), Zayanderud 1. INTRODUCTION Hydropower is one of the most renewable, nonradioactive and non-polluting sources of energy. Construction of Pumped Storage Hydropower Plants (PSHP) is one type of hydropower developments. PSHP developments are energy storing systems. Water is pumped from a lower reservoir to a higher one, utilizing low-cost dump power produced during periods of low demand by power plant which can be operated economically at a constant load. The water in higher reservoir is then released through turbines to produce power needed during periods of peak demand. Although there is a net energy loss in the system because more energy is expended in pumping than can be produced by the turbines, the relative monetary value of peak power compared to dump power makes pumped storage projects economically feasible. The most important step in the development of a PSHP is the site selection by preliminary area screening and the evaluation of their suitability according to relevant criteria, engineering design and costs. This process is difficult and complex because it requires working with large amounts of spatial data with regard to various rules and constraints. There are immense data volume and some criteria for the site selection of PSHP that cause much more problem for decision making. It is possible conventional method omit several regions which are not accessible or visitable. Geographic Information Systems (GIS) have been used i Corresponding Author, H. Ahmadi is with the Department of Civil Engineering, Rudhen Azad University, Tehran, Iran ( Ahmadiguil@yahoo.com). ii A. Shamsae is with the Department of Civil Engineering, Sharif University of technology, Tehran, Iran ( Shamsai@sharif.edu). 5
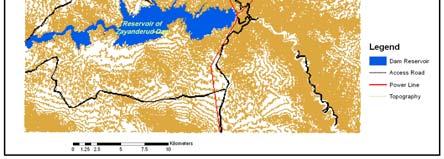
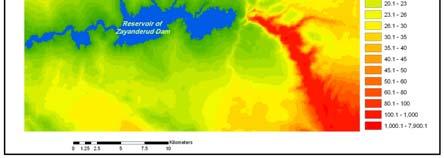
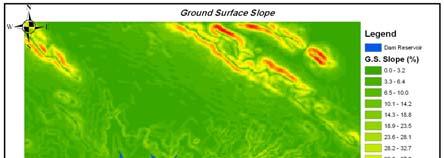
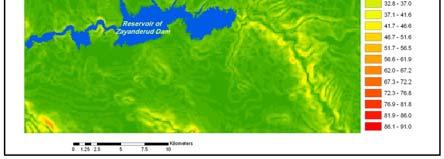
2 as an important programming tool for enhanced spatial visualization and data analysis. The use of a GIS for selection of sites for PSHP would be of help in finding more appropriate sites. The inclusion of a GIS site suitability analysis into the PSHP site selection process, would allow selected sites to be evaluated based on the same criteria. Furthermore, a GIS would supply a standardized tool for evaluating selected sites. All sites would be weighted against the same criteria and subjectivity judgments would be eliminated from the process. GIS procedure is helpful in managing the complex theme of landscape mapping and, as a result, the land-use scheming decisions are made more efficiently. In this paper, GIS have been used in selection of sites for PSHP to illustrate GIS as an applicable complement to support the decision made and to investigate its applicability in the PSHP site selection. Some researchers used geographic information and decision support systems for locating potential landfill sites (Dikshit et al., Lukasheh et al., Kao et al. and Daneshvar et al.). Ramachandra et al. assess micro, mini and small hydropower potential using spatial decision support system in GIS environment. PSHP have a more criteria and undefined pattern as compared to mini hydropower plants and landfill sites. In the proposed method, the existing maps are used to develop GIS database for selection of site, digital terrain model data (DTM), transmission line network and access road. With the help of GIS as an information technology and effective spatial analysis tool, site selection of PSHP will be done more accurately.. STUDY AREA The Zayanderud PSHP have been investigated as a case study. The Zayanderud river basin, with a total area of 41,54 km, is located in a dry and hot zone in central Iran. The river stretches over a distance of 355 km and passes through the historic city of Isfahan. The multipurpose Zayanderud dam was constructed in 1970, 110 km west of Isfahan (about 3 km from Chadegan city). Table 1 shows characteristics of Zayanderud dam. Zayanderud PSHP would use the existing Zayanderud dam as the lower reservoir. Our aim is to find alternatives for artificial upper reservoir on the bank of the Zayanderud dam reservoir. Geology of this area consists of 38 different classes of lithology; from nummulitic limestone as the best lithology to young terraces as the worst one. TABLE 1:CHARACTERISTICS OF ZAYANDERUD DAM. River Zayanderud Near city 3 km from Chadegan Type of dam Concrete arch dam Type of spillway Gated Construction period Height 100 m Crest length 450 m Spillway discharge capacity 1880 m 3 /s Effective capacity 140 *10 6 m 3 Regulated annual water 100 *10 6 m METHODOLOGY A GIS analysis has been done to select sites for PSHP. The analysis consists of four part processes, including the following steps: - Definitions of PSHP site selection criteria. - Preparation of spatial data and the corresponding layer representing each criterion. - Preparation of an analysis model. - Selection of sites for PSHP and definition of site suitability. A. Definitions of PSHP site selection criteria PSHP site selection criteria are listed based on the economical and technical considerations. The PSHP site selection criteria include: 1. Being located near a power grid situation; Produced power would be transmitted to continued power gird, so it is important that alternatives to power grid situation are located nearby.. Being located near an access road; Easy access to PSHP sites is required for construction, operation, etc., so it is important alternatives are close to an access road. 3. Having suitable geological condition; it is necessary to provide the required volume for upper reservoir, construct underground waterway (tunnel & shaft) and operation rooms, so it is important to have favorable geological conditions. 4. Having more head; The amount of energy produced depends on head and discharge. Produced energy can be increased with an increase in head or discharge. Head comes from topography and increasing of head is more economical, so we should try to find alternatives with more head. We can produce predefined constant energy with decreasing discharge, if net head increased. 5. Having less conveyance length-head ratio; With an increase in head, conveyance length increases too. It is an advantage when waterway length is less in a constant head. An alternative will be more economical when conveyance length head ratio decreases. 6. Having a mild slope of natural ground surface; for construction of upper reservoir, it is necessary to make an artificial reservoir. When the ground surface is flat, cut and fill costs for artificial reservoir construction decreases. So it is an advantage for PSHP site selection when slope of natural ground surface is mild (e.g., slope < 10%). B. GIS analysis model GIS analysis model combines geographic data together with site selection criteria to recognize PSHP sites. A suitability analysis model (Fig. 1) was created using ArcGIS9.0 in which the data sets were managed, as follows, to provide final suitability maps: 1. Data preparation. Conversion of data to raster 3. Determining the distance to power line, road and dam reservoir.
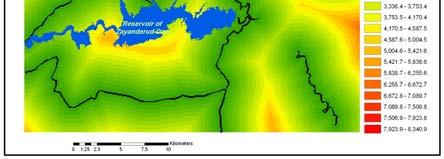
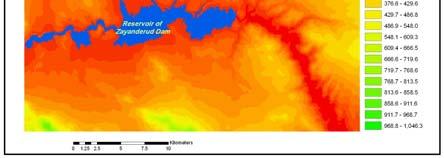
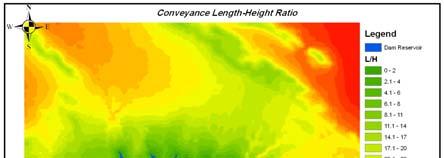
3 4. Determining the head of PSHP, conveyance lengthhead ratio and slope of ground surface. 5. Classification of geology based on their suitability. 6. Reclassification and assignment of suitability rank values to each criteria (distance to power line, distance to road, head, conveyance length-head ratio and ground surface slope). 7. Data weighting based on their significance in PSHP site selection. 8. Ranking and weighting of the overlay criteria to produce final suitability and preference maps. I) Data preparation Spatial data from the regions of Zayanderud dam was collected. These maps consist of region topography, power transmission line and access road distribution (Fig.). II) Conversion of data to raster For spatial analysis, the initial data converted to Raster type. This conversion has been done using Arctoolbox (an ability of ArcGIS9.0). Fig. 3 shows converted topography to raster. III) Determining the distance to power line, road and dam reservoir. Using spatial raster analysis tools, the distance to power line, road and dam reservoir are evaluated. Fig. 4, 5 and 6 show the result of these data analysis. IV) Determining the head of PSHP, conveyance length - head ratio and slope of ground surface. Using spatial raster analysis tools, the head of PSHP, conveyance length-head ratio and slope of ground surface are computed. The head of hydropower in any place equals the difference of minimum water level and the cell elevation, as in (1). Conveyance length is minimum distance of any cell from dam reservoir, as in (). Slope identifies the maximum rate of change in value from each cell to its neighbors, as in (3). H = El. MinW.. L. (1) L = i ( xi xr ) + ( yi yr S = ( dz / dx) + ( dz / dy) (3) where H : Head of PSHP (meter), El. i : Cell elevation (meter), Min. W. L. = Minimum water elevation (meter), L : Conveyance system length (meter), x i, yi : Cell coordinates, x, y R R : Coordinates of reservoir point with minimum distance from cell, S : Ground surface slope (percent), dx, dy, dz : difference of x, y and z values between a cell and its neighbors. Fig. 7, 8 and 9 show the results of mentioned spatial data analysis. ) () Figure1: GIS analysis model for PSHP site selection. 7
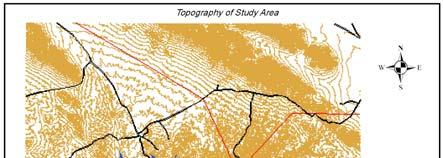
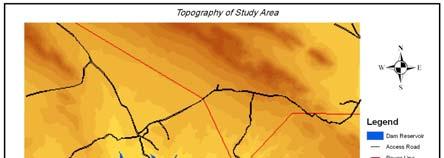
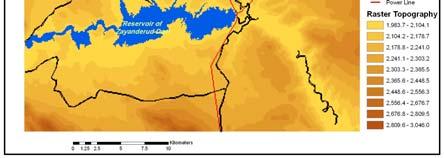
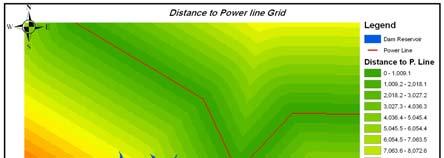
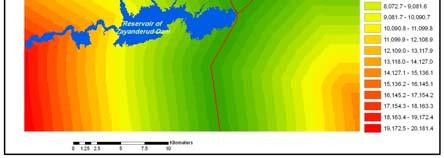
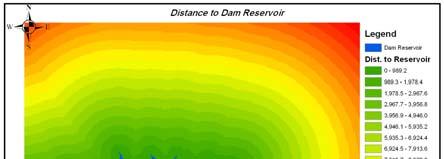
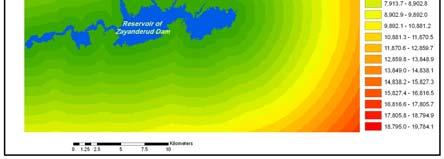
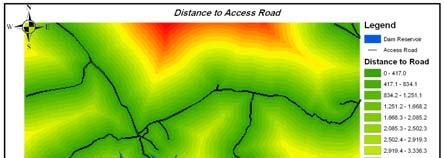
4 Figure : Topography of study area. Figure 6: Distance to access road. Figure 3: Raster topography. Figure 7: Head of hydropower. Figure 4: Distance to power transmission line. Figure 8: Conveyance length-head ratio. Figure 5: Distance to dam reservoir. Figure 9: Ground surface slope. 8


 Reclassification and assignment of suitability rank")


, was used to assign rank")
![values (V) to each class [1].](/docs-images/78/78220417/images/5-10.jpg "V = 100 5( n 1) (4) where n refers to category numbers,")

5 V) Classification of geology based on their suitability. The classification of geology was based on personal judgment of two expert geologists. In these regions, 38 different classes of lithology were defined (Fig. 10). The various lithologies were ranked from 5-100, with 100 being the best class and 5 being the worst class (Fig.11). Figure 1: Ranked head of hydropower. Figure 10: Geology of study area. Figure 13: Ranked distance to power line. Figure 11: Ranked geology of study area. VI) Reclassification and assignment of suitability rank values to each criterion To classify other criteria, the model divides areas into twenty categories. The categories each were assigned a category value (V) from 5-100, with 100 being the best class and 5 being the worst class. A linear function, as in (4), was used to assign rank values (V) to each class [1]. V = 100 5( n 1) (4) where n refers to category numbers, from 1 to 0, when 1 is assign to the best category and 0 to the worst. This classification was repeated by the model for classification of the distance to power line, distance to road, head, conveyance length-head ratio and ground surface slope (Fig. 1, 13, 14 and 15). Figure 14: Ranked distance to access road. Figure 15: Ranked ground surface slope. 9


6 VII) Data weighting based on their significance in PSHP site selection. Several criteria were used to select suitable sites. The effect of these criteria in PSHP site selection is not equal, so the various ranked data have been weighted and used for site selection. The weight of each factor indicates amount of its cost and value as comparing with the other factors. Correct weights can help finding convenient location for PSHP. Data weighting has been done using Knowledge Driven Weighting method. In this method, data are weighted in a definite range using expert experience about application. First, different ideas are collected and their dimensions are uniformed. Then, weights are normalized in the defined range using an appropriate scale. The weights of all criteria have been presented in Table. These weights have been used in the analysis. TABLE WEIGHT OF CRITERIA. 30 Criterion Number Criteria Weight (%) 1 Being located near a power grid situation 10 Being located near an access road 10 3 Having suitable geological condition 5 4 Having more head 15 5 Having less conveyance length-head ratio 5 6 Having a mild slope of natural ground surface 15 VIII) Ranking and weighting of the overlay criteria to produce final suitability and priority maps. The final step in the GIS analysis model is summing up the six ranked criteria to determine the total suitability value of any region. The overlay function calculates the values across each region, resulting in a single priority or suitability number for each site. Final average priority and suitability rank values are divided into 0 categories to identify areas most suitable for PSHP. The final suitability and priority maps are presented in Fig. 16. This map presents the overall suitability values for potential PSHP sites and identified areas with suitability rank values ranging from In this scale, a value of 100 indicates that a site is most suitable for PSHP and it means that the site met all of the criteria to a good extent. A value 0 indicates that a site is not suitable and did not meet any of the PSHP site selection criteria. This map shows overall suitability for PSHP regions ranged from 3.0 to 84.8, indicating that no sites fully matched all criteria. PSHP sites that received more than 80% of the possible 100-point suitability value were recommended to be included in PSHP list of selected sites. The sites with suitability value more than 80 have been shown in Fig. 16 with black color. Based on Fig.16, it is identified that suitable regions are located near to dam position in the right and left bank that have been called ZPR (right bank region) and ZPL (left bank region). They are potential areas that decision must be made on them based on their priority. Table 3 shows the characteristics of these suitable sites. TABLE 3 CHARACTERISTICS OF POTENTIAL SITES. ZPR ZPL Area - Km Heat of PSHP (H) - meter 110~ ~00 Length of conveyance system 00~ ~1000 (L) - meter L/H ~6.5 ~5 Slope of ground surface (S) - % 5~15 5~0 Geology (Lithology) Rhyolite Rhyolite Bazalt dolerite Distance to access road - meter 0~150 0~150 Distance to power line grid - meter 0~1000 0~1000 Presented results in Table 3 show ZPL Site has better economic and facilities conditions than ZPR site, because ZPL Site has more head and less conveyance length-head ratio. Therefore, ZPL site is proposed as an optimum region for upper artificial reservoir construction. Figure 16: Final Suitability Map. Fig. 17 shows the result of PSHP site selection using conventional method [9]. The selected site located in left bank of dam reservoir about kilometers from dam position. The mentioned site has been located in ZPL region. Perhaps ZPR rejected with more studies, site visit and other problems.

7 4. DISCUSSION The GIS suitability analysis-model approach to PSHP site selection and prioritization (demonstrated in this paper) can act as a complement to conventional decision making procedures to create a comprehensive site selection and prioritization process and serve as a useful tool for improving the current consensus in site selection approaches. This method can incorporate all criteria for selecting and prioritizing sites into the priority list. It can identify remote areas of critical ecological importance that may be overlooked by the conventional decision approaches. Figure 17: Selected site Conventional method. To incorporate GIS into the conventional PSHP site selection processes, spatial data availability for PSHP must be considered. For many of the PSHP criteria, spatial datasets for PSHP site selection might be nonexistent, incomplete, or unavailable for interagency or public distribution, for example: land ownership and managed areas. Spatial data from different organizations must be put together to create complete datasets. The difficulty in accumulation of data is the result of limited accessibility to the data available among different organizations. The use of a GIS to select PSHP sites requires specific standardized criteria to be set. A system must be designed so that all selected sites are measured against the same standards and criteria. Small changes in parameters such as criterion weight can meaningfully change the results of the analysis. The PSHP Site List could serve as a useful tool, with flexibility to shift priorities as new sites are added and updated data is collected. As previously discussed, the use of a GIS to select sites for PSHP requires complete and up-to-date spatial data for the study area to produce the most reliable results. Given the constraints of limited data availability and use of non-standardized criteria, The GIS analysis demonstrated in this study, accurately selected suitable PSHP sites. The GIS analysis has laid the basis for further studies of these sites. Information about these sites collected from site visits would complete this study and approve or reject the conclusion that these sites should be added to the preference list. 5. CONCLUSIONS PSHP site selection is one of the development goals that is very important for each country hydropower development. In order to obtain a clearer estimate of the degree of potential power that can be feasibly developed to determine which sites are feasible and to rank their priority, it is necessary to intersect the locations of potential with context parameters that demonstrate their feasibility for development. All the data presented in this paper are geo-referenced; therefore using GIS tools are very important and would affect the result of our investigation. Through development of a GIS and various GIS analysis of PSHP sites, we selected a study area for deployment of a PSHP at the center of Iran which is located in the Zayanderud reservoir banks. Several criteria were defined for the site selection process. A GIS model was created and by executing the model, the optimum location for PSHP construction was located. In this case study, we tried to prove that GIS, by successfully running and implementing PSHP site selection models, is capable of acting as an efficient decision making tool for PSHP site selection. GIS technique is found to be suitable and time and cost effective for the identification of PSHP development sources, mapping suitable sites and ranking of the hydropower projects. Integrating GIS with conventional planning would prove beneficial to the PSHP site selection procedures. Additionally, site selection will be done in the same manner and based on the same criteria for all of regions and the effect of Personal and subjective judgments will decrease. It should be noted that implementation of a GISbased approach to PSHP site selection would require collecting spatial data for the region and developing standardized criteria for selection of PSHP sites. 6. REFERENCES [1] A.K. Dikshit, T. Padmavathi, R.K. Das, Locating potential landfill sites using geographic information systems, Journal of Environmental Systems, vol. 8, no. 1, pp , 001. [] A. Lukasheh, R. Droste, M. Warith, Review of Expert System (ES), Geographic Information System (GIS), Decision Support System (DSS) and their application in landfill design and management, Waste Management and Research, vol.19, no., pp ,
8 [3] B. Paul, GIS Fundamentals: A First Text on Geographic Information systems, White Bear Lake, Eider Press, 00, 41 p. [4] G. Lyon, GIS for Water Resources and Watershed Management, CRC PRESS Publication, 003, 66 p. [5] J. Kao, H. Lin, W. Chen, Network Geographic Information System for landfill siting, Waste Management and Research, vol. 15,Issue: 3, pp 39-53, 1997 [6] R. Daneshvar, M. Warith, and B. Daneshfar, Customizing ArcMap Interface to Generate a User-Friendly Landfill Site Selection GIS Tool, Environmental Informatics Archives, Volume 1, pp , 003. [7] T.H. Douglas, Pumped storage, Thomas Telford Publication, 1990, 449p. [8] T.V. Ramachandra, R. Kumar Jha, S.V. Krishna and B.V. Shruthi, Spatial Decision Support System for Assessing Micro, Mini and Small Hydel Potential, Journal of Applied Sciences, Vol. 4 (4), pp , 004. [9] Iran water and power resources development Co., "Feasibility study of pumped storage hydropower plant in Isfahan electricity region",
Abstract: Contents. Literature review. 2 Methodology.. 2 Applications, results and discussion.. 2 Conclusions 12. Introduction
 Abstract: Landfill is one of the primary methods for municipal solid waste disposal. In order to reduce the environmental damage and to protect the public health and welfare, choosing the site for landfill
Summary Description Municipality of Anchorage. Anchorage Coastal Resource Atlas Project
 Summary Description Municipality of Anchorage Anchorage Coastal Resource Atlas Project By: Thede Tobish, MOA Planner; and Charlie Barnwell, MOA GIS Manager Introduction Local governments often struggle
GRAPEVINE LAKE MODELING & WATERSHED CHARACTERISTICS
 GRAPEVINE LAKE MODELING & WATERSHED CHARACTERISTICS Photo Credit: Lake Grapevine Boat Ramps Nash Mock GIS in Water Resources Fall 2016 Table of Contents Figures and Tables... 2 Introduction... 3 Objectives...
Geo-spatial Analysis for Prediction of River Floods
 Geo-spatial Analysis for Prediction of River Floods Abstract. Due to the serious climate change, severe weather conditions constantly change the environment s phenomena. Floods turned out to be one of
THE 3D SIMULATION INFORMATION SYSTEM FOR ASSESSING THE FLOODING LOST IN KEELUNG RIVER BASIN
 THE 3D SIMULATION INFORMATION SYSTEM FOR ASSESSING THE FLOODING LOST IN KEELUNG RIVER BASIN Kuo-Chung Wen *, Tsung-Hsing Huang ** * Associate Professor, Chinese Culture University, Taipei **Master, Chinese
GIS application in locating suitable sites for solid waste landfills
 GIS application in locating suitable sites for solid waste landfills Jayawickrama, N. T. and Weerasinghe, V. P. A Abstract In Sri Lanka solid wastes are haphazardly dumped in unsuitable locations frequently.
VILLAGE INFORMATION SYSTEM (V.I.S) FOR WATERSHED MANAGEMENT IN THE NORTH AHMADNAGAR DISTRICT, MAHARASHTRA
 FOR WATERSHED MANAGEMENT IN THE NORTH AHMADNAGAR DISTRICT, MAHARASHTRA") VILLAGE INFORMATION SYSTEM (V.I.S) FOR WATERSHED MANAGEMENT IN THE NORTH AHMADNAGAR DISTRICT, MAHARASHTRA Abstract: The drought prone zone in the Western Maharashtra is not in position to achieve the agricultural
VILLAGE INFORMATION SYSTEM (V.I.S) FOR WATERSHED MANAGEMENT IN THE NORTH AHMADNAGAR DISTRICT, MAHARASHTRA Abstract: The drought prone zone in the Western Maharashtra is not in position to achieve the agricultural
4. GIS Implementation of the TxDOT Hydrology Extensions
 4. GIS Implementation of the TxDOT Hydrology Extensions A Geographic Information System (GIS) is a computer-assisted system for the capture, storage, retrieval, analysis and display of spatial data. It
Envrionmental impact assessment of urban development plan by vulnerability model application
 International Journal of Environmental Science & Technology Vol., No., pp. 7-, Spring Environmental impact assessment Envrionmental impact assessment of urban development plan by vulnerability model application
GIS and Siting Renewable Energy
 Kristina DiSanto December 6, 2011 NRS 509 GIS and Siting Renewable Energy With our nation s increasing use of technology, expanding industrialization and urbanization to meet our demands for goods and
Land Use of the Geographical Information System (GIS) and Mathematical Models in Planning Urban Parks & Green Spaces
 and Mathematical Models in Planning Urban Parks & Green Spaces") Land Use of the Geographical Information System (GIS) and Mathematical Models in Planning Urban Key words: SUMMARY TS 37 Spatial Development Infrastructure Linkages with Urban Planning and Infrastructure
Land Use of the Geographical Information System (GIS) and Mathematical Models in Planning Urban Key words: SUMMARY TS 37 Spatial Development Infrastructure Linkages with Urban Planning and Infrastructure
Utilization of Global Map for Societal Benefit Areas
 Utilization of Global Map for Societal Benefit Areas The Fourth GEOSS AP Symposium Bali Indonesia, 11th March 2010 Shuhei Kojima Geographical Survey Institute Ministry of Land, Infrastructure, Transport
USING GIS CARTOGRAPHIC MODELING TO ANALYSIS SPATIAL DISTRIBUTION OF LANDSLIDE SENSITIVE AREAS IN YANGMINGSHAN NATIONAL PARK, TAIWAN
 CO-145 USING GIS CARTOGRAPHIC MODELING TO ANALYSIS SPATIAL DISTRIBUTION OF LANDSLIDE SENSITIVE AREAS IN YANGMINGSHAN NATIONAL PARK, TAIWAN DING Y.C. Chinese Culture University., TAIPEI, TAIWAN, PROVINCE
Determination of flood risks in the yeniçiftlik stream basin by using remote sensing and GIS techniques
 Determination of flood risks in the yeniçiftlik stream basin by using remote sensing and GIS techniques İrfan Akar University of Atatürk, Institute of Social Sciences, Erzurum, Turkey D. Maktav & C. Uysal
A Comprehensive Inventory of the Number of Modified Stream Channels in the State of Minnesota. Data, Information and Knowledge Management.
 A Comprehensive Inventory of the Number of Modified Stream Channels in the State of Minnesota Data, Information and Knowledge Management Glenn Skuta Environmental Analysis and Outcomes Division Minnesota
GIS = Geographic Information Systems;
 What is GIS GIS = Geographic Information Systems; What Information are we talking about? Information about anything that has a place (e.g. locations of features, address of people) on Earth s surface,
Delineation of Watersheds
 Delineation of Watersheds Adirondack Park, New York by Introduction Problem Watershed boundaries are increasingly being used in land and water management, separating the direction of water flow such that
GIS Solutions in Natural Resource Management: Balancing the Technical- Political Equation
 GIS Solutions in Natural Resource Management: Balancing the Technical- Political Equation Stan Morain, Editor SUB Gdttlngen 7 208 520 309 98 A14447 0NW0RD PRESS V? % \
Working with Digital Elevation Models and Digital Terrain Models in ArcMap 9
 Working with Digital Elevation Models and Digital Terrain Models in ArcMap 9 1 TABLE OF CONTENTS INTRODUCTION...3 WORKING WITH DIGITAL TERRAIN MODEL (DTM) DATA FROM NRVIS, CITY OF KITCHENER, AND CITY OF
An Introduction to Geographic Information System
 An Introduction to Geographic Information System PROF. Dr. Yuji MURAYAMA Khun Kyaw Aung Hein 1 July 21,2010 GIS: A Formal Definition A system for capturing, storing, checking, Integrating, manipulating,
Tutorial 8 Raster Data Analysis
 Objectives Tutorial 8 Raster Data Analysis This tutorial is designed to introduce you to a basic set of raster-based analyses including: 1. Displaying Digital Elevation Model (DEM) 2. Slope calculations
Desertification Hazard Zonation by Means of ICD Method in Kouhdasht Watershed
 DESERT DESERT Online at http://jdesert.ut.ac.ir DESERT 17 (13) 233240 Desertification Hazard Zonation by Means of ICD Method in Kouhdasht Watershed Gh. Chamanpira a*, Gh.R. Zehtabian b, H. Ahmadi c, M.
MODULE 7 LECTURE NOTES 5 DRAINAGE PATTERN AND CATCHMENT AREA DELINEATION
 MODULE 7 LECTURE NOTES 5 DRAINAGE PATTERN AND CATCHMENT AREA DELINEATION 1. Introduction Topography of the river basin plays an important role in hydrologic modelling, by providing information on different
Integrating Geographical Information Systems (GIS) with Hydrological Modelling Applicability and Limitations
 with Hydrological Modelling Applicability and Limitations") Integrating Geographical Information Systems (GIS) with Hydrological Modelling Applicability and Limitations Rajesh VijayKumar Kherde *1, Dr. Priyadarshi. H. Sawant #2 * Department of Civil Engineering,
Integrating Geographical Information Systems (GIS) with Hydrological Modelling Applicability and Limitations Rajesh VijayKumar Kherde *1, Dr. Priyadarshi. H. Sawant #2 * Department of Civil Engineering,
Pipeline Routing Using Geospatial Information System Analysis
 Pipeline Routing Using Geospatial Information System Analysis Mahmoud Reza 1 Delavar and Fereydoon 2 Naghibi 1-Assistance Professor, Dept. of Surveying and Geomatic Eng., Eng. Faculty, University of Tehran,
Traffic accidents and the road network in SAS/GIS
 Traffic accidents and the road network in SAS/GIS Frank Poppe SWOV Institute for Road Safety Research, the Netherlands Introduction The first figure shows a screen snapshot of SAS/GIS with part of the
Basics of GIS. by Basudeb Bhatta. Computer Aided Design Centre Department of Computer Science and Engineering Jadavpur University
 Basics of GIS by Basudeb Bhatta Computer Aided Design Centre Department of Computer Science and Engineering Jadavpur University e-governance Training Programme Conducted by National Institute of Electronics
Chapter 6. Fundamentals of GIS-Based Data Analysis for Decision Support. Table 6.1. Spatial Data Transformations by Geospatial Data Types
 Chapter 6 Fundamentals of GIS-Based Data Analysis for Decision Support FROM: Points Lines Polygons Fields Table 6.1. Spatial Data Transformations by Geospatial Data Types TO: Points Lines Polygons Fields
ABSTRACT The first chapter Chapter two Chapter three Chapter four
 ABSTRACT The researches regarding this doctoral dissertation have been focused on the use of modern techniques and technologies of topography for the inventory and record keeping of land reclamation. The
Relief Camp Tool Using GIS
 Relief Camp Tool Using GIS MAYANK SINGH SAKLA 1, JANKI ADHVARYU 2 1 M.TECH GEOMATICS STUDENT, CEPT UNIVERSITY 2 M.TECH GEOMATICS STUDENT, CEPT UNIVERSITY K L CAMPUS UNIVERSITY AREA NAVARANG PURA AHMEDABAD
NREL, Intro to GIS for Wind Energy Siting for IGERT Wind NSF
 NREL, 2010 Intro to GIS for Wind Energy Siting for IGERT Wind NSF Challenge: How to encourage offshore wind in the US while managing ecological responsibility and ocean use conflicts? Introduction NREL,
U.S. ARMY CORPS OF ENGINEERS
 CORPS FACTS Regulating Mississippi River Navigation Pools U.S. ARMY CORPS OF ENGINEERS BUILDING STRONG Historical Background Federal improvements in the interest of navigation on the Mississippi River
StreamStats: Delivering Streamflow Information to the Public. By Kernell Ries
 StreamStats: Delivering Streamflow Information to the Public By Kernell Ries U.S. Department of the Interior U.S. Geological Survey MD-DE-DC District 410-238-4317 kries@usgs.gov StreamStats Web Application
GeoWEPP Tutorial Appendix
 GeoWEPP Tutorial Appendix Chris S. Renschler University at Buffalo - The State University of New York Department of Geography, 116 Wilkeson Quad Buffalo, New York 14261, USA Prepared for use at the WEPP/GeoWEPP
Pierce Cedar Creek Institute GIS Development Final Report. Grand Valley State University
 Pierce Cedar Creek Institute GIS Development Final Report Grand Valley State University Major Goals of Project The two primary goals of the project were to provide Matt VanPortfliet, GVSU student, the
SUB CATCHMENT AREA DELINEATION BY POUR POINT IN BATU PAHAT DISTRICT
 SUB CATCHMENT AREA DELINEATION BY POUR POINT IN BATU PAHAT DISTRICT Saifullizan Mohd Bukari, Tan Lai Wai &Mustaffa Anjang Ahmad Faculty of Civil Engineering & Environmental University Tun Hussein Onn Malaysia
What is GIS? Introduction to data. Introduction to data modeling
 What is GIS? Introduction to data Introduction to data modeling 2 A GIS is similar, layering mapped information in a computer to help us view our world as a system A Geographic Information System is a
Introduction to Geographic Information Systems
 Introduction to Geographic Information Systems Lynn_Carlson@brown.edu 401-863-9917 The Environmental And Remote TecHnologies Lab MacMillan Hall, Room 105 http://www.brown.edu/research/earthlab/ Outline
Site Suitability Analysis for Urban Development: A Review
 Site Suitability Analysis for Urban Development: A Review Santanu Kumar Misra Associate Professor (Dept. of CSE) Sikkim Manipal Institute of Technology Majitar, Sikkim misra_santanu@rediffmail.com Shrijana
13 Watershed Delineation & Modeling
 Module 4 (L12 - L18): Watershed Modeling Standard modeling approaches and classifications, system concept for watershed modeling, overall description of different hydrologic processes, modeling of rainfall,
Display data in a map-like format so that geographic patterns and interrelationships are visible
 Vilmaliz Rodríguez Guzmán M.S. Student, Department of Geology University of Puerto Rico at Mayagüez Remote Sensing and Geographic Information Systems (GIS) Reference: James B. Campbell. Introduction to
Using the Stock Hydrology Tools in ArcGIS
 Using the Stock Hydrology Tools in ArcGIS This lab exercise contains a homework assignment, detailed at the bottom, which is due Wednesday, October 6th. Several hydrology tools are part of the basic ArcGIS
CHALLENGES WITH FOREIGN DATA FORMATS & GEOLOGICAL CONFIDENCE
 CHALLENGES WITH FOREIGN DATA FORMATS & GEOLOGICAL CONFIDENCE Some Case Study Examples from Russia and Central Asia Grant van Heerden, Pr.Sci.Nat. Nick Ryan, CP(Geo) PRESENTATION OVERVIEW The Concept of
Application of Geographic Information Systems for Government School Sites Selection
 Rs. 3000,00 Application of Geographic Information Systems for Government School Sites Selection by K. D. Nethsiri Jayaweera M.Sc. Library - USJP 1111111111111111 210975 2014 210873 Application of Geographic
Work Group A «Core Data» Report and Update François Chirié, Dominique Laurent, France
 JOINT UN-GGIM: EUROPE ESS MEETING ON THE INTEGRATION OF STATISTICAL AND GEOSPATIAL INFORMATION LUXEMBOURG 11 MARCH 2016 Work Group A «Core Data» Report and Update François Chirié, Dominique Laurent, France
Transactions on Information and Communications Technologies vol 18, 1998 WIT Press, ISSN
 STREAM, spatial tools for river basins, environment and analysis of management options Menno Schepel Resource Analysis, Zuiderstraat 110, 2611 SJDelft, the Netherlands; e-mail: menno.schepel@resource.nl
Teaching GIS for Land Surveying
 Teaching GIS for Land Surveying Zhanjing (John) Yu Evergreen Valley College, San Jose, California James Crossfield California State University at Fresno, Fresno California 7/13/2006 1 Outline of the Presentation
Land Administration and Cadastre
 Geomatics play a major role in hydropower, land and water resources and other infrastructure projects. Lahmeyer International s (LI) worldwide projects require a wide range of approaches to the integration
THE SPATIAL DATA WAREHOUSE OF SEOUL
 THE SPATIAL DATA WAREHOUSE OF SEOUL Jae-Ho Han The Seoul Metropolitan Government Seoul City Hall, Taepyeongno 1(il)-ga, Jung-gu, Seoul 100-744, Korea djhjha@hanmail.net Impyeong Lee Dept. of Geoinformatics,
Development of statewide 30 meter winter sage grouse habitat models for Utah
 Development of statewide 30 meter winter sage grouse habitat models for Utah Ben Crabb, Remote Sensing and Geographic Information System Laboratory, Department of Wildland Resources, Utah State University
Introduction to GIS. Geol 4048 Geological Applications of Remote Sensing
 Introduction to GIS Geol 4048 Geological Applications of Remote Sensing GIS History: Before Computers GIS History Using maps for a long time Dr. Roger F. Tomlinson Father of GIS He was an English geographer
GIS and Coastal Nutrients Luke Cole
 GIS and Coastal Nutrients Luke Cole Human population density has been widely utilized as a valid predictor of terrestrial nitrogen loads into marine systems. As 50% of the world s population lives within
Pequabuck River Flooding Study and Flood Mitigation Plan The City of Bristol and Towns of Plainville and Plymouth, CT
 Pequabuck River Flooding Study and Flood Mitigation Plan The City of Bristol and Towns of Plainville and Plymouth, CT Raymond Rogozinski and Maged Aboelata The City of Bristol and Towns of Plainville and
GEOMATICS. Shaping our world. A company of
 GEOMATICS Shaping our world A company of OUR EXPERTISE Geomatics Geomatics plays a mayor role in hydropower, land and water resources, urban development, transport & mobility, renewable energy, and infrastructure
Introducing GIS analysis
 1 Introducing GIS analysis GIS analysis lets you see patterns and relationships in your geographic data. The results of your analysis will give you insight into a place, help you focus your actions, or
Working with Digital Elevation Models and Spot Heights in ArcMap
 Working with Digital Elevation Models and Spot Heights in ArcMap 10.3.1 1 TABLE OF CONTENTS INTRODUCTION... 3 WORKING WITH SPOT HEIGHTS FROM NRVIS, CITY OF KITCHENER, AND CITY OF TORONTO...4 WORKING WITH
FLOOD HAZARD AND RISK ASSESSMENT IN MID- EASTERN PART OF DHAKA, BANGLADESH
 FLOOD HAZARD AND RISK ASSESSMENT IN MID- EASTERN PART OF DHAKA, BANGLADESH Muhammad MASOOD MEE07180 Supervisor: Prof. Kuniyoshi TAKEUCHI ABSTRACT An inundation simulation has been done for the mid-eastern
Report. Developing a course component on disaster management
 Report Developing a course component on disaster management By Chira Prangkio Tawee Chaipimonplin Department of Geography, Faculty of Social Sciences, Chiang Mai University Thailand Presented at Indian
INVESTIGATION OF AN AHP BASED MULTI CRITERIA WEIGHTING SCHEME FOR GIS ROUTING OF CROSS COUNTRY PIPELINE PROJECTS
 24th International Symposium on on Automation & Robotics in in Construction (ISARC 2007) Construction Automation Group, I.I.T. Madras INVESTIGATION OF AN AHP BASED MULTI CRITERIA WEIGHTING SCHEME FOR GIS
What s New in Topographic Information - USGS National Map
 + What s New in Topographic Information - USGS National Map SARGIS Workshop November 14, 2016 Rob Dollison, 703-648-5724 rdollison@usgs.gov + USGS 2 National Geospatial Program The National Geospatial
Data Structures & Database Queries in GIS
 Data Structures & Database Queries in GIS Objective In this lab we will show you how to use ArcGIS for analysis of digital elevation models (DEM s), in relationship to Rocky Mountain bighorn sheep (Ovis
Description of Simandou Archaeological Potential Model. 12A.1 Overview
 12A Description of Simandou Archaeological Potential Model 12A.1 Overview The most accurate and reliable way of establishing archaeological baseline conditions in an area is by conventional methods of
Ivy S. G. Akuoko NRS Concepts of GIS and Remote Sensing in Environmental Science December 14, 2017 Overview & Annotated Bibliography
 Ivy S. G. Akuoko NRS 509 - Concepts of GIS and Remote Sensing in Environmental Science December 14, 2017 Overview & Annotated Bibliography MANAGING SOLID WASTE WITH THE SUPPORT OF GIS AND REMOTE SENSING
In this exercise we will learn how to use the analysis tools in ArcGIS with vector and raster data to further examine potential building sites.
 GIS Level 2 In the Introduction to GIS workshop we filtered data and visually examined it to determine where to potentially build a new mixed use facility. In order to get a low interest loan, the building
CHAPTER 3: DATA ACQUISITION AND ANALYSIS. The research methodology is an important aspect of research to make a study results
 CHAPTER 3: DATA ACQUISITION AND ANALYSIS 3.1 Introduction The research methodology is an important aspect of research to make a study results are good and reliable. Research methodology also provides guidance
ENGRG Introduction to GIS
 ENGRG 59910 Introduction to GIS Michael Piasecki March 17, 2014 Lecture 08: Terrain Analysis Outline: Terrain Analysis Earth Surface Representation Contour TIN Mass Points Digital Elevation Models Slope
1 Complementary Access Tools
 ENERGY IHS AccuMap Shaped by industry and powered by IHS Markit information, AccuMap is a powerful and intuitive interpretation solution for the Canadian Energy Industry. 1 Complementary Access Tools AccuLogs
Response on Interactive comment by Anonymous Referee #1
 Response on Interactive comment by Anonymous Referee #1 Sajid Ali First, we would like to thank you for evaluation and highlighting the deficiencies in the manuscript. It is indeed valuable addition and
INTRODUCTION TO HEC-HMS
 INTRODUCTION TO HEC-HMS Hydrologic Engineering Center- Hydrologic Modeling System US Army Corps of Engineers Hydrologic Engineering Center HEC-HMS Uses Schematics Enter properties: watershed, rivers (reaches),
GIS AND THE ANALYTIC HIERARCHY PROCESS METHODS FOR SITE SELECTION OF WASTE LANDFILLS: A CASE STUDY IN IRAN
 GIS AND THE ANALYTIC HIERARCHY PROCESS METHODS FOR SITE SELECTION OF WASTE LANDFILLS: A CASE STUDY IN IRAN *Daman Afshan Hojat and Majlesi Monereh Azad University of Dezful, Iran *Author for Correspondence
Introduction-Overview. Why use a GIS? What can a GIS do? Spatial (coordinate) data model Relational (tabular) data model
 data model Relational (tabular) data model") Introduction-Overview Why use a GIS? What can a GIS do? How does a GIS work? GIS definitions Spatial (coordinate) data model Relational (tabular) data model intro_gis.ppt 1 Why use a GIS? An extension
Introduction-Overview Why use a GIS? What can a GIS do? How does a GIS work? GIS definitions Spatial (coordinate) data model Relational (tabular) data model intro_gis.ppt 1 Why use a GIS? An extension
ISSUES AND APPROACHES TO COUPLING GIS TO AN IRRIGATION DISTRIBUTION NETWORK AND SEEPAGE LOSS MODELS ABSTRACT
 ISSUES AND APPROACHES TO COUPLING GIS TO AN IRRIGATION DISTRIBUTION NETWORK AND SEEPAGE LOSS MODELS Yanbo Huang 1, Milton Henry 2, David Flahive 3, Guy Fipps 4 ABSTRACT Geographic Information Systems (GIS)
SPATIAL MODELING GIS Analysis Winter 2016
 SPATIAL MODELING GIS Analysis Winter 2016 Spatial Models Spatial Modeling attempts to represent how the world works All models are wrong, but some are useful (G.E. Box, quoted in course textbook pg. 379)
CASE STUDY BINGA, PHILIPPINES
 SEDIMENT MANAGEMENT CASE STUDY BINGA, PHILIPPINES Key project features Name: Binga Country: Philippines Category: modify operating rule (focus or redistribute sediment); adaptive strategies Reservoir volume
Applications of GIS in Electrical Power System
 Applications of GIS in Electrical Power System Abdulrahman M. AL-Sakkaf 201102310 CRP 514 May 2013 Dr. Baqer M. AL-Ramadan Abstract GIS has been widely used in various areas and disciplines. This paper
INTEGRATION OF GIS AND MULTICRITORIAL HIERARCHICAL ANALYSIS FOR AID IN URBAN PLANNING: CASE STUDY OF KHEMISSET PROVINCE, MOROCCO
 Geography Papers 2017, 63 DOI: http://dx.doi.org/10.6018/geografia/2017/280211 ISSN: 1989-4627 INTEGRATION OF GIS AND MULTICRITORIAL HIERARCHICAL ANALYSIS FOR AID IN URBAN PLANNING: CASE STUDY OF KHEMISSET
Optimized positioning for accommodation centers in GIS using AHP techniques; a case study: Hamedan city
 Journal of Tourism & Hospitality Research Islamic Azad University, Garmsar Branch Vol. 2, No. 2, Autumn 2012, Pp.19-29 Optimized positioning for accommodation in GIS using AHP techniques; a case study:
Afghanistan Resource Data and Geospatial Toolkit (GsT)
") Afghanistan Resource Data and Geospatial Toolkit (GsT) WISER Clean Energy Access Workshop Shannon Cowlin 22 March 2010 NREL is a national laboratory of the U.S. Department of Energy, Office of Energy Efficiency
Afghanistan Resource Data and Geospatial Toolkit (GsT) WISER Clean Energy Access Workshop Shannon Cowlin 22 March 2010 NREL is a national laboratory of the U.S. Department of Energy, Office of Energy Efficiency
DEVELOPMENT OF FLOOD HAZARD VULNERABILITY MAP FOR ALAPPUZHA DISTRICT
 DEVELOPMENT OF FLOOD HAZARD VULNERABILITY MAP FOR ALAPPUZHA DISTRICT Ciya Maria Roy 1, Elsa Manoj 2, Harsha Joy 3, Sarin Ravi 4, Abhinanda Roy 5 1,2,3,4 U.G. Student, Department of Civil Engineering, MITS
CASE STUDY BINGA, PHILIPPINES
 SEDIMENT MANAGEMENT CASE STUDY BINGA, PHILIPPINES Key project features Name: Binga Country: Philippines Category: modify operating rule (focus or redistribute sediment); adaptive strategies Binga hydropower
Landslide hazard assessment in the Khelvachauri area, Georgia
 Report on the project of AES Geohazards Stream Landslide hazard assessment in the Khelvachauri area, Georgia May 2010 George Jianping Panisara Gaprindashvili Guo Daorueang Institute of Geo-Information
Planning Road Networks in New Cities Using GIS: The Case of New Sohag, Egypt
 Planning Road Networks in New Cities Using GIS: The Case of New Sohag, Egypt Mostafa Abdel-Bary Ebrahim, Egypt Ihab Yehya Abed-Elhafez, Kingdom of Saudi Arabia Keywords: Road network evaluation; GIS, Spatial
Landslide Mapping and Hazard Analysis for a Natural Gas Pipeline Project
 CIVIL GOVERNMENT SERVICES MINING & METALS OIL, GAS & CHEMICALS POWER Albert Kottke, Mark Lee, & Matthew Waterman Landslide Mapping and Hazard Analysis for a Natural Gas Pipeline Project Technical Innovation
INFLOW DESIGN FLOOD CONTROL SYSTEM PLAN 40 C.F.R. PART PLANT YATES ASH POND 2 (AP-2) GEORGIA POWER COMPANY
 GEORGIA POWER COMPANY") INFLOW DESIGN FLOOD CONTROL SYSTEM PLAN 40 C.F.R. PART 257.82 PLANT YATES ASH POND 2 (AP-2) GEORGIA POWER COMPANY EPA s Disposal of Coal Combustion Residuals from Electric Utilities Final Rule (40 C.F.R.
INFLOW DESIGN FLOOD CONTROL SYSTEM PLAN 40 C.F.R. PART 257.82 PLANT YATES ASH POND 2 (AP-2) GEORGIA POWER COMPANY EPA s Disposal of Coal Combustion Residuals from Electric Utilities Final Rule (40 C.F.R.
GIS Workshop Data Collection Techniques
 GIS Workshop Data Collection Techniques NOFNEC Conference 2016 Presented by: Matawa First Nations Management Jennifer Duncan and Charlene Wagenaar, Geomatics Technicians, Four Rivers Department QA #: FRG
BASIC SPATIAL ANALYSIS TOOLS IN A GIS. data set queries basic statistics buffering overlay reclassification
 BASIC SPATIAL ANALYSIS TOOLS IN A GIS data set queries basic statistics buffering overlay reclassification GIS ANALYSIS TOOLS GIS ANALYSIS TOOLS Database tools: query and summarize (similar to spreadsheet
CASE STUDY NATHPA JHAKRI, INDIA
 SEDIMENT MANAGEMENT CASE STUDY NATHPA JHAKRI, INDIA Key project features Name: Nathpa Jhakri Country: India Category: reduce sediment production (watershed management); upstream sediment trapping; bypass
Application of Geographical Information System (GIS) tools in watershed analysis
 tools in watershed analysis") Application of Geographical Information System (GIS) tools in watershed analysis Paritosh Gupta 1, Damanjit S Minhas 2, Rajendra M Tamhane 1, A K Mookerjee 2 1.ESRI India New Delhi 2. LEA Associates South
Application of Geographical Information System (GIS) tools in watershed analysis Paritosh Gupta 1, Damanjit S Minhas 2, Rajendra M Tamhane 1, A K Mookerjee 2 1.ESRI India New Delhi 2. LEA Associates South
3/29/11. Why bother with tools? Incorporating Decision Support Tools into Climate Adaptation Planning. A Simplified Planning Process
 Incorporating Decision Support Tools into Climate Adaptation Planning Why bother with tools? Tools don t eliminate complexity but they can help deal with it" Tools can:"! Help incorporate science into
Welcome to NetMap Portal Tutorial
 Welcome to NetMap Portal Tutorial Potential Applications What Can you do with the Portal? At least 25 things! 1) Locate the best potential fish habitats. 2) Identify biological hotspots. 3) Map floodplain
Determination of Urban Runoff Using ILLUDAS and GIS
 Texas A&M University Department of Civil Engineering Instructor: Dr. Francisco Olivera CVEN689 Applications of GIS to Civil Engineering Determination of Urban Runoff Using ILLUDAS and GIS Tae Jin Kim 03.
Using Geographic Information Systems and Remote Sensing Technology to Analyze Land Use Change in Harbin, China from 2005 to 2015
 Using Geographic Information Systems and Remote Sensing Technology to Analyze Land Use Change in Harbin, China from 2005 to 2015 Yi Zhu Department of Resource Analysis, Saint Mary s University of Minnesota,
Basics of GIS reviewed
 Basics of GIS reviewed Martin Breunig Karlsruhe Institute of Technology martin.breunig@kit.edu GEODETIC INSTITUTE, DEPARTMENT OF CIVIL ENGINEERING, GEO AND ENVIRONMENTAL SCIENCES, CHAIR IN GEOINFORMATICS
APPLICATION OF GIS FOR ASSESSING PRAWN FARM DEVELOPMENT IN TULLY-CARDWELL, NORTH QUEENSLAND. Zainul Hidayah
 APPLICATION OF GIS FOR ASSESSING PRAWN FARM DEVELOPMENT IN TULLY-CARDWELL, NORTH QUEENSLAND Zainul Hidayah Department of Marine Science and Technology Trunojoyo University Jl. Raya Telang No 2 Kamal Bangkalan
Hydrologic Modelling of the Upper Malaprabha Catchment using ArcView SWAT
 Hydrologic Modelling of the Upper Malaprabha Catchment using ArcView SWAT Technical briefs are short summaries of the models used in the project aimed at nontechnical readers. The aim of the PES India
ISU GIS CENTER S ARCSDE USER'S GUIDE AND DATA CATALOG
 ISU GIS CENTER S ARCSDE USER'S GUIDE AND DATA CATALOG 2 TABLE OF CONTENTS 1) INTRODUCTION TO ARCSDE............. 3 2) CONNECTING TO ARCSDE.............. 5 3) ARCSDE LAYERS...................... 9 4) LAYER
THE USE OF GIS IN GEOTHERMAL RESOURCE MANAGEMENT: A CASE STUDY OF OLKARIA GEOTHERMAL PROJECT
 Presented at SDG Short Course II on Exploration and Development of Geothermal Resources, organized by UNU-GTP, GDC and KenGen, at Lake Bogoria and Lake Naivasha, Kenya, Nov. 9-29, 2017. Kenya Electricity
Quick Response Report #126 Hurricane Floyd Flood Mapping Integrating Landsat 7 TM Satellite Imagery and DEM Data
 Quick Response Report #126 Hurricane Floyd Flood Mapping Integrating Landsat 7 TM Satellite Imagery and DEM Data Jeffrey D. Colby Yong Wang Karen Mulcahy Department of Geography East Carolina University
Accuracy Assessment of SRTM Data Case Study: New Cairo, Hurghada and Toshka in Egypt
 Australian Journal of Basic and Applied Sciences, 4(12): 6269-6275, 2010 ISSN 1991-8178 Accuracy Assessment of SRTM Data Case Study: New Cairo, Hurghada and Toshka in Egypt 1 Assoc. Prof. Dr. A.K. Abdel-Gawad,
Aileen Buckley, Ph.D. and Charlie Frye
 An Information Model for Maps: Towards Production from GIS Databases Aileen Buckley, Ph.D. and Charlie Frye Researchers, ESRI GIS vs. cart GIS Outline of the presentation Introduction Differences between