DRAFT RURAL-URBAN POPULATION CHANGE IN PUERTO RICO, 1990 TO 2000
|
|
|
- Bryce Allison
- 6 years ago
- Views:
Transcription
1 DRAFT RURAL-URBAN POPULATION CHANGE IN PUERTO RICO, 1990 TO 2000 Mei-Ling Freeman Geographic Standards and Criteria Branch Geography Division US Census Bureau For presentation at the Western Regional Science Association annual meeting, Santa Fe, NM, February 22-25, This paper reports the results of work undertaken by the U.S. Census Bureau staff. This report is released to inform interested parties of research and to encourage discussion. 1
2 Rural-Urban Population Change in Puerto Rico, 1990 to 2000 Introduction According to published data from the 1990 and 2000 decennial censuses, Puerto Rico s rural population decreased sharply from approximately 1 million people (29 percent of total) in 1990, to only 213,000 people (6 percent of total) in 2000 (Chart 1, Map 1). The urban population, on the other hand, increased from 71 percent of total population in 1990 (2.5 million people), to 94 percent in 2000, or 3.6 million people. Percent of Total 100% 90% 80% 70% 60% 50% 40% 30% 20% 10% 0% Chart 1: Percent of Total Urban/Rural Population % 94% Total Urban Source: U.S. Census Bureau Urban/Rural 29% 6% Total Rural Population growth in general certainly explains part of the increase in urban population, but it does not appear to be the major reason behind the substantial increase in urban population in Puerto Rico in As Table 1 illustrates, there was not a substantial population growth between 1990 and 2000, compared to previous decades. Although the total population increased steadily between 1960 and 2000, population growth has been slowing since Therefore, other factors must be considered when explaining the change in urban and rural population. Table 1: Total Population , Puerto Rico Total Population Percentage Change ,808,610 8% ,522,037 10% ,196,520 18% ,712,033 15% ,349,544 Source: U.S. Census Bureau In this paper I posit that an important explanation for the substantial decrease of rural population was changes to the criteria and methodology used to delineate urban and rural areas in Puerto Rico for the 1990 and 2000 censuses, although rural-to-urban migration and urban growth certainly played a role. I also discuss issues related to appropriate population density thresholds when defining urban and rural areas in Puerto Rico. 2


3 Criteria and Methodology from 1990 to 2000 The Census Bureau modified the criteria and methodology used to delineate urban areas for Census One of the major changes was the adoption of automated delineation software to define urban areas. For Census 2000, urban areas encompass densely settled territory consisting of core census block groups or blocks that have a population density of at least 1,000 people per square mile (ppsm) and surrounding census blocks that have an overall density of at least 500 ppsm. With the advance of technology, the Census Bureau was able to automate the urban area delineation process to ensure a more accurate and consistent representation of urban landscape for Census For the 1990 census, however, Census Bureau geographers interactively reviewed population density patterns to delineate urbanized areas. Census blocks were grouped to form analysis units based either on similar street patterns or similar density patterns. If the overall density of blocks within an analysis unit met the minimum threshold of at least 1,000 ppsm, all blocks were included in the urbanized area (Figure 1). This approach allowed for the inclusion of blocks with non-residential urban land uses such as parks, schools, or commercial development that had densities less than 1,000 ppsm. Figure 1: 1990 Urbanized Areas Criteria United States The Census Bureau applied a slightly different methodology in delineating urbanized areas in Puerto Rico for the 1990 census. When reviewing density patterns in Puerto Rico, we were concerned that if we applied the same methodology as was applied in the 3
.")


 criteria and 1990(current) criteria (Figure 3).")
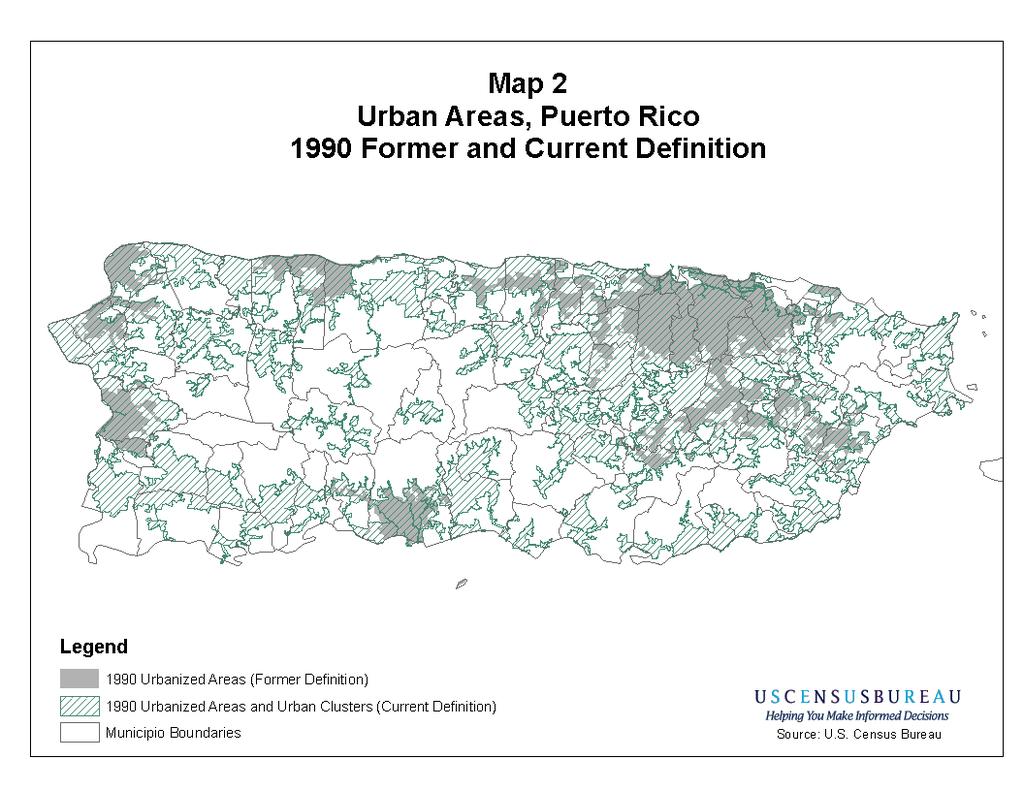
4 United States we would substantially overbound the extent of urbanized areas. Therefore, we decided to include in urbanized areas only those census blocks that had densities of at least 1,000 ppsm and to exclude any block with a density less than 1,000 ppsm (Figure 2). Figure 2: 1990 Urbanized Areas Criteria Puerto Rico As a result of this methodological change, territory that might have been classified as urban under the methodology used for the United States was classified as rural in Puerto Rico in The application of what amounted to a stricter methodology resulted in a definition of urbanized areas that, at the time, was considered to be a more accurate and consistent definition. The unforeseen consequence, however, was that adoption of an automated delineation process for Census 2000, coupled with criteria changes, would lead to substantial increases in urban territory and population perhaps more substantial than would have been obtained had we applied the same method in Puerto Rico that was applied in the United States in To further illustrate how changes in criteria and methodology impact urban population in Puerto Rico, I compare 1990 data with 1990(former) criteria and 1990(current) criteria (Figure 3). Between 1990 and 2000, the percent of urban population increased substantially from 71 percent to 94 percent of total population, a 23 percentage point increase. However, when we applied the 2000 criteria to 1990 data (1990 current criteria), the urban population was about 3.3 million, or about 93 percent of the total population, yielding a percentage point increase of only 1.4 (Map 2, Map 3). We can assume from this that, had we applied the state-side method to Puerto Rico in 1990, the urban population in Puerto Rico for 1990 likely would have been close to 90 percent. While this would have reduced the percentage point change between 1990 (former 4


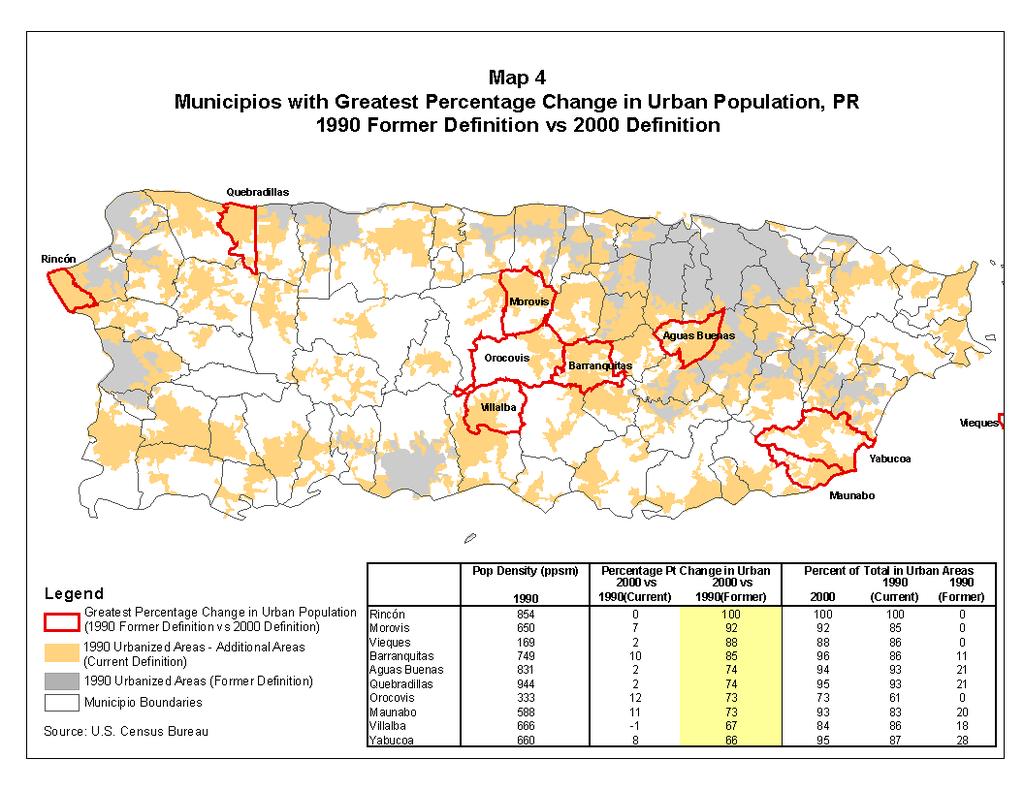
5 criteria) and 2000, it would have represented a substantial change between 1980 and The fact of the matter is that a substantial increase in population as a result of criteria and methodological changes would have occurred at some time if not 1990 to 2000, then 1980 to Figure 3: 1990 Former and Current Criteria Examples This section illustrates how the change in methodology and criteria affected the delineation of urban areas in Puerto Rico. I will examine municipios that have the greatest percentage change in urban population between 1990 and 2000, and discuss its relationship to population growth, and migration. 1. Map 4 identifies the top 10 municipios that have greatest percentage point change in urban population between 1990 and These municipios were predominately rural under the 1990 former definition, but were predominately urban under the 2000 definition. When we applied the 2000 criteria to 1990 data, most of these municipios were included in the 1990 current criteria urban areas. Rincon municipio, for example, was 100 percent rural under the 1990 (former) definition, but 100 percent urban under both the 1990 (current) definition and 2000 definition. In other words, if we were using the same criteria as in 2000 in delineating urban areas in Rincon municipio in 1990, Rincon would have been 100 percent urban and the percentage 5
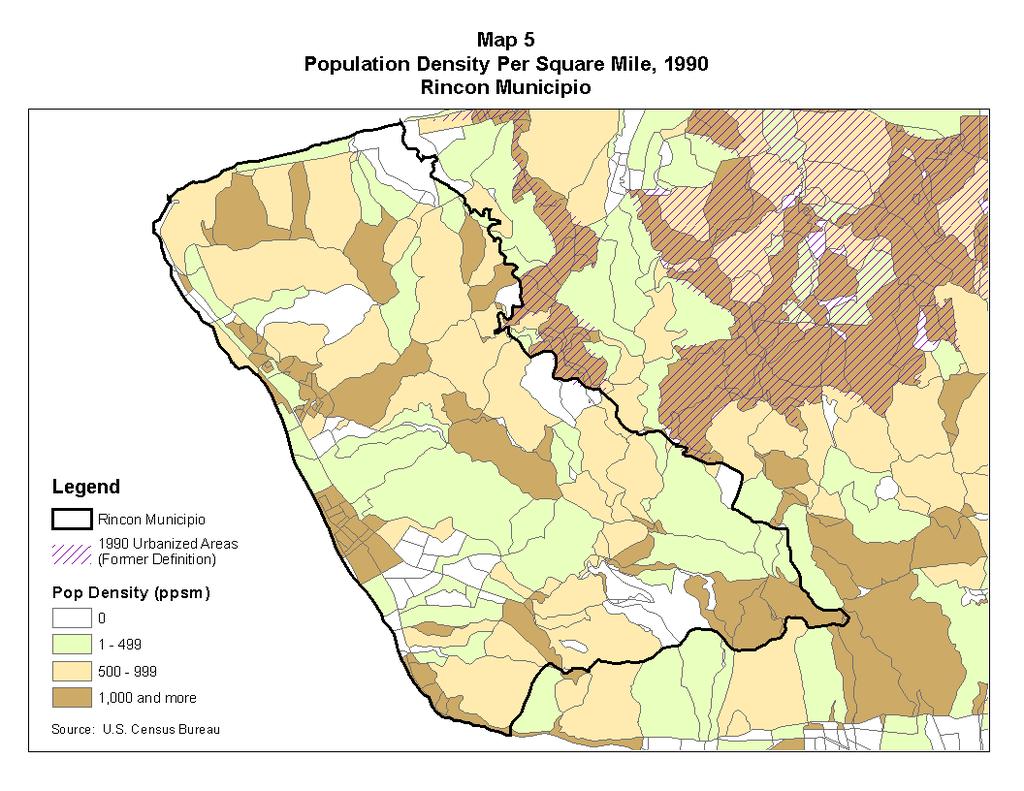
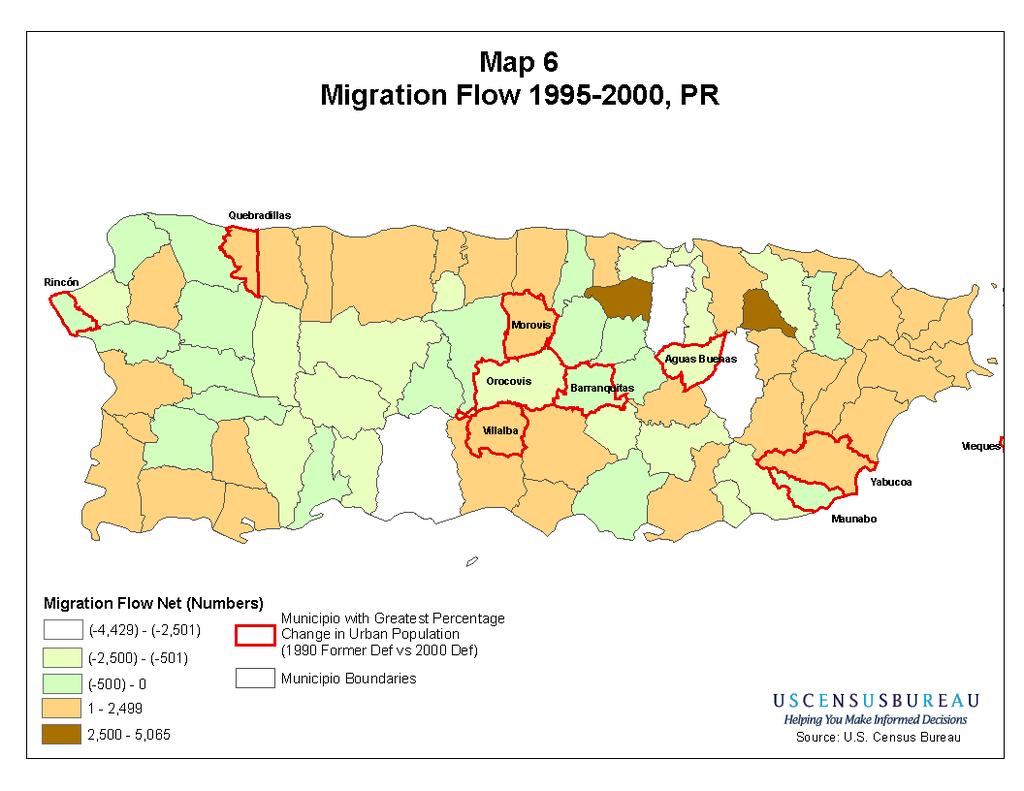
6 change in urban population for Rincon would be zero between 1990 and 2000, rather than 100. Similar changes are seen in other municipios when we compare data with the 1990 current definition. Instead of being only 30 percent urban in 1990, these municipios would have over 80 percent of total population in urban areas under the 1990 current definition. Instead of having a substantial increase of percent urban in 2000 (between 60 and 100 percentage point increase), there was only a minimal percentage point increase when comparing data with 1990 current definition. Villalba municipio experienced a percentage point change of -1 when comparing data with 1990 current definition. Such a marked difference in urban population between the 1990 former and the current definition demonstrated that criteria and methodological changes are the major factors causing a substantial increase in urban population in Puerto Rico. As the population density for much of the territory in these municipios was below 1,000 ppsm, they were for the most part excluded from urbanized areas in For instance, as shown in Map 5, most of the blocks in Rincon municipio had a population density between 500 to 1,000 ppsm; most of the blocks with densities of 1,000 ppsm were not adjacent to other qualifying territory, and therefore were excluded from any urbanized area in Lowering the population density threshold and the changes affecting hops and jumps under the current definition qualified territory in Rincon for inclusion in urban areas. 2. We were also interested in knowing whether some of these municipios had experienced substantial in-migration between 1995 and As shown in Map 6, there is not a strong relationship between migration across municipios and urban growth among these municipios. Some of these municipios were only showing a moderate net migration gain within a range of 1 person to 2,500 numbers of people during 1995 to There was even a net migration loss for Rincon municipio, as well as for some other municipios. 3. The unique population distribution pattern of Puerto Rico also plays an important role in affecting its urban morphology. Puerto Rico is a densely populated area with over 90 percent of its residents live in areas with population density of at least 500 ppsm. As Map 7 shows, the shaded areas were excluded from urbanized areas in 1990 because they did not meet the requirement of overall density of 1,000 ppsm. The population density for most of these areas was between 500 to 1,000 ppsm. For Census 2000, nearly all the population was within urban areas with at least 500 ppsm (Map 8). When comparing data with 1990 current definition and 2000 definition, the newly added urban areas were fringe of 1990 urbanized areas based on current definition. Most of these areas have a population density between 500 and 1,000 ppsm (Map 9). 6
7 What s Next? The Geography Division plans to continue research pertaining to the delineation of urban areas for Puerto Rico for Census This research is focusing primarily on identifying the minimum population density threshold that will allow the most appropriate separation of urban and rural territory. Puerto Rico s population is densely settled in general, with over 90 percent of its population residing in areas with population density of at least 500 ppsm (Table 2). If we change the population threshold to 1,000 ppsm, the cumulative percent of total population would still be over 80 percent. Decisions such as whether we should keep the criteria the same in Puerto Rico as in the rest of the United States, or whether we should change the population threshold for Puerto Rico so to better represent its unique urban landscape become important issues as we revisit urban areas criteria for the Census Table 2: Estimated Total Number of People by Population Density Per Square Mile, 2000 Cumulative Pop Density ppsm Total Pop Percent of Total Pop Percent of Total Pop Cumulative Pop 0 to ,914 8% 500 to ,835 9% 92% 3,509,696 1,000 to 1, ,342 6% 83% 3,175,861 1,500 to 1, ,579 5% 77% 2,935,519 2,000 to 2, ,255 3% 73% 2,761,940 2,500 to 2, ,436 3% 69% 2,634,685 3,000 to 3,499 90,496 2% 66% 2,525,249 3,500 to 3,999 70,905 2% 64% 2,434,753 4,000 to 4,499 71,122 2% 62% 2,363,848 4,500 to 4,999 71,275 2% 60% 2,292,726 5,000 to 5,499 2,221,451 58% 58% 2,221,451 Source: U.S. Census Bureau Conclusion In summary, an important explanation for the urban/rural shift in Puerto Rico was a change in criteria and methodology used in delineating urban areas for the 1990 and 2000 censuses. When we applied the 2000 criteria to 1990 census data, the percent of urban population changed from 71 percent (with the 1990 former definition) to 93 percent (with the 1990 current definition). This new urban territory was not included in urbanized areas defined under the 1990 former criteria because blocks contained within generally had population densities below 1,000 ppsm and therefore did not meet the modified requirements. Because of the different methodology used between 1990 and 2000, 7
8 municipios that were predominately rural under the 1990 former definition had become predominately urban under both the 1990 current definition and 2000 definitions. 8
9 9
10 10
11 11
12 12
13 13
14 14
15 15
16 16
17 17
Rural Alabama. Jennifer Zanoni. Geography Division U.S. Census Bureau. Alabama State Data Center 2018 Data Conference Tuscaloosa, Alabama
 Rural Alabama Jennifer Zanoni Geography Division U.S. Census Bureau Alabama State Data Center 2018 Data Conference Tuscaloosa, Alabama May 17, 2018 Agenda Census Geography Urban/Rural Definitions County-based
Census Geography, Geographic Standards, and Geographic Information
 Census Geography, Geographic Standards, and Geographic Information Michael Ratcliffe Geography Division US Census Bureau New Mexico State Data Center Data Users Conference November 19, 2015 Today s Presentation
The History Behind Census Geography
 The History Behind Census Geography Michael Ratcliffe Geography Division US Census Bureau Tennessee State Data Center August 8, 2017 Today s Presentation A brief look at the history behind some of the
Rural Pennsylvania: Where Is It Anyway? A Compendium of the Definitions of Rural and Rationale for Their Use
 Rural Pennsylvania: Where Is It Anyway? A Compendium of the Definitions of Rural and Rationale for Their Use Pennsylvania Office of Rural Health 310 Nursing Sciences Building University Park, PA 16802
International Workshop on Defining and Measuring Metropolitan Regions (Paris, France, 27 th November, 2006)
") OECD Special Session International Workshop on Defining and Measuring Metropolitan Regions (Paris, France, 27 th November, 2006) Defining an Measuring Metropolitan Areas: A Comparison between Canada and
OECD Special Session International Workshop on Defining and Measuring Metropolitan Regions (Paris, France, 27 th November, 2006) Defining an Measuring Metropolitan Areas: A Comparison between Canada and
The History Behind Census Geography
 The History Behind Census Geography Michael Ratcliffe Geography Division US Census Bureau Kentucky State Data Center Affiliate Meeting August 5, 2016 Today s Presentation A brief look at the history behind
US Census Bureau Geographic Entities and Concepts. Geography Division
 US Census Bureau Geographic Entities and Concepts Geography Division Geographic Concepts Addresses vs. Geographic features and entities Legal/Administrative vs. Statistical Nesting relationships (or the
Operational Definitions of Urban, Rural and Urban Agglomeration for Monitoring Human Settlements
 Operational Definitions of Urban, Rural and Urban Agglomeration for Monitoring Human Settlements By Markandey Rai United Nations Human Settlements Programme PO Box-30030 Nairobi, Kenya Abstract The United
LAND COVER IN OHIO S TOWNSHIPS: AN ANALYSIS OF TOWNSHIP LAND COVER AND POPULATION CHANGE
 THE EXURBAN CHANGE PROJECT REPORT NUMBER EX-3: LAND COVER IN OHIO S TOWNSHIPS: AN ANALYSIS OF TOWNSHIP LAND COVER AND POPULATION CHANGE (FEBRUARY 2002) Prepared by: Jason W. Reece Data Manager & GIS Analyst
ZIP Code Tabulation Areas For Census 2000
 ZIP Code Tabulation Areas For Census 2000 NCHS, CDC Andrew Flora June 13, 2000 TIGER Operations Branch Geography Division U S C E N S U S B U R E A U Helping You Make Informed Decisions ZIP Code Tabulations
2/25/2019. Taking the northern and southern hemispheres together, on average the world s population lives 24 degrees from the equator.
 Where is the world s population? Roughly 88 percent of the world s population lives in the Northern Hemisphere, with about half north of 27 degrees north Taking the northern and southern hemispheres together,
C e n t ral Indiana Growing Faster Than Rest of the State
 C E N T R A L I N D I A N A U N D E R S T A N D I N G T H E R E G I O N A N D I D E N T I F Y I N G C H O I C E S CENTER FOR URBAN POLICY AND THE ENVIRONMENT MAY 2001 C e n t ral Indiana Growing Faster
The Census, Urbanized Areas, and Your MPO/RPO
 The Census, Urbanized Areas, and Your MPO/RPO Alex Bond, AICP NADO Rural Transportation Peer Learning Conference August 25, 2011 1 Issues to Discuss Census background Definitions of Census geographies
Preparing the GEOGRAPHY for the 2011 Population Census of South Africa
 Preparing the GEOGRAPHY for the 2011 Population Census of South Africa Sharthi Laldaparsad Statistics South Africa; E-mail: sharthil@statssa.gov.za Abstract: Statistics South Africa (Stats SA) s Geography
Arkansas Retiree In-Migration: A Regional Analysis
 Community & Economic Development FSCDM5 Arkansas Retiree In-Migration: A Regional Analysis Wayne Miller Professor and Extension Economist Katy Elliott Extension Associate - Community and Economic Development
Bureau of Economic and Business Research May 29, Measuring Population Density for Counties in Florida
 Bureau of Economic and Business Research May 29, 2015 Measuring Population Density for Counties in Florida By: Stefan Rayer, PhD; Ying Wang, PhD https://www.bebr.ufl.edu/content/measuring-population-density-counties-florida
Effective Use of Geographic Maps
 Effective Use of Geographic Maps Purpose This tool provides guidelines and tips on how to effectively use geographic maps to communicate research findings. Format This tool provides guidance on geographic
APPENDIX I - AREA PLANS
 ROUTE 37 WEST LAND USE PLAN ROUTE 37 WEST LAND USE PLAN Recent land use decisions and development trends have drawn attention to the land within the Route 37 western by-pass area between Route 50 and
Natural and Human Influences on Flood Zones in Wake County. Georgia Ditmore
 Natural and Human Influences on Flood Zones in Wake County Georgia Ditmore Prepared for GEOG 591 December 5, 2014 2 Table of Contents Introduction.3 Objectives...5 Methods...6 Conclusion.11 References
Understanding and Measuring Urban Expansion
 VOLUME 1: AREAS AND DENSITIES 21 CHAPTER 3 Understanding and Measuring Urban Expansion THE CLASSIFICATION OF SATELLITE IMAGERY The maps of the urban extent of cities in the global sample were created using
Neighborhood social characteristics and chronic disease outcomes: does the geographic scale of neighborhood matter? Malia Jones
 Neighborhood social characteristics and chronic disease outcomes: does the geographic scale of neighborhood matter? Malia Jones Prepared for consideration for PAA 2013 Short Abstract Empirical research
Environmental Analysis, Chapter 4 Consequences, and Mitigation
 Environmental Analysis, Chapter 4 4.17 Environmental Justice This section summarizes the potential impacts described in Chapter 3, Transportation Impacts and Mitigation, and other sections of Chapter 4,
Too Close for Comfort
 Too Close for Comfort Overview South Carolina consists of urban, suburban, and rural communities. Students will utilize maps to label and describe the different land use classifications. Connection to
Urbanization in Japan since 1960 viewed from the DID Statistics
 Institute of Geography, Asahikawa Campus Hokkaido University of Education Asahikawa, 070-8621, Japan 1. Introduction Urban expansion is one of the most important features of land use/cover changes in the
Updating the Urban Boundary and Functional Classification of New Jersey Roadways using 2010 Census data
 Updating the Urban Boundary and Functional Classification of New Jersey Roadways using 2010 Census data By: Glenn Locke, GISP, PMP 1 GIS-T May, 2013 Presentation Overview Purpose of Project Methodology
The Scope and Growth of Spatial Analysis in the Social Sciences
 context. 2 We applied these search terms to six online bibliographic indexes of social science Completed as part of the CSISS literature search initiative on November 18, 2003 The Scope and Growth of Spatial
Figure 8.2a Variation of suburban character, transit access and pedestrian accessibility by TAZ label in the study area
 Figure 8.2a Variation of suburban character, transit access and pedestrian accessibility by TAZ label in the study area Figure 8.2b Variation of suburban character, commercial residential balance and mix
Discerning sprawl factors of Shiraz city and how to make it livable
 Discerning sprawl factors of Shiraz city and how to make it livable 1. Introduction: Iran territory has now been directly affected by urban land-uses which are shaping landscapes in cities and around them.
HORIZON 2030: Land Use & Transportation November 2005
 PROJECTS Land Use An important component of the Horizon transportation planning process involved reviewing the area s comprehensive land use plans to ensure consistency between them and the longrange transportation
Schedule and Process:
 Census Bureau possible criteria for Urbanized Areas (July 9, 2009) On June 12, 2009 FHWA staff held a webinar where Census Bureau staff discussed the Census Bureau plans on developing new Urbanized Area
Location Suitability Analysis
 2010 Fall 406 Final Project Location Suitability Analysis New Burger stores in San Fernando Valley Presenter: Rich Lee I. Introduction In-N-Out Burger is famous in South West America. Established in 1948
A Case Study of Regional Dynamics of China 中国区域动态案例研究
 A Case Study of Regional Dynamics of China 中国区域动态案例研究 Shuming Bao Spatial Data Center & China Data Center University of Michigan 1:00 PM - 2:00 PM, Tue, Feb 6, 2018 EST USA A Case Study of Regional Dynamics
Gentrification Trends in the United States,
 Gentrification Trends in the United States, 1970-2010 Richard W. Martin, Department of Insurance, Legal, Studies, and Real Estate, Terry College of Business, University of Georgia, 206 Brooks Hall, Athens,
C) Discuss two factors that are contributing to the rapid geographical shifts in urbanization on a global scale.
 Discuss two factors that are contributing to the rapid geographical shifts in urbanization on a global scale.") AP Human Geography Unit VII. Cities and Urban Land Use Free Response Questions FRQ 1 Rapid urbanization in Least Developed Countries (LDCs) has many profound impacts for the world. Answer the following
AP Human Geography Unit VII. Cities and Urban Land Use Free Response Questions FRQ 1 Rapid urbanization in Least Developed Countries (LDCs) has many profound impacts for the world. Answer the following
Summary and Statistical Report of the 2007 Population and Housing Census Results 1
 Summary and Statistical Report of the 2007 Population and Housing Census Results 1 2 Summary and Statistical Report of the 2007 Population and Housing Census Results This document was printed by United
Census Urban Area Comparisons, 2000 to 2010
 THE HONORABLE ROGERS Mayor ANDERSON, Karl Dean, CHAIRMAN Chairman Census Urban Area Comparisons, 2000 to 2010 TCC May 2, 2012 MPOs/RPOs in Tennessee Regional Geographies in Middle TN Nashville MPO Clarksville
Globally Estimating the Population Characteristics of Small Geographic Areas. Tom Fitzwater
 Globally Estimating the Population Characteristics of Small Geographic Areas Tom Fitzwater U.S. Census Bureau Population Division What we know 2 Where do people live? Difficult to measure and quantify.
Spatial Organization of Data and Data Extraction from Maptitude
 Spatial Organization of Data and Data Extraction from Maptitude N. P. Taliceo Geospatial Information Sciences The University of Texas at Dallas UT Dallas GIS Workshop Richardson, TX March 30 31, 2018 1/
Frontier and Remote (FAR) Area Codes: A Preliminary View of Upcoming Changes John Cromartie Economic Research Service, USDA
 Area Codes: A Preliminary View of Upcoming Changes John Cromartie Economic Research Service, USDA") National Center for Frontier Communities webinar, January 27, 2015 Frontier and Remote (FAR) Area Codes: A Preliminary View of Upcoming Changes John Cromartie Economic Research Service, USDA The views
National Center for Frontier Communities webinar, January 27, 2015 Frontier and Remote (FAR) Area Codes: A Preliminary View of Upcoming Changes John Cromartie Economic Research Service, USDA The views
PRODUCING MILLIONS OF MAPS FOR THE UNITED STATES 2010 DECENNIAL CENSUS*
 PRODUCING MILLIONS OF MAPS FOR THE UNITED STATES 2010 DECENNIAL CENSUS* M. Schell a, S. Spahlinger b a U.S. Census Bureau, 4700 Silver Hill Rd, Washington DC 20233-7400 matthew.c.schell@census.gov b U.S.
Inclusion of Non-Street Addresses in Cancer Cluster Analysis
 Inclusion of Non-Street Addresses in Cancer Cluster Analysis Sue-Min Lai, Zhimin Shen, Darin Banks Kansas Cancer Registry University of Kansas Medical Center KCR (Kansas Cancer Registry) KCR: population-based
Improving rural statistics. Defining rural territories and key indicators of rural development
 Improving rural statistics Defining rural territories and key indicators of rural development Improving rural statistics Improving Rural Statistics In 2016, the Global Strategy to improve Agricultural
Urban settlements delimitation using a gridded spatial support
 Urban settlements delimitation using a gridded spatial support Rita Nicolau 1, Elisa Vilares 1, Cristina Cavaco 1, Ana Santos 2, Mário Lucas 2 1 - General Directorate for Territory Development DGT, Portugal
The Governance of Land Use
 The planning system The Governance of Land Use United Kingdom Levels of government and their responsibilities The United Kingdom is a unitary state with three devolved governments in Northern Ireland,
A New Approach to Estimating Population Growth Along a Major Arterial Highway.
 . ABSTRACT In the last twenty years Texas has undergone extensive growth as people move across the country and relocate in the Lone Star State. Many of these new Texans choose suburbs outside major cities
Urban Geography. Unit 7 - Settlement and Urbanization
 Urban Geography Unit 7 - Settlement and Urbanization Unit 7 is a logical extension of the population theme. In their analysis of the distribution of people on the earth s surface, students became aware
METHODOLOGICAL ISSUES IN CREATING A REGIONAL NEIGHBORHOOD TYPOLOGY
 METHODOLOGICAL ISSUES IN CREATING A REGIONAL NEIGHBORHOOD TYPOLOGY Z. Asligul Gocmen Urban and Regional Planning Program, University of Michigan Ann Arbor, MI 48109 Tel: +1 734-904-2762 (c) Fax: +1 734-763-2322
Do the Causes of Poverty Vary by Neighborhood Type?
 Do the Causes of Poverty Vary by Neighborhood Type? Suburbs and the 2010 Census Conference Uday Kandula 1 and Brian Mikelbank 2 1 Ph.D. Candidate, Maxine Levin College of Urban Affairs Cleveland State
Variables and Variable De nitions
 APPENDIX A Variables and Variable De nitions All demographic county-level variables have been drawn directly from the 1970, 1980, and 1990 U.S. Censuses of Population, published by the U.S. Department
Are EU Rural Areas still Lagging behind Urban Regions? An Analysis through Fuzzy Logic
 Are EU Rural Areas still Lagging behind Urban Regions? An Analysis through Fuzzy Logic Francesco Pagliacci Department of Economics and Social Sciences Università Politecnica delle Marche Ancona (Italy)
Refinement of the OECD regional typology: Economic Performance of Remote Rural Regions
 [Preliminary draft April 2010] Refinement of the OECD regional typology: Economic Performance of Remote Rural Regions by Lewis Dijkstra* and Vicente Ruiz** Abstract To account for differences among rural
Regional Transit Development Plan Strategic Corridors Analysis. Employment Access and Commuting Patterns Analysis. (Draft)
") Regional Transit Development Plan Strategic Corridors Analysis Employment Access and Commuting Patterns Analysis (Draft) April 2010 Contents 1.0 INTRODUCTION... 4 1.1 Overview and Data Sources... 4 1.2
Regional Transit Development Plan Strategic Corridors Analysis Employment Access and Commuting Patterns Analysis (Draft) April 2010 Contents 1.0 INTRODUCTION... 4 1.1 Overview and Data Sources... 4 1.2
Local Economic Activity Around Rapid Transit Stations
 Local Economic Activity Around Rapid Transit Stations The Case of Chicago s Orange Line Julie Cooper, MPP 2014 Harris School of Public Policy Transport Chicago June 6, 2014 Motivation Impacts of transit
Praveen Subramani December 7, 2008 Athena: praveens Final Project: Placing a New Upscale Restaurant in Suffolk County, MA
 11.188 Final Project: Placing a New Upscale Restaurant in Suffolk County, MA Abstract According to an August 2008 New York Times article, over 60% of new restaurants, delis, and food shops close within
Regional Performance Measures
 G Performance Measures Regional Performance Measures Introduction This appendix highlights the performance of the MTP/SCS for 2035. The performance of the Revenue Constrained network also is compared to
ANALYZING CITIES & POPULATION: POPULATION GEOGRAPHY
 ANALYZING CITIES & POPULATION: POPULATION GEOGRAPHY Population Geography Population Geography study of the number, contribution, and distribution of human populations Demography the study of the characteristics
City of Hermosa Beach Beach Access and Parking Study. Submitted by. 600 Wilshire Blvd., Suite 1050 Los Angeles, CA
 City of Hermosa Beach Beach Access and Parking Study Submitted by 600 Wilshire Blvd., Suite 1050 Los Angeles, CA 90017 213.261.3050 January 2015 TABLE OF CONTENTS Introduction to the Beach Access and Parking
Rules of the territorial division
 Rules of the territorial division Janusz Dygaszewicz Central Statistical Office of Poland Jerusalem, 4-7 December 2016 Rules of territory division (the Polish case) The area of each unit of territorial
Neighborhood Locations and Amenities
 University of Maryland School of Architecture, Planning and Preservation Fall, 2014 Neighborhood Locations and Amenities Authors: Cole Greene Jacob Johnson Maha Tariq Under the Supervision of: Dr. Chao
5.2. Historic heritage. Photo: Vaughan Homestead, Long Bay Regional Park, Auckland. (Source: ARC). Historic heritage
. Historic heritage") Photo: Vaughan Homestead, Long Bay Regional Park, Auckland. (Source: ARC). 274 Hazards and heritage Contents 5.2 Introduction 276 monitoring programmes 276 The state of historic heritage 277 Heritage items
Photo: Vaughan Homestead, Long Bay Regional Park, Auckland. (Source: ARC). 274 Hazards and heritage Contents 5.2 Introduction 276 monitoring programmes 276 The state of historic heritage 277 Heritage items
GIS for the Non-Expert
 GIS for the Non-Expert Ann Forsyth University of Minnesota February 2006 GIS for the Non-Expert 1. Definitions and problems 2. Measures being tested in Twin Cities Walking Study Basic approach, data, variables
Sample assessment task. Task details. Content description. Year level 7
 Sample assessment task Year level 7 Learning area Subject Title of task Task details Description of task Type of assessment Purpose of assessment Assessment strategy Evidence to be collected Suggested
Kimberly J. Mueller Risk Management Solutions, Newark, CA. Dr. Auguste Boissonade Risk Management Solutions, Newark, CA
 1.3 The Utility of Surface Roughness Datasets in the Modeling of United States Hurricane Property Losses Kimberly J. Mueller Risk Management Solutions, Newark, CA Dr. Auguste Boissonade Risk Management
Valuation of environmental amenities in urban land price: A case study in the Ulaanbaatar city, Mongolia
 1989 1990 1991 1992 1993 1994 1995 1996 1997 1998 1999 2000 2001 2002 2003 2004 2005 2006 2007 2008 2009 2010 2011 Population Valuation of environmental amenities in urban land price: A case study in the
Module 3 Indicator Land Consumption Rate to Population Growth Rate
 Regional Training Workshop on Human Settlement Indicators Module 3 Indicator 11.3.1 Land Consumption Rate to Population Growth Rate Dennis Mwaniki Global Urban Observatory, Research and Capacity Development
Negative Exponential Model Parameters and Centralization in Large Urban Areas in the U.S.,
 Negative Exponential Model Parameters and Centralization in Large Urban Areas in the U.S., 1950-2010 Abstract John R. Ottensmann Indiana University-Purdue University Indianapolis john.ottensmann@gmail.com
Technical Memorandum #2 Future Conditions
 Technical Memorandum #2 Future Conditions To: Dan Farnsworth Transportation Planner Fargo-Moorhead Metro Council of Governments From: Rick Gunderson, PE Josh Hinds PE, PTOE Houston Engineering, Inc. Subject:
SECTION II PUERTO RICO BROADBAND INFRASTRUCTURE
 SECTION II PUERTO RICO BROADBAND INFRASTRUCTURE 2011-2014 This section analyzes the most current broadband inventory across Puerto Rico and identifies broadband infrastructure gaps at various connection
Passenger Transportation Networks & Urbanization Level: A Comparison of Classification Schemes
 Pyrialakou, Nlenanya, Gkritza 0 0 Passenger Transportation Networks & Urbanization Level: A Comparison of Classification Schemes V. Dimitra Pyrialakou (Corresponding author) Graduate Research Assistant,
Philip A. Ginsburg, General Manager Dawn Kamalanathan, Director, Capital & Planning Division
 Date June 3, 2015 To: Through: From: Subject: Recreation and Park Commission Capital Committee Philip A. Ginsburg, General Manager Dawn Kamalanathan, Director, Capital & Planning Division Stacy Bradley,
Deriving Spatially Refined Consistent Small Area Estimates over Time Using Cadastral Data
 Deriving Spatially Refined Consistent Small Area Estimates over Time Using Cadastral Data H. Zoraghein 1,*, S. Leyk 1, M. Ruther 2, B. P. Buttenfield 1 1 Department of Geography, University of Colorado,
Regional Performance Measures
 G Performance Measures Regional Performance Measures Introduction This appendix highlights the performance of the MTP/SCS for 2035. The performance of the Revenue Constrained network also is compared to
Census Transportation Planning Products (CTPP)
") Census Transportation Planning Products (CTPP) Penelope Weinberger CTPP Program Manager - AASHTO September 15, 2010 1 What is the CTPP Program Today? The CTPP is an umbrella program of data products, custom
Census Transportation Planning Products (CTPP) Penelope Weinberger CTPP Program Manager - AASHTO September 15, 2010 1 What is the CTPP Program Today? The CTPP is an umbrella program of data products, custom
Second High Level Forum on GGIM Seminar on Regional Cooperation in Geospatial Information Management Doha, Qatar, 7 February 2013
 Second High Level Forum on GGIM Seminar on Regional Cooperation in Geospatial Information Management Doha, Qatar, 7 February 2013 Overview on Geospatial Activities in Egypt BY : Eng.Nahla Seddik Mohamed
Mapping Accessibility Over Time
 Journal of Maps, 2006, 76-87 Mapping Accessibility Over Time AHMED EL-GENEIDY and DAVID LEVINSON University of Minnesota, 500 Pillsbury Drive S.E., Minneapolis, MN 55455, USA; geneidy@umn.edu (Received
CARIBBEAN POPULATION AND DEVELOPMENT TRENDS AND INTERRELATIONS: A ASSESSMENT VOLUME 1
 LC/CAR/G.352 ECONOMIC COMMISSION FOR LATIN AMERICA AND THE CARIBBEAN Subregional Headquarters for the Caribbean ECLAC/CELADE DEMOGRAPHY UNIT jc:.'arlv'- H. CARIBBEAN POPULATION AND DEVELOPMENT TRENDS AND
URBAN CHANGE DETECTION OF LAHORE (PAKISTAN) USING A TIME SERIES OF SATELLITE IMAGES SINCE 1972
 USING A TIME SERIES OF SATELLITE IMAGES SINCE 1972") URBAN CHANGE DETECTION OF LAHORE (PAKISTAN) USING A TIME SERIES OF SATELLITE IMAGES SINCE 1972 Omar Riaz Department of Earth Sciences, University of Sargodha, Sargodha, PAKISTAN. omarriazpk@gmail.com ABSTRACT
URBAN CHANGE DETECTION OF LAHORE (PAKISTAN) USING A TIME SERIES OF SATELLITE IMAGES SINCE 1972 Omar Riaz Department of Earth Sciences, University of Sargodha, Sargodha, PAKISTAN. omarriazpk@gmail.com ABSTRACT
Population Density and Growth. Distribution of people on Earth
 Population Density and Growth Distribution of people on Earth Population Density! Terminology!! Population density is a measure of how compact or concentrated a population is. It takes area of land into
IV. ENVIRONMENTAL IMPACT ANALYSIS B. AESTHETICS SHADE/SHADOW
 IV. ENVIRONMENTAL IMPACT ANALYSIS B. AESTHETICS SHADE/SHADOW 1. INTRODUCTION Potential effects of the Proposed Project related to visual character, views and light/glare are addressed in Section IV.A,
Spotlight on Population Resources for Geography Teachers. Pat Beeson, Education Services, Australian Bureau of Statistics
 Spotlight on Population Resources for Geography Teachers Pat Beeson, Education Services, Australian Bureau of Statistics Population Population size Distribution Age Structure Ethnic composition Gender
The Road to Data in Baltimore
 Creating a parcel level database from high resolution imagery By Austin Troy and Weiqi Zhou University of Vermont, Rubenstein School of Natural Resources State and local planning agencies are increasingly
Final Group Project Paper. Where Should I Move: The Big Apple or The Lone Star State
 Final Group Project Paper Where Should I Move: The Big Apple or The Lone Star State By: Nathan Binder, Shannon Scolforo, Kristina Conste, Madison Quinones Main Goal: Determine whether New York or Texas
Introducing GIS analysis
 1 Introducing GIS analysis GIS analysis lets you see patterns and relationships in your geographic data. The results of your analysis will give you insight into a place, help you focus your actions, or
Urban Hydrology - A Case Study On Water Supply And Sewage Network For Madurai Region, Using Remote Sensing & GIS Techniques
 RESEARCH INVENTY: International Journal of Engineering and Science ISBN: 2319-6483, ISSN: 2278-4721, Vol. 1, Issue 8 (November 2012), PP 07-12 www.researchinventy.com Urban Hydrology - A Case Study On
UNIT 1: Pa-erns in Human Geography. Chapter 1: Where people live.
 UNIT 1: Pa-erns in Human Geography Chapter 1- Where people live. Chapter 2- How they live. Chapter 3- How we use the Earth Chapter 4- How we work. Chapter 5- Consequences. Chapter 1: Where people live.
2010 Census Data Release and Current Geographic Programs. Michaellyn Garcia Geographer Seattle Regional Census Center
 2010 Census Data Release and Current Geographic Programs Michaellyn Garcia Geographer Seattle Regional Census Center 2010 Center of Population Located approximately 2.7 miles northeast of Plato, Missouri
Who Donated to Bernie Sanders? Exploring Determining Factors with Location-based Information
 Who Donated to Bernie Sanders? Exploring Determining Factors with Location-based Information URP4273 Final Project Group 3 James Reinders, Brandon Escalante, Eduard Tora-Bueno, and Jake de Leon Background
Secondary Towns and Poverty Reduction: Refocusing the Urbanization Agenda
 Secondary Towns and Poverty Reduction: Refocusing the Urbanization Agenda Luc Christiaensen and Ravi Kanbur World Bank Cornell Conference Washington, DC 18 19May, 2016 losure Authorized Public Disclosure
The 3V Approach. Transforming the Urban Space through Transit Oriented Development. Gerald Ollivier Transport Cluster Leader World Bank Hub Singapore
 Transforming the Urban Space through Transit Oriented Development The 3V Approach Gerald Ollivier Transport Cluster Leader World Bank Hub Singapore MDTF on Sustainable Urbanization The China-World Bank
Attachment E: CADP Design Shadow Analysis
 Attachment E: CADP Design Shadow Analysis June 6, 2016 TO: Don Lewis San Francisco Planning Department 1650 Mission Street, Suite 400 San Francisco, CA 94103 SUBJECT: 2060 Folsom Street 17 th & Folsom
The 2020 Census Geographic Partnership Opportunities
 The 2020 Census Geographic Partnership Opportunities Web Adams Geographer, U.S. Census Bureau New York Regional Office 1 Geographic Partnership Opportunities The 2020 Census Local Update of Census Addresses
Po P pulat pula ion Change Chang and Urban Expansion Cormac Walsh W
 Population Change and Urban Expansion Cormac Walsh Introduction This first thematic chapter examines the spatial ilpatterns of urban expansion and population change over the 1990 2006 period. The Dublin
Summary and Implications for Policy
 Summary and Implications for Policy 1 Introduction This is the report on a background study for the National Spatial Strategy (NSS) regarding the Irish Rural Structure. The main objective of the study
PRELIMINARY WORKING DRAFT Work in Progress
 IV. ENVIRONMENTAL IMPACT ANALYSIS H. MINERAL RESOURCES 1.0 INTRODUCTION This section addresses the potential impacts of the Proposed Project on mineral resources (i.e., sand, gravel and petroleum). The
GEOGRAPHY. Western Australian Certificate of Education Examination, Question/Answer Booklet. Stage 3
 Western Australian Certificate of Education Examination, 2015 Question/Answer Booklet GEOGRAPHY Stage 3 Please place your student identification label in this box Student Number: In figures In words Time
KENTUCKY HAZARD MITIGATION PLAN RISK ASSESSMENT
 KENTUCKY HAZARD MITIGATION PLAN RISK ASSESSMENT Presentation Outline Development of the 2013 State Hazard Mitigation Plan Risk Assessment Determining risk assessment scale Census Data Aggregation Levels
Spatial multicriteria analysis for home buyers
 Spatial multicriteria analysis for home buyers Xavier Albacete University of Eastern Finland, Department of Environmental Science, Research Group of Environmental Informatics, Yliopistoranta 1 E, P.O.
MULTI-YEAR AVERAGES FROM A ROLLING SAMPLE SURVEY
 MULTI-YEAR AVERAGES FROM A ROLLING SAMPLE SURVEY Nanak Chand Charles H. Alexander U.S. Bureau of the Census Nanak Chand U.S. Bureau of the Census Washington D.C. 20233 1. Introduction Rolling sample surveys
INDOOR RADON MAPPING FOR NEW YORK STATE
 INDOOR RADON MAPPING FOR NEW YORK STATE C. Kunz, J. Green, C. Schwenker, E. Rigilski, and M. Kitto NYS Department of Health, Wadsworth Center, Empire State Plaza Albany, NY ABSTRACT The percent of homes
Problems In Large Cities
 Chapter 11 Problems In Large Cities Create a list of at least 10 problems that exist in large cities. Consider problems that you have read about in this and other chapters and/or experienced yourself.