ENERGY IN THE URBAN ENVIRONMENT: USE OF TERRA/ASTER IMAGERY AS A TOOL IN URBAN PLANNING N. CHRYSOULAKIS*
|
|
|
- Gordon Green
- 6 years ago
- Views:
Transcription
1 ENERGY IN THE URBAN ENVIRONMENT: USE OF TERRA/ASTER IMAGERY AS A TOOL IN URBAN PLANNING N. CHRYSOULAKIS* Foundation for Research and Technology Hellas, Institute of Applied and Computational Mathematics, Regional Analysis Division, FORTH - IACM, Vassilika Vouton, P.O. Box 1527, GR-71110, Heraklion, Crete, Greece. (tel , fax , zedd2@iacm.forth.gr) Abstract. In this study Terra/ASTER imagery was analysed together with in-situ spatial data to examine the potential of multi-spectral remote sensing to support urban planning. The potential of ASTER imagery to support energy budget estimation was also examined by defining and mapping some microclimatic parameters for the centre of the city of Athens. Images in visible, near infrared and thermal infrared areas of the electromagnetic spectrum were processed to define the urban land cover and topographic characteristics as well as to estimate the spatial distributions of vegetation, visible reflected radiation and brightness temperature. It was founded that ASTER muli-spectral imagery enables a better understanding of energy aspects, their causes and effects, providing an important addition to conventional methods of monitoring the urban environment. INTRODUCTION It is well known that sustainable urban planning, which gives consideration to the environment and to the quality of life of the inhabitants, is a relatively new practice. Many cities around the world were not built as the result of overall planning but rather like a cancerous spread of the built up area outwards, from an old, sometimes ancient, nucleus. Among the sins of the city builders one may speak of high rise buildings along sea-fronts, narrow streets often perpendicular to the direction of the prevailing winds, insufficient or non-existent building installations and others. Furthermore some industries and the ever growing volume of motor vehicles entering and moving in the urban areas are direct source of heating through the thermal emissions of machines, furnaces and engines, as well as indirect sources by means of polluting gasses and particles released into the atmosphere. Thus, it becomes increasingly important to study urban climatic environments and to apply this knowledge to improve people s environment in cities. Urbanization leads to a very high increase of energy use. Increased urban temperatures have a direct effect on the energy consumption of buildings especially during the summer period. It is reported Key Words: Multi-spectral Remote Sensing, Urban Monitoring, Urban Planning, Energy Budget.
2 that the rate of change in energy use is twice the rate of change in urbanization. In fact it is found that higher urban temperatures increase the electricity demand for cooling and the production of carbon dioxide and other pollutants (Santamouris et al. 2000). The urban surfaces and atmosphere interactions are governed by the surface heat fluxes. The distribution of these fluxes is drastically modified by the urbanization. Main contributing factors are: changes in physical characteristics of the surface (albedo, thermal capacity, heat conductivity) owing to the surface replacement of vegetation by asphalt and concrete; the decrease of surface moisture available for evapotranspiration; changes in the relative fluxes and in the near surface flow, owing to the complicated geometry of streets and tall buildings and anthropogenic heat (Dousset and Gourmelon, 2001). Cooling in urban areas is highly affected by the temperature distribution in the city. Effective design of passively cooled urban buildings requires a good understanding of the urban climate characteristics and in particular on the temperature distribution. Satellite remote sensing is a relative new tool for monitoring the urban environment, enabling a better understanding of energy aspects, their causes and effects. Use of satellite imagery allows for instantaneous observation of large areas providing an important addition to conventional methods of monitoring the urban environment. Satellite sensors observing in the visible area of the electromagnetic spectrum with spatial resolution around 10 m are capable for monitoring the urban land cover characteristics. Sensors observing in the thermal infrared with spatial resolution better than 100 m may be used to produce thermal maps of urban areas. The 100 m spatial resolution enables work with average temperature (which include thermal emissions of buildings, streets, vegetation, etc), thus giving an overview of the urban area, which may be characterized by warmer and cooler zones caused by different types of building, roads, parks, bare ground or even archaeological sites. The main objective of this study is to present the potential of multi-spectral remote sensing to support urban planning by estimating the spatial distribution and intensities of physical parameters with relation to the urban energy budget. Within this framework the objectives are: Physical classification of the urban land cover and the heat sources in the study area; Estimation and mapping of radiation budget parameters such as topographic relief, densely built areas, roads, vegetated areas, as well as reflected radiation and temperature spatial distributions in a city centre; Study of the effects of different types of built-up area and different land uses on the urban radiation budget;
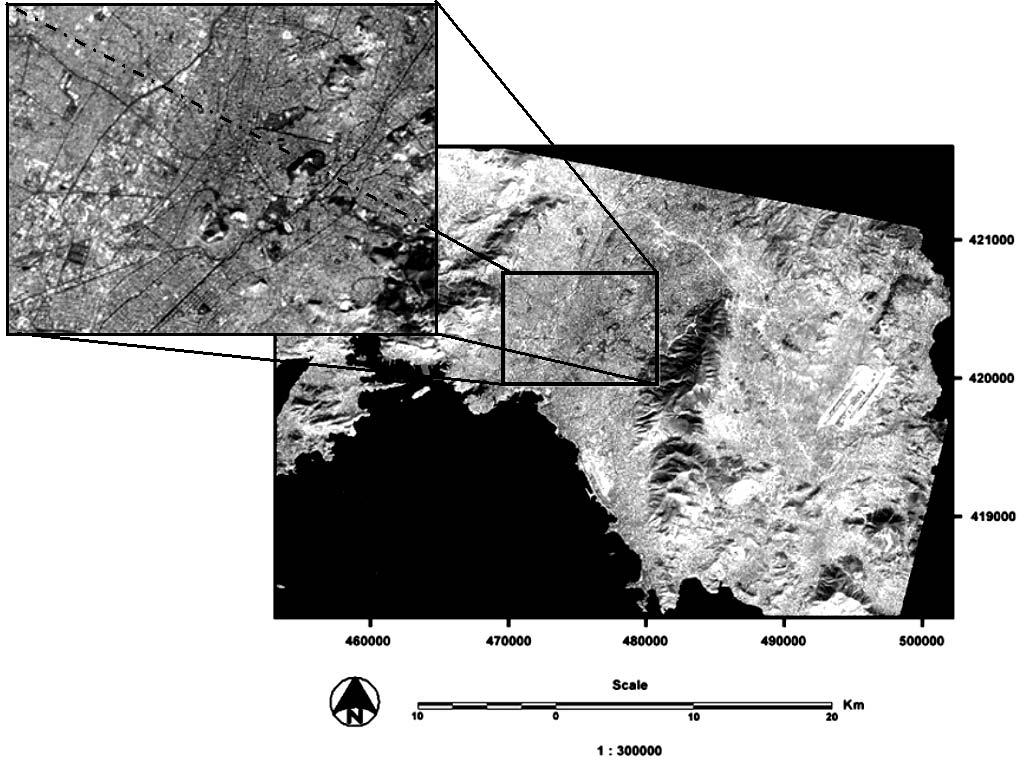
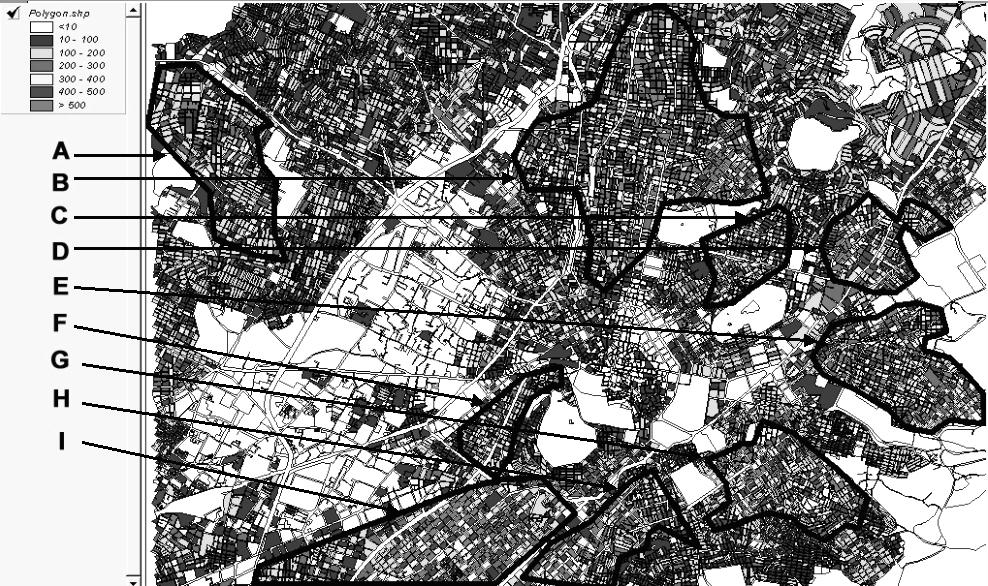
3 DATA AND METHODOLOGY The data used in this study are a Terra/ASTER image of October 30, 2001 (09.27 LST) over the region of Attica (60 x 60 Km scene) and the vectors of the road network and the spatial distribution of population for the city of Athens which have been derived from in-situ spatial information. A Transverse Mercator projection was applied (Projection System: Hellenic Geodetic Reference System 87 - HGRS87; Reference Ellipsoid: GRS80) in order to have all data in the same cartographic projection system. The Advanced Spaceborne Thermal Emission and Relfection Radiometer (ASTER) is an advanced multispectral imager that was launched on board NASA s Terra spacecraft in December, ASTER covers a wide spectral region with 14 bands from the visible to the thermal infrared with high spatial, spectral and radiometric resolution. ASTER consists of three separate instruments subsystems, each operating in a different spectral region, using separate optical system. These subsystems are the Visible and Near Infrared (VNIR), the Short Wave Infrared (SWIR) and the thermal infrared (TIR). The spatial resolution varies with wavelength: 15 m in the VNIR, 30 m in the SWIR and 90 m in the TIR. The VNIR subsystem consists of two telescopes one nadir looking with a there band detector (Channels 1, 2 and 3N) and the other backward looking (27.7 off-nadir) with a single band detector (Channel 3B). Because the nadir looking and the backward looking VNIR instrument can obtain data of the same area from two different angles, therefore stereo ASTER data can be used to produce Digital Elevation Models (DEMs). The spectral ranges of ASTER VNIR Channels are (Abrams and Hook 2001): Channel 1: µm; Channel 2: µm; Channel 3N: µm; Channel 3B: µm. The TIR subsystem consists of one telescope with a five band detector (Channels 10, 11, 12, 13, and 14). Only Channel 10 ( µm) is used in this study in order to estimate the brightness temperature spatial distribution for the centre of the city of Athens. Athens, the capital of Greece concentrates about half of the population of the Country. It is located in a basin, which is bounded by the mountains Egaleo to the West, Parnes to the north and Imitos to the east. To the south the basin is bounded by the Saronikos Gulf. The area under study is the centre of the metropolitan city of Athens. It is presented in Figure 1 (ASTER Channel 2), where the vegetated areas and the main road network are depicted in dark tones. Figure 2 presents the spatial distribution of population in the area of concern as has been derived from in situ-data. The sub-areas in which the population concentration is maximum have been separated and labelled in this Figure (polygons A - I). These sub-areas represent the most densely built areas which are of great importance for the definition of the energy balance in urban environment. The relative positions of these polygons as well as the topography of the whole area are also very important when environmental parameters should be estimated.
4 Terrain elevation data derived by applying photogrammetric processes to overlapping stereo pairs from ASTER. Channels 3N and 3B were used for the production of a DEM for the area of concern. Because geometric deviation between adjacent ASTER images were expected to be less than a single pixel, DEM was directly produced by applying a digital stereo correlation to calculate parallax differences. The net balance between the solar gains and the heat loss by emitted long wave radiation determines the thermal balance of urban areas. Temperature distribution in urban areas is highly affected by the urban radiation budget. Solar radiation incident on the urban surfaces is absorbed and then transformed to sensible heat. Most of the solar radiation impinges on roofs, and the vertical walls of the buildings, and only a relative small part reaches the ground level. Walls, roofs and the ground emit long wave radiation to the sky. The intensity of the emitted radiation depends to the view factor of the surface regarding the sky. Although the entire energy budget can not be estimated solely from remote sensed data, several important components can be derived from the data discussed here. The surface reflectance can be estimated from the visible ASTER Channel 1. The index of vegetation can be calculated from the normalized difference of the visible and near infrared channels (ASTER Channels 2 and 3N). The calibrated brightness temperature can be derived from the thermal infrared ASTER channel 10. Vegetation has various effects on urban environment. In order to dissipate the sensible heat from solar radiation and warm air, the vegetation transpire moisture. This phenomenon is called evapotranspiration and represents the main part of the thermal balance of vegetation. During the day, two-thirds of the net all wave radiation flux is used to evaporate water, the last third is dissipated in the sensible heat flux since the net energy storage is very small. Urban vegetation (mainly parks) is the mail source of latent heat in urban environment. For these reasons the relative position of vegetated areas in urban web must be taken into account in urban planning studies. In this study, the calculated Normalized Difference Vegetation Index (NDVI) was used for the classification of vegetated areas and finally for urban vegetation mapping. NDVI was calculated from Digital Numbers (DN) of ASTER Channels 2 and 3N using the formula: Channel 3N Channel 2 NDVI = (1) Channel 3N + Channel 2 An experimentally derived threshold was applied to NDVI values in order to separate pixels corresponding to vegetation in the original ASTER image. Following, a level slicing and pseudocolouring of these pixels took place to characterize and map urban vegetation. Surface emissivity is a measure of the inherent efficiency of the surface in converting heat energy into radiant energy above the surface. It depends on the composition, roughness and moisture content of the surface and on the observation conditions (wavelength, pixel resolution and
5 observation angle). Surface reflectance for each ASTER VNIR Channels can be obtained by applying an atmospheric correction to radiances reported by the ASTER sensor. The atmospheric correction removes effects due to changes in satellite-sun geometry and atmospheric conditions. The actual atmospheric correction is the process of retrieving the surface radiance and surface reflectance from the satellite radiances. To do this, the scattering and absorbing properties of the atmosphere are determined. Columnar amounts of absorbing gases are used to compute the sun-tosurface-to-satellite gaseous transmittance. The satellite radiances are divided by these transmittances to determine a satellite radiance for an atmosphere which does not contain gaseous absorption. The scattering optical depths, single scatter albedo, and size distribution are used along with the solar and view angles. In this study the spatial variations of surface reflectance were estimated on the basis of Radiance at the Sensor for each pixel of the satellite image which was calculated using the DN of the visible ASTER Channel 1. To convert from DN to Radiance at the Sensor, the unit conversion coefficients (defined as radiance per 1 DN) are used. Spectral Radiance is expressed in unit of W/(m 2 sr m). The radiance can be obtained from DN values as follows: Radiance at the Sensor = ( DN 1) UCC (2) where, UCC is the Unit Conversion Coefficient for each ASTER Channel in W/(m 2 sr m)/dn. For Channel 1 UCC values are for high gain, for normal gain and 2.25 for low gain (Abrams and Hook 2001). Estimating surface temperature through satellite thermal infrared data is accomplished at the precondition that the variability of the emission coefficients as well as atmospheric absorption are taken into account (Price 1984, Becker 1987, Becker and Li 1990, Vidal 1991, Sobrino et al. 1991, Kerr et al. 1992, Ottle and Vidal-Madjar 1992, Coll et al. 1994, Prata 1993, Prata et al. 1995, Casselles et al. 1997, Chrysoulakis and Cartalis 2002). Brightness Temperature (BT) differs from actual surface temperature due to several effects: partial absorption of blackbody radiation by the atmosphere; land surface emissivity being less than 1 and spatially and spectrally variable (Becker 1987); sub-pixel variations of surface temperature being averaged non-linearly due through Plank s law (Dousset et al. 1993); urban geometry trapping radiated and incident energy in urban canyon, effectively increasing the pixel average emissivity; non-vertical satellite viewing angles biasing towards vertical wall and hiding horizontal surfaces (Voot and Oke 1997). In this study, the spatial distribution of BT was calculated for the area of concern in order to show the potential of ASTER sensor for urban planning. ASTER Channel 10 was used to compute temperature as a function of spectral sensor radiance. Because Plank s equation cannot be inverted
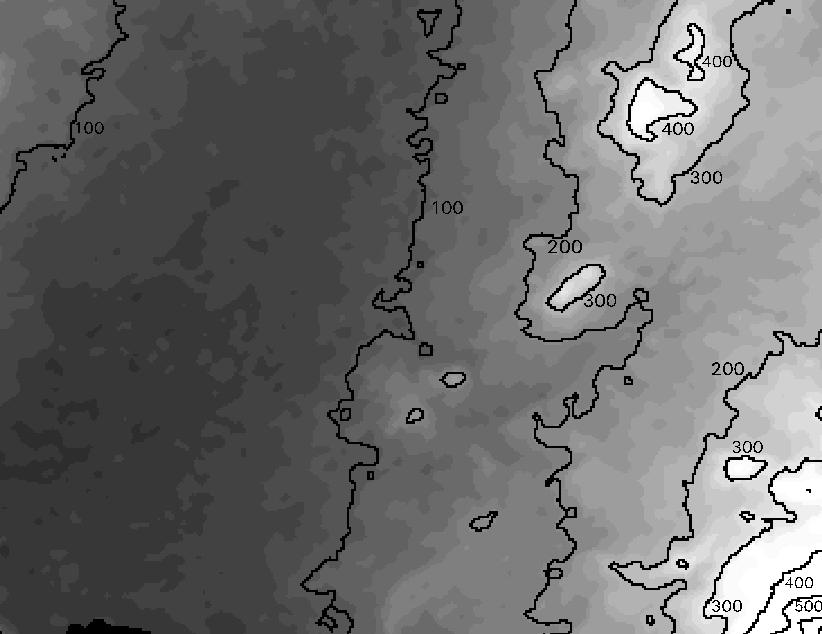
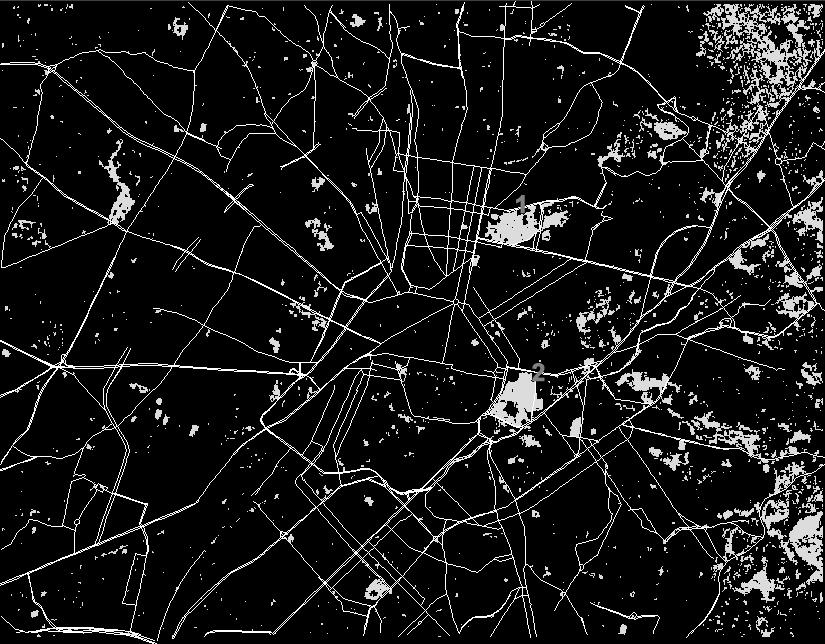
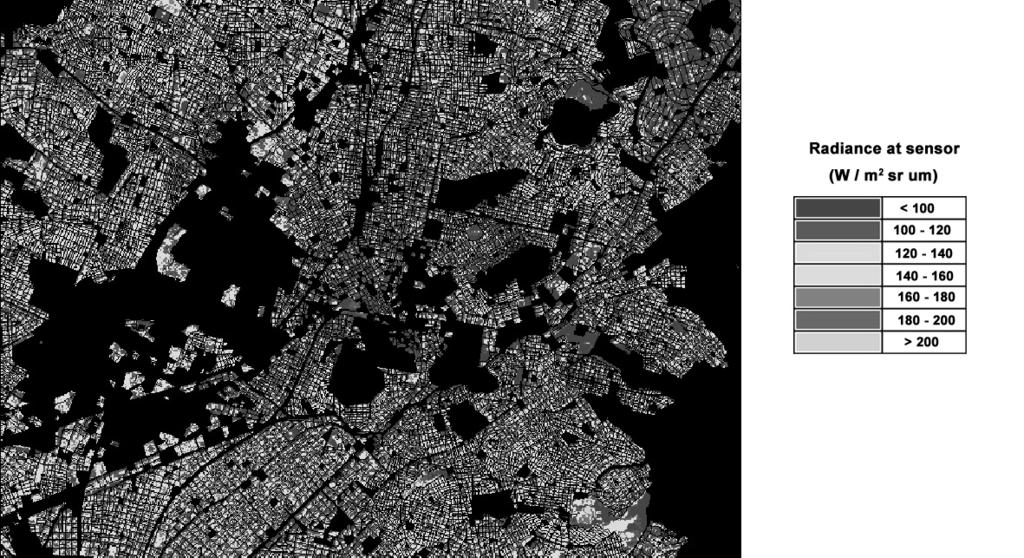
6 explicitly the central wavelength method was used as the most straightforward approximation (Alley and Jentoft-Nilsen 1999). Under this approximation, BT was calculated as follows: c2 BT = c1 λc ln ( 5 λ πl c s (3) + 1) where, c 1 is the first radiation constant ( x W m 3 m -1 ), c 2 is the second radiation constant ( m K), λ c is the central wavelength for the ASTER Channel 10 (m), L s is the radiance observed by the sensor (W m -2 sr -1 m -1 ). L s was calculated for each pixel using the DN of the thermal infrared ASTER Channel 10. To convert from DN to Radiance at the Sensor the equation (2) was used with UCC for ASTER Channel 10 (6.822x10⁻³ W/(m 2 sr m)/dn). Equation (3) is accurate for the observed radiance that yields the standard temperature, but it becomes increasingly inaccurate for temperatures farther away from the standard temperature (Alley and Jentoft-Nilsen 1999). RESULTS Figure 3 presents the DEM for the centre of Athens as it has been derived from ASTER Channels 3N and 3B digital stereo correlation. The horizontal spatial resolution of this DEM has been set to 30 x 30 m, whereas its vertical resolution has been set to 10 m. 100 m contour lines are also shown. Imitos mountain (lower right corner), as well as Likabetus (centre right) and Tourkovounia (upper right corner) hills are clearly depicted. The spatial distribution of vegetation at the area of concern is presented in Figure 4 (white areas). As it has been already noticed, this urban vegetation mapping was based on NDVI values derived from ASTER Channels 2 and 3N. The main road network has been also added in Figure 4. Central Athens Park as well as National Garden are clearly depicted (areas 1 and 2 respectively). The massive vegetation area at the lower right park corresponds to Imitos mountain. Figure 5 presents the spatial distribution of Radiance at the Sensor for densely built areas of the centre of Athens, which was calculated using the DN values of ASTER Channel 1. The densely built areas were separated by applying a digital mask to the original image. This mask was produced with the use of ASTER derived DEM and NDVI in combination with the vectors of the road network and the spatial distribution of population. Thereby, during this special digital filtering process, the pixels corresponded to mountains, hills, vegetated areas, industrial or commercial areas and road network were set to zero value in the final image.
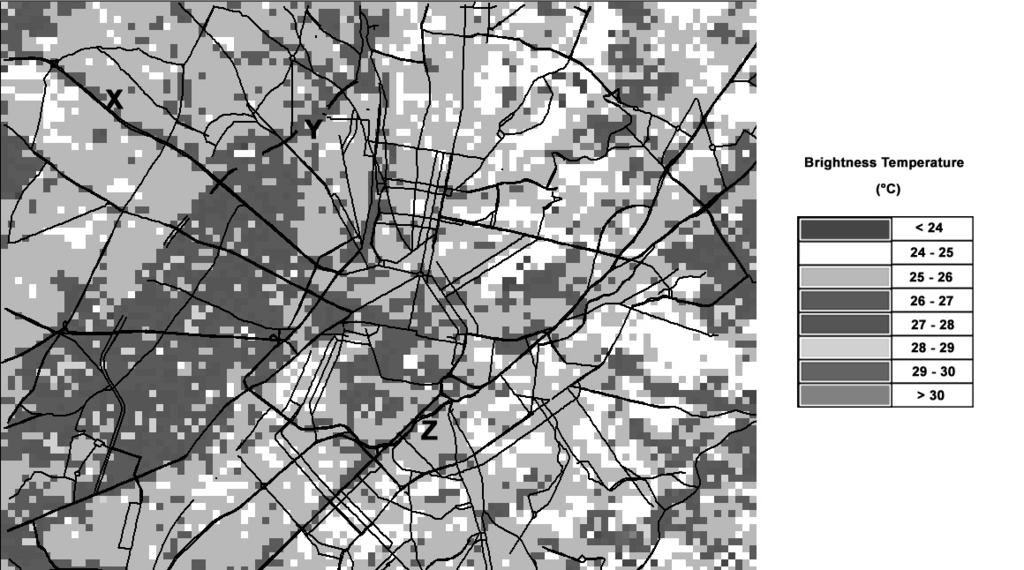
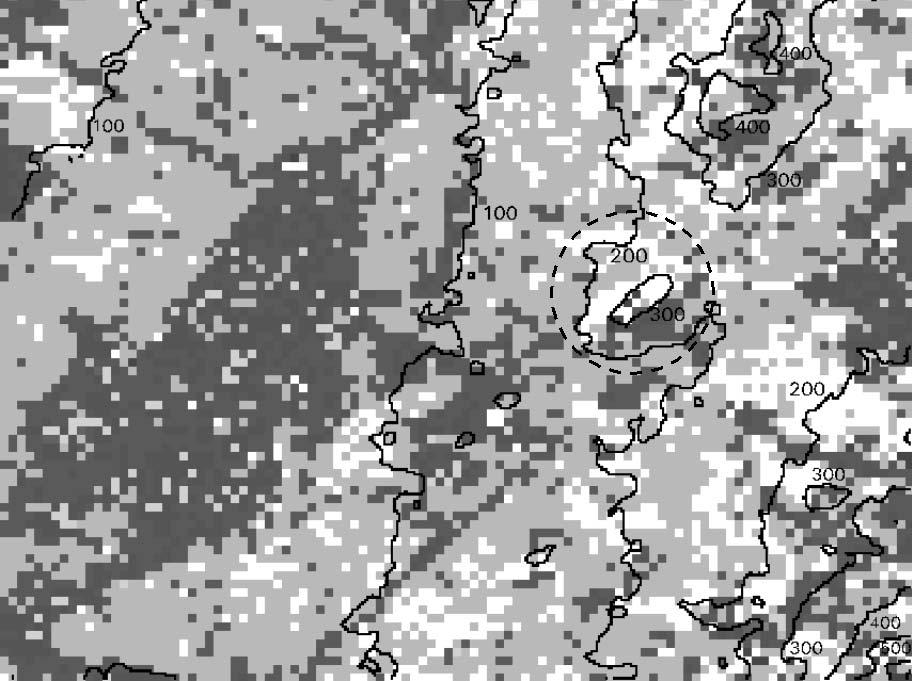
7 Visual inspection and comparison of Figures 2, 4 and 5 indicates that Radiance at the Sensor obtains minimum values ( 100 W/m 2 sr um) around the vegetated areas (i.e. upper left corner). This may happen for two reasons: The first reason is that these areas are medium densely built areas with lower albedo in Channel 1. The second reason is that some pixels containing vegetation have not been masked (the spatial resolution of ASTER Channel 1 is 15 m, thus sub-pixel isolated vegetated areas can not be detected). High densely built sub-areas (polygons A - I in Figure 2) obtain also low radiance values ( 140 W/m 2 sr um). This happens because in these areas most of the solar radiation impinges on roofs, and the vertical walls of the buildings, and only a relative small part reaches the ground level. Thus, these areas obtain greater albedo than areas in which asphalt or bare soil dominate. Therefore, taking also into account the ASTER image acquisition time (09:27 UTC), lower temperatures are expected in these areas than their surroundings medium densely built, commercial or industrial areas. Figure 6 presents the spatial distribution of BT for the centre of Athens, which was calculated using the DN values of ASTER Channel 10. The main road network has been also added. It is obvious in Figure 6 that the central commercial area, as well as the extended industrial area (left) obtain greater BT values than the densely built areas (polygons A I in Figure 2). As it has already explained this fact may be attributed to: the low solar height at the time of the satellite pass (09:27 LST); the thermal capacity of the buildings which retards their warming as compared to the respective warming of the industrial areas and the areas covered by bare soil; the mountains which surround Athens which acts as a shield to incoming solar radiation at the time of the satellite pass. The role of thermal capacity and absorptivity of asphalt can be seen in Figure 6 in medium densely built areas where the incoming solar radiation is most probably to reach the ground level. Thus, for example in areas X, Y and Z the BT values along the main roads are greater than the respective values in surrounding areas. The role of mountains and hills, which act as a shield to incoming solar radiation, can be seen in Figure 7 where the 100 m contour lines have been superimposed to the BT spatial distribution. The solar azimuth was about 110 during the ASTER image acquisition time. Thus, for example the BT values along the sunward slope of Imitos hill (area which is bounded by the circle in Figure 7) are greater that the respective values of the opposite slope.
8 CONCLUSIONS In this study, the potential of multi-spectral remote sensing to support urban planning was presented by estimating the spatial distribution and intensities of physical parameters with relation to the urban radiation budget. Sustainable urban planning demands the study urban climatic environments and the application of this knowledge to improve the quality of life of the inhabitants. ASTER mulispectral imagery enables a better understanding of energy aspects, their causes and effects providing an important addition to conventional methods of monitoring the urban environment. The optical characteristics of materials used in urban environments and especially the albedo to solar radiation and emissivity to long wave radiation have a very important impact to the urban energy balance. It was founded that ASTER images in the visible and thermal infrared areas of the electromagnetic spectrum can provide considerable information for the microclimatic conditions of the Athens area, whereas the perspective images in the visible and near infrared parts of spectrum allow the definition of land cover in terms of urban, industrial and vegetated areas. Although the entire energy budget can not be estimated solely from ASTER data, some important components which were derived from these data were presented here. Products as spatial distribution of BT are important for studying microclimate in urban areas and its variations, for defining the energy budget in a heavily populated areas such Athens, for assisting energy demand and management studies and for examining the links between the prevailing microclimatic conditions and the air pollution levels. The various thematic layers which were presented in this study can be integrated with other satellite or in-situ derived information in a GIS platform capable to support sustainable urban planning. Such a GIS platform will have the potential to be an effective support tool for urban planners and policy makers for taking energy aspects into consideration as an important factor in determining the quality of life. Finally, it may be used to assist researchers and engineers acting as a starting point for the definition of the real energy budget in urban environments on the basis of multi-spectral satellite imagery.
9 REFERENCES Abrams, M. and Hook, S. (2001). ASTER User Handbook. The Jet Propulsion Laboratory, California Institute of Technology, Los Angeles, USA. Alley, R. E. and Jentoft-Nilsen, M. (1999). Algorithm Theoretical Basis Document for Brightness Temperature. The Jet Propulsion Laboratory, California Institute of Technology, Los Angeles, USA. Becker, F. (1987). The impact of spectral emissivity on the measurement of land surface temperature from a satellite. Int. J Remote Sensing, 8: Becker, F. and Li, Z.-L. (1990). Towards a local split window method over land surfaces. Int. J Remote Sensing, 11: Caselles, V., Coll, C. and Valor, E. (1997). Land surface emissivity and temperature determination in the whole HAPEX - Sahel area from AVHRR data. Int. J Remote Sensing, 18(5): Chrysoulakis, N. and Cartalis, C. (2000). Improving the estimation of land surface temperature for the region of Greece: (adjustment of a split window algorithm to account for the distribution of precipitable water). Int. J Remote Sensing, 23: Coll, C., Caselles, V., Sorbino, J. A. and Valor, E. (1994). On the atmospheric dependence of the split-window equation for land surface temperature. Int. J Remote Sensing, 15: Dousset, B. and Gourmelon, F. (2001). Remote Sensing Applications to the Analysis of Urban Microclimates. Proc. IEEE/ISPRS Joint Workshop on Remote Sensing and Data Fusion over Urban Areas, held at Rome in Nov Dousset, B., Flament, P. and Bernstein, R. (1993). Los Angeles fires seen from space. EOS, Trans. AGU, 74:33, Kerr, Y. H., Lagouarde, J. P. and Imbernon, J. (1992). Accurate land surface temperature retrieval from AVHRR data with the use of an improved split-window algorithm. Remote Sensing Env., 41: Ottle, C. and Vidal-Madjar, D. (1992). Estimation of land surface temperature with NOAA -9 data. Remote Sensing Env., 40: Prata, A., Caselles, V., Coll, C., Ottle, C. and Sorbino, J. (1995). Thermal remote sensing of land surface temperature from satellites: current status and future prospects. Remote Sensing Rev., 12: Prata, A. (1993). Land Surface Temperatures Derived From the Advanced Very High Resolution Radiometer and the Along-Track Scanning Radiometer 1. Theory. J. Geophys. Res., 98: Price, J. C. (1984). Land surface temperature measurements from the split window channels of the NOAA -7 AVHRR. J. Geophys. Res., 89: Santamouris, M., Klitsikas, N. and Niahou, K. (2000). The heat island effect on passive cooling. Information Paper, Renewables in the City Environment Project, University of Liege, ( Sobrino, J. A.., Coll, C. and Caselles, V. (1991). Atmospheric correction for land surface temperature using NOAA -11 AVHRR channels 4 and 5. Remote Sensing of Env., 38: Vidal, A. (1991). Atmospheric and emissivity correction of land surface temperature measured from satellite using ground measurements or satellite data. Int. J Remote Sensing, 12: Voogt, J. A. and Oke, T. R. (1997). Complete Urban Surface Temperatures. J. Appl. Meteorology, 36:
10 CAPTIONS Figure 1. The study area (ASTER Channel 2, October 30, 2001 at LST). Three main components are easily detected: The vegetated areas and the main road network are depicted in dark tones, whereas the urban web is depicted in light tones. Figure 2. Spatial distribution of population at the centre of Athens. Polygons A - I represent the high densely built sub-areas. Figure 3. Digital Elevation Model and 100 m contours for the centre of Athens derived from ASTER stereo data. Imitos mountain, Likabetus and Tourkovounia hills are clearly depicted. Figure 4. Urban vegetation mapping for the centre of Athens based on NDVI which has been derived from ASTER Channels 2 and 3N. Central Athens Park and National Garden are clearly depicted (areas 1 and 2 respectively). The massive vegetation area at the lower right corner corresponds to Imitos mountain. Figure 5. Spatial distribution of Radiance at the Sensor for densely built areas of the centre of Athens. High densely built sub-areas obtain low radiance values because in these areas most of the solar radiation impinges on roofs, and the vertical walls of the buildings, and only a relative small part reaches the ground level. Figure 6. Spatial distribution of brightness temperature for the centre of Athens with the main road network superimposed. The central commercial area, as well as the extended industrial area (left) obtain greater brightness temperature values than the high densely built areas. In medium densely built areas X, Y and Z the brightness temperature values along the main roads are greater the respective values in surrounding areas. Figure 7. Spatial distribution of brightness temperature for the centre of Athens with the 100 m contours superimposed. Mountains and hills acts as a shield to incoming solar radiation as in can be seen in the area which is bounded by the circle, where the brightness temperature values along the sunward slope of Imitos hill are greater that the respective values of the opposite slope.
11
12
13
14
15
16
17
Estimation of the all-wave urban surface radiation balance by use of ASTER multispectral imagery and in situ spatial data
 JOURNAL OF GEOPHYSICAL RESEARCH, VOL. 108, NO. D18, 4582, doi:10.1029/2003jd003396, 2003 Estimation of the all-wave urban surface radiation balance by use of ASTER multispectral imagery and in situ spatial
ASSESSING THERMAL RISK IN URBAN AREAS AN APPLICATION FOR THE URBAN AGGLOMERATION OF ATHENS
 ASSESSING THERMAL RISK IN URBAN AREAS AN APPLICATION FOR THE URBAN AGGLOMERATION OF ATHENS Polydoros T. and Cartalis C. Department of Environmental Physics, University of Athens, University Campus, Build
Estimation of Wavelet Based Spatially Enhanced Evapotranspiration Using Energy Balance Approach
 Estimation of Wavelet Based Spatially Enhanced Evapotranspiration Using Energy Balance Approach Dr.Gowri 1 Dr.Thirumalaivasan 2 1 Associate Professor, Jerusalem College of Engineering, Department of Civil
Applications of GIS and Remote Sensing for Analysis of Urban Heat Island
 Chuanxin Zhu Professor Peter V. August Professor Yeqiao Wang NRS 509 December 15, 2016 Applications of GIS and Remote Sensing for Analysis of Urban Heat Island Since the last century, the global mean surface
Learning Objectives. Thermal Remote Sensing. Thermal = Emitted Infrared
 November 2014 lava flow on Kilauea (USGS Volcano Observatory) (http://hvo.wr.usgs.gov) Landsat-based thermal change of Nisyros Island (volcanic) Thermal Remote Sensing Distinguishing materials on the ground
Seasonal Variations of the Urban Heat Island Effect:
 Seasonal Variations of the Urban Heat Island Effect: Examining the Differences in Temperature Between the City of Philadelphia and its Outlying Suburbs By: Frank Vecchio 1 P a g e We re calling for a high
DEPENDENCE OF URBAN TEMPERATURE ELEVATION ON LAND COVER TYPES. Ping CHEN, Soo Chin LIEW and Leong Keong KWOH
 DEPENDENCE OF URBAN TEMPERATURE ELEVATION ON LAND COVER TYPES Ping CHEN, Soo Chin LIEW and Leong Keong KWOH Centre for Remote Imaging, Sensing and Processing, National University of Singapore, Lower Kent
METRIC tm. Mapping Evapotranspiration at high Resolution with Internalized Calibration. Shifa Dinesh
 METRIC tm Mapping Evapotranspiration at high Resolution with Internalized Calibration Shifa Dinesh Outline Introduction Background of METRIC tm Surface Energy Balance Image Processing Estimation of Energy
PRINCIPLES OF REMOTE SENSING. Electromagnetic Energy and Spectral Signatures
 PRINCIPLES OF REMOTE SENSING Electromagnetic Energy and Spectral Signatures Remote sensing is the science and art of acquiring and analyzing information about objects or phenomena from a distance. As humans,
Land Surface Temperature Measurements From the Split Window Channels of the NOAA 7 Advanced Very High Resolution Radiometer John C.
 Land Surface Temperature Measurements From the Split Window Channels of the NOAA 7 Advanced Very High Resolution Radiometer John C. Price Published in the Journal of Geophysical Research, 1984 Presented
Lectures 7 and 8: 14, 16 Oct Sea Surface Temperature
 Lectures 7 and 8: 14, 16 Oct 2008 Sea Surface Temperature References: Martin, S., 2004, An Introduction to Ocean Remote Sensing, Cambridge University Press, 454 pp. Chapter 7. Robinson, I. S., 2004, Measuring
Comparison between Land Surface Temperature Retrieval Using Classification Based Emissivity and NDVI Based Emissivity
 Comparison between Land Surface Temperature Retrieval Using Classification Based Emissivity and NDVI Based Emissivity Isabel C. Perez Hoyos NOAA Crest, City College of New York, CUNY, 160 Convent Avenue,
Surface temperature what does this data tell us about micro-meteorological processes?
 Surface temperature what does this data tell us about micro-meteorological processes? Prof. Dr. Eberhard Parlow Meteorology, Climatology and Remote Sensing (MCR Lab) Department of Environmental Sciences
9/12/2011. Training Course Remote Sensing - Basic Theory & Image Processing Methods September 2011
 Training Course Remote Sensing - Basic Theory & Image Processing Methods 19 23 September 2011 Introduction to Remote Sensing Michiel Damen (September 2011) damen@itc.nl 1 Overview Electro Magnetic (EM)
Warming Earth and its Atmosphere The Diurnal and Seasonal Cycles
 Warming Earth and its Atmosphere The Diurnal and Seasonal Cycles Or, what happens to the energy received from the sun? First We Need to Understand The Ways in Which Heat Can be Transferred in the Atmosphere
GMES: calibration of remote sensing datasets
 GMES: calibration of remote sensing datasets Jeremy Morley Dept. Geomatic Engineering jmorley@ge.ucl.ac.uk December 2006 Outline Role of calibration & validation in remote sensing Types of calibration
INTRODUCTION TO THERMAL REMOTE SENSING
 INTRODUCTION TO THERMAL REMOTE SENSING Professor Constantinos Cartalis Department of Environmental Physics Remote Sensing and Image Processing Research Unit National and Kapodistrian University of Athens
Influence of Clouds and Aerosols on the Earth s Radiation Budget Using Clouds and the Earth s Radiant Energy System (CERES) Measurements
 Measurements") Influence of Clouds and Aerosols on the Earth s Radiation Budget Using Clouds and the Earth s Radiant Energy System (CERES) Measurements Norman G. Loeb Hampton University/NASA Langley Research Center Bruce
Influence of Clouds and Aerosols on the Earth s Radiation Budget Using Clouds and the Earth s Radiant Energy System (CERES) Measurements Norman G. Loeb Hampton University/NASA Langley Research Center Bruce
Earth s Energy Budget: How Is the Temperature of Earth Controlled?
 1 NAME Investigation 2 Earth s Energy Budget: How Is the Temperature of Earth Controlled? Introduction As you learned from the reading, the balance between incoming energy from the sun and outgoing energy
Name(s) Period Date. Earth s Energy Budget: How Is the Temperature of Earth Controlled?
 Period Date. Earth s Energy Budget: How Is the Temperature of Earth Controlled?") Name(s) Period Date 1 Introduction Earth s Energy Budget: How Is the Temperature of Earth Controlled? As you learned from the reading, the balance between incoming energy from the sun and outgoing energy
Name(s) Period Date 1 Introduction Earth s Energy Budget: How Is the Temperature of Earth Controlled? As you learned from the reading, the balance between incoming energy from the sun and outgoing energy
MONITORING THE SURFACE HEAT ISLAND (SHI) EFFECTS OF INDUSTRIAL ENTERPRISES
 EFFECTS OF INDUSTRIAL ENTERPRISES") MONITORING THE SURFACE HEAT ISLAND (SHI) EFFECTS OF INDUSTRIAL ENTERPRISES A. Şekertekin a, *, Ş. H. Kutoglu a, S. Kaya b, A. M. Marangoz a a BEU, Engineering Faculty, Geomatics Engineering Department
MONITORING THE SURFACE HEAT ISLAND (SHI) EFFECTS OF INDUSTRIAL ENTERPRISES A. Şekertekin a, *, Ş. H. Kutoglu a, S. Kaya b, A. M. Marangoz a a BEU, Engineering Faculty, Geomatics Engineering Department
1. Weather and climate.
 Lecture 31. Introduction to climate and climate change. Part 1. Objectives: 1. Weather and climate. 2. Earth s radiation budget. 3. Clouds and radiation field. Readings: Turco: p. 320-349; Brimblecombe:
Illumination, Radiometry, and a (Very Brief) Introduction to the Physics of Remote Sensing!
 Introduction to the Physics of Remote Sensing!") Illumination, Radiometry, and a (Very Brief) Introduction to the Physics of Remote Sensing! Course Philosophy" Rendering! Computer graphics! Estimation! Computer vision! Robot vision" Remote sensing! lhm
Illumination, Radiometry, and a (Very Brief) Introduction to the Physics of Remote Sensing! Course Philosophy" Rendering! Computer graphics! Estimation! Computer vision! Robot vision" Remote sensing! lhm
Simulation and validation of land surface temperature algorithms for MODIS and AATSR data
 Tethys, 4, 27 32, 2007 www.tethys.cat ISSN-1697-1523 eissn-1139-3394 DOI:10.3369/tethys.2007.4.04 Journal edited by ACAM (Associació Catalana de Meteorologia) Simulation and validation of land surface
Interpretation of Polar-orbiting Satellite Observations. Atmospheric Instrumentation
 Interpretation of Polar-orbiting Satellite Observations Outline Polar-Orbiting Observations: Review of Polar-Orbiting Satellite Systems Overview of Currently Active Satellites / Sensors Overview of Sensor
Reminder: All answers MUST GO ON ANSWER SHEET! Answers recorded in the exam booklet will not count.
 Reminder: All answers MUST GO ON ANSWER SHEET! Answers recorded in the exam booklet will not count. 1. Identify the following acronyms; compare these platform types; provide situations where one platform
Spatial Geotechnologies and GIS tools for urban planners applied to the analysis of urban heat island. Case Caracas city, Venezuela Contribution 115.
 planners applied to the analysis of urban heat island. Case Caracas city, Venezuela Contribution 115. Fig.1 The city of Caracas, as many others Latin-American cities, has experimented a fast growth in
What are Aerosols? Suspension of very small solid particles or liquid droplets Radii typically in the range of 10nm to
 What are Aerosols? Suspension of very small solid particles or liquid droplets Radii typically in the range of 10nm to 10µm Concentrations decrease exponentially with height N(z) = N(0)exp(-z/H) Long-lived
AATSR derived Land Surface Temperature from heterogeneous areas.
 AATSR derived Land Surface Temperature from heterogeneous areas. Guillem Sòria, José A. Sobrino Global Change Unit, Department of Thermodynamics, Faculty of Physics, University of Valencia, Av Dr. Moliner,
APPLICATIONS WITH METEOROLOGICAL SATELLITES. W. Paul Menzel. Office of Research and Applications NOAA/NESDIS University of Wisconsin Madison, WI
 APPLICATIONS WITH METEOROLOGICAL SATELLITES by W. Paul Menzel Office of Research and Applications NOAA/NESDIS University of Wisconsin Madison, WI July 2004 Unpublished Work Copyright Pending TABLE OF CONTENTS
Hydrologic land cover classification mapping at local level with the combined use of ASTER multispectral imagery and GPS measurements
 Hydrologic land cover classification mapping at local level with the combined use of ASTER multispectral imagery and GPS measurements Nektarios Chrysoulakis* 1, Iphigenia Keramitsoglou 2 and Constantinos
Atmospheric Lidar The Atmospheric Lidar (ATLID) is a high-spectral resolution lidar and will be the first of its type to be flown in space.
 is a high-spectral resolution lidar and will be the first of its type to be flown in space.") www.esa.int EarthCARE mission instruments ESA s EarthCARE satellite payload comprises four instruments: the Atmospheric Lidar, the Cloud Profiling Radar, the Multi-Spectral Imager and the Broad-Band Radiometer.
www.esa.int EarthCARE mission instruments ESA s EarthCARE satellite payload comprises four instruments: the Atmospheric Lidar, the Cloud Profiling Radar, the Multi-Spectral Imager and the Broad-Band Radiometer.
Cool colored coatings for passive cooling of cities
 International Workshop on Energy Performance and Environmental 1 Cool colored coatings for passive cooling of cities A. Synnefa, A. Dandou, M. Santamouris and M. Tombrou Section Applied Physics, Physics
THE ADVANCED Spaceborne Thermal Emission and
 60 IEEE GEOSCIENCE AND REMOTE SENSING LETTERS, VOL. 4, NO. 1, JANUARY 2007 Feasibility of Retrieving Land-Surface Temperature From ASTER TIR Bands Using Two-Channel Algorithms: A Case Study of Agricultural
Thermal Infrared (TIR) Remote Sensing: Challenges in Hot Spot Detection
 Remote Sensing: Challenges in Hot Spot Detection") Thermal Infrared (TIR) Remote Sensing: Challenges in Hot Spot Detection ASF Seminar Series Anupma Prakash Day : Tuesday Date : March 9, 2004 Time : 2.00 pm to 2.30 pm Place : GI Auditorium Geophysical
Thermal Infrared (TIR) Remote Sensing: Challenges in Hot Spot Detection ASF Seminar Series Anupma Prakash Day : Tuesday Date : March 9, 2004 Time : 2.00 pm to 2.30 pm Place : GI Auditorium Geophysical
Drought Estimation Maps by Means of Multidate Landsat Fused Images
 Remote Sensing for Science, Education, Rainer Reuter (Editor) and Natural and Cultural Heritage EARSeL, 2010 Drought Estimation Maps by Means of Multidate Landsat Fused Images Diego RENZA, Estíbaliz MARTINEZ,
2.0 EFFORTS TO MONITOR GLOBAL CLIMATE CHANGE
 2.0 EFFORTS TO MONITOR GLOBAL CLIMATE CHANGE 2.1 The Earth radiation budget Averaged over the entire Earth and over the span of a year, the sun delivers approximately 340 W/m 2 of shortwave radiation.
Fundamentals of Remote Sensing
 Division of Spatial Information Science Graduate School Life and Environment Sciences University of Tsukuba Fundamentals of Remote Sensing Prof. Dr. Yuji Murayama Surantha Dassanayake 10/6/2010 1 Fundamentals
Remote Sensing of Urban Surface Temperatures
 Remote Sensing of Urban Surface Temperatures James Voogt University of Western Ontario London, Ontario, Canada This work is supported by the Natural Sciences and Engineering Research Council of Canada.
1. Introduction. Chaithanya, V.V. 1, Binoy, B.V. 2, Vinod, T.R. 2. Publication Date: 8 April DOI: https://doi.org/ /cloud.ijarsg.
 Cloud Publications International Journal of Advanced Remote Sensing and GIS 2017, Volume 6, Issue 1, pp. 2088-2096 ISSN 2320 0243, Crossref: 10.23953/cloud.ijarsg.112 Research Article Open Access Estimation
P1.34 MULTISEASONALVALIDATION OF GOES-BASED INSOLATION ESTIMATES. Jason A. Otkin*, Martha C. Anderson*, and John R. Mecikalski #
 P1.34 MULTISEASONALVALIDATION OF GOES-BASED INSOLATION ESTIMATES Jason A. Otkin*, Martha C. Anderson*, and John R. Mecikalski # *Cooperative Institute for Meteorological Satellite Studies, University of
SUPPORTING INFORMATION. Ecological restoration and its effects on the
 SUPPORTING INFORMATION Ecological restoration and its effects on the regional climate: the case in the source region of the Yellow River, China Zhouyuan Li, Xuehua Liu,* Tianlin Niu, De Kejia, Qingping
Temperature and Emissivity from AHS data in the framework of the AGRISAR and EAGLE campaigns
 AGRISAR and EAGLE Campaigns Final Workshop 15-16 October 2007 (ESA/ESTEC, Noordwijk, The Netherlands) Temperature and Emissivity from AHS data in the framework of the AGRISAR and EAGLE campaigns J. A.
Field Emissivity Measurements during the ReSeDA Experiment
 Field Emissivity Measurements during the ReSeDA Experiment C. Coll, V. Caselles, E. Rubio, E. Valor and F. Sospedra Department of Thermodynamics, Faculty of Physics, University of Valencia, C/ Dr. Moliner
Glaciology HEAT BUDGET AND RADIATION
 HEAT BUDGET AND RADIATION A Heat Budget 1 Black body radiation Definition. A perfect black body is defined as a body that absorbs all radiation that falls on it. The intensity of radiation emitted by a
ESTIMATION OF ATMOSPHERIC COLUMN AND NEAR SURFACE WATER VAPOR CONTENT USING THE RADIANCE VALUES OF MODIS
 ESTIMATION OF ATMOSPHERIC COLUMN AND NEAR SURFACE WATER VAPOR CONTENT USIN THE RADIANCE VALUES OF MODIS M. Moradizadeh a,, M. Momeni b, M.R. Saradjian a a Remote Sensing Division, Centre of Excellence
Results of the ESA-DUE UHI project
 13/12/2011 Results of the ESA-DUE UHI project Bino Maiheu (bino.maiheu@vito.be), on behalf of the UHI project Outline» Urban heat island problem» The ESA-DUE urban heat island project» UHI air temperature
Research Article A Quantitative Assessment of Surface Urban Heat Islands Using Satellite Multitemporal Data over Abeokuta, Nigeria
 International Atmospheric Sciences Volume 2016, Article ID 3170789, 6 pages http://dx.doi.org/10.1155/2016/3170789 Research Article A Quantitative Assessment of Surface Urban Heat Islands Using Satellite
May 3, :41 AOGS - AS 9in x 6in b951-v16-ch13 LAND SURFACE ENERGY BUDGET OVER THE TIBETAN PLATEAU BASED ON SATELLITE REMOTE SENSING DATA
 Advances in Geosciences Vol. 16: Atmospheric Science (2008) Eds. Jai Ho Oh et al. c World Scientific Publishing Company LAND SURFACE ENERGY BUDGET OVER THE TIBETAN PLATEAU BASED ON SATELLITE REMOTE SENSING
The EarthCARE mission: An active view on aerosols, clouds and radiation
 The EarthCARE mission: An active view on aerosols, clouds and radiation T. Wehr, P. Ingmann, T. Fehr Heraklion, Crete, Greece 08/06/2015 EarthCARE is ESA s sixths Earth Explorer Mission and will be implemented
HYPERSPECTRAL IMAGING
 1 HYPERSPECTRAL IMAGING Lecture 9 Multispectral Vs. Hyperspectral 2 The term hyperspectral usually refers to an instrument whose spectral bands are constrained to the region of solar illumination, i.e.,
Analysing Land Surface Emissivity with Multispectral Thermal Infrared Data
 2nd Workshop on Remote Sensing and Modeling of Surface Properties 9-11 June 2009, Météo France, Toulouse, France Analysing Land Surface Emissivity with Multispectral Thermal Infrared Data Maria Mira, Thomas
Lecture 2: principles of electromagnetic radiation
 Remote sensing for agricultural applications: principles and methods Lecture 2: principles of electromagnetic radiation Instructed by Prof. Tao Cheng Nanjing Agricultural University March Crop 11, Circles
The inputs and outputs of energy within the earth-atmosphere system that determines the net energy available for surface processes is the Energy
 Energy Balance The inputs and outputs of energy within the earth-atmosphere system that determines the net energy available for surface processes is the Energy Balance Electromagnetic Radiation Electromagnetic
The Atmosphere and Atmospheric Energy Chapter 3 and 4
 The Atmosphere and Atmospheric Energy Chapter 3 and 4 Size of the Earth s Atmosphere Atmosphere produced over 4.6 billion years of development Protects us from radiation Completely surrounds the earth
Modeling of Environmental Systems
 Modeling of Environmental Systems While the modeling of predator-prey dynamics is certainly simulating an environmental system, there is more to the environment than just organisms Recall our definition
AGRICULTURE DROUGHT AND FOREST FIRE MONITORING IN CHONGQING CITY WITH MODIS AND METEOROLOGICAL OBSERVATIONS *
 AGRICULTURE DROUGHT AND FOREST FIRE MONITORING IN CHONGQING CITY WITH MODIS AND METEOROLOGICAL OBSERVATIONS * HONGRUI ZHAO a ZHONGSHI TANG a, BIN YANG b AND MING ZHAO a a 3S Centre, Tsinghua University,
MSG system over view
 MSG system over view 1 Introduction METEOSAT SECOND GENERATION Overview 2 MSG Missions and Services 3 The SEVIRI Instrument 4 The MSG Ground Segment 5 SAF Network 6 Conclusions METEOSAT SECOND GENERATION
Lesson 4b Remote Sensing and geospatial analysis to integrate observations over larger scales
 Lesson 4b Remote Sensing and geospatial analysis to integrate observations over larger scales We have discussed static sensors, human-based (participatory) sensing, and mobile sensing Remote sensing: Satellite
Hyperspectral Atmospheric Correction
 Hyperspectral Atmospheric Correction Bo-Cai Gao June 2015 Remote Sensing Division Naval Research Laboratory, Washington, DC USA BACKGROUND The concept of imaging spectroscopy, or hyperspectral imaging,
Estimation of ocean contribution at the MODIS near-infrared wavelengths along the east coast of the U.S.: Two case studies
 GEOPHYSICAL RESEARCH LETTERS, VOL. 32, L13606, doi:10.1029/2005gl022917, 2005 Estimation of ocean contribution at the MODIS near-infrared wavelengths along the east coast of the U.S.: Two case studies
CORRELATION BETWEEN URBAN HEAT ISLAND EFFECT AND THE THERMAL INERTIA USING ASTER DATA IN BEIJING, CHINA
 CORRELATION BETWEEN URBAN HEAT ISLAND EFFECT AND THE THERMAL INERTIA USING ASTER DATA IN BEIJING, CHINA Yurong CHEN a, *, Mingyi DU a, Rentao DONG b a School of Geomatics and Urban Information, Beijing
Comparison of cloud statistics from Meteosat with regional climate model data
 Comparison of cloud statistics from Meteosat with regional climate model data R. Huckle, F. Olesen, G. Schädler Institut für Meteorologie und Klimaforschung, Forschungszentrum Karlsruhe, Germany (roger.huckle@imk.fzk.de
Remote Sensing C. Rank: Points: Science Olympiad North Regional Tournament at the University of Florida. Name(s): Team Name: School Name:
: Team Name: School Name:") Remote Sensing C Science Olympiad North Regional Tournament at the University of Florida Rank: Points: Name(s): Team Name: School Name: Team Number: Instructions: DO NOT BEGIN UNTIL GIVEN PERMISSION. DO
Remote Sensing C Science Olympiad North Regional Tournament at the University of Florida Rank: Points: Name(s): Team Name: School Name: Team Number: Instructions: DO NOT BEGIN UNTIL GIVEN PERMISSION. DO
COMPARISON OF NOAA/AVHRR AND LANDSAT/TM DATA IN TERMS OF RESEARCH APPLICATIONS ON THERMAL CONDITIONS IN URBAN AREAS
 COMPARISON OF NOAA/AVHRR AND LANDSAT/TM DATA IN TERMS OF RESEARCH APPLICATIONS ON THERMAL CONDITIONS IN URBAN AREAS Monika J. Hajto 1 *, Jakub P. Walawender 2,3 and Piotr Struzik 2 1 Department of Air
Chapter 2. Heating Earth's Surface & Atmosphere
 Chapter 2 Heating Earth's Surface & Atmosphere Topics Earth-Sun Relationships Energy, Heat and Temperature Mechanisms of Heat Transfer What happens to Incoming Solar Radiation? Radiation Emitted by the
Topics: Visible & Infrared Measurement Principal Radiation and the Planck Function Infrared Radiative Transfer Equation
 Review of Remote Sensing Fundamentals Allen Huang Cooperative Institute for Meteorological Satellite Studies Space Science & Engineering Center University of Wisconsin-Madison, USA Topics: Visible & Infrared
Validation of Land Surface Temperatures derived from AATSR data at the Valencia Test Site
 Validation of Land Surface Temperatures derived from AATSR data at the Valencia Test Site César Coll, Vicente Caselles, Enric Valor, Raquel Niclòs, Juan M. Sánchez and Joan M. Galve Thermal Remote Sensing
AT350 EXAM #1 September 23, 2003
 AT350 EXAM #1 September 23, 2003 Name and ID: Enter your name and student ID number on the answer sheet and on this exam. Record your answers to the questions by using a No. 2 pencil to completely fill
The Atmosphere. Importance of our. 4 Layers of the Atmosphere. Introduction to atmosphere, weather, and climate. What makes up the atmosphere?
 The Atmosphere Introduction to atmosphere, weather, and climate Where is the atmosphere? Everywhere! Completely surrounds Earth February 20, 2010 What makes up the atmosphere? Argon Inert gas 1% Variable
An experimental study of angular variations of brightness surface temperature for some natural surfaces
 An experimental study of angular variations of brightness surface temperature for some natural surfaces Juan Cuenca, José A. Sobrino, and Guillem Soria University of Valencia, c./ Dr. Moliner 5, 46 Burjassot,
Investigating the urban climate characteristics of two Hungarian cities with SURFEX/TEB land surface model
 Investigating the urban climate characteristics of two Hungarian cities with SURFEX/TEB land surface model Gabriella Zsebeházi Gabriella Zsebeházi and Gabriella Szépszó Hungarian Meteorological Service,
GIS INTEGRATION OF ASTER STEREO IMAGERY FOR THE SUPPORT OF WATERSHED MANAGEMENT
 Global Nest: the Int. J. Vol 5, No 2, pp 47-56, 2003 Copyright 2003 GLOBAL NEST Printed in Greece. All rights reserved GIS INTEGRATION OF ASTER STEREO IMAGERY FOR THE SUPPORT OF WATERSHED MANAGEMENT N.
VISUALIZATION URBAN SPATIAL GROWTH OF DESERT CITIES FROM SATELLITE IMAGERY: A PRELIMINARY STUDY
 CO-439 VISUALIZATION URBAN SPATIAL GROWTH OF DESERT CITIES FROM SATELLITE IMAGERY: A PRELIMINARY STUDY YANG X. Florida State University, TALLAHASSEE, FLORIDA, UNITED STATES ABSTRACT Desert cities, particularly
Assessing Drought in Agricultural Area of central U.S. with the MODIS sensor
 Assessing Drought in Agricultural Area of central U.S. with the MODIS sensor Di Wu George Mason University Oct 17 th, 2012 Introduction: Drought is one of the major natural hazards which has devastating
Chapter 4 Nadir looking UV measurement. Part-I: Theory and algorithm
 Chapter 4 Nadir looking UV measurement. Part-I: Theory and algorithm -Aerosol and tropospheric ozone retrieval method using continuous UV spectra- Atmospheric composition measurements from satellites are
HICO Calibration and Atmospheric Correction
 HICO Calibration and Atmospheric Correction Curtiss O. Davis College of Earth Ocean and Atmospheric Sciences Oregon State University, Corvallis, OR, USA 97331 cdavis@coas.oregonstate.edu Oregon State Introduction
ATMOSPHERIC CIRCULATION AND WIND
 ATMOSPHERIC CIRCULATION AND WIND The source of water for precipitation is the moisture laden air masses that circulate through the atmosphere. Atmospheric circulation is affected by the location on the
Lecture 4: Heat, and Radiation
 Lecture 4: Heat, and Radiation Heat Heat is a transfer of energy from one object to another. Heat makes things warmer. Heat is measured in units called calories. A calorie is the heat (energy) required
Remote sensing Based Assessment of Urban Heat Island Phenomenon in Nagpur Metropolitan Area
 International Journal of Information & Computation Technology. ISSN 0974-2239 Volume 4, Number 11 (2014), pp. 1069-1074 International Research Publications House http://www. irphouse.com Remote sensing
Calculating equation coefficients
 Solar Energy 1 Calculating equation coefficients Construction Conservation Equation Surface Conservation Equation Fluid Conservation Equation needs flow estimation needs radiation and convection estimation
PICTURE OF THE MONTH. Satellite Imagery of Sea Surface Temperature Cooling in the Wake of Hurricane Edouard (1996)
") 2716 MONTHLY WEATHER REVIEW VOLUME 125 PICTURE OF THE MONTH Satellite Imagery of Sea Surface Temperature Cooling in the Wake of Hurricane Edouard (1996) FRANK M. MONALDO Applied Physics Laboratory, The
2716 MONTHLY WEATHER REVIEW VOLUME 125 PICTURE OF THE MONTH Satellite Imagery of Sea Surface Temperature Cooling in the Wake of Hurricane Edouard (1996) FRANK M. MONALDO Applied Physics Laboratory, The
Remote Sensing Based Inversion of Gap Fraction for Determination of Leaf Area Index. Alemu Gonsamo 1 and Petri Pellikka 1
 Remote Sensing Based Inversion of Gap Fraction for Determination of Leaf Area Index Alemu Gonsamo and Petri Pellikka Department of Geography, University of Helsinki, P.O. Box, FIN- Helsinki, Finland; +-()--;
Hyperspectral Data as a Tool for Mineral Exploration
 1 Hyperspectral Data as a Tool for Mineral Exploration Nahid Kavoosi, PhD candidate of remote sensing kavoosyn@yahoo.com Nahid Kavoosi Abstract In Geology a lot of minerals and rocks have characteristic
What is Climate? Understanding and predicting climatic changes are the basic goals of climatology.
 What is Climate? Understanding and predicting climatic changes are the basic goals of climatology. Climatology is the study of Earth s climate and the factors that affect past, present, and future climatic
J17.3 Impact Assessment on Local Meteorology due to the Land Use Changes During Urban Development in Seoul
 J17.3 Impact Assessment on Local Meteorology due to the Land Use Changes During Urban Development in Seoul Hae-Jung Koo *, Kyu Rang Kim, Young-Jean Choi, Tae Heon Kwon, Yeon-Hee Kim, and Chee-Young Choi
The Structure and Motion of the Atmosphere OCEA 101
 The Structure and Motion of the Atmosphere OCEA 101 Why should you care? - the atmosphere is the primary driving force for the ocean circulation. - the atmosphere controls geographical variations in ocean
Open Access Earth Observation in Support of Urban Resilience and Climate Adaptability
 Send Orders for Reprints to reprints@benthamscience.ae The Open Remote Sensing Journal, 2015, 6, 17-22 17 Open Access Earth Observation in Support of Urban Resilience and Climate Adaptability Plans C.
SAIL thermique, a model to simulate land surface emissivity (LSE) spectra
 spectra") SAIL thermique, a model to simulate land surface emissivity (LSE) spectra Albert Olioso, INRA, UMR EMMAH (INRA UAPV), Avignon, France Frédéric Jacob, Audrey Lesaignoux IRD, UMR LISAH, Montpellier, France
SAIL thermique, a model to simulate land surface emissivity (LSE) spectra Albert Olioso, INRA, UMR EMMAH (INRA UAPV), Avignon, France Frédéric Jacob, Audrey Lesaignoux IRD, UMR LISAH, Montpellier, France
DETECTING AIR POLLUTION FROM SPACE USING IMAGE-BASED METHOD
 DETECTING AIR POLLUTION FROM SPACE USING IMAGE-BASED METHOD D.G. Hadjimitsis 1, 2, 3 and C.R.I Clayton 2 1 Frederick Institute of Technology, Department of Civil Engineering, 7, Y. Frederickou St., Palouriotisa,
AATSR DERIVED LAND SURFACE TEMPERATURE OVER A HETEROGENEOUS REGION
 AATSR DERIVED LAND SURFACE TEMPERATURE OVER A HETEROGENEOUS REGION José A. Sobrino (1), Guillem Sòria (1), Juan C. Jiménez- Muñoz (1), Belen Franch (1), Victoria Hidalgo (1) and Elizabeth Noyes (2). (1)
Climates of NYS. Definitions. Climate Regions of NYS. Storm Tracks. Climate Controls 10/13/2011. Characteristics of NYS s Climates
 Definitions Climates of NYS Prof. Anthony Grande 2011 Weather and Climate Weather the state of the atmosphere at one point in time. The elements of weather are temperature, air pressure, wind and moisture.
Understanding the Greenhouse Effect
 EESC V2100 The Climate System spring 200 Understanding the Greenhouse Effect Yochanan Kushnir Lamont Doherty Earth Observatory of Columbia University Palisades, NY 1096, USA kushnir@ldeo.columbia.edu Equilibrium
An Optimization Algorithm for Separating Land Surface Temperature and Emissivity from Multispectral Thermal Infrared Imagery
 264 IEEE TRANSACTIONS ON GEOSCIENCE AND REMOTE SENSING, VOL. 39, NO. 2, FEBRUARY 2001 An Optimization Algorithm for Separating Land Surface Temperature and Emissivity from Multispectral Thermal Infrared
GIS and Remote Sensing
 Spring School Land use and the vulnerability of socio-ecosystems to climate change: remote sensing and modelling techniques GIS and Remote Sensing Katerina Tzavella Project Researcher PhD candidate Technology
Defining microclimates on Long Island using interannual surface temperature records from satellite imagery
 Defining microclimates on Long Island using interannual surface temperature records from satellite imagery Deanne Rogers*, Katherine Schwarting, and Gilbert Hanson Dept. of Geosciences, Stony Brook University,
RADIOMETER-BASED ESTIMATION OF THE ATMOSPHERIC OPTICAL THICKNESS
 RADIOMETER-BASED ESTIMATION OF THE ATMOSPHERIC OPTICAL THICKNESS Vassilia Karathanassi (), Demetrius Rokos (),Vassilios Andronis (), Alex Papayannis () () Laboratory of Remote Sensing, School of Rural
Abstract: Introduction: 10 th ESRI India User Conference 2009 Geography in Action
 Mitigation of Thermal Pollution to enhance urban air quality through Remote Sensing and GIS Anshu Gupta, Lecturer, Centre of Remote Sensing and GIS, MANIT, Bhopal, E- mail: anshugupta20002001@gmail.com
Thermal And Near infrared Sensor for carbon Observation (TANSO) On board the Greenhouse gases Observing SATellite (GOSAT) Research Announcement
 On board the Greenhouse gases Observing SATellite (GOSAT) Research Announcement") Thermal And Near infrared Sensor for carbon Observation (TANSO) On board the Greenhouse gases Observing SATellite (GOSAT) Research Announcement Appendix A Outlines of GOSAT and TANSO Sensor GOSAT (Greenhouse
Thermal And Near infrared Sensor for carbon Observation (TANSO) On board the Greenhouse gases Observing SATellite (GOSAT) Research Announcement Appendix A Outlines of GOSAT and TANSO Sensor GOSAT (Greenhouse
Cross-calibration of Geostationary Satellite Visible-channel Imagers Using the Moon as a Common Reference
 Cross-calibration of Geostationary Satellite Visible-channel Imagers Using the Moon as a Common Reference Thomas C. Stone U.S. Geological Survey, Flagstaff AZ, USA 27 30 August, 2012 Motivation The archives