National Center for Geographic Information and Analysis
|
|
|
- Randolf Newton
- 6 years ago
- Views:
Transcription
1
2 National Center for Geographic Information and Analysis The Integration of Spatial Analysis and GIS: The Development of the Statcas Module for ARC/INFO by Yuemin Ding and A. Stewart Fotheringham National Center for Geographic Information & Analysis Department of Geography State University of New York at Buffalo Buffalo, NY USA National Center for Geographic Information & Analysis/NCGIA Technical Paper 91-5 April 1991
3 ABSTRACT THE INTEGRATION OF SPATIAL ANALYSIS AND GIS: THE DEVELOPMENT OF THE STACAS MODULE FOR ARC/INFO It seems widely expected that future GISs will have increased analytical capabilities that will take them beyond being efficient display and database management devices. Several attempts have already been made to link existing analytical software to various GISs. However, a problem with all of these attempts is that the user is forced to switch back and forth between the GIS operating environment and the analytical software. In this paper we present a statistical analysis package, STACAS, that runs totally within the operating environment of a GIS and utilizes a command structure that makes running the package transparent to the user of the GIS.
4 1. INTRODUCTION THE INTEGRATION OF SPATIAL ANALYSIS AND GIS: THE DEVELOPMENT OF THE STATCAS MODULE FOR ARC/INFO The research areas of spatial analysis and GIS have generally developed quite independently of one another. The volumes of research on spatial analysis prior to the evolution and popularization of GIS technology clearly demonstrate that spatial analysis, and more generally, geographical analysis, can be undertaken without the aid of a GIS 1. It is equally clear that GlSs have proliferated as display devices without claiming any spatial analytical capabilities other than spatial overlay and perhaps some basic descriptive statistics related to area and distance computations. Rhind s comment, quoted by Densharn and Goodchild (1989), is particularly potent: "Virtually all GIS developments thus far have resulted in data retrieval and sifting engines" (Rhind, 1988). Despite their independent histories, there are several advantages to integrating spatial analytical capabilities within a GIS framework. From a GIS perspective, there is an increasing demand for systems that "do something" other than display maps and organize data. It would be useful to some users to have the capability of analyzing data once they have been displayed. For instance, it might be useful to know something about the statistical relationship between the spatial distribution of welfare recipients and the distribution of welfare offices after displaying the two data sets on one map. Similarly, it would be useful to have some knowledge of the statistical impacts of changing the units for which data are displayed (Fotheringharn and Wong, 1991). From the spatial analytical perspective, there are advantages to linking statistical methods to the database and display capabilities of a GIS. In this way the GIS can act as an "enabling technology"; that is, whilst the GIS may not be necessary for the analysis of spatial data, it can facilitate such analysis. It is also possible that the display and data organizational capabilities of the GIS could even produce insights into the analysis that would otherwise be missed. This might be especially the case if increasing access to highly disaggregate data sets is possible (Abler, 1987). The aim of this paper is to introduce a means of integrating spatial analysis with GIS technology. We take as our example of spatial analysis the calculation of spatial autocorrelation and spatial association statistics and our example of GIS technology, ARC/INFO. Whilst still relatively undeveloped, the integration of these two areas is by no means new. Horn (1988) combined the cartographic and data handling functions of a GIS with other algorithms and interactive techniques for solving spatial planning problems. Young et al (1988) designed a link between ARC/INFO and a decision support system by INFO programming for the forest management. To avoid the limitations of the INFO programming language, Kehris (1990) designed a direct way to access ARC/INFO data files with FORTRAN routines and established an effective link between ARCM4FO and the GLIM statistical package. However, in each of these linkages there is a severe problem in that by not being able to run the spatial analytical routines in the ARC environment, the user has to change the package or system each time between calculation and display. Here we describe a means of overcoming this problem by integrating statistical routines into the ARC Macro Language (AML). The purpose of this paper is thus to describe a SpaTial AutoCorrelation and ASsociation analysis ( STACAS ) module which is operated as a set of ARC/INFO functions. The spatial autocorrelation and spatial association statistics are first briefly described followed by a discussion of the characteristics and limits of ARC/INFO for the integration of spatial analytical routines. The structure and design of the STACAS module in ARC/INFO along with a description of its main functions is then given. The paper is concluded with a demonstration of the package using population data from the 1990 census of the People s Republic of China and some suggestions for future developments. 2. SPATIAL AUTOCORRELATION AND SPATIAL ASSOCIATION Spatial analysis deals with two quite distinct types of information ( Goodchild, 1986 ). One concerns the attributes of spatial objects, which include measures such as area, population, rainfall, or soil type, etc. The other concerns locational information about the spatial objects which generally are described by means of their positions on map or by geographic coordinate systems. The spatial objects concerned in most analyses are polygons which correspond to measurement zones, statistical reporting areas such as census tracts and school districts, and points which correspond to sampling points. For some types of spatial analysis it is common to represent polygons by points (a geographic center or a weighted mean center, for example) although this can lead to the introduction of considerable error. 1 The term "spatial analysis", perhaps incorrectly, has become synonymous to many researchers with "spatial statistical analysis" and we confine our views in this paper to this usage. The term "geographical analysis" represents the broader application of quantitative techniques, including mathematical modeling, to spatial problems.
5 Spatial autocorrelation is concerned with the degree to which objects or activities are similar to other objects or activities located nearby. In contrast to other types of spatial statistical analysis, such as point pattern analysis for example, spatial autocorrelation deals simultaneously with both locational and attribute information. If objects which are similar in location also tend to be similar in attributes, then the pattern as a whole is said to show positive spatial autocorrelation. Conversely, negative spatial autocorrelation exits when objects which are close together in space tend to be more dissimilar in attributes than objects which are further apart. Zero autocorrelation occurs when the distribution of the attributes is independent of the distribution of locations. Excellent reviews of spatial autocorrelation and its role in spatial analysis are given by Goodchild (1986), Odland (1987) and Griffith (1987). Spatial association statistics measure the concentration of an attribute over space. While they are constructed in a very similar way to spatial autocorrelation measures, they offer the twin advantages of being able to differentiate spatial patterns caused by clusters of low values as opposed to clusters of high values, and they can be disaggregated by polygon or point to provide much more detailed information. This latter property makes them amenable to visual display, an example of which is provided by the demonstration of the STACAS module below. Further information on spatial association statistics is provided below and also by Getis (1990). 2.1 Measurement of Spatial Proximity Both spatial autocorrelation and spatial association statistics examine the relationship of an attribute value in one polygon or for one point with the values for proximal polygons or points. It is thus necessary in the computation of both sets of statistics to define and measure what is meant by "proximal". The spatial proximity measure of n objects in spatial autocorrelation and spatial association is usually described by a weight matrix which is defined by a given spatial relationship as follows Alternatively, a continuous measure of proximity can be defined in terms of some function of the distance between points and a hybrid measure exists whereby proximity is defined in terms of a function of the length of the common boundary between polygons with non-adjacent polygons having a weight of zero. However, in this study we will restrict the analysis to the more common binary weight matrix described by equations (1) to (3). 2.2 Measurement of Spatial Autocorrelation The most useful measure of spatial autocorrelation is the Moran coefficient, I. The attribute similarity measure between two objects used by the Moran coefficient can be stated as follows: where x i denotes the value of the attribute for object i, and x mean denotes the mean of the attribute variable for all n objects. The similarity measure c ij when weighted by the spatial proximity measure w ij and summed over all i and j thus measures the
6 covariance between the value of an attribute at location i and its value at all other locations. Dividing this measure by a standardizing factor that constrains the value of the coefficient to lie between +1 and -1 yields the Moran coefficient: The coefficient is positive when nearby areas or points tend to be similar in attributes, negative when they tend to be dissimilar, and approximately zero when attribute values are arranged randomly and independently in space (Goodchild, 1986). The simplest and most straightforward null hypothesis on which to test the significance of the Moran coefficient assumes the spatial autocorrelation in the population from which the sample is drawn to be zero. Two assumptions about the sample can be made: one is that the sample values are drawn from a normally distributed population; the other is that they represent one random arrangement of attribute values from all the possible arrangements that could occur ( Cliff and Ord, 1981, Goodchild 1986). The expected value and variance of the Moran coefficient for samples of size n under the two assumptions can be determined as follows:
7 2.3 Measurement of Spatial Association The formal measurement of spatial association, through a G statistic, is more recent than that of spatial autocorrelation and has only recently been brought to the attention of geographers (Getis 1990). Unlike Moran s I which measures the correlation between attribute values and location, the G statistic measures the concentration of a spatially distributed attribute variable. G statistics are based on the weight matrix W(d) which is determined by a given distance radius in equations (2) and (3). All regions ( polygons ) to be analyzed are represented as points by their centers. The G statistic has the advantage over the Moran coefficient in that it can disaggregated by point so that a set of G i (d) statistics can be obtained each of which measures the degree of association between weighted point i and all other weighted points within a radius of distance d from the point L This allows the testing of hypotheses about the clustering of attribute values around each location by calculating: If large values of the attribute are clustered close to i, G i will be large. In order to test hypotheses on G i (d), the null hypothesis is that there are no difference ( and thus no spatial association ) among the x j within d of the point i. The expected values and variances of G i (d) i =1, 2,..., n can be defined as follows (Getis 1990):
8 A significant large positive z implies that large values of the attribute are spatially associated with point i or polygon i whereas a significant negative z means that small values of x j are spatially associated with point i or polygon i. One advantage of the disaggregation of the G statistic is that it can be mapped within ARC/INFO to show the levels of spatial association across the study area. 3. THE POTENTIAL FOR INTEGRATING SPATIAL ANALYSIS AND ARC/INFO Software presently exists independent of any GIS for certain types of spatial analysis, in particular for the measurement of spatial autocorrelation (Goodchild, 1986, Griffith, 1989). However, from the above brief descriptions of spatial autocorrelation and spatial association analysis, there are three immediate advantages of being able to integrate this type of analysis within a GIS. The first concerns identifying the spatial relationships between objects which is necessary for building the spatial weight matrix W to measure the spatial proximity. The weight matrix can be derived from two kinds of relationships between spatial objects: one describes the adjacency relationship between two regions (polygons); the other describes the range of a distance radius from a point or the center of a polygon. It is obviously time-consuming to create the weight matrix manually for a large area but it can be created with little effort within a GIS that has already stored the locational and topological relationships between polygons or points. In the calculation of spatial autocorrelation and spatial association indices, it is necessary to link the attribute data with the locational information. Hence there is a need for an efficient data model or database to represent, store, manipulate different kinds of
9 attribute data with a good link to their spatial locations. Much more thought has generally been given to this task within a GIS environment than in a non-gis environment. For many spatial statistics, especially those that can be disaggregated by location, such as the spatial association statistic described above, it would be extremely useful to be able to display the results in map form. Linking spatial analysis routines to the powerful graphics capabilities of GISs would make the visual presentation of results much easier especially if the linkage can be achieved without the user having to move from one environment to another. ARC/INFO is perhaps the most popular commercial GIS used to automate, manipulate, and display geographic data in digital form ( ESRI 1987 ). It has many impressive features for these tasks such as a sophisticated input subsystem for digitizing, editing, and reformatting geographic data; a powerful output subsystem for constructing impressive maps and producing reports; a useful array of spatial operations for topological overlay, buffer creation, and spatial query. However, its analytical capabilities are extremely limited. There is a very restricted repertoire of spatial modelling routines available such as NETWORK and TIN and a few simple statistics can be provided. There is also a problem in combining existing software with ARC/INFO in that there is no direct link to transfer the locational and attribute data and their topological relationships between ARC/INFO and other packages. One solution to the problem of accessing the potentially powerful capabilities of ARC/INFO to spatial analysis, which we describe below, is to utilize the fourth generation of the ARC Macro Language (AML) which as well as allowing access to INFO, provides programming facilities and the ability to run routines without leaving the ARC environment. We now provide an example of the use of AML to facilitate spatial analysis on ARC/INFO. 4. THE STACAS MODULE IN ARC/INFO 4.1 The General Objectives In designing a new module for spatial analysis on ARC/INFO, we set ourselves the following objectives: 1. To integrate the stored spatial topological information of objects and the spatial operators in ARC/INFO; 2. To develop the necessary routines for calculating the measures of spatial autocorrelation and spatial association described above; 3. To build a direct and simple link to transfer the topological and attribute data between ARC/INFO and the developed programs; 4. To design an efficient method for the data file management; 5. To develop a function to display and print the spatial graphic results of the analysis directly (without explicit accessing of ARCPLOT); 6. To design a friendly interface for the spatial analysis module and to make all the commands in the module similar to those in ARC/INFO and which can directly deal with coverages, INFO files and data files. 4.2 The Use of Topological Data and ARC Functions for Spatial Analysis One of the useful features of ARC/INFO s topological data model is being able to building the weight matrix from the stored adjacency relationships of polygons. Since each arc in ARC/INFO has direction, the Arc Attribute Table ( AAT ) in INFO maintains a list of the polygons on the left and right sides of each arc (ESRI 1990). Thus any polygons sharing a common arc are adjacent. According to the left-right fist in AAT and the relationship between polygon numbers ( which is given by ARC program and shown in both AAT and PAT ) and user specified polygon II)s in Polygon Attribute Table ( PAT ), it is easy to create the weight matrix by checking each arc and its left-right topology, and assigning I to the corresponding row and column in the matrix (Figure 1). Using a combination of ARC commands, it is also possible to obtain the distance matrix D = [ d ij ] nxn which includes the distance between any two points or centers of any two polygons in the study area. The combination of the commands is as follows arc: BUILD <coverage> POINT arc: POINTDISTANCE <coverage> <coverage> INFODIS.FILE
10 The first command creates a point coverage or a center coverage of polygons. The second calculates the distance between any two points in the coverage and then stores the distance data in a user-specified INFO file. It should be noted that the processing coverage should have centers or label points for polygons in the coverage otherwise both commands will not give the expected results. Once the distance matrix is obtained, it is a straightforward procedure to create the weight matrix for a given radius d as follows:
11 The centers of polygons can be created by either digitizing or using the ARC command CREATELABEL. The latter will create the center of polygon boundary box which may be located at outside of some extremely concave polygons (Figure 2). It is not difficult to create centers of polygons based on the coordinates of their boundary arcs, although there remains a definitional question about what kinds of centers make the most sense for the analysis of spatial autocorrelation and spatial association. 4.3 The STACAS Module The heart of the STACAS module consists of several programs written in C for calculating the Moran coefficient and associated moments under both the normality and randomization assumptions, Gi statistics and associated z-scores, and for transferring the necessary data into and out of ARC/INFO files. While the module is presently restricted to these functions, it is written in such a way that it is a simple matter for the user to add new routines and models. Me relationship between these programs and the ARC/INFO environment through STACAS is shown in Figure 3. Because the topological and attribute data all are stored and managed in the INFO database, a direct and simple way has been built into STACAS to transmit data between the INFO database and the spatial analytical routines by AML. An AML directive enables the user to access INFO and use INFO commands to deal with INFO files and data transmission ( ESRI 1989 ). Since most spatial operations are executed by ARC commands, only a few data transmissions are needed to complete the spatial autocorrelation and association analysis. Since there is a need to copy and transfer coverages and data files during the processing, any processing of commands in STACAS will create a temporary files or coverages when they are needed and will delete all of them when processing finished in the same way that the ARC commands work. Ibis reduces the duplication of data files and save memory space.
12
13 4.3.1 STACAS Commands Every command in STACAS is an AML program which is composed of some combination of the following: AML directives AML functions ARC commands ARCPLOT commands INFO commands Operating system commands C programs The AML directive, &ATOOL, makes all AML programs be the user developed ARC commands. In each AML program, a necessary interface is designed for showing the usage of the command and checking the legal status of coverage and data file to be processed in order to avoid incorrect execution. There are nine commands in STACAS and their operation is outlined below. All commands in STACAS are run in the ARC environment. To start STACAS the user simply types &run stacas in the ARC environment at which time all the STACAS commands are made available while retaining the ability to use any of the regular ARC/INFO commands. The basic command structure of STACAS in Figure 4. A description of each of the commands shown in Figure 4 is now given. CNTDISTANCE <coverage> <dist.rile> Calculates distances between centers of polygons in the given coverage. <coverage> -- name of input coverage to be processed. <dist.file> -- name of file for storing the distance matrix. DISPLAYGZ <coverage> <gz.file> Displays the color map of z values of Gi statistics directly. <coverage> -- coverage name of the study area to be displayed for the spatially distributed z values. <gz.file> -- name of input file to store the Gi statistics after GSTATISTIC is run. GSTATISTIC <coverage> <ITEM> <wd.file> <gz.file> Calculates the Gi statistics and their testing values of the given item (attribute) in the given coverage. <coverage> -- name of coverage containing the item (attribute) to be analyzed. <ITEM> -- the specific name of the item (attribute) in the INFO PAT file in the given coverage. All letters must be in upper case. <wd.file> -- name of the input file where the weight matrix is stored. This weight matrix is determined by a distance radius from the given coverage after WDISTANCE is executed. <gz..file> -- name of the output file for storing the Gi statistics and their testing values.
14
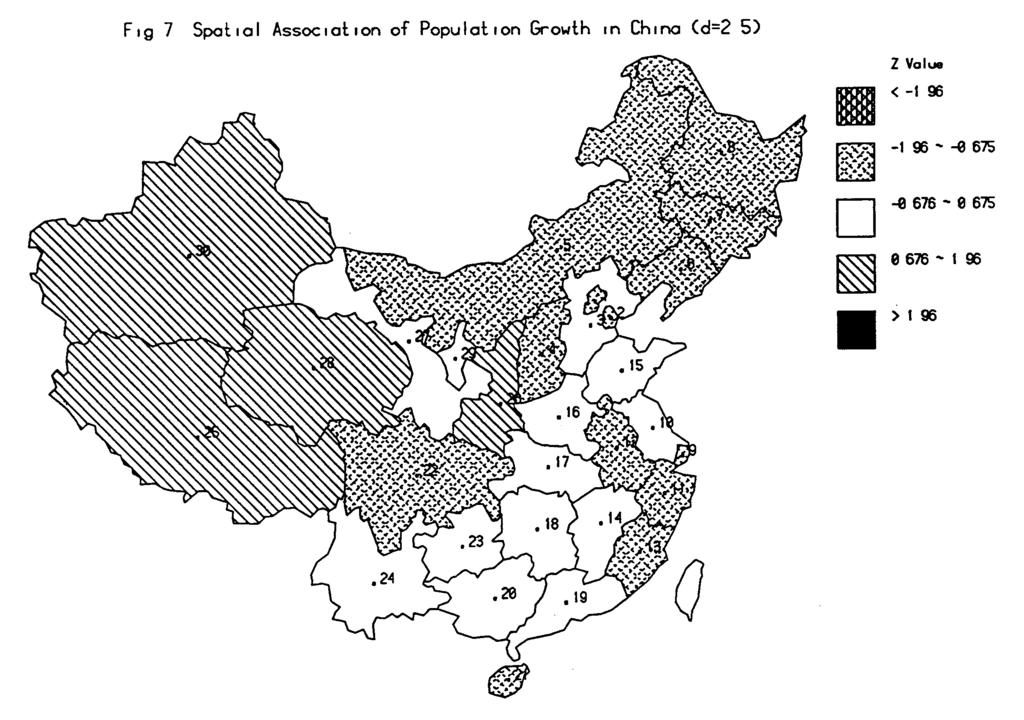
15 MORANCOEF <coverage> <ITEM> <w.file> <mc.file> Calculates the Moran coefficient and associated moments of the given item (attribute) in the given coverage. <coverage> -- name of coverage containing the item (attribute) to be analyzed. <ITEM> -- the specific name of the item (attribute) in the INFO PAT file in the given coverage. All letters tyedin upper case. <w.file> -- name of the input file in which the weight matrix is stored. The weight matrix exists following the either of the commands WADJACENT or WDISTANCE. <mc.file> -- name of the output file for storing the results. PLOTGZVALUE <coverage> <gz.rile> <map.pos> Creates a postscript file for laser printing the map of z value from Gi statistics directly. <coverage> -- coverage name of study area to be plotted for the spatially distributed z values. <gz.file> -- name of the input file containing the results of running the GSTATISTIC command. <map.pos> -- name of the output postscript file of map of z values which can be laser printed directly. SPCOMMANDS To display the list of all commands and their functions in the STACAS on the screen. STACASHELP Help system for running STACAS. WADJACENT <coverage> <wm.file> Creates the weight matrix by the topological adjacent relationship in the given coverage. <coverage> -- coverage name of study area contained the polygons to be analyzed. <wm.file> -- name of output file for storing the result of weight matrix. WDISTANCE <dist.file> <wd.file> Creates the weight matrix by the given distance matrix and a distance radius. <dist.file> -- name of the input file containing the distance matrix after the command CNTDISTANCE. <wd.file> -- name of the output file for storing the results. 5. AN EXAMPLE OF RUNNING STACAS WITH POPULATION DATA To demonstrate the type of output generated by STACAS, population growth rates ( ) for the 30 provinces of the People s Republic of China (PRC) were analyzed (State Bureau of Statistics, P.R.China 1990). A map of these growth rates generated by the ARCPLOT command is presented in Figure 5. The tabular output from the commands MORANCOEF and GSTATISTIC for two different definitions of proximal polygons (distance = 1.5 units and distance =2.5 units) are presented in Tables 1 and 2, respectively. The spatial distributions of the z-scores associated with the G i values for the two distance measures plotted using the PLOTGZVALUE command are presented in Figures 6 and 7.

16 To appreciate the effect of varying the distance within which zones are declared to be neighbors, we present the connectivity matrices for the China map when d=1.5 and d=2.5 in Tables 3 and 4 respectively. Under both definitions of proximity, the Moran coefficient is significantly positive (at the 95 % confidence level) under both the normality and randomization assumptions indicating a trend in the data whereby a high growth in one zone is associated with high values in neighboring zones and a low value in one zone is associated with low values in neighboring zones. However, the findings of the G statistic are much more sensitivity to the definition of proximity: whereas a reasonable proportion of the values are significant when a restricted definition of proximity is employed (d=1.5), none are significant when a broader definition of proximity is used (d=2.5). The G values that are significantly different from zero are all negative (see Figure 6) and are just significant indicating a pattern dominated by a clustering of medium to low values rather than a pattern dominated by a clustering of high values (Getis, 1990). The medium to low growth rates are primarily clustered around the northeastern and east central provinces.
17
18
19
20
21
22
23 6. SUMMARY AND CONCLUSIONS The STACAS module that has been described here and which is available from the authors has the following attributes: 1. It makes the spatial autocorrelation and association analysis feasible in ARC/INFO; 2. It can deal with coverages, INFO files, items in INFO files, and data files directly, all of which facilitates spatial analysis within the GIS environment. It also can analyze any attribute within a given coverage; 3. It has a user-friendly interface using the same syntax as regular ARC commands; 4. It has an on-screen help system which is easy to access; 5. The results of a spatial analytical procedure can be mapped and displayed easily; 6. The user can run the commands of both ARC and STACAS in the same environment. The development of the STACAS module demonstrates that it is possible to run complex spatial algorithms under ARC/INFO. In a more general sense, the ideas in this paper demonstrate the potential for GISs for uses other that storing, displaying and simple querying of data. While the STACAS module will undergo continuous refinements (for example new routines can be added and a menu-driven system installed), it points the way for a major expansion of the use of GIS technology. In a smaller way it also points out the advantages to spatial analysts of linking routines into the tremendous display and data manipulation facilities of a GIS. REFERENCES Abler, R. F The National Science Foundation National Center for Geographic Information and Analysis, International Journal of Geogaphical Information Systems, 1: Cliff, A. D Elements of Spatial Structure: A Quantitative Approach, Cambridge University Press, London, UK. Cliff, A. D. and J. K. Ord, 1981 Spatial Processes: Models and Applications, Pion: London Densham, P.J. and M.F. Goodchild Spatial Decision Support Systems: A Research Agenda, GIS/LIS 89 Proceedings, Orlando, Florida. ESRI, ARCIINFO User Guide, Vol.l: Geographic Information System Software. Environmental Systems Research Institute, Redlands, CA. ESRI, AML User Guide: ARC Macro Language and User Interface Tools. Environmental Systems Research Institute, Redlands, CA. ESRI, Understanding GIS: The ARC/INFO Methods. Environmental Systems Research Institute, Redlands, CA. Fotheringham, A.S. and D.W.S. Wong, 1991 The Modifiable Areal Unit Problem in Multivariate Statistical Analysis, Environment and PlanniU,, A, at press. Getis, Arthur, The Analysis of Spatial Association by Use of Distance Statistics, The Annual Meeting of the Association o f American Geogaphers, Toronto, Canada, April Goodchild, M. F., Spatial Autocorrelation, CATMOG 47, Geobooks: Norwich UK. Griffith, D. A., Spatial autocorrelation: A Primer AAG Resource Publications in Geography, Washington DC. Griffith, D.A., Spatial Regession Analysis on the PC: Spatial Statistics Using Minitab, IMaGe Discussion Paper #1, University of Michigan, Ann Arbor, MN. Horn, M. et al Design of Integrated Systems for Spatial Planning Tasks, Proceedings of the third International SyMposium on Spatial Data Handling August 17-19, Sydney, Australia.
24 Kehris, E A Geographical Modelling Environment Built Around ARC/INFO, Research Report No 13, North West Regional Research Lab, Lancaster University, UK. Odland, J Spatial Autocorrelation Sage: Beverly Hills,CA Rhind, D A GIS Research Agenda, International Journal of Geographic Information Systems, 2: State Bureau of Statistics, P. R. China, The 1990 Census Data (11), People s Daily, Overseas Edition, Nov. 7th. Young, D. L. et al Integrating GIS with a Decision Support System for Forest Management, Proceedings of the Eighth Annual ESRI User Conference, Mar , Palm Springs, CA.
PC ARC/INFO and Data Automation Kit GIS Tools for Your PC
 ESRI PC ARC/INFO and Data Automation Kit GIS Tools for Your PC PC ARC/INFO High-quality digitizing and data entry Powerful topology building Cartographic design and query Spatial database query and analysis
GENERALIZATION IN THE NEW GENERATION OF GIS. Dan Lee ESRI, Inc. 380 New York Street Redlands, CA USA Fax:
 GENERALIZATION IN THE NEW GENERATION OF GIS Dan Lee ESRI, Inc. 380 New York Street Redlands, CA 92373 USA dlee@esri.com Fax: 909-793-5953 Abstract In the research and development of automated map generalization,
Geometric Algorithms in GIS
 Geometric Algorithms in GIS GIS Software Dr. M. Gavrilova GIS System What is a GIS system? A system containing spatially referenced data that can be analyzed and converted to new information for a specific
Understanding Geographic Information System GIS
 Understanding Geographic Information System GIS What do we know about GIS? G eographic I nformation Maps Data S ystem Computerized What do we know about maps? Types of Maps (Familiar Examples) Street Maps
FUNDAMENTALS OF GEOINFORMATICS PART-II (CLASS: FYBSc SEM- II)
") FUNDAMENTALS OF GEOINFORMATICS PART-II (CLASS: FYBSc SEM- II) UNIT:-I: INTRODUCTION TO GIS 1.1.Definition, Potential of GIS, Concept of Space and Time 1.2.Components of GIS, Evolution/Origin and Objectives
FUNDAMENTALS OF GEOINFORMATICS PART-II (CLASS: FYBSc SEM- II) UNIT:-I: INTRODUCTION TO GIS 1.1.Definition, Potential of GIS, Concept of Space and Time 1.2.Components of GIS, Evolution/Origin and Objectives
a system for input, storage, manipulation, and output of geographic information. GIS combines software with hardware,
 Introduction to GIS Dr. Pranjit Kr. Sarma Assistant Professor Department of Geography Mangaldi College Mobile: +91 94357 04398 What is a GIS a system for input, storage, manipulation, and output of geographic
SVY2001: Lecture 15: Introduction to GIS and Attribute Data
 SVY2001: Databases for GIS Lecture 15: Introduction to GIS and Attribute Data Management. Dr Stuart Barr School of Civil Engineering & Geosciences University of Newcastle upon Tyne. Email: S.L.Barr@ncl.ac.uk
Chapter 1. GIS Fundamentals
 1. GIS Overview Chapter 1. GIS Fundamentals GIS refers to three integrated parts. Geographic: Of the real world; the spatial realities, the geography. Information: Data and information; their meaning and
NR402 GIS Applications in Natural Resources
 NR402 GIS Applications in Natural Resources Lesson 1 Introduction to GIS Eva Strand, University of Idaho Map of the Pacific Northwest from http://www.or.blm.gov/gis/ Welcome to NR402 GIS Applications in
Environmental Systems Research Institute
 Introduction to ArcGIS ESRI Environmental Systems Research Institute Redlands, California 2 ESRI GIS Development Arc/Info (coverage model) Versions 1-7 from 1980 1999 Arc Macro Language (AML) ArcView (shapefile
DATA SOURCES AND INPUT IN GIS. By Prof. A. Balasubramanian Centre for Advanced Studies in Earth Science, University of Mysore, Mysore
 DATA SOURCES AND INPUT IN GIS By Prof. A. Balasubramanian Centre for Advanced Studies in Earth Science, University of Mysore, Mysore 1 1. GIS stands for 'Geographic Information System'. It is a computer-based
Chapter 5. GIS The Global Information System
 Chapter 5 GIS The Global Information System What is GIS? We have just discussed GPS a simple three letter acronym for a fairly sophisticated technique to locate a persons or objects position on the Earth
Popular Mechanics, 1954
 Introduction to GIS Popular Mechanics, 1954 1986 $2,599 1 MB of RAM 2017, $750, 128 GB memory, 2 GB of RAM Computing power has increased exponentially over the past 30 years, Allowing the existence of
4. GIS Implementation of the TxDOT Hydrology Extensions
 4. GIS Implementation of the TxDOT Hydrology Extensions A Geographic Information System (GIS) is a computer-assisted system for the capture, storage, retrieval, analysis and display of spatial data. It
A CARTOGRAPHIC DATA MODEL FOR BETTER GEOGRAPHICAL VISUALIZATION BASED ON KNOWLEDGE
 A CARTOGRAPHIC DATA MODEL FOR BETTER GEOGRAPHICAL VISUALIZATION BASED ON KNOWLEDGE Yang MEI a, *, Lin LI a a School Of Resource And Environmental Science, Wuhan University,129 Luoyu Road, Wuhan 430079,
Canadian Board of Examiners for Professional Surveyors Core Syllabus Item C 5: GEOSPATIAL INFORMATION SYSTEMS
 Study Guide: Canadian Board of Examiners for Professional Surveyors Core Syllabus Item C 5: GEOSPATIAL INFORMATION SYSTEMS This guide presents some study questions with specific referral to the essential
Lecture 2. Introduction to ESRI s ArcGIS Desktop and ArcMap
 Lecture 2 Introduction to ESRI s ArcGIS Desktop and ArcMap Outline ESRI What is ArcGIS? ArcGIS Desktop ArcMap Overview Views Layers Attribute Tables Help! Scale Tips and Tricks ESRI Environmental Systems
Welcome to GST 101: Introduction to Geospatial Technology. This course will introduce you to Geographic Information Systems (GIS), cartography,
, cartography,") Welcome to GST 101: Introduction to Geospatial Technology. This course will introduce you to Geographic Information Systems (GIS), cartography, remote sensing, and spatial analysis through a series of
Welcome to GST 101: Introduction to Geospatial Technology. This course will introduce you to Geographic Information Systems (GIS), cartography, remote sensing, and spatial analysis through a series of
M.Y. Pior Faculty of Real Estate Science, University of Meikai, JAPAN
 GEOGRAPHIC INFORMATION SYSTEM M.Y. Pior Faculty of Real Estate Science, University of Meikai, JAPAN Keywords: GIS, rasterbased model, vectorbased model, layer, attribute, topology, spatial analysis. Contents
Spatial Analysis I. Spatial data analysis Spatial analysis and inference
 Spatial Analysis I Spatial data analysis Spatial analysis and inference Roadmap Outline: What is spatial analysis? Spatial Joins Step 1: Analysis of attributes Step 2: Preparing for analyses: working with
Introduction to the 176A labs and ArcGIS
 Introduction to the 176A labs and ArcGIS Acknowledgement: Slides by David Maidment, U Texas-Austin and Francisco Olivera (TAMU) Purpose of the labs Hands-on experience with one software pakage Introduction
Are You Maximizing The Value Of All Your Data?
 Are You Maximizing The Value Of All Your Data? Using The SAS Bridge for ESRI With ArcGIS Business Analyst In A Retail Market Analysis SAS and ESRI: Bringing GIS Mapping and SAS Data Together Presented
GIS Boot Camp for Education June th, 2011 Day 1. Instructor: Sabah Jabbouri Phone: (253) x 4854 Office: TC 136
 x 4854 Office: TC 136") GIS Boot Camp for Education June 27-30 th, 2011 Day 1 Instructor: Sabah Jabbouri Phone: (253) 833-9111 x 4854 Office: TC 136 Email: sjabbouri@greenriver.edu http://www.instruction.greenriver.edu/gis/ Summer
GIS Boot Camp for Education June 27-30 th, 2011 Day 1 Instructor: Sabah Jabbouri Phone: (253) 833-9111 x 4854 Office: TC 136 Email: sjabbouri@greenriver.edu http://www.instruction.greenriver.edu/gis/ Summer
EXPLORATORY SPATIAL DATA ANALYSIS OF BUILDING ENERGY IN URBAN ENVIRONMENTS. Food Machinery and Equipment, Tianjin , China
 EXPLORATORY SPATIAL DATA ANALYSIS OF BUILDING ENERGY IN URBAN ENVIRONMENTS Wei Tian 1,2, Lai Wei 1,2, Pieter de Wilde 3, Song Yang 1,2, QingXin Meng 1 1 College of Mechanical Engineering, Tianjin University
The Study on Trinary Join-Counts for Spatial Autocorrelation
 Proceedings of the 8th International Symposium on Spatial Accuracy Assessment in Natural Resources and Environmental Sciences Shanghai, P. R. China, June 5-7, 008, pp. -8 The Study on Trinary Join-Counts
GIS = Geographic Information Systems;
 What is GIS GIS = Geographic Information Systems; What Information are we talking about? Information about anything that has a place (e.g. locations of features, address of people) on Earth s surface,
A Review: Geographic Information Systems & ArcGIS Basics
 A Review: Geographic Information Systems & ArcGIS Basics Geographic Information Systems Geographic Information Science Why is GIS important and what drives it? Applications of GIS ESRI s ArcGIS: A Review
How to Pick a GIS. GIS Software Chapter 8 in Longley, Goodchild, Maguire, and Rhind,, 2001
 How to Pick a GIS GIS Software Chapter 8 in Longley, Goodchild, Maguire, and Rhind,, 2001 How to Pick a GIS Evolution of GIS software Architecture of GIS software Types of software Example products The
Exploratory Spatial Data Analysis (And Navigating GeoDa)
") Exploratory Spatial Data Analysis (And Navigating GeoDa) June 9, 2006 Stephen A. Matthews Associate Professor of Sociology & Anthropology, Geography and Demography Director of the Geographic Information
Exploratory Spatial Data Analysis (And Navigating GeoDa) June 9, 2006 Stephen A. Matthews Associate Professor of Sociology & Anthropology, Geography and Demography Director of the Geographic Information
Welcome to NR502 GIS Applications in Natural Resources. You can take this course for 1 or 2 credits. There is also an option for 3 credits.
 Welcome to NR502 GIS Applications in Natural Resources. You can take this course for 1 or 2 credits. There is also an option for 3 credits. The 1st credit consists of a series of readings, demonstration,
GIS Applications to Agricultural Non-Point-Source Pollution Modeling: A Status Review
 EIA05-025 ISEIS Publication Series Number P002 2005 ISEIS - International Society for Environmental Information Sciences GIS Applications to Agricultural Non-Point-Source Pollution Modeling: A Status Review
Hydraulic Processes Analysis System (HyPAS)
") Hydraulic Processes Analysis System (HyPAS) by Thad C. Pratt and Daryl S. Cook PURPOSE: This Coastal Engineering Technical Note (CETN) describes a PC-Windows-based system for analyzing, visualizing, and
Hydraulic Processes Analysis System (HyPAS) by Thad C. Pratt and Daryl S. Cook PURPOSE: This Coastal Engineering Technical Note (CETN) describes a PC-Windows-based system for analyzing, visualizing, and
Introduction to GIS I
 Introduction to GIS Introduction How to answer geographical questions such as follows: What is the population of a particular city? What are the characteristics of the soils in a particular land parcel?
Traffic accidents and the road network in SAS/GIS
 Traffic accidents and the road network in SAS/GIS Frank Poppe SWOV Institute for Road Safety Research, the Netherlands Introduction The first figure shows a screen snapshot of SAS/GIS with part of the
Fundamentals of ArcGIS Desktop Pathway
 Fundamentals of ArcGIS Desktop Pathway Table of Contents ArcGIS Desktop I: Getting Started with GIS 3 ArcGIS Desktop II: Tools and Functionality 5 Understanding Geographic Data 8 Understanding Map Projections
ESRI* Object Models; Data Capture
 ESRI* Object Models; Data Capture * Environmental Systems Research Institute Feature Class (spatial table) Number Age_Ma 1_sigma Rx_Type Size_kg 123 124 125 142 1.5 B_schist 136 2.0 G_schist Object Class
ESRI Object Models and Data Capture 2/1/2018
 Number 123 124 125 ESRI* Object Models; Data Capture Feature Class (spatial table) Age_Ma 142 136 1_sigma 1.5 2.0 Rx_Type B_schist G_schist Object Class (nonspatial table) Size_kg 3.4 1.3 Y Control Point
Outline. Chapter 1. A history of products. What is ArcGIS? What is GIS? Some GIS applications Introducing the ArcGIS products How does GIS work?
 Outline Chapter 1 Introducing ArcGIS What is GIS? Some GIS applications Introducing the ArcGIS products How does GIS work? Basic data formats The ArcCatalog interface 1-1 1-2 A history of products Arc/Info
Georelational Vector Data Model
 Georelational Vector Data Model Contents Georelational Data Model Representation of Simple Features Topology Non-topological Vector Data Data Models for Composite Features Geo-relational Looking at a paper
UNIT 4: USING ArcGIS. Instructor: Emmanuel K. Appiah-Adjei (PhD) Department of Geological Engineering KNUST, Kumasi
 Department of Geological Engineering KNUST, Kumasi") UNIT 4: USING ArcGIS Instructor: Emmanuel K. Appiah-Adjei (PhD) Department of Geological Engineering KNUST, Kumasi Getting to Know ArcGIS ArcGIS is an integrated collection of GIS software products ArcGIS
UNIT 4: USING ArcGIS Instructor: Emmanuel K. Appiah-Adjei (PhD) Department of Geological Engineering KNUST, Kumasi Getting to Know ArcGIS ArcGIS is an integrated collection of GIS software products ArcGIS
ESRI* Object Models; Data Capture
 ESRI* Object Models; Data Capture * Environmental Systems Research Institute Feature Class (spatial table) Number Age_Ma 1_sigma Rx_Type Size_kg 123 124 125 142 1.5 B_schist 136 2.0 G_schist Object Class
Using a GIS as a DSS Generator
 33 Peter Keenan Department of M.I.S. University College Dublin, Ireland. The continuing development of DSS applications requires that new technologies be exploited to allow new classes of decision be supported.
Luc Anselin Spatial Analysis Laboratory Dept. Agricultural and Consumer Economics University of Illinois, Urbana-Champaign
 GIS and Spatial Analysis Luc Anselin Spatial Analysis Laboratory Dept. Agricultural and Consumer Economics University of Illinois, Urbana-Champaign http://sal.agecon.uiuc.edu Outline GIS and Spatial Analysis
An Introduction to Geographic Information System
 An Introduction to Geographic Information System PROF. Dr. Yuji MURAYAMA Khun Kyaw Aung Hein 1 July 21,2010 GIS: A Formal Definition A system for capturing, storing, checking, Integrating, manipulating,
GIS Software. Evolution of GIS Software
 GIS Software The geoprocessing engines of GIS Major functions Collect, store, mange, query, analyze and present Key terms Program collections of instructions to manipulate data Package integrated collection
GIS and Spatial Statistics: One World View or Two? Michael F. Goodchild University of California Santa Barbara
 GIS and Spatial Statistics: One World View or Two? Michael F. Goodchild University of California Santa Barbara Location as attribute The data table Census summary table What value is location as an explanatory
Learning Computer-Assisted Map Analysis
 Learning Computer-Assisted Map Analysis by Joseph K. Berry* Old-fashioned math and statistics can go a long way toward helping us understand GIS Note: This paper was first published as part of a three-part
Geometric Algorithms in GIS
 Geometric Algorithms in GIS GIS Visualization Software Dr. M. Gavrilova GIS Software for Visualization ArcView GEO/SQL Digital Atmosphere AutoDesk Visual_Data GeoMedia GeoExpress CAVE? Visualization in
This lab exercise will try to answer these questions using spatial statistics in a geographic information system (GIS) context.
 context.") by Introduction Problem Do the patterns of forest fires change over time? Do forest fires occur in clusters, and do the clusters change over time? Is this information useful in fighting forest fires? This
by Introduction Problem Do the patterns of forest fires change over time? Do forest fires occur in clusters, and do the clusters change over time? Is this information useful in fighting forest fires? This
Development of Integrated Spatial Analysis System Using Open Sources. Hisaji Ono. Yuji Murayama
 Development of Integrated Spatial Analysis System Using Open Sources Hisaji Ono PASCO Corporation 1-1-2, Higashiyama, Meguro-ku, TOKYO, JAPAN; Telephone: +81 (03)3421 5846 FAX: +81 (03)3421 5846 Email:
INTRODUCTION TO GEOGRAPHIC INFORMATION SYSTEM By Reshma H. Patil
 INTRODUCTION TO GEOGRAPHIC INFORMATION SYSTEM By Reshma H. Patil ABSTRACT:- The geographical information system (GIS) is Computer system for capturing, storing, querying analyzing, and displaying geospatial
John Laznik 273 Delaplane Ave Newark, DE (302)
") Office Address: John Laznik 273 Delaplane Ave Newark, DE 19711 (302) 831-0479 Center for Applied Demography and Survey Research College of Human Services, Education and Public Policy University of Delaware
Office Address: John Laznik 273 Delaplane Ave Newark, DE 19711 (302) 831-0479 Center for Applied Demography and Survey Research College of Human Services, Education and Public Policy University of Delaware
Among various open-source GIS programs, QGIS can be the best suitable option which can be used across partners for reasons outlined below.
 Comparison of Geographic Information Systems (GIS) software As of January 2018, WHO has reached an agreement with ESRI (an international supplier of GIS software) for an unlimited use of ArcGIS Desktop
SRJC Applied Technology 54A Introduction to GIS
 SRJC Applied Technology 54A Introduction to GIS Overview Lecture of Geographic Information Systems Fall 2004 Santa Rosa Junior College Presented By: Tim Pudoff, GIS Coordinator, County of Sonoma, Information
WELCOME. To GEOG 350 / 550 Introduction to Geographic Information Science: Third Lecture
 WELCOME To GEOG 350 / 550 Introduction to Geographic Information Science: Third Lecture 1 Lecture 3: Overview Geographic Information Systems (GIS) A brief history of GIS Sources of information for GIS
Geographic Systems and Analysis
 Geographic Systems and Analysis New York University Robert F. Wagner Graduate School of Public Service Instructor Stephanie Rosoff Contact: stephanie.rosoff@nyu.edu Office hours: Mondays by appointment
Cadcorp Introductory Paper I
 Cadcorp Introductory Paper I An introduction to Geographic Information and Geographic Information Systems Keywords: computer, data, digital, geographic information systems (GIS), geographic information
Introduction to the 176A labs and ArcGIS Purpose of the labs
 Introduction to the 176A labs and ArcGIS Purpose of the labs Acknowledgement: Slides by David Maidment, U Texas-Austin and Francisco Olivera (TAMU) Hands-on experience with a leading software package Introduction
Spatial Analysis using Vector GIS THE GOAL: PREPARATION:
 PLAN 512 GIS FOR PLANNERS Department of Urban and Environmental Planning University of Virginia Fall 2006 Prof. David L. Phillips Spatial Analysis using Vector GIS THE GOAL: This tutorial explores some
WEB-BASED SPATIAL DECISION SUPPORT: TECHNICAL FOUNDATIONS AND APPLICATIONS
 WEB-BASED SPATIAL DECISION SUPPORT: TECHNICAL FOUNDATIONS AND APPLICATIONS Claus Rinner University of Muenster, Germany Piotr Jankowski San Diego State University, USA Keywords: geographic information
Formalization of GIS functionality
 Formalization of GIS functionality Over the past four decades humans have invested significantly in the construction of tools for handling digital representations of spaces and their contents. These include
Visualization of Places Based on Network Analysis through GIS
 Dagon University Research Journal 2014, Vol. 6 Visualization of Places Based on Network Analysis through GIS Win Win Shwe * Abstract Geographic Information System is a computer-based tool for mapping and
GEOGRAPHIC INFORMATION SYSTEMS Session 8
 GEOGRAPHIC INFORMATION SYSTEMS Session 8 Introduction Geography underpins all activities associated with a census Census geography is essential to plan and manage fieldwork as well as to report results
Why Is It There? Attribute Data Describe with statistics Analyze with hypothesis testing Spatial Data Describe with maps Analyze with spatial analysis
 6 Why Is It There? Why Is It There? Getting Started with Geographic Information Systems Chapter 6 6.1 Describing Attributes 6.2 Statistical Analysis 6.3 Spatial Description 6.4 Spatial Analysis 6.5 Searching
![)UDQFR54XHQWLQ(DQG'tD]'HOJDGR&](/thumbs/95/125846872.jpg ")UDQFR54XHQWLQ(DQG'tD]'HOJDGR&") &21&(37,21$1',03/(0(17$7,212)$1+
&21&(37,21$1',03/(0(17$7,212)$1+ THE NEW TECHNOLOGICAL ADVANCES IN CARTOGRAPHY
 Distr.: LIMITED ECA/NRD/CART. 9/ETH. 6 October 1996 Original: ENGLISH Ninth United Nations Regional Cartographic Conference for Africa Addis Ababa, Ethiopia 11-15 November 1996 THE NEW TECHNOLOGICAL ADVANCES
GEOG 508 GEOGRAPHIC INFORMATION SYSTEMS I KANSAS STATE UNIVERSITY DEPARTMENT OF GEOGRAPHY FALL SEMESTER, 2002
 GEOG 508 GEOGRAPHIC INFORMATION SYSTEMS I KANSAS STATE UNIVERSITY DEPARTMENT OF GEOGRAPHY FALL SEMESTER, 2002 Course Reference #: 13210 Meeting Time: TU 2:05pm - 3:20 pm Meeting Place: Ackert 221 Remote
ESRI Object Models and Data Capture 9/18/ /18/2014 M. Helper GEO327G/386G, UT Austin 2. ESRI Arc/Info ArcView ArcGIS
 ESRI Object Models; Data Capture Conceptual Models Conceptual Models Characterized all features or phenomena as: Feature Class (spatial table) Number Age_Ma 1_sigma Rx_Type 123 142 1.5 B_schist 124 136
Preparing Spatial Data
 13 CHAPTER 2 Preparing Spatial Data Assessing Your Spatial Data Needs 13 Assessing Your Attribute Data 13 Determining Your Spatial Data Requirements 14 Locating a Source of Spatial Data 14 Performing Common
Finding Hot Spots in ArcGIS Online: Minimizing the Subjectivity of Visual Analysis. Nicholas M. Giner Esri Parrish S.
 Finding Hot Spots in ArcGIS Online: Minimizing the Subjectivity of Visual Analysis Nicholas M. Giner Esri Parrish S. Henderson FBI Agenda The subjectivity of maps What is Hot Spot Analysis? Why do Hot
Introduction to Spatial Statistics and Modeling for Regional Analysis
 Introduction to Spatial Statistics and Modeling for Regional Analysis Dr. Xinyue Ye, Assistant Professor Center for Regional Development (Department of Commerce EDA University Center) & School of Earth,
Geoprocessing Tools at ArcGIS 9.2 Desktop
 Geoprocessing Tools at ArcGIS 9.2 Desktop Analysis Tools Analysis Tools \ Extract Clip Analysis Tools \ Extract Select Analysis Tools \ Extract Split Analysis Tools \ Extract Table Select Analysis Tools
GEOGRAPHY 350/550 Final Exam Fall 2005 NAME:
 1) A GIS data model using an array of cells to store spatial data is termed: a) Topology b) Vector c) Object d) Raster 2) Metadata a) Usually includes map projection, scale, data types and origin, resolution
Acknowledgments xiii Preface xv. GIS Tutorial 1 Introducing GIS and health applications 1. What is GIS? 2
 Acknowledgments xiii Preface xv GIS Tutorial 1 Introducing GIS and health applications 1 What is GIS? 2 Spatial data 2 Digital map infrastructure 4 Unique capabilities of GIS 5 Installing ArcView and the
Theory, Concepts and Terminology
 GIS Workshop: Theory, Concepts and Terminology 1 Theory, Concepts and Terminology Suggestion: Have Maptitude with a map open on computer so that we can refer to it for specific menu and interface items.
IMPERIAL COUNTY PLANNING AND DEVELOPMENT
 IMPERIAL COUNTY PLANNING AND DEVELOPMENT GEODATABASE USER MANUAL FOR COUNTY BUSINESS DEVELOPMENT GIS June 2010 Prepared for: Prepared by: County of Imperial Planning and Development 801 Main Street El
GIS Generalization Dr. Zakaria Yehia Ahmed GIS Consultant Ain Shams University Tel: Mobile:
 GIS Generalization Dr. Zakaria Yehia Ahmed GIS Consultant Ain Shams University Tel: 24534976 Mobile: 01223384254 zyehia2005@yahoo.com Abstract GIS Generalization makes data less-detailed and less-complex
Outline. Geographic Information Analysis & Spatial Data. Spatial Analysis is a Key Term. Lecture #1
 Geographic Information Analysis & Spatial Data Lecture #1 Outline Introduction Spatial Data Types: Objects vs. Fields Scale of Attribute Measures GIS and Spatial Analysis Spatial Analysis is a Key Term
Personal Field Data Collection by UM-FieldGIS (Integration of Google Map API to Mobile GIS)
") Personal Field Data Collection by UM-FieldGIS (Integration of Google Map API to Mobile GIS) Ko Ko Lwin*. Yuji MURAYAMA* *Division of Spatial Information Science Graduate School of Life and Environmental
Personal Field Data Collection by UM-FieldGIS (Integration of Google Map API to Mobile GIS) Ko Ko Lwin*. Yuji MURAYAMA* *Division of Spatial Information Science Graduate School of Life and Environmental
GIS and Forest Engineering Applications FE 357 Lecture: 2 hours Lab: 2 hours 3 credits
 GIS and Forest Engineering Applications FE 357 Lecture: 2 hours Lab: 2 hours 3 credits Instructor: Michael Wing Assistant Professor Forest Engineering Department Oregon State University Peavy Hall 275
King Fahd University of Petroleum & Minerals College of Engineering Sciences Civil Engineering Department. Geographical Information Systems(GIS)
") King Fahd University of Petroleum & Minerals College of Engineering Sciences Civil Engineering Department Geographical Information Systems(GIS) Term Project Titled Delineating Potential Area for Locating
King Fahd University of Petroleum & Minerals College of Engineering Sciences Civil Engineering Department Geographical Information Systems(GIS) Term Project Titled Delineating Potential Area for Locating
Integrating Geographical Information Systems (GIS) with Hydrological Modelling Applicability and Limitations
 with Hydrological Modelling Applicability and Limitations") Integrating Geographical Information Systems (GIS) with Hydrological Modelling Applicability and Limitations Rajesh VijayKumar Kherde *1, Dr. Priyadarshi. H. Sawant #2 * Department of Civil Engineering,
Integrating Geographical Information Systems (GIS) with Hydrological Modelling Applicability and Limitations Rajesh VijayKumar Kherde *1, Dr. Priyadarshi. H. Sawant #2 * Department of Civil Engineering,
An integrated Framework for Retrieving and Analyzing Geographic Information in Web Pages
 An integrated Framework for Retrieving and Analyzing Geographic Information in Web Pages Hao Lin, Longping Hu, Yingjie Hu, Jianping Wu, Bailang Yu* Key Laboratory of Geographic Information Science, Ministry
Production Line Tool Sets
 Production Line Tool Sets Tools for high-quality database production and cartographic output Production Line Tool Sets Production Line Tool Sets (PLTS) by ESRI are a collection of software applications
Geographic Information Systems (GIS) in Environmental Studies ENVS Winter 2003 Session III
 in Environmental Studies ENVS Winter 2003 Session III") Geographic Information Systems (GIS) in Environmental Studies ENVS 6189 3.0 Winter 2003 Session III John Sorrell York University sorrell@yorku.ca Session Purpose: To discuss the various concepts of space,
Geographic Information Systems (GIS) in Environmental Studies ENVS 6189 3.0 Winter 2003 Session III John Sorrell York University sorrell@yorku.ca Session Purpose: To discuss the various concepts of space,
INTRODUCTION TO ARCGIS Version 10.*
 Week 3 INTRODUCTION TO ARCGIS Version 10.* topics of the week Overview of ArcGIS Using ArcCatalog Overview of ArcGIS Desktop ArcGIS Overview Scalable desktop applications ArcView ArcEditor ArcInfo ArcGIS
A BASE SYSTEM FOR MICRO TRAFFIC SIMULATION USING THE GEOGRAPHICAL INFORMATION DATABASE
 A BASE SYSTEM FOR MICRO TRAFFIC SIMULATION USING THE GEOGRAPHICAL INFORMATION DATABASE Yan LI Ritsumeikan Asia Pacific University E-mail: yanli@apu.ac.jp 1 INTRODUCTION In the recent years, with the rapid
Abstract. Keywords: Geographic information systems and digital data model. 1. Introduction
 Abstract GISMO - A Geographical Information System for a Municipality Office Ramzi A. Haraty and Youssef O. Kaddoura Lebanese American University P.O. Box 13-5053 Chouran Beirut, Lebanon 1102 2801 Email:
Nature of Spatial Data. Outline. Spatial Is Special
 Nature of Spatial Data Outline Spatial is special Bad news: the pitfalls of spatial data Good news: the potentials of spatial data Spatial Is Special Are spatial data special? Why spatial data require
INTRODUCTION AND PRINCIPLES OF GIS. Sunil Kumar. Introduction
 INTRODUCTION AND PRINCIPLES OF GIS Introduction Sunil Kumar Director, NWA Geographic Information System (GIS) is a computer based system designed to accept large volume of spatial data derived from a variety
Introduction to Geographic Information Systems
 Geog 58 Introduction to Geographic Information Systems, Fall, 2003 Page 1/8 Geography 58 Introduction to Geographic Information Systems Instructor: Lecture Hours: Lab Hours: X-period: Office Hours: Classroom:
Applied Cartography and Introduction to GIS GEOG 2017 EL. Lecture-2 Chapters 3 and 4
 Applied Cartography and Introduction to GIS GEOG 2017 EL Lecture-2 Chapters 3 and 4 Vector Data Modeling To prepare spatial data for computer processing: Use x,y coordinates to represent spatial features
Linking local multimedia models in a spatially-distributed system
 Linking local multimedia models in a spatially-distributed system I. Miller, S. Knopf & R. Kossik The GoldSim Technology Group, USA Abstract The development of spatially-distributed multimedia models has
Spatial Analysis and Modeling (GIST 4302/5302) Guofeng Cao Department of Geosciences Texas Tech University
 Guofeng Cao Department of Geosciences Texas Tech University") Spatial Analysis and Modeling (GIST 4302/5302) Guofeng Cao Department of Geosciences Texas Tech University TTU Graduate Certificate Geographic Information Science and Technology (GIST) 3 Core Courses and
Spatial Analysis and Modeling (GIST 4302/5302) Guofeng Cao Department of Geosciences Texas Tech University TTU Graduate Certificate Geographic Information Science and Technology (GIST) 3 Core Courses and
GIS CONCEPTS ARCGIS METHODS AND. 3 rd Edition, July David M. Theobald, Ph.D. Warner College of Natural Resources Colorado State University
 GIS CONCEPTS AND ARCGIS METHODS 3 rd Edition, July 2007 David M. Theobald, Ph.D. Warner College of Natural Resources Colorado State University Copyright Copyright 2007 by David M. Theobald. All rights
Michael Harrigan Office hours: Fridays 2:00-4:00pm Holden Hall
 Announcement New Teaching Assistant Michael Harrigan Office hours: Fridays 2:00-4:00pm Holden Hall 209 Email: michael.harrigan@ttu.edu Guofeng Cao, Texas Tech GIST4302/5302, Lecture 2: Review of Map Projection
Creating a Pavement Management System Using GIS
 Christopher Castruita PPD 631 Prof. Barry Waite & Prof. Bonnie Shrewsbury Creating a Pavement Management System Using GIS Problem Definition As is the case with many cities, the city of La Cañada Flintridge
Lecture 1 Introduction to GIS. Dr. Zhang Spring, 2017
 Lecture 1 Introduction to GIS Dr. Zhang Spring, 2017 Topics of the course Using and making maps Navigating GIS Map design Working with spatial data Geoprocessing Spatial data infrastructure Digitizing
Government GIS and its Application for Decision Support
 Government GIS and its Application for Decision Support Zhang Qingpu (Chinese Academy of Surveying and Mapping, Email: zhangqp@casm.ac.cn) Abstract: Application of GIS in government agencies is called
Geography 38/42:376 GIS II. Topic 1: Spatial Data Representation and an Introduction to Geodatabases. The Nature of Geographic Data
 Geography 38/42:376 GIS II Topic 1: Spatial Data Representation and an Introduction to Geodatabases Chapters 3 & 4: Chang (Chapter 4: DeMers) The Nature of Geographic Data Features or phenomena occur as