Land-Use Land-Cover Change Detector
|
|
|
- Alaina Garrison
- 6 years ago
- Views:
Transcription


1 15 th Esri India User Conference 2014 Land-Use Land-Cover Change Detector Rushikesh Padsala ID:- Student, III Semester, M.Tech Geomatics, Faculty of Technology, CEPT University Kasturbhai Lalbhai Campus, University Road, Navrangpura, Ahmedabad, Gujarat
2 CONTENT Introduction What is GIS Customization? What is LULC Change Detector? Working of LULC Change Detector Results of LULC Change Detector Conclusion
3 Introduction GIS softwares are widely used in the fields of Urban Planning, engineering, geography, managing land assets, habitat management, disaster management and many of its relating fields. Users are able to use GIS software because of the developers who bring user friendly tools that can help in executing an application oriented work on GIS platform. One such GIS platform, ESRI s ArcGIS has a built in function to build our own customized tools. Model Builder Python Scripting Model Builder and Python Scripting are the two means of customization through which a user can built his/her own required tool.
4 What Is GIS Customization? Customisation is the process of transforming a system to an individual need. The task of developing specific-purpose, end-user customisations is generally seen as the main focus area of application developers. ESRI s ArcGIS allows its users to customize tools as per users requirement using either Model Builder or Python Scripting. Model Builder allows user to built their customized tools/application without a single line of code. Just drag and drop required tools from search window to model builder window, compile your application and done. Python Scripting can be very useful when there are multiple inputs or complicated loops. Cursors is one of the major USP of Python Scripting.
5 What is LULC Change Detector? Land-Use Land-Cover Change Detector is a small tool scripted in python windows of ESRI s ArcGIS which can be useful for those who are in the fields of engineering, urban planning, urban sprawl, disaster management and all the applications which requires to find temporal land use / land cover changes of the same location. The tool presented here works on the logic of comparing two vector classified images, by comparing its attributes, finding the area and then the percentage change. The need of such tool became important because of lack of freely available customized tools in ArcGIS, which can help to detect changes in land forms in terms of area and percentage. There was urgent use of a tool that can detect such changes and gives analytical statistical results.
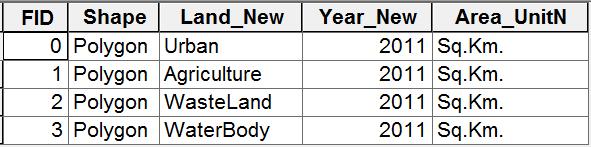
6 Working of LULC Change Detector In order to let LULC Change Detector work some minimum criterias should be checked first:- 1) Both the shapefiles should be in UTM Projection. 2) Both the shapefiles should have same extent, and same numbers of land feature classes. 3) Both the shapefiles must have following field:- 1) FID 2) Land Feature 3) Year 4) Area Unit (Sq.Km, Sq. M., Sq. Ft..) 4) There should be no spelling mistakes in any of the two shapefiles for better and correct output.


7 Working of LULC Change Detector
8 Working of LULC Change Detector Ones both the shapefile are verified as per the minimum criterias of LULC Change Detector, this tool will then union both the shapefiles. Required fields of area will be added. On union of both the shapefiles, areas of each polygon will be compared to corresponding polygon areas of second image. Increase / Decrease in terms of area and percentage will be displayed in union shapefile. Attribute table of union shapefile will be than converted to text reports and result table. From result table, bar graphs can be prepared for visualizing change in Land-Use Land-Cover features within the two temporal vector images.

9 Working of LULC Change Detector
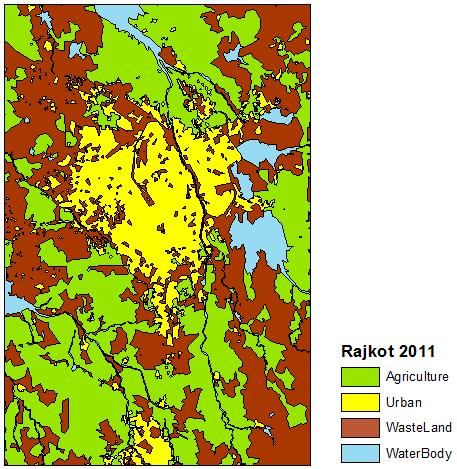
 Automatically generated report text file shows the change in area (in Sq.Km.) and percentage by which a certain LULC feature has increased or decreased within the two different years.")
10 Results of LULC Change Detector 1) Automatically generated Microsoft Excel file showing the overall comparison of land use / land cover changes between two vector images of two different years. 2) Automatically generated report text file shows the change in area (in Sq.Km.) and percentage by which a certain LULC feature has increased or decreased within the two different years. 3) Automatically generated detailed report shows which part, to what area and to what percentage has one feature of year has been changed to what feature of the second year. 4) LULC Change Detector just took 3.83 Seconds to complete its processing for input data. Time depends of no. of LULC class defined and Computer processing speed.


11 Results of LULC Change Detector

12 Results of LULC Change Detector

13 Results of LULC Change Detector

14 Results of LULC Change Detector
15 Results of LULC Change Detector GIS Customization using Python Scripting in ArcGIS is quiet simple and straight forward, provided you have a working knowledge of Python. LULC Change detector saved a lot of time against time consuming manual calculations. Easily able to produce output in notepad (Report text file) and in Microsoft Excel (Result table file). GIS Customization on ESRI s ArcGIS platform can save a lot of time when dealing with developing and solving user defined application on a single click. Main advantage of using python over model builder for this tool is availability of programming advance iterative tools and nested loops. To accomplish a similar result in Model Builder, you would have to construct intricate, and complicated, nested models.
16 THANK YOU
Relief Camp Tool Using GIS
 Relief Camp Tool Using GIS MAYANK SINGH SAKLA 1, JANKI ADHVARYU 2 1 M.TECH GEOMATICS STUDENT, CEPT UNIVERSITY 2 M.TECH GEOMATICS STUDENT, CEPT UNIVERSITY K L CAMPUS UNIVERSITY AREA NAVARANG PURA AHMEDABAD
IndiFrag v2.1: An Object-based Fragmentation Analysis Software Tool
 IndiFrag v2.1: An Object-based Fragmentation Analysis Software Tool Geo-Environmental Cartography and Remote Sensing Group http://cgat.webs.upv.es/software/ Universitat Politècnica de València Introduction
Vegetation Index Calculator
 Vegetation Index Calculator Janki M.Adhvaryu 1, Mayank Singh Sakla 2 1 Student, CEPT University 2 Student, CEPT University K.L.Campus university road Navrangpura Ahmedabad Gujarat, India Word Limit of
Geographical Information Systems
 Geographical Information Systems Geographical Information Systems (GIS) is a relatively new technology that is now prominent in the ecological sciences. This tool allows users to map geographic features
Exercise 2: Working with Vector Data in ArcGIS 9.3
 Exercise 2: Working with Vector Data in ArcGIS 9.3 There are several tools in ArcGIS 9.3 used for GIS operations on vector data. In this exercise we will use: Analysis Tools in ArcToolbox Overlay Analysis
Exercise 2: Working with Vector Data in ArcGIS 9.3
 Exercise 2: Working with Vector Data in ArcGIS 9.3 There are several tools in ArcGIS 9.3 used for GIS operations on vector data. In this exercise we will use: Analysis Tools in ArcToolbox Overlay Analysis
GIS Level 2. MIT GIS Services
 GIS Level 2 MIT GIS Services http://libraries.mit.edu/gis Email: gishelp@mit.edu TOOLS IN THIS WORKSHOP - Definition Queries - Create a new field in the attribute table - Field Calculator - Add XY Data
Arcmap Manual Esri 10 READ ONLINE
 Arcmap Manual Esri 10 READ ONLINE Esri Store: Browsing ArcPad 10.2.2 - ArcPad is mobile field mapping and data collection software designed for GIS professionals. It includes advanced GIS and GPS capabilities
Arcmap Manual Esri 10 READ ONLINE
 Arcmap Manual Esri 10 READ ONLINE If searching for a book Arcmap manual esri 10 in pdf form, then you have come on to the loyal site. We present the utter release of this book in PDF, doc, DjVu, epub,
Geographic Systems and Analysis
 Geographic Systems and Analysis New York University Robert F. Wagner Graduate School of Public Service Instructor Stephanie Rosoff Contact: stephanie.rosoff@nyu.edu Office hours: Mondays by appointment
Investigation of the Effect of Transportation Network on Urban Growth by Using Satellite Images and Geographic Information Systems
 Presented at the FIG Congress 2018, May 6-11, 2018 in Istanbul, Turkey Investigation of the Effect of Transportation Network on Urban Growth by Using Satellite Images and Geographic Information Systems
This paper outlines the steps we took to process the repository file into a Geodatabase Utility Data Model for Bloomfield Township s analysis.
 Title of Paper Importing CAD Drawings into a Utility Data Model Authors Names Kevin G. Broecker & James R. Miller Abstract This presentation covers the process needed to integrate data from a CAD drawing
Outline. Chapter 1. A history of products. What is ArcGIS? What is GIS? Some GIS applications Introducing the ArcGIS products How does GIS work?
 Outline Chapter 1 Introducing ArcGIS What is GIS? Some GIS applications Introducing the ArcGIS products How does GIS work? Basic data formats The ArcCatalog interface 1-1 1-2 A history of products Arc/Info
Data Structures & Database Queries in GIS
 Data Structures & Database Queries in GIS Objective In this lab we will show you how to use ArcGIS for analysis of digital elevation models (DEM s), in relationship to Rocky Mountain bighorn sheep (Ovis
USING GIS IN WATER SUPPLY AND SEWER MODELLING AND MANAGEMENT
 USING GIS IN WATER SUPPLY AND SEWER MODELLING AND MANAGEMENT HENRIETTE TAMAŠAUSKAS*, L.C. LARSEN, O. MARK DHI Water and Environment, Agern Allé 5 2970 Hørsholm, Denmark *Corresponding author, e-mail: htt@dhigroup.com
Software for Landuse Management: Modelling with GIS
 O. R. SODEINDE, Nigeria Key words: ABSTRACT Land use management has been a very important issue in the planning and maintenance of environmental and economic development of a geographic area. Therefore,
ENV208/ENV508 Applied GIS. Week 1: What is GIS?
 ENV208/ENV508 Applied GIS Week 1: What is GIS? 1 WHAT IS GIS? A GIS integrates hardware, software, and data for capturing, managing, analyzing, and displaying all forms of geographically referenced information.
Among various open-source GIS programs, QGIS can be the best suitable option which can be used across partners for reasons outlined below.
 Comparison of Geographic Information Systems (GIS) software As of January 2018, WHO has reached an agreement with ESRI (an international supplier of GIS software) for an unlimited use of ArcGIS Desktop
Urban Canopy Tool User Guide `bo`
 Urban Canopy Tool User Guide `bo` ADMS Urban Canopy Tool User Guide Version 2.0 June 2014 Cambridge Environmental Research Consultants Ltd. 3, King s Parade Cambridge CB2 1SJ UK Telephone: +44 (0)1223
ESRI* Object Models; Data Capture
 ESRI* Object Models; Data Capture * Environmental Systems Research Institute Feature Class (spatial table) Number Age_Ma 1_sigma Rx_Type Size_kg 123 124 125 142 1.5 B_schist 136 2.0 G_schist Object Class
K. Zainuddin et al. / Procedia Engineering 20 (2011)
") Available online at www.sciencedirect.com Procedia Engineering 20 (2011) 154 158 The 2 nd International Building Control Conference 2011 Developing a UiTM (Perlis) Web-Based of Building Space Management
Available online at www.sciencedirect.com Procedia Engineering 20 (2011) 154 158 The 2 nd International Building Control Conference 2011 Developing a UiTM (Perlis) Web-Based of Building Space Management
Evaluating Corridors. Jeff Jenness Dan Majka Paul Beier. CorridorDesigner Workshop Fall 2007
 Evaluating Corridors Jeff Jenness Dan Majka Paul Beier CorridorDesigner Workshop Fall 2007 1 1 Evaluating Corridors Test Alternative Corridors Least cost methods always provide a best solution, even when
ESRI Object Models and Data Capture 2/1/2018
 Number 123 124 125 ESRI* Object Models; Data Capture Feature Class (spatial table) Age_Ma 142 136 1_sigma 1.5 2.0 Rx_Type B_schist G_schist Object Class (nonspatial table) Size_kg 3.4 1.3 Y Control Point
Assessment of Physical status and Irrigation potential of Canals using ArcPy
 Assessment of Physical status and Irrigation potential of Canals using ArcPy Ekta Gupta 1, R.N. Sankhua 2 1 JRF, CES, Indian Institute of Science, Bangalore 2 Director, National Water Academy, Pune Abstract:
Enabling ENVI. ArcGIS for Server
 Enabling ENVI throughh ArcGIS for Server 1 Imagery: A Unique and Valuable Source of Data Imagery is not just a base map, but a layer of rich information that can address problems faced by GIS users. >
GIS Workshop UCLS_Fall Forum 2014 Sowmya Selvarajan, PhD TABLE OF CONTENTS
 TABLE OF CONTENTS TITLE PAGE NO. 1. ArcGIS Basics I 2 a. Open and Save a Map Document 2 b. Work with Map Layers 2 c. Navigate in a Map Document 4 d. Measure Distances 4 2. ArcGIS Basics II 5 a. Work with
ESRI* Object Models; Data Capture
 ESRI* Object Models; Data Capture * Environmental Systems Research Institute Feature Class (spatial table) Number Age_Ma 1_sigma Rx_Type Size_kg 123 124 125 142 1.5 B_schist 136 2.0 G_schist Object Class
ESRI Object Models and Data Capture 9/18/ /18/2014 M. Helper GEO327G/386G, UT Austin 2. ESRI Arc/Info ArcView ArcGIS
 ESRI Object Models; Data Capture Conceptual Models Conceptual Models Characterized all features or phenomena as: Feature Class (spatial table) Number Age_Ma 1_sigma Rx_Type 123 142 1.5 B_schist 124 136
Dynamics Final Report
 Dynamics Final Report Sophie Li and Hannah Wilk 1 Abstract We set out to develop a n-rigid body solver in MatLab. We wanted a user to define how many rigid bodies there are, and our system creates the
GIS for the Beginner on a Budget
 GIS for the Beginner on a Budget Andre C. Bally, RLA, GIS Coordinator, Harris County Public Infrastructure Department Engineering Division This presentation, GIS for Beginners on a Budget. will briefly
Lecture 2. Introduction to ESRI s ArcGIS Desktop and ArcMap
 Lecture 2 Introduction to ESRI s ArcGIS Desktop and ArcMap Outline ESRI What is ArcGIS? ArcGIS Desktop ArcMap Overview Views Layers Attribute Tables Help! Scale Tips and Tricks ESRI Environmental Systems
Utilizing Data from American FactFinder with TIGER/Line Shapefiles in ArcGIS
 Utilizing Data from American FactFinder with TIGER/Line Shapefiles in ArcGIS Web Adams, GISP Data Dissemination Specialist U.S. Census Bureau New York Regional Office 1 What We Do Decennial Census Every
Visualize and interactively design weight matrices
 Visualize and interactively design weight matrices Angelos Mimis *1 1 Department of Economic and Regional Development, Panteion University of Athens, Greece Tel.: +30 6936670414 October 29, 2014 Summary
DATA SCIENCE SIMPLIFIED USING ARCGIS API FOR PYTHON
 DATA SCIENCE SIMPLIFIED USING ARCGIS API FOR PYTHON LEAD CONSULTANT, INFOSYS LIMITED SEZ Survey No. 41 (pt) 50 (pt), Singapore Township PO, Ghatkesar Mandal, Hyderabad, Telengana 500088 Word Limit of the
Time Series Analysis with SAR & Optical Satellite Data
 Time Series Analysis with SAR & Optical Satellite Data Thomas Bahr ESRI European User Conference Thursday October 2015 harris.com Motivation Changes in land surface characteristics mirror a multitude of
Geographical Information System in Managing Mega Infrastructure Projects
 Geographical Information System in Managing Mega Infrastructure Projects Ankita Adhikary, M.Sc. Geomatics and Space Application, CEPT University Ahmedabad G eographic Information System (GIS) is a computer
Abstract: Traffic accident data is an important decision-making tool for city governments responsible for
 Kalen Myers, GIS Analyst 1100 37 th St Evans CO, 80620 Office: 970-475-2224 About the Author: Kalen Myers is GIS Analyst for the City of Evans Colorado. She has a bachelor's degree from Temple University
What is a compact city? How could it be measured?
 What is a compact city? How could it be measured? Madhu Singh Transport Planner Directorate of Urban Land Transport, Bangalore Guided By: Professor H. M. Shivanand Swamy CEPT University, Ahmedabad Cities
Course overview. Grading and Evaluation. Final project. Where and When? Welcome to REM402 Applied Spatial Analysis in Natural Resources.
 Welcome to REM402 Applied Spatial Analysis in Natural Resources Eva Strand, University of Idaho Map of the Pacific Northwest from http://www.or.blm.gov/gis/ Where and When? Lectures Monday & Wednesday
v WMS Tutorials GIS Module Importing, displaying, and converting shapefiles Required Components Time minutes
 v. 11.0 WMS 11.0 Tutorial Importing, displaying, and converting shapefiles Objectives This tutorial demonstrates how to import GIS data, visualize it, and convert it into WMS coverage data that could be
Geo-spatial Analysis for Prediction of River Floods
 Geo-spatial Analysis for Prediction of River Floods Abstract. Due to the serious climate change, severe weather conditions constantly change the environment s phenomena. Floods turned out to be one of
NR402 GIS Applications in Natural Resources
 NR402 GIS Applications in Natural Resources Lesson 1 Introduction to GIS Eva Strand, University of Idaho Map of the Pacific Northwest from http://www.or.blm.gov/gis/ Welcome to NR402 GIS Applications in
Your Perfect 3D World (BIM and GIS Integrated)
") Your Perfect 3D World (BIM and GIS Integrated) June 2015 Larisa Kruger Background Larisa Kruger- Enterprise GIS Manager FITS- Facilities Information Technology Services 2 years (GIS for 15) 2 FTE, 4 students
Your Perfect 3D World (BIM and GIS Integrated) June 2015 Larisa Kruger Background Larisa Kruger- Enterprise GIS Manager FITS- Facilities Information Technology Services 2 years (GIS for 15) 2 FTE, 4 students
GIS Functions and Integration. Tyler Pauley Associate Consultant
 GIS Functions and Integration Tyler Pauley Associate Consultant Contents GIS in AgileAssets products Displaying data within AMS Symbolizing the map display Display on Bing Maps Demo- Displaying a map in
GIS Quick Facts. CIVL 1101 GIS Quick Facts 1/5.
 CIVL 1101 1/5 What is GIS? Geographic Information Systems (GIS) provide a platform for displaying and analyzing spatial data. GIS systems allow you to view multiple layers of data simultaneously. GIS is
THE CONSERVATION LANDSCAPE CONTEXT TOOLBOX: A Custom ESRI ArcToolbox for the Stewardship of Conservation Lands in Rhode Island
 THE CONSERVATION LANDSCAPE CONTEXT TOOLBOX: A Custom ESRI ArcToolbox for the Stewardship of Conservation Lands in Rhode Island Ann Borowik M.E.S.M. Research Project University of Rhode Island May 2008
SPATIAL MODELING GIS Analysis Winter 2016
 SPATIAL MODELING GIS Analysis Winter 2016 Spatial Models Spatial Modeling attempts to represent how the world works All models are wrong, but some are useful (G.E. Box, quoted in course textbook pg. 379)
Transactions on Information and Communications Technologies vol 18, 1998 WIT Press, ISSN
 STREAM, spatial tools for river basins, environment and analysis of management options Menno Schepel Resource Analysis, Zuiderstraat 110, 2611 SJDelft, the Netherlands; e-mail: menno.schepel@resource.nl
GENERALIZATION IN THE NEW GENERATION OF GIS. Dan Lee ESRI, Inc. 380 New York Street Redlands, CA USA Fax:
 GENERALIZATION IN THE NEW GENERATION OF GIS Dan Lee ESRI, Inc. 380 New York Street Redlands, CA 92373 USA dlee@esri.com Fax: 909-793-5953 Abstract In the research and development of automated map generalization,
Chapter 1. GIS Fundamentals
 1. GIS Overview Chapter 1. GIS Fundamentals GIS refers to three integrated parts. Geographic: Of the real world; the spatial realities, the geography. Information: Data and information; their meaning and
Studying Topography, Orographic Rainfall, and Ecosystems (STORE)
") Studying Topography, Orographic Rainfall, and Ecosystems (STORE) Introduction Basic Lesson 3: Using Microsoft Excel to Analyze Weather Data: Topography and Temperature This lesson uses NCDC data to compare
Studying Topography, Orographic Rainfall, and Ecosystems (STORE) Introduction Basic Lesson 3: Using Microsoft Excel to Analyze Weather Data: Topography and Temperature This lesson uses NCDC data to compare
Using Microsoft Excel
 Using Microsoft Excel Objective: Students will gain familiarity with using Excel to record data, display data properly, use built-in formulae to do calculations, and plot and fit data with linear functions.
OBEUS. (Object-Based Environment for Urban Simulation) Shareware Version. Itzhak Benenson 1,2, Slava Birfur 1, Vlad Kharbash 1
 Shareware Version. Itzhak Benenson 1,2, Slava Birfur 1, Vlad Kharbash 1") OBEUS (Object-Based Environment for Urban Simulation) Shareware Version Yaffo model is based on partition of the area into Voronoi polygons, which correspond to real-world houses; neighborhood relationship
OBEUS (Object-Based Environment for Urban Simulation) Shareware Version Yaffo model is based on partition of the area into Voronoi polygons, which correspond to real-world houses; neighborhood relationship
Applying GIS to Hydraulic Analysis
 Texas A&M University Department of Civil Engineering CVEN689 Applications of GIS to Civil Engineering Instructor: Francisco Olivera, Ph.D., P.E. Applying GIS to Hydraulic Analysis Lim, Chae Kwan April
Using a GIS to Calculate Area of Occupancy. Part 1: Creating a Shapefile Grid
 Using a GIS to Calculate Area of Occupancy Part 1: Creating a Shapefile Grid By Ryan Elliott California Natural Diversity Database, A NatureServe network program December 2008 This document describes the
HIRES 2017 Syllabus. Instructors:
 HIRES 2017 Syllabus Instructors: Dr. Brian Vant-Hull: Steinman 185, 212-650-8514, brianvh@ce.ccny.cuny.edu Ms. Hannah Aizenman: NAC 7/311, 212-650-6295, haizenman@ccny.cuny.edu Dr. Tarendra Lakhankar:
ArcGIS Pro: Analysis and Geoprocessing. Nicholas M. Giner Esri Christopher Gabris Blue Raster
 ArcGIS Pro: Analysis and Geoprocessing Nicholas M. Giner Esri Christopher Gabris Blue Raster Agenda What is Analysis and Geoprocessing? Analysis in ArcGIS Pro - 2D (Spatial xy) - 3D (Elevation - z) - 4D
Outline Anatomy of ArcGIS Metadata Data Types Vector Raster Conversion Adding Data Navigation Symbolization Methods Layer Files Editing Help Files
 UPlan Training Lab Exercise: Introduction to ArcGIS Outline Anatomy of ArcGIS Metadata Data Types Vector Raster Conversion Adding Data Navigation Symbolization Methods Layer Files Editing Help Files Anatomy
Linear Referencing in Boulder County, CO. Getting Started
 Linear Referencing in Boulder County, CO Getting Started 1 Authors Janie Pierre GIS Technician, Boulder County Road centerline and storm sewer geodatabases & maps John Mosher GIS Specialist, Boulder County
4. GIS Implementation of the TxDOT Hydrology Extensions
 4. GIS Implementation of the TxDOT Hydrology Extensions A Geographic Information System (GIS) is a computer-assisted system for the capture, storage, retrieval, analysis and display of spatial data. It
GIS FOR PLANNING. Course Overview. Schedule. Instructor. Prerequisites. Urban Planning 792 Thursday s 5:30-8:10pm SARUP 158
 GIS FOR PLANNING Urban Planning 792 Thursday s 5:30-8:10pm SARUP 158 Schedule Class/Lab - SARUP 158 Thursdays 5:30pm - 8:10pm Office Hours - By Appointment Project Ideas - Week 4 Final - 5/10/2018 Instructor
Visualization of Commuter Flow Using CTPP Data and GIS
 Visualization of Commuter Flow Using CTPP Data and GIS Research & Analysis Department Southern California Association of Governments 2015 ESRI User Conference l July 23, 2015 l San Diego, CA Jung Seo,
Environmental Systems Research Institute
 Introduction to ArcGIS ESRI Environmental Systems Research Institute Redlands, California 2 ESRI GIS Development Arc/Info (coverage model) Versions 1-7 from 1980 1999 Arc Macro Language (AML) ArcView (shapefile
Write a report (6-7 pages, double space) on some examples of Internet Applications. You can choose only ONE of the following application areas:
 on some examples of Internet Applications. You can choose only ONE of the following application areas:") UPR 6905 Internet GIS Homework 1 Yong Hong Guo September 9, 2008 Write a report (6-7 pages, double space) on some examples of Internet Applications. You can choose only ONE of the following application
UPR 6905 Internet GIS Homework 1 Yong Hong Guo September 9, 2008 Write a report (6-7 pages, double space) on some examples of Internet Applications. You can choose only ONE of the following application
SCHOOL OF ENGINEERING AND TECHNOLOGY COMPUTER LAB
 PHASE 1_6 TH SESSION ARCGIS TRAINING AT KU GIS LABS: INTRODUCTION TO GIS: EXPLORING ARCCATALOG AND ARCGIS TOOLS 6 TH SESSION REPORT: 3 RD -5 TH SEPTEMBER 2014 SCHOOL OF ENGINEERING AND TECHNOLOGY COMPUTER
Demystifying ArcGIS Online. Karen Lizcano Esri
 Demystifying ArcGIS Online Karen Lizcano Esri An Integrated Web GIS Platform Desktop Web Device Powered by Services Managed via Portal Access from any Device Portal Server Online Content and Services ArcGIS
GIS Lecture 4: Data. GIS Tutorial, Third Edition GIS 1
 GIS Lecture 4: Data GIS 1 Outline Data Types, Tables, and Formats Geodatabase Tabular Joins Spatial Joins Field Calculator ArcCatalog Functions GIS 2 Data Types, Tables, Formats GIS 3 Directly Loadable
Visualization of Origin- Destination Commuter Flow Using CTPP Data and ArcGIS
 Visualization of Origin- Destination Commuter Flow Using CTPP Data and ArcGIS Research & Analysis Department Southern California Association of Governments 2015 ESRI User Conference l July 23, 2015 l San
Mitsuhiko Kawakami and Zhenjiang Shen Department of Civil Engineering Faculty of Engineering Kanazawa University Japan ABSTRACT
 ABSTRACT Formulation of an Urban and Regional Planning System Based on a Geographical Information System and its Application - A Case Study of the Ishikawa Prefecture Area of Japan - Mitsuhiko Kawakami
v Prerequisite Tutorials GSSHA WMS Basics Watershed Delineation using DEMs and 2D Grid Generation Time minutes
 v. 10.1 WMS 10.1 Tutorial GSSHA WMS Basics Creating Feature Objects and Mapping Attributes to the 2D Grid Populate hydrologic parameters in a GSSHA model using land use and soil data Objectives This tutorial
Introduction to ArcGIS 10.2
 Introduction to ArcGIS 10.2 Francisco Olivera, Ph.D., P.E. Srikanth Koka Lauren Walker Aishwarya Vijaykumar Keri Clary Department of Civil Engineering April 21, 2014 Contents Brief Overview of ArcGIS 10.2...
Traffic accidents and the road network in SAS/GIS
 Traffic accidents and the road network in SAS/GIS Frank Poppe SWOV Institute for Road Safety Research, the Netherlands Introduction The first figure shows a screen snapshot of SAS/GIS with part of the
Problems and Challenges
 2018 Esri Petroleum GIS Conference Problems and Challenges May 9 10, 2018 Houston, Texas George R. Brown Convention Center Disunity of drawing standards and format Large amount of work in Cartography,
Portal for ArcGIS: An Introduction
 Portal for ArcGIS: An Introduction Derek Law Esri Product Management Esri UC 2014 Technical Workshop Agenda Web GIS pattern Product overview Installation and deployment Security and groups Configuration
ST-Links. SpatialKit. Version 3.0.x. For ArcMap. ArcMap Extension for Directly Connecting to Spatial Databases. ST-Links Corporation.
 ST-Links SpatialKit For ArcMap Version 3.0.x ArcMap Extension for Directly Connecting to Spatial Databases ST-Links Corporation www.st-links.com 2012 Contents Introduction... 3 Installation... 3 Database
Exelis and Esri Technologies for Defense and National Security. Cherie Muleh
 Exelis and Esri Technologies for Defense and National Security Cherie Muleh Cherie.Muleh@exelisinc.com ENVI IMAGERY AND DATA BECOME KNOWLEDGE > Add information from imagery to your GIS > Automated workflows
GED 554 IT & GIS. Lecture 6 Exercise 5. May 10, 2013
 GED 554 IT & GIS Lecture 6 Exercise 5 May 10, 2013 Free GIS data sources ******************* Mapping numerical data & Symbolization ******************* Exercise: Making maps for presentation GIS DATA SOFTWARE
Geography 281 Map Making with GIS Project Four: Comparing Classification Methods
 Geography 281 Map Making with GIS Project Four: Comparing Classification Methods Thematic maps commonly deal with either of two kinds of data: Qualitative Data showing differences in kind or type (e.g.,
Using Python to Automate Map Exports
 Using Python to Automate Map Exports Don Katnik Maine Department of Inland Fisheries and Wildlife Northeast ARC Users' Conference, 2016 Falmouth, MA DISCLAIMER: I don't work for Python Background Maine
Using Geographic Information Systems and Remote Sensing Technology to Analyze Land Use Change in Harbin, China from 2005 to 2015
 Using Geographic Information Systems and Remote Sensing Technology to Analyze Land Use Change in Harbin, China from 2005 to 2015 Yi Zhu Department of Resource Analysis, Saint Mary s University of Minnesota,
Introduction to Portal for ArcGIS. Hao LEE November 12, 2015
 Introduction to Portal for ArcGIS Hao LEE November 12, 2015 Agenda Web GIS pattern Product overview Installation and deployment Security and groups Configuration options Portal for ArcGIS + ArcGIS for
Transactions on Information and Communications Technologies vol 18, 1998 WIT Press, ISSN
 GIS in the process of road design N.C. Babic, D. Rebolj & L. Hanzic Civil Engineering Informatics Center, University ofmaribor, Faculty of Civil Engineering, Smetanova 17, 2000 Maribor, Slovenia. E-mail:
Urban Spatial Scenario Design Modelling (USSDM) in Dar es Salaam: Background Information
 in Dar es Salaam: Background Information") Urban Spatial Scenario Design Modelling (USSDM) in Dar es Salaam: Background Information Modelling urban settlement dynamics in Dar es Salaam Revision: 2 (July 2013) Prepared by: Katja Buchta TUM team
Urban Spatial Scenario Design Modelling (USSDM) in Dar es Salaam: Background Information Modelling urban settlement dynamics in Dar es Salaam Revision: 2 (July 2013) Prepared by: Katja Buchta TUM team
SRJC Applied Technology 54A Introduction to GIS
 SRJC Applied Technology 54A Introduction to GIS Overview Lecture of Geographic Information Systems Fall 2004 Santa Rosa Junior College Presented By: Tim Pudoff, GIS Coordinator, County of Sonoma, Information
Zonal Analysis: A GIS lecture tutorial. Prof. Yuji MURAYAMA, PhD. Mr. Ronald C. ESTOQUE, MSc.
 1 Zonal Analysis: A GIS lecture tutorial Prof. Yuji MURAYAMA, PhD. Mr. Ronald C. ESTOQUE, MSc. 2011 Contents, Data & Software Used Contents 2 1. Introduction 2. Basic concepts & definitions 3. Zonal analysis
Lecture 5. GIS Data Capture & Editing. Tomislav Sapic GIS Technologist Faculty of Natural Resources Management Lakehead University
 Lecture 5 GIS Data Capture & Editing Tomislav Sapic GIS Technologist Faculty of Natural Resources Management Lakehead University GIS Data Input Surveying/GPS Data capture Facilitate data capture Final
Watershed Delineation
 Watershed Delineation Jessica L. Watkins, University of Georgia 2 April 2009 Updated by KC Love February 25, 2011 PURPOSE For this project, I delineated watersheds for the Coweeta synoptic sampling area
GIS = Geographic Information Systems;
 What is GIS GIS = Geographic Information Systems; What Information are we talking about? Information about anything that has a place (e.g. locations of features, address of people) on Earth s surface,
Gridded Traffic Density Estimates for Southern
 Gridded Traffic Density Estimates for Southern California, 1995-2014 User Notes authored by Beau, 11/28/2017 METADATA: Each raster file contains Traffic Density data for one year (1995, 2000, 2005, 2010,
Leveraging ArcGIS Online Elevation and Hydrology Services. Steve Kopp, Jian Lange
 Leveraging ArcGIS Online Elevation and Hydrology Services Steve Kopp, Jian Lange Topics An overview of ArcGIS Online Elevation Analysis Using Elevation Analysis Services in ArcGIS for Desktop Using Elevation
Final Group Project Paper. Where Should I Move: The Big Apple or The Lone Star State
 Final Group Project Paper Where Should I Move: The Big Apple or The Lone Star State By: Nathan Binder, Shannon Scolforo, Kristina Conste, Madison Quinones Main Goal: Determine whether New York or Texas
Acknowledgments xiii Preface xv. GIS Tutorial 1 Introducing GIS and health applications 1. What is GIS? 2
 Acknowledgments xiii Preface xv GIS Tutorial 1 Introducing GIS and health applications 1 What is GIS? 2 Spatial data 2 Digital map infrastructure 4 Unique capabilities of GIS 5 Installing ArcView and the
ArcGIS Pro: Essential Workflows STUDENT EDITION
 ArcGIS Pro: Essential Workflows STUDENT EDITION Copyright 2018 Esri All rights reserved. Course version 6.0. Version release date August 2018. Printed in the United States of America. The information contained
Introduction to Portal for ArcGIS
 Introduction to Portal for ArcGIS Derek Law Product Management March 10 th, 2015 Esri Developer Summit 2015 Agenda Web GIS pattern Product overview Installation and deployment Security and groups Configuration
Scripting and Geoprocessing for Raster Analysis Multiyear Crop Analysis
 Authors: David T. Hansen and Barbara Simpson Scripting and Geoprocessing for Raster Analysis Multiyear Crop Analysis Presented by David T. Hansen and Barbara Simpson at the ESRI User Conference, 2012,
GIS 520 Data Cardinality. Joining Tabular Data to Spatial Data in ArcGIS
 GIS 520 Data Cardinality Joining Tabular Data to Spatial Data in ArcGIS Joining Tabular Data to Spatial Data in ArcGIS Outline Working with Zip Code Data Data Cardinality Issues Exploring Data Format Requirements
Data Aggregation with InfraWorks and ArcGIS for Visualization, Analysis, and Planning
 Data Aggregation with InfraWorks and ArcGIS for Visualization, Analysis, and Planning Stephen Brockwell President, Brockwell IT Consulting, Inc. Join the conversation #AU2017 KEYWORD Class Summary Silos
VENUS INTERNATIONAL COLLEGE OF TECHNOLOGY
 VENUS INTERNATIONAL COLLEGE OF TECHNOLOGY DEPARTMENT OF E&C ENGINEERING A REPORT ON INDUSTRIAL VISIT AT BISAG, GANDHINAGAR PROFILE: BISAG provides specialized services and solutions in implementing mapbased
Task 1: Start ArcMap and add the county boundary data from your downloaded dataset to the data frame.
 Exercise 6 Coordinate Systems and Map Projections The following steps describe the general process that you will follow to complete the exercise. Specific steps will be provided later in the step-by-step
Three Ways the CSU is Using Geographic Information Systems (GIS) to Inform Decisions
 to Inform Decisions") Three Ways the CSU is Using Geographic Information Systems (GIS) to Inform Decisions Diana Lavery, Senior Research Analyst California State University, Office of the Chancellor California Association of
Three Ways the CSU is Using Geographic Information Systems (GIS) to Inform Decisions Diana Lavery, Senior Research Analyst California State University, Office of the Chancellor California Association of