MEDIEVAL DISTORTIONS: THE PROJECTIONS OF ANCIENT MAPS. W.R TOBLER University of Michigan, Ann Arbor
|
|
|
- Marvin Burke
- 6 years ago
- Views:
Transcription
1 MEDIEVAL DISTORTIONS: THE PROJECTIONS OF ANCIENT MAPS W.R TOBLER University of Michigan, Ann Arbor ABSTRACT. Estimates of the map projection employed for an ancient map is a prerequisite for a variety of other studies. The preliminary evaluation presented here has yielded empirical equations for the Hereford map and illustrated the agreement of a portolan chart with an oblique Mercator projection The study of ancient maps provides one of the fascinating aspects of historical geography. Such maps can be analyzed for many purposes and from several points of view. The following comments refer only to the estimation of the map projection implied by the ancient mappae mundi and portolan charts. Evaluation of the map projection of these old maps is of assistance in the determination of the accuracy of the maps, and may provide insight into their method of construction. Modem theories regarding the ancients perception of the world also may require consideration of the map projection employed for maps. The maps in the two classes under investigation do not contain any indication of the terrestrial graticule of latitude and longitude. This has led some students to conclude that the maps are not based on any map projection. 1 This point requires clarification. Certainly the lack of the graticule does not imply the absence of a projection. Even modem maps are occasionally published without this grid. 2 More telling is the high probability the sphericity of the earth was unknown to, or was not considered relevant by, the individuals who constructed the maps. If this is the case the maps would be constructed as though the earth were flat. Inconsistencies between the plotting and the observational information then might arise; these inconsistencies could be attributed to the (unavoidable) errors in one or the other, or both. For a small area the errors and inconsistencies might be quite small and could go unnoticed. Inconsistencies are not necessary or inevitable, however. No set of observational information specifying the location of any terrestrial position by not more than two independent measures will lead to inconsistencies when plotted. This is true whether the earth is considered round or flat. In either of the above events it is correct to say that the map is not based on a map projection only in the sense that the cartographer involved was not consciously employing a map projection. 3 But, as one learns from any elementary work on map making, every map requires a map projection. The ancient maps therefore are implicitly referred to some map projection. The next difficulty, it seems, occurs if it is assumed that this implicit projection is one of the now-known projections. For example, the portolan charts have been compared with charts drawn on Mercator s projection and on the square projection. 4 Suppose that the match is sufficiently poor to conclude that the chart is not drawn on either of these two projections. This does not prove that the chart is not based on a map projection; such a conclusion can in fact never be drawn if one accepts the notion of an implicit map projection. The search, then, must continue for a map projection, that may be any of the several hundred now known, or may be one that is completely unknown today. The problem can be attacked from several directions. Most helpful is an examination of the method of construction of the maps, if this is known. Typically this turns out to be inconclusive, and is in fact one of the questions that many have attempted to answer. But there are some hints that allow the range of possible projections to be narrowed down to a relatively limited few. A second obvious approach is to attempt to sketch the lines of latitude and
2 longitude on the map, as estimated by identification of locations shown thereon. Examination of the graticule, its curvature and so on, should provide hints as to a reasonable family of projections. A crucial point has now been reached. On the basis of some study it is postulated that this projection forms the basis for the map. How is this hypothesis to be tested? The test generally consists of superimposing a map drawn on the postulated projection over the original map, with a scale adjustment and shifting until the best average coincidence is obtained. Since one knows that the agreement of the two maps will not be perfect, the question is now one of deciding how much agreement is necessary before the hypothesis is to be accepted. The procedure outlined below does not answer this question, but it does allow one to say, with relative precision, how great the agreement is, and thus permits one to rank, from greatest to least agreement, all projections for which one cares to carry through the necessary operations. The method requires extensive observations and computations but is perfectly general and may be applied whenever it is desired to ascertain the agreement of a questionable map with a particular map projection. The necessary calculations may seem formidable but entail less than five minutes on a modem highspeed digital computer. To begin it is necessary to identify a large number of points on the map. By identify is meant to record the modem latitudes and longitudes of these points. The next step is to record the map coordinates of these same points. Any system of coordinates will serve but rectangular (x, y) coordinates are the most convenient. It does not matter in the least what units are used for the coordinates, and it is not necessary to determine the scale of the chart or any distances thereon. 5 Nor does the orientation of the grid system matter. The postulated map projection will be defined by a mathematical relation of the form: X = f(φ, λ), Y =g (φ, λ), where φ is the latitude and λis the longitude, and X and Y are the corresponding map projection coordinates. Using this relation calculate the map projection coordinates of all of the points identified by latitude and longitude. This is where the points should be if the projection were to give a perfect fit. These calculated coordinates (X, Y) are now to be compared to the observed map coordinates (x, y). Since the coordinates employed for the recording of the observations were quite arbitrary, a different result would be obtained for each possible set of recording coordinates. It is therefore necessary to apply the mathematical equivalent of rotation and change of scale, as might be obtained by use of an optical reducing-enlarging instrument, to give the best possible overall average fit. This is given by a least squares Euclidean transformation, which brings the numbers given the recorded observations into the same units as the calculated map projection coordinates (see Appendix). The comparison of the map projection with the map is now made by calculating the difference between the observed and calculated locations for corresponding points. The correlation coefficient between the two sets of coordinates gives the amount of agreement, and areas of greatest disagreement may provide hints as to a more suitable map projection. With the same observational information the entire procedure can be repeated a second time for a new map projection, and so on. As one already has recorded, for the foregoing operations, the latitudes and longitudes of a large number of places along with the map locations (in some arbitrary coordinate system) of these same identified points, one can continue by obtaining an empirical estimate of the equations defining the map projection. The problem can be phrased thus: find the equations which, when entered with any specific latitude and longitude value, result in the observed x and y coordinate values. The mathematical theory indicates that this can always be achieved with a
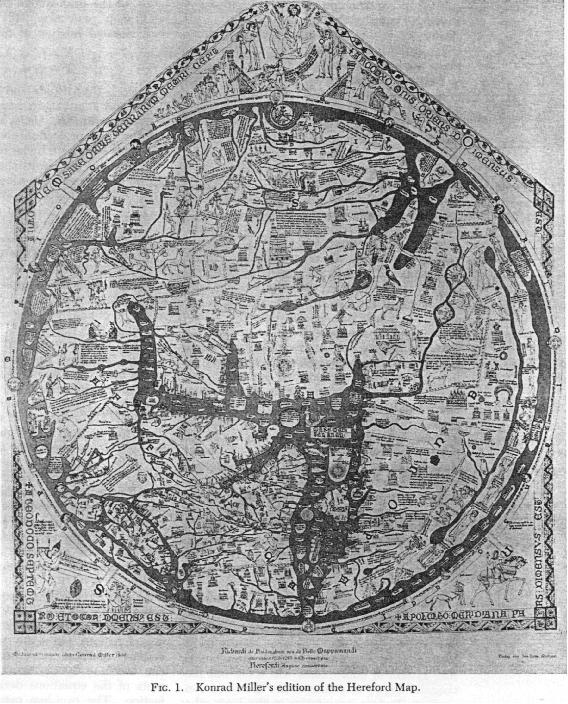
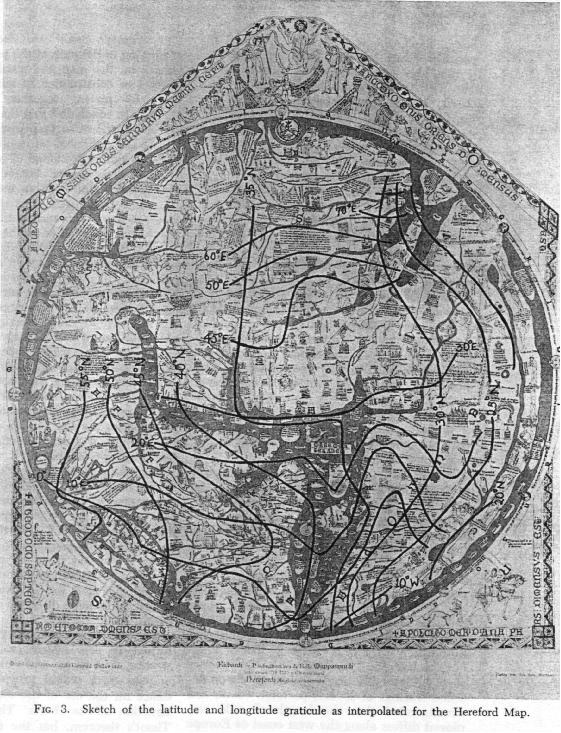
3 sufficiently complicated equation. In practice it is difficult to obtain a perfect fit and one is generally content with an equation which reproduces the observations with a high degree of reliability. This is reasonable since it is not desired to reproduce minor errors, such as might be caused by the shrinkage which has occurred on a 500-year-old map. The mathematical fitting procedure generally employed is the method of least squares polynomial or Fourier series curve fitting. 6 The equations obtained in this manner enable one to calculate, and draw, the latitude and longitude graticule at any desired interval. Equaly importantly, they alow calculation of Tisot s measures of map projection distortion. 7 Formulation of the problem in terms of the distortion is independent of any hypothesis regarding the specific map projection, but can be employed to infer whether or not the projection has specific properties. This in turn may be of assistance in determining the projection. A word of caution is necessary here since the necessary differentiation of the empirical equations may be subject to large errors. 8 The same comment holds true if a graphic determination of Tisot s measures is applied to visualy sketched lines of latitude and longitude. 9 THE HEREFORD MAP The Hereford map 10 is one of the most famous of the surviving medieval mappae mundi (Fig. 1). Certainly it is one of the largest (53 x 65 inches). It is a product of the later Middle Ages, circa 1283, and is still in the cathedral at Hereford, England. In many respects the map represents a culmination of 1,000 years of mapping efforts, having precedents from Roman times. The map has been the subject of at least one book, and several monographs and articles. 11 At least three large reproductions of the map have been published. A detailed description of the map, therefore, is not necessary. The form of the map follows the typical circular T-in-O style, with Jerusalem in the center and Asia (paradise) at the top. In many respects the map is more a representation of religious reality than geographical reality. On the other hand, the map preserves most of the topological properties 12 of a map projection; if this were not the case the drawing would not be recognizable as a map. The Hereford map is believed to have been prepared by copying some other ancient map, with supplementary information obtained from itineraries. This does not provide much assistance in an initial guess at a map projection. The many authors who have discussed the Hereford map have ignored, or rejected, the question of a map projection and no assistance can be gained here, though these authors are extremely valuable in providing identification of names. The form of the map, however, suggests an azimuthal projection, perhaps with a larger scale at the center of the map. The orthographic projection is one (of many) which has these properties. The empirical observations suggest that this is not a poor guess. Konrad Miler s 3/7 th size edition of the Hereford map was employed to identify 155 locations. This is a tedious operation and subject to error. Each identification consisted of map coordinates, and modem latitude and longitude. 13 The dispersion of the observations is rather uneven since it proved impossible to identify anything in some parts of the map, particularly the margins. Misidentifications may have occurred, in which event the consequent analysis will be slightly distorted. Direct correlations between the latitude and the y coordinate, and between the longitude and the x coordinate are high (Fig. 2). This is to be expected since the Hereford map preserves most of the topological properties of any map projection. The results of further computations indicate that the square projection provides a seventy-three percent match to the Hereford map, and that
4 an oblique orthographic projection centered at Jerusalem provides an eighty-four percent match. Using a polynomial approximation the locus of lines of latitude and longitude for the Hereford map can be reproduced with a fidelity of ninety-five percent. A computer print of these calculated lines in fact agrees quite well with a manually interpolated graticule. The details of these results are given in the Appendix. Comparison of the Hereford map with only two known map projections cannot be said to provide an exhaustive study. Nor can it be said that the map is drawn on the orthographic projection, though this provides a better fit than does the square projection. Examination of the interpolated lines of latitude and longitude does, however, reinforce the hypothesis of European antecedents for the map, on the grounds that the larger scale will be in the vicinity of areas with which the cartographer is most familiar. The only apparent exception is the Jerusalem region. PORTOLAN CHARTS One of the most interesting classes of maps in the venerable history of cartography are the early sailing charts depicting the vicinity of the Mediterranean Sea. The oldest existent map is estimated to have been drawn in the latter portion of the thirteenth century. The fame of these representations rests in part on their accuracy relative to other European maps of the same period. When contrasted with the contemporaneous T-in-O maps, for example, the charts appear outstandingly more correct. The earliest of these sailing charts do not contain any indication of the terrestrial grid but carry an extensive set of symmetrical, criss-crossing lines. A voluminous though somewhat controversial, literature is available concerning the antecedents, method of compilation, construction, and employment of these charts. 14 Several authors have come to the conclusion that the portolan charts are not based on a map projection 15. This view has already been rejected here on a priori grounds, in accordance with the modern interpretation of map projections 16. In contrdistinction to the T-in-O maps, where the suggestion is usually rejected out of hand, the very great accuracy of the portolan charts has prompted questions concerning the map projection of these charts. The method of construction of the portolan charts, though not definitely known, does provide some hints. Perhaps the compass was involved and the observational information available for compilation consisted of loxodromic directions. This suggests Mercator s projection. The magnetic meridians 17 are not coincident with the geographical meridians, however, so that a magnetic error should exist on the maps. A diference between rose north and true north can in fact be observed on the charts. Breusing then reasoned that the compass, if it contributed to the development of these charts, would yield readings resulting in a projection with curved parallels. This he took to require a conic projection. Fiorini came to the conclusion that the projection should be an oblique azimuthal equidistant, since both directional and distance information seem to have been available, and since the central rose provides a convenient point of departure for the plotting of the map. Another projection which has been proposed is the square projection. This choice is apparently derived from the subsequent use of this projection for sailing charts. It should be possible to perform the operations previously outlined and applied in the case of the Hereford map to all of the foregoing projections relative to a portolan chart. The necessary identification is difficult since the maps themselves are rare (even facsimilies are rare), much of the script is difficult to read and translate, and determination of the modern equivalent locations is often impossible, or at best tedious. Unfortunately some previous scholars published only their conclusions, not the detailed observations employed in the analysis. This is especially true of Wagner s otherwise excelent study 18 Wagner sketched lines of latitude and longitude on detailed
5 tracings of several portolan charts and demonstrated that the length of mile employed differs along the west coast of Europe from that employed in the interior of the Mediterranean Sea. 19 He also illustrated an abrupt jog in the path of the parallels through Greece on the map and attributed this to a method of construction in which the map is made by piecing together separate, local charts. He concluded that the portolan charts are not based on a map projection, thus rejecting the notion of an implicit map projection. Wagner presented a careful analysis of all of these points. Steger proceeded in a less detailed but similar manner and concluded, on the basis of map interpolations, that the meridians and parallels are straight lines when sketched in on the charts. He thus refuted Breusing s suggestion. Steger s demonstration, however, can be disputed on two grounds. His study did not include the Black Sea, which is where the curvature might be most noticeable, and his meridians and parallels are virtually all determined by only two points. A more recent study of the portolan charts by Clos-Arceduc compared them to a Mercator chart at approximately the same scale. His reasoning was that Mercator s projection provides a beter fit than does. the square projection. He further illustrated that the eastern portion of the charts is too far north, only, it must be noted in relation to Mercator s projection. Computation by the method employed for the Hereford map would allow estimation of the degree of asociation between the charts and each of the projections. Calculation of Tisot s measures of distortion from an empirical equation should also be of assistance. Thus, if Fiorini s postulate of an oblique azimuthal equidistant projection is correct, one should find that the one value of the linear distortion in some direction is always unity at every point on the map. Similarly if the charts are loxodromic they should be conformal, or very nearly so. A result demonstrating very minor and randomly distributed angular error would provide additional evidence for the use of the compas in the construction of the charts. This procedure, via Tisot s theorem, has the distinct advantage that it is independent of any particular a priori hypothesis regarding the nature of the map projection. Two additional projections can be proposed for the portolan charts. The first of these is an oblique Mercator projection. The difference between rose north and true north can be taken as a guide to the obliquity. One such projection 20 is illustrated and compared with an outline from an early portolan chart in the figure (Fig. 4). The discrepancy at the eastern extremity of the map is less than for the previously proposed projections. The medians converge slightly as required by Breusing. An oblique or square projection would yield similar results, however. Comparison of several small tracings of photographs of early portolan charts further indicates that there exists a considerable variation between individual portolan charts. Suppose one were to take all the known portolan charts that do not contain any indication of latitude and longitude and compare them with some standard chart, perhaps the Carte Pisane. In each case the correlation will be somewhat less than perfect. A postulated map projection should not be expected to perform better. Perhaps an appropriate strategy would be to assume that the map projection of the portolan charts is determined if the variance between the postulated map projection is less than or equal to the variance between individual portolan charts. A final postulated projection might be refered to as an oblique magnetic Mercator projection. This can be conceived of as a Mercator projection based on magnetic meridians and parallels. 21 On such a map the geographical grid would appear distorted in the vicinity of local magnetic anomalies. This is a very appealing hypothesis, but it is apparently not possible to determine the locus of the magnetic meridians in the years 1200 to 1300 A. D. so that the empirical curve fitting procedure appears appropriate. Such a magnetic Mercator should be approximately conformal and investigation of the angular distortion is suggested.
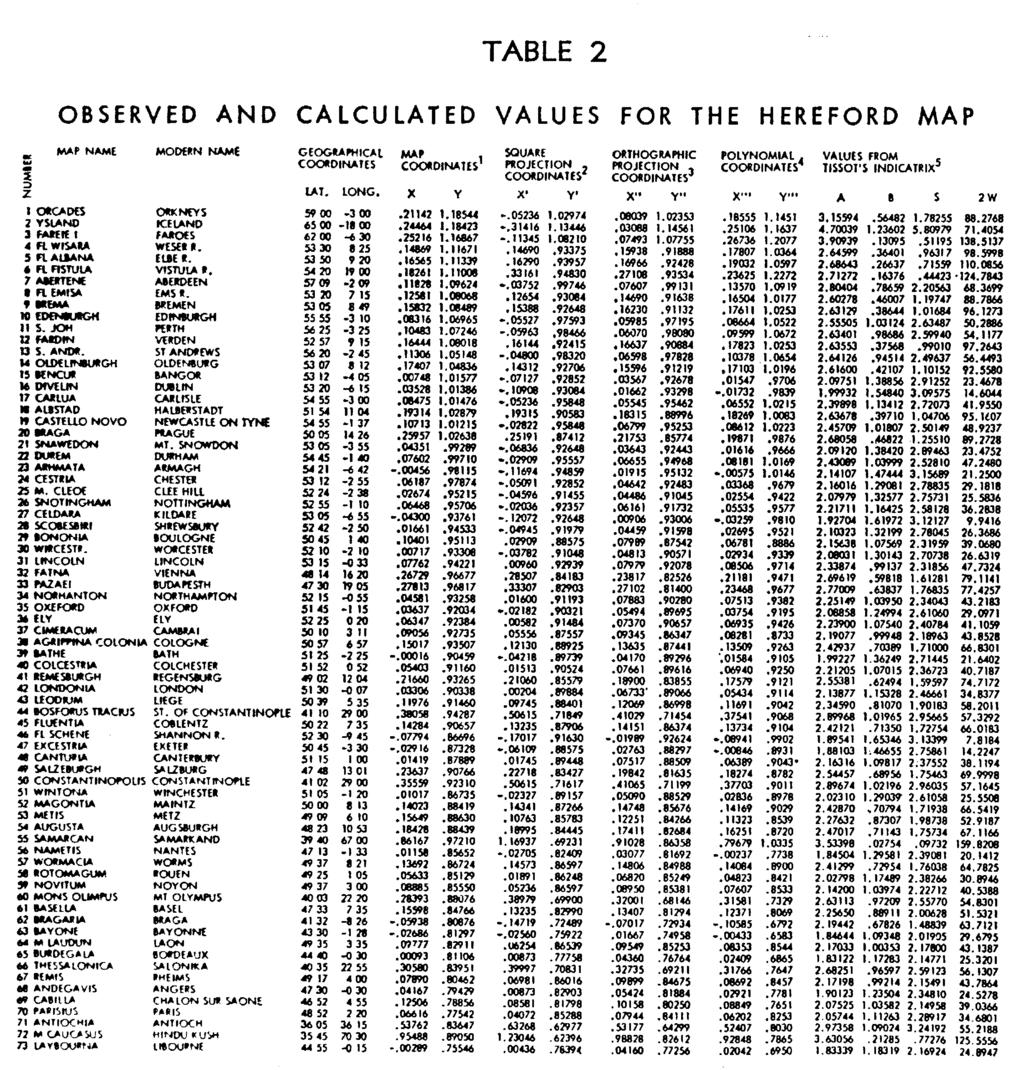
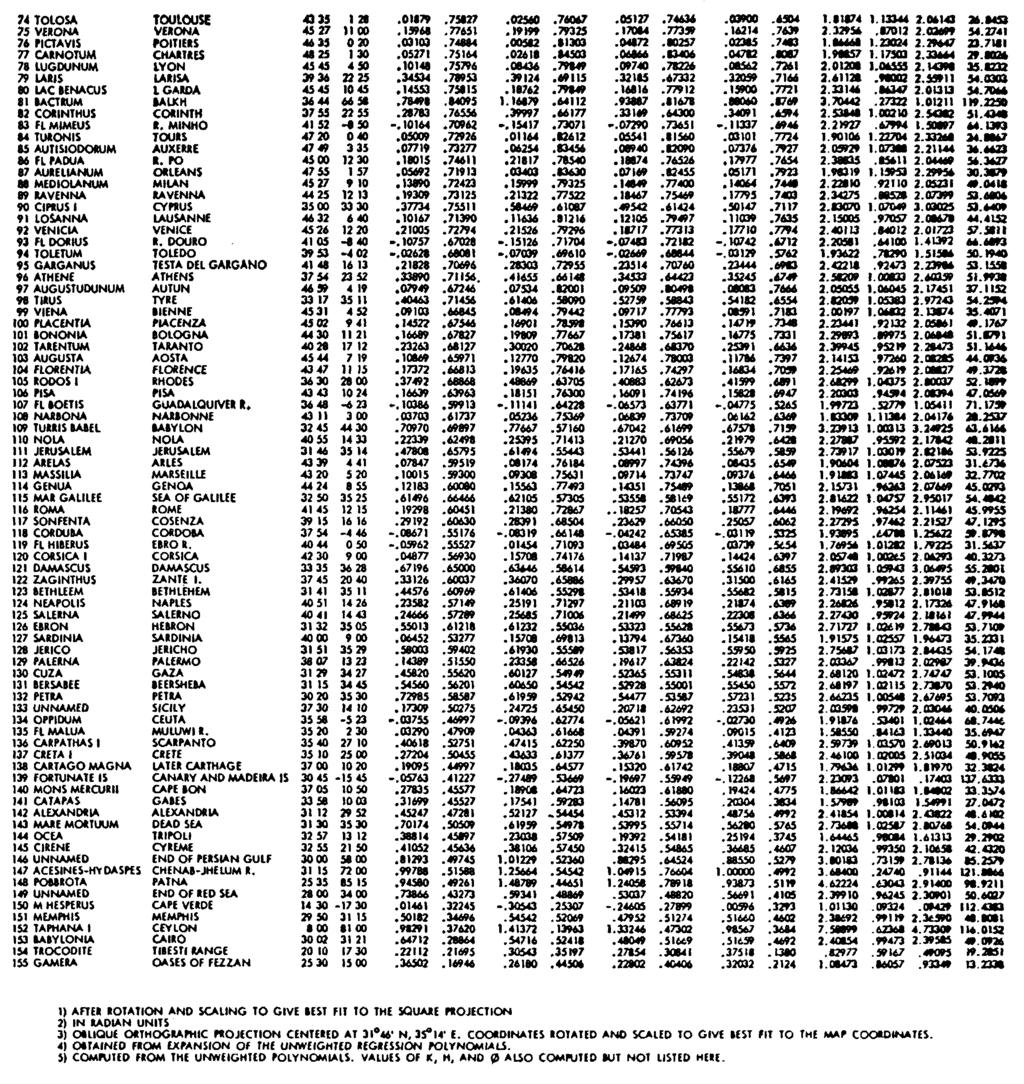
6 Without performing the actual analysis, it is not possible to draw further conclusions concerning the portolan charts. Any such analysis would need to be quite carefully done, since the charts will probably fit several map projections very closely. CONCLUSIONS It has been possible to answer only a few of the substantive questions concerning the possible methods of preparation of medieval maps. The strategy developed in this preliminary analysis, however, seems to offer some improvement over procedures employed in previous studies. For the student of the history of geography the techniques also allow estimates of the rate of cartographic progress. Imhof, for example, has recently published small illustrations of two old maps of the Canton of Zürich. 22 On the basis of these rather small illustrations, the simple calculations imply an improvement of twenty-eight percent in the mapping of Zürich between 1566 and 1667, and an improvement of only two percent between 1667 and This result in turn suggests the hypothesis of an S-shaped growth curve for the history of positional accuracy on maps. The same approach as outlined here can be applied, with obvious modifications, to maps which do contain the latitude and longitude graticule, either to determine the perhaps unknown map projection, or to make estimates of the accuracy of the maps if the projection is known. Appendix The procedure employed in estimating the amount of correlation between the observed map locations and a specific map projection is given here. Let the complex number W j = x j +iy j, (i 2 = -1) be the map location of the j th point of identified latitude and longitude. Let Z j = X j + iy j be the location of this same point on some map projection. Transform the arbitrary map recording coordinates to a new system, W = x j + iy j, by applying a translation, rotation, and change of scale. This is no more than an assignment of new numbers to the recording coordinates and in no way changes the interelations of the points. The transformation is of the form W = A + B W, where A and B are complex numbers determined by application of the least squares criterion in a manner such that the residual N Σ W j - Z j 2 j=1 is a minimum. The amount of correlation between the transformed observational locations and the locations on the postulated map projection (calculated from the estimated latitudes and longitudes) is then given as the ratio of the regression variance to the total variance, as in ordinary correlation methods. The square of this complex correlation times 100 provides a measure of the percentage agreement between the two maps. This entire procedure is repeated for each postulated map projection. In the case of the Hereford map there were three comparisons; the square projection, the oblique orthographic projection, and the polynomial approximation. The map projection computations were all performed for a sphere of unit radius. The coefficients of the unweighted polynomial approximation (R 2 = 0.945) to the Hereford map are given in Tables 1 and 2. It is cautioned that terms cannot be dropped from this equation without changing the coeficients. The latitude (φ) and longitude (λ) values are to be entered in
7 radian units. The computations were performed with the assistance of the University of Michigan computing center. Notes: 1 A. E. Nordenskiold refers to these maps as paratropical; Periplus, An Essay on the Early history of Charts and sailing Directions (Stockholm: Bather translations, 1897). 2 R. E.Dahlberg, Maps without Projections, The Journal of Geography, Vol. 60 (1961), pp Similar comments apply to an engineering survey of a small area. 4 H. Wagner, Das Ratsel der Kompasskarten im Lichte der Gesamtentwickelung derseekarten, Verhandlungen, XI Deutsches Geographentages, Bremen, 1895, pp ; E. Steger, Untersuchung über italienische Seekarten des Mittelalters auf Grund der kartometrischenmethode Disertation, Gottingen, 1896; M. Fiorini, Le projezioni delle carte geografiche, Bologna, 1881; A. Breusing, Zur Geschichte der Kartographie, Zeitschrift fur Wissenschaftliche Geographie, 11(1881), p. 168 ff; M. A. Clos-Arceduc, L Enigme des Portulans: Etude sur la Projection et le mode de construction des cartes a rumbs du XIV e et du XV e Siecle, Bulletin, Comité des Travaux Historiques et Scientifiques, Section de Géographie, LXIX (1956), pp The square projection is also known by the names plate carrée, simple cylindrical, and cylindrical equal-spaced projection. 5 Readers of the earlier treatises (especially Wagner, op. cit, footnote 4) will recognize this as a distinct advantage. 6 For a discussion of curve fitting see any elementary work on numerical analysis or an intermediate work on statistical methods. If there are some locations that can be identified with a greater degree of reliability than others, a weighting procedure may be employed. 7 M. A. Tissot, Mémoire sur la Representaion des Surfaces (Paris; Gautier-Villars, 1881) 8 Cf., B. Arden, An Introduction to Digital Computing (New York: Addison-Wesley, 1963). 9 G. A. Ginzburg, A Practical Method of Determining Distortion on Maps, Geodezist (Moscow), 10 (1935), pp The materials in this section are summarized from: S. Jones, The Hereford Map Projection, M.A. thesis, Department of Geography, University of Michigan, Ann Arbor, 1964, 39 pp., and are used with the kind permission of Ms. Jones. 11 W. L. Bevan and H. W. Phillott, Medieval Geography; An Essay in Illustration of the Hereford Mappa Mundi (London: 1873); K. Miller, Die Herefordkarte (Stuttgart, 1903); G. R. Crone, The World Map by Richard of Haldingham (London: Royal Geographical Society, 1954) (with an extensive set of references). 12 R. H.Bing, Elementary Point Set Topology, American Mathematical Monthly, 67, 7 part II (Aug./Sept., 1960) 13 See Table K. Kretschmer, Die Italienischen Portolane des Mittelalters, Heft 13 of the Veröffentlichungen des Institutes für Meereskunde und des Geographischen Institutes an der Universität Berlin, 1909, 687 pp; A. Cortesao, Cartografia e Cartografos portugueses dos seculos XV e XVI (Lisboa: 1935);
8 Y. Kamal, Hallucinations scientifiques (Leiden: E. J. Brill, 1937), 95 pp; for additional references see: W. W. Ristow, and C. E. LeGear, A Guide to Historical Cartography, 2nd ed. (Washington: Library of Congress, 1960). 15 Among these are Nordenskiold, Wagner, Bagarow, and M. Eckert. 16 Cf Clos-Arceduc, op. cit, footnote Cf A. N. Strahler, The Earth Sciences (New York: Harper & Row, 1963), Figure 9.15, p Wagner, op. cit., footnote 4; and also see his The Origin of the Medieval Italian Nautical Charts (London: Report of the Sixth International Geographical Congres, 1895). 19 For a plausible explanation of the phenomena that differs from that given by Wagner, see Clos-Arceduc, op. cit., footnote 4, p The oblique Mercator projection has been chosen so that the great circle passing through 37.77º N, 1º W and 37º N, 30º E becomes the projection equator. The axis of the projection is the great circle arc connecting the oblique pole at 55.55º N, 14.58º E. the angle between grid noth and the geographical meridian is 1º50 E at the center of the map. An earlier atempt with an 8.25º obliquity (as suggested by Clos-Arceduc) provided a poorer fit. 21 This postulate can also be found in Clos-Arceduc, op. cit., footnote 4, p E.Imhof, Beiträge zur Geschichte der topogrphischenkartographie, International Yearbook of Cartography, 4 (1964), pp Annals, Association of American Geographers, 56, 2 (June 1966), pp Accepted for publication May 16, 1965.
9
10
11
12 Table 1: Polynomial Approximation to the Hereford Map based on 155 observations Standard error of the estimate, in radians; S x = 05176; S y = X = λ φ 5 λ λ φ φ φλ φ 4 λ φ 2 λ φλ φ 3 λ λ φ. Y = φ φλ φ 4 λ φ 5 λ φ φ 2 λ φλ φ 2 λ λ φλ λ φ φ 3 λ 3.
13
14 Table 2 continued,


15 He r e i sabe t t e rvi e woft heor i g i na l :
Map projections. Rüdiger Gens
 Rüdiger Gens 2 Outline! Relevant terms! Why map projections?! Map projection categories " Projection surfaces " Features preserved from distortions! Map projection examples! Right choice Relevant terms!
Georeferencing. datum. projection. scale. The next few lectures will introduce you to these elements. on the Earth, you ll need to understand how
 Georeferencing GOAL: To assign a location to all the features represented in our geographic information data In order to do so, we need to make use of the following elements: ellipsoid/geoid To determine
A CONTINUOUS TRANSFORMATION USEFUL FOR DISTRICTING 1. W. R. Tobler Department of Geography University of Michigan Ann Arbor, Michigan 48104
 A CONTINUOUS TRANSFORMATION USEFUL FOR DISTRICTING 1 W. R. Tobler Department of Geography University of Michigan Ann Arbor, Michigan 48104 Abstract: Imagine that one could stretch a geographical map so
How can we project a 3D globe onto a 2D display? - Ellipsoids and Datums deal with earth non-sphericity
 Map projections How can we project a 3D globe onto a 2D display? - Ellipsoids and Datums deal with earth non-sphericity http://www.mapovasbirka.cz/english/index_eng.html The world could be mapped like
History of Cartography,
 Maps History of Cartography, the art and science of making maps ~2300 BC ~600 BC Early oldest known maps: Babylonian clay tablets. Greek and Roman Ptolemy s (about AD 85-165) "world map" depicted the Old
Shape e o f f the e Earth
 1 Coordinate Systems & Projections Coordinate Systems Two map layers are not going to register spatially unless they are based on the same coordinate system. 2 Contents Shape of the earth Datum Projections
Map Projections 2/4/2013. Map Projections. Rhumb Line (Loxodrome) Great Circle. The GLOBE. Line of constant bearing (e.g., 292.
 Great Circle. The GLOBE. Line of constant bearing (e.g., 292.") The GLOBE ADVANTAGES Directions True Distances True Shapes True Area True DISADVANTAGES Very small scale with little detail. Costly to reproduce and update. Difficult to carry around. Bulky to store. FACTS
The GLOBE ADVANTAGES Directions True Distances True Shapes True Area True DISADVANTAGES Very small scale with little detail. Costly to reproduce and update. Difficult to carry around. Bulky to store. FACTS
Navigation. Longitude and Latitude Foundations of Navigation. MTPs:
 Navigation 3.01 Foundations of Navigation References: FTGU pages 177-178, 184-190 Transport Canada Study and Reference Guide Glider Pilot Canada Flight Training Manual Pilot Navigation http://en.wikipedia.org/wiki/transverse_mercator_projection#spherical_transverse_mercator
Choosing a Suitable Projection for Navigation in the Arctic
 Choosing a Suitable Projection for Navigation in the Arctic Dr. Andriani Skopeliti, Prof. Lysandros Tsoulos Cartography Laboratory, School of Rural and Surveying Engineering, National Technical University
The Renaissance sets the stage for sustained ocean exploration
 Olli Ocean Exploration The Renaissance sets the stage for sustained ocean exploration Marvin Falk The sustained exploration of the earth s ocean required a system for preservation, accumulation, and dissemination
Spatial Reference Systems. Introduction
 Spatial Reference Systems Wolfgang Kainz Professor of Cartography and Geoinformation Department of Geography and Regional Research University of Vienna wolfgang.kainz@univie.ac.at Introduction Historic
Projections Part I - Categories and Properties James R. Clynch February 2006
 I. Introduction and References Projections Part I - Categories and Properties James R. Clynch February 2006 The world is, approximately, a sphere. Maps are flat. Making maps requires some method of putting
Keith C. Clarke Department of Geologyand Geography Hunter College-CUNY 695 Park Avenue New York, NY 10021,USA
 DISTORTION ON THE INTERRUPTED MODIFIED COLLIGNON PROJECTION Keith C. Clarke Department of Geologyand Geography Hunter College-CUNY 695 Park Avenue New York, NY 10021,USA and Karen A. Mulcahy Earth and
Geographic coordinate systems
 1 Geographic coordinate systems In this chapter you ll learn about longitude and latitude. You ll also learn about the parts that comprise a geographic coordinate system including Spheres and spheroids
Chapter 3 Models of the Earth. 3.1 Finding Locations on the Earth. 3.1 Objectives
 Chapter 3 Models of the Earth 3.1 Finding Locations on the Earth 3.1 Objectives Explain latitude and longitude. How can latitude and longitude be used to find locations on Earth? How can a magnetic compass
Map Projections. Chapter 4 MAP PROJECTION
 Map Projections Chapter 4 Map Projections What is map projection? Why are map projections drawn? What are the different types of projections? Which projection is most suitably used for which area? In this
Introduction to Cartography GEOG 2016 E. Lecture-2 Geodesy and Projections
 Introduction to Cartography GEOG 2016 E Lecture-2 Geodesy and Projections What is Geodesy? The science of geodesy determines: Earth s shape and Interrelation of different points on earth s surface The
Fri. Jan. 26, Demonstration of QGIS with GPS tracks. Types of data, simple vector (shapefile) formats
 formats") Fri. Jan. 26, 2018 Demonstration of QGIS with GPS tracks Types of data, simple vector (shapefile) formats Map projections, Coordinate Reference Systems Demonstration of QGIS with geologic map 1 Raster
Fri. Jan. 26, 2018 Demonstration of QGIS with GPS tracks Types of data, simple vector (shapefile) formats Map projections, Coordinate Reference Systems Demonstration of QGIS with geologic map 1 Raster
The Sphere of the Earth Activities
 The Sphere of the Earth Activities December 20, 2012 Daniel Ramos MMACA (Museu de Matemàtiques de Catalunya) These activities are designed to be done with the materials, posters and software of the exhibit
The Wildlife Society Meet and Greet. Come learn about what the UNBC Student Chapter of TWS is all about!
 Georeferencing I GEOG 300, Lecture 4 Dr. Anthony Jjumba 1 The Wildlife Society Meet and Greet Quiz Come learn about what the UNBC Student Chapter of TWS is all about! 5:30 7:30 PM, Wednesday September
Map Projections (Part 1)
") 1 Earth is a round, maps are not. Four projection families. Equivalent (Equal Area) projections Preserves relative areas Commonly used for thematic maps Ex: Albers Conformal projections Preserve angles,
1 Earth is a round, maps are not. Four projection families. Equivalent (Equal Area) projections Preserves relative areas Commonly used for thematic maps Ex: Albers Conformal projections Preserve angles,
Importance of Understanding Coordinate Systems and Map Projections.
 Importance of Understanding Coordinate Systems and Map Projections. 1 It is extremely important that you gain an understanding of coordinate systems and map projections. GIS works with spatial data, and,
Notes on Projections Part II - Common Projections James R. Clynch February 2006
 Notes on Projections Part II - Common Projections James R. Clynch February 2006 I. Common Projections There are several areas where maps are commonly used and a few projections dominate these fields. An
REFERENCING COORDINATE SYSTEMS MAP PROJECTIONS GEOREFERENCING
 GIS in Ecology SPATIAL REFERENCING COORDINATE SYSTEMS MAP PROJECTIONS GEOREFERENCING : :1 Where on earth? Early mapmakers recognized the need for a system that could locate features on the earth's surface.
What is a Map Projection?
 What is a Map Projection? It is how we represent a three dimensional Earth on a flat piece of paper However The process of transferring information from the Earth to a map causes every projection to distort
Key Issue #1. How do geographers describe where things are? 2014 Pearson Education, Inc.
 Key Issue #1 How do geographers describe where things are? Learning Outcomes 1.1.1: Explain differences between early maps and contemporary maps. 1.1.2: Describe the role of map scale and projections and
Outline. Shape of the Earth. Geographic Coordinates (φ, λ, z) Ellipsoid or Spheroid Rotate an ellipse around an axis. Ellipse.
 Ellipsoid or Spheroid Rotate an ellipse around an axis. Ellipse.") Map Projections Outline Geodesy and map projections Prof. D. Nagesh Kumar Department of Civil Engineering Indian Institute of Science Bangalore 560 012, India http://www.civil.iisc.ernet.in/~nagesh Shape
Map Projections Outline Geodesy and map projections Prof. D. Nagesh Kumar Department of Civil Engineering Indian Institute of Science Bangalore 560 012, India http://www.civil.iisc.ernet.in/~nagesh Shape
Understanding Projections
 GEOGRAPHY SKILLS 1 Understanding Projections The earth is a sphere and is best shown as a globe. For books and posters, though, the earth has to be represented as a flat object. To do this, mapmakers create
Working with georeferenced data. What is georeferencing? Coordinate Systems. Geographic and Projected Coordinate System
 GIS501 Fundamentals of Geographical Information Systems (GIS) Coordinate Systems Working with georeferenced data What is georeferencing? Geographically referenced data which is, in some way, referenced
Map projections. Rüdiger Gens
 Rüdiger Gens Coordinate systems Geographic coordinates f a: semi-major axis b: semi-minor axis Geographic latitude b Geodetic latitude a f: flattening = (a-b)/a Expresses as a fraction 1/f = about 300
An interactive tool for teaching map projections
 An interactive tool for teaching map projections Map projections are one of the fundamental concepts of geographic information science and cartography. An understanding of the different variants and properties
Theory of Knowledge Lesson One:!!! The Map is not the Territory. One of the key questions of/for this course is:!!!! How do we know?
 Theory of Knowledge 3813 Lesson One:!!! The Map is not the Territory One of the key questions of/for this course is:!!!! How do we know? Two of the key components of/for this course are:!!!! OPEN MIND!!!!
Introduction to Geographic Information Science. Updates/News. Last Lecture. Geography 4103 / Map Projections and Coordinate Systems
 Geography 4103 / 5103 Introduction to Geographic Information Science Map Projections and Coordinate Systems Updates/News Thursday s lecture Reading discussion 1 find the readings online open questions,
WHERE ARE YOU? Maps & Geospatial Concepts Fall 2012
 WHERE ARE YOU? Maps & Geospatial Concepts Fall 2012 Where are you? Relative location I m at school Absolute Location 45 26 18.07 122 43 50.78 Datums Datums A reference surface of the Earth Used as the
Topographic Maps and Landforms Geology Lab
 Topographic Maps and Landforms Geology Lab Ray Rector: Instructor Today s Lab Activities 1) Discussion of Last Week s Lab 2) Lecture on Topo Maps and Elevation Contours 3) Construct Topographic Maps and
Test Bank Chapter 2: Representations of Earth
 Multiple Choice Test Bank Chapter 2: Representations of Earth 1. A rhumb line on a Mercator projection is a line of. a. true size b. true shape c. true compass bearing d. true location 2. Maximum longitude
Spatial locations. Spatial locations. Spatial locations. Spatial locations
 Where am I? sounds simple, but definitely not huge amount of picky detail Cartographers make a career from the details focus on the minimum you need to know c Philip M. Dixon (Iowa State Univ.) Spatial
ROYAL CANADIAN AIR CADETS PROFICIENCY LEVEL FOUR INSTRUCTIONAL GUIDE SECTION 4 EO C USE A VISUAL FLIGHT RULES (VFR) NAVIGATION CHART (VNC)
 NAVIGATION CHART (VNC)") ROYAL CANADIAN AIR CADETS PROFICIENCY LEVEL FOUR INSTRUCTIONAL GUIDE SECTION 4 EO C437.02 USE A VISUAL FLIGHT RULES (VFR) NAVIGATION CHART (VNC) Total Time: 60 min PREPARATION PRE-LESSON INSTRUCTIONS Resources
ROYAL CANADIAN AIR CADETS PROFICIENCY LEVEL FOUR INSTRUCTIONAL GUIDE SECTION 4 EO C437.02 USE A VISUAL FLIGHT RULES (VFR) NAVIGATION CHART (VNC) Total Time: 60 min PREPARATION PRE-LESSON INSTRUCTIONS Resources
Eratosthenes method of measuring the Earth
 Eratosthenes method of measuring the Earth Credit for the first determination of the size of the Earth goes to the Greek polymath Eratosthenes, who lived from around 276 BC to 195 BC. Born in the Greek
Georeferencing, Map Projections, Cartographic Concepts. -Coordinate Systems -Datum
 Georeferencing, Map Projections, Cartographic Concepts -Map Projections -Coordinate Systems -Datum Map projection is "the process of systematically transforming positions on the Earth's spherical surface
Chapter 1: The World of Geography
 Chapter 1: The World of Geography Chapter 1: What is Geography? *It is the study of our earth; our home. OR *Anything that can be mapped! *Geography mixes up the physical and human aspects of our world
Mobile Systeme Grundlagen und Anwendungen standortbezogener Dienste. Location Based Services in the Context of Web 2.0
 Mobile Systeme Grundlagen und Anwendungen standortbezogener Dienste Location Based Services in the Context of Web 2.0 Department of Informatics - MIN Faculty - University of Hamburg Lecture Summer Term
Chapter 02 Maps. Multiple Choice Questions
 Chapter 02 Maps Multiple Choice Questions 1. Every projection has some degree of distortion because A. a curved surface cannot be represented on a flat surface without distortion. B. parallels and meridians
WHERE ARE YOU? Maps & Geospatial Concepts Fall 2015
 WHERE ARE YOU? Maps & Geospatial Concepts Fall 2015 Where are you? Relative location I m at school Absolute Location 45 26 18.07 122 43 50.78 Where is Boston? Introducing Geodesy, Ellipsoids & Geoids Geodesy
Map Projections & Coordinate Systems
 Map Projections & Coordinate Systems 9/7/2017 1 Why? Laying the Earth Flat Need convenient means of measuring and comparing distances, directions, areas, shapes. Traditional surveying instruments measure
Map Projections. What does the world look like? AITOFF AZIMUTHAL EQUIDISTANT BEHRMANN EQUAL AREA CYLINDRICAL
 Map Projections What does the world look like? AITOFF AZIMUTHAL EQUIDISTANT BEHRMANN EQUAL AREA CYLINDRICAL 1 CYLINDRICAL EQUAL AREA BONNE CRASTER PARABOLIC 2 ECKERT I ECKERT III ECKERT V There are many
A map is a small-scale flat-surface representation of some portion of the earth s surface.
 MAPS AND CHARTS A map is a small-scale flat-surface representation of some portion of the earth s surface. A representation that is designed for plotting navigational information is called a chart. Often
Spatial Data, 16 th Century Dutchmen, GPS and GIS. Martin Charlton, National Centre for Geocomputation National University of Ireland Maynooth
 Spatial Data, 16 th Century Dutchmen, GPS and GIS Martin Charlton, National Centre for Geocomputation National University of Ireland Maynooth Maps as truth Maps are cultural artifacts, comparable in history
ELEMENTS FOR MATHEMATICAL BASIS OF ATLAS MAPS
 International Journal of Mechanical Engineering and Technology (IJMET) Volume 9, Issue 11, November 2018, pp. 2021 2028, Article ID: IJMET_09_11 213 Available online at http://www.ia aeme.com/ijmet/issues.asp?jtype=ijmet&vtype=
Map Projections. Displaying the earth on 2 dimensional maps
 Map Projections Displaying the earth on 2 dimensional maps Map projections Define the spatial relationship between locations on earth and their relative locations on a flat map Are mathematical expressions
AP Human Geography Chapter 1: Thinking Geographically Key Issue 1: How do Geographers describe where things are?
 AP Human Geography Chapter 1: Thinking Geographically Key Issue 1: How do Geographers describe where things are? Studying Human Geography Physical Geography Physical geography deals with Earth s natural
The Elements of GIS. Organizing Data and Information. The GIS Database. MAP and ATRIBUTE INFORMATION
 GIS s Roots in Cartography Getting Started With GIS Chapter 2 Dursun Z. Seker MAP and ATRIBUTE INFORMATION Data (numbers and text) store as files refer to them collectively as a database gather inform.
A CONTINUOUS TRANSFORMATION USEFUL FOR DISTRICTING. W. R. Tobler
 A CONTINUOUS TRANSFORMATION USEFUL FOR DISTRICTING W. R. Tobler Departnient of Geography Utiiversity of Michigan Ai7n Arbor, Michigan 48104 Suppose that one could stretch a geographical map so that areas
Introduction to Geography
 Introduction to Geography ropic of Cancer 3½ N Arctic Circle 90 N Prime Meridian 0 Arctic Ocean Mississippi R. Appalachian Mts. Europe Rocky Mountains N. America Atlantic Gulf of Ocean Mexico Caribbean
The Earth is a Rotating Sphere
 The Earth is a Rotating Sphere The Shape of the Earth Earth s Rotation ( and relative movement of the Sun and Moon) The Geographic Grid Map Projections Global Time The Earth s Revolution around the Sun
ArcGIS for Applied Economists Session 2
 ArcGIS for Applied Economists Session 2 Mark Westcott LMU Munich June 15, 2015 1 / 31 Topics for this session: Geographic Coordinate Systems Projections Projected Coordinate Systems Geocoding 2 / 31 Some
Einstein s Third Postulate
 Einstein s Third Postulate W. Engelhardt 1, retired from: Max-Planck-Institut für Plasmaphysik, D-85741 Garching, Germany Abstract Einstein s own demonstration of time dilation taken from his book with
Geographers Perspectives on the World
 What is Geography? Geography is not just about city and country names Geography is not just about population and growth Geography is not just about rivers and mountains Geography is a broad field that
FACTORIZATION AND THE PRIMES
 I FACTORIZATION AND THE PRIMES 1. The laws of arithmetic The object of the higher arithmetic is to discover and to establish general propositions concerning the natural numbers 1, 2, 3,... of ordinary
NR402 GIS Applications in Natural Resources Lesson 4 Map Projections
 NR402 GIS Applications in Natural Resources Lesson 4 Map Projections From http://www.or.blm.gov/gis/ 1 Geographic coordinates Coordinates are expressed as Latitude and Longitude in Degrees, Minutes, Seconds
CHAPTER 4 VARIABILITY ANALYSES. Chapter 3 introduced the mode, median, and mean as tools for summarizing the
 CHAPTER 4 VARIABILITY ANALYSES Chapter 3 introduced the mode, median, and mean as tools for summarizing the information provided in an distribution of data. Measures of central tendency are often useful
Using Map and Compass Together
 Using Map and Compass Together In situations where you foresee a potential evacuation on foot, where there are no roads, and no indication as to the direction of travel (i.e., road signs), it is recommended
Energy Efficiency, Acoustics & Daylighting in building Prof. B. Bhattacharjee Department of Civil Engineering Indian Institute of Technology, Delhi
 Energy Efficiency, Acoustics & Daylighting in building Prof. B. Bhattacharjee Department of Civil Engineering Indian Institute of Technology, Delhi Lecture - 05 Introduction & Environmental Factors (contd.)
Map Projections. Chapter 3. Emmanuel Stefanakis
 Stefanakis, E., 2014. Geographic Databases and Information Systems. CreateSpace Independent Publ. [In English], pp.386. Get a copy from Amazon Chapter 3 Map Projections Emmanuel Stefanakis http://www2.unb.ca/~estef/
Plane coordinates ~~~~~~~~~~
 Coordinate Systems & Map Projections Geographic coordinates A Basic Introduction to Coordinate Systems & Map Projections Latitude & longitude Angles Parallels & meridians Lines Plane coordinates ~~~~~~~~~~
Name: Date: Period: #: Chapter 1: Outline Notes What Does a Historian Do?
 Name: Date: Period: #: Chapter 1: Outline Notes What Does a Historian Do? Lesson 1.1 What is History? I. Why Study History? A. History is the study of the of the past. History considers both the way things
What is a map? A Map is a two or three-dimensional model or representation of the Earth s surface. 2-Dimensional map
 What is a map? A Map is a two or three-dimensional model or representation of the Earth s surface. 2-Dimensional map What is a Map Projection? Planar Projection Projection A Projection is a mathematical
1. Geospatial technology rarely links geospatial data to nonspatial data. a. True *b. False
 Chapter 2 Where in the Geospatial World Are You? 1. Geospatial technology rarely links geospatial data to nonspatial data. 2. For geospatial technology to work, every location on Earth must be: a. inhabited
ESSENTIALS of GEOGRAPHY. Physical Geography (Geog. 300) Prof. Hugh Howard American River College
 Prof. Hugh Howard American River College") ESSENTIALS of GEOGRAPHY Physical Geography (Geog. 300) Prof. Hugh Howard American River College GEOGRAPHY GEOGRAPHY Earth description, or study of Earth Describes the natural environment and human interaction
ESSENTIALS of GEOGRAPHY Physical Geography (Geog. 300) Prof. Hugh Howard American River College GEOGRAPHY GEOGRAPHY Earth description, or study of Earth Describes the natural environment and human interaction
EN5302. US ARMY ENGINEER SCHOOL CARTOGRAPHY II Grid Construction, Plotting and Projection Graticules
 SUBCOURSE EN5302 EDITION 6 US ARMY ENGINEER SCHOOL CARTOGRAPHY II Grid Construction, Plotting and Projection Graticules TABLE OF CONTENTS PAGE INTRODUCTION... iii GRADING AND CERTIFICATION INSTRUCTIONS...
Recall: The scale transformation
 Recall: The scale transformation Geography 12: Maps and Spatial Reasoning Lecture 3: Map Projection Basics Professor Keith Clarke 1:400M The real world A representation of the world A cartographic problem
Modern Navigation. Thomas Herring
 12.215 Modern Navigation Thomas Herring Today s class Map Projections: Why projections are needed Types of map projections Classification by type of projection Classification by characteristics of projection
CHAPTER 20 SIGHT REDUCTION
 CHAPTER 20 SIGHT REDUCTION BASIC PRINCIPLES 2000. Introduction Reducing a celestial sight to obtain a line of position consists of six steps: 1. Correcting sextant altitude (hs) to obtain observed altitude
Projections and Coordinate Systems
 Projections and Coordinate Systems Overview Projections Examples of different projections Coordinate systems Datums Projections Overview Projections and Coordinate Systems GIS must accurately represent
Scaling the Universe via a Transit of Venus
 Scaling the Universe via a Transit of Venus On 3 June 1769 Captain Cook observed the Transit of Venus in Tahiti. The intention was to use the observations to obtain an accurate estimate of the distance
Geo Referencing & Map projections CGI-GIRS 0910
 Geo Referencing & Map projections CGI-GIRS 0910 Where are you? 31UFT8361 174,7 441,2 51 58' NB 5 40' OL 2/60 Who are they? 3/60 Do geo data describe Earth s phenomena perfectly? Georeference systems ellipsoid
Ch2&3 Test. Multiple Choice Identify the choice that best completes the statement or answers the question.
 Ch2&3 Test Multiple Choice Identify the choice that best completes the statement or answers the question. 1. Earth s circumference is about 40,000 km, and its shape is a. an oval. c. a perfect sphere.
CHAPTER 24 THE SAILINGS
 CHAPTER 24 THE SAILINGS INTRODUCTION 2400. Introduction Dead reckoning involves the determination of one s present or future position by projecting the ship s course and distance run from a known position.
Introduction to Geography
 Introduction to Geography What is geography? Geography comes from the Greek word Geographia. Geo means earth and graphia means to describe or chart. Geographers study the earth in relation to space and
Geo Referencing & Map projections CGI-GIRS 0910
 Geo Referencing & Map projections CGI-GIRS 0910 Where are you? 31UFT8361 174,7 441,2 51 58' NB 5 40' OL 2/60 Who are they? 3/60 Do geo data describe Earth s phenomena perfectly? Georeference systems ellipsoid
Overview. GIS Terminology
 Overview GIS Terminology MFworks Terminology Overview This is a glossary of geography and MFworks terminology and concepts that may not be familiar to novice MFworks users and non-geographers. The explanations
CHAPTER 4 THE COMMON FACTOR MODEL IN THE SAMPLE. From Exploratory Factor Analysis Ledyard R Tucker and Robert C. MacCallum
 CHAPTER 4 THE COMMON FACTOR MODEL IN THE SAMPLE From Exploratory Factor Analysis Ledyard R Tucker and Robert C. MacCallum 1997 65 CHAPTER 4 THE COMMON FACTOR MODEL IN THE SAMPLE 4.0. Introduction In Chapter
What is Geodesy? Types of Geodesy terrestrial or classical geodesy space geodesy theoretical geodesy
 What is Geodesy? Geodesy is the study of: The size, shape and motion of the earth The measurement of the position and motion of points on the earth's surface, and The study of the earth's gravity field
On the status of plane and solid angles in the International System of Units (SI)
") On the status of plane and solid angles in the International System of Units (SI) arxiv:1810.12057v1 [physics.class-ph] 29 Oct 2018 M.I. Kalinin Abstract The article analyzes the arguments that became
On the status of plane and solid angles in the International System of Units (SI) arxiv:1810.12057v1 [physics.class-ph] 29 Oct 2018 M.I. Kalinin Abstract The article analyzes the arguments that became
What is Geography? *Mixes up the physical and human aspects of our world into one field of study.
 World Geography What is Geography? *It is the study of the earth *Mixes up the physical and human aspects of our world into one field of study. *Shows the relationship between people and the environment.
ASTRONOMICAL NAVIGATION
 Basic terms ASTRONOMICAL NAVIGATION *astronomical navigation *compilation *astronomical tabels *celestial observations *solution of a sight * Sun/Moon/star sight *spherical trigonometry *PZX triangle *celestial
Direction: the reference system
 Adapted from Liebenberg and Vlok 2000, The interpretation of maps, aerial photographs and satellite images. Direction: the reference system Direction provides us with one way of answering "Where?" questions.
Chapter 1. Essentials of Geography Pearson Education, Inc.
 Chapter 1. Essentials of Geography Learning Objectives Define geography in general and physical geography in particular. Discuss human activities and human population growth as they relate to geographic
2. What does the map scale tell the map reader? a ratio between the actual distance on the ground and the length given to that distance on a map
 AP Human Geography - Damon Name Unit 1 - Intro to Human Geography Hour Map and Globe Skills Review Note: All links in this packet are found on our Wikispace under Map and Globe Skills Review First, read
Compass Basics. Quick Map Basics Review For Compass Use
 Compass Basics Quick Map Basics Review For Compass Use A topographic map tells you where things are and how to get to them, whether you're hiking, biking, hunting, fishing, or just interested in the world
MAP PROJECTIONS but before let s review some basic concepts.
 MAP PROJECTIONS but before let s review some basic concepts. Types of Maps General Purpose Topographic Thematic/Choropleth Dot Graduated Circle Isometric/Isolines Isopleth Mental Maps Scale Small-scale
MR. GOFF S WORLD HISTORY UNIT ONE: GEOGRAPHY 5 THEMES OF GEOGRAPHY
 MR. GOFF S WORLD HISTORY UNIT ONE: GEOGRAPHY 5 THEMES OF GEOGRAPHY BYOD BRING YOUR OWN DEVICE IN SMALL GROUPS (3-4), USE YOUR ELECTRONIC DEVICE(S) AND DEFINE THE FOLLOWING VOCAB. WORDS 1. GEOGRAPHY 2.
A. Spatial Sense (Working with Maps, Globes, and Other Geographic Tools)
") A. Spatial Sense (Working with Maps, Globes, and Other Geographic Tools) Measuring Distance Using Map Scale All maps are drawn to scale; that is, they are smaller than the things they represent. Scale
A. Spatial Sense (Working with Maps, Globes, and Other Geographic Tools) Measuring Distance Using Map Scale All maps are drawn to scale; that is, they are smaller than the things they represent. Scale
GEOL 309 Laboratory Activity: Euler Poles. Name
 GEOL 309 Laboratory Activity: Euler Poles Name Instructions: Follow the directions given. Take a picture (with your phone) of your work showing final pole locations on the globe. Print pictures and turn
Lesson 3: Map grids and coordinates
 PRO TIPS: Map Reading Lesson 3: Map grids and coordinates References: FM 21-25; FM 21-26; FM 21-30 Study assignment: read FM 21-25 Chapters 5 and 6, then go through this lesson and take the self-assessment
Maps: Geography s Basic Tools
 Maps: Geography s Basic Tools What is a map? - A map is a representation of the earth s features drawn on a flat surface. - Maps use points, lines, colours, and symbols to represent the features of an
The Natural Earth II world map projection
 INTERNATIONAL JOURNAL OF CARTOGRAPHY, 2015 VOL. 1, NO. 2, 123 133 http://dx.doi.org/10.1080/23729333.2015.1093312 The Natural Earth II world map projection Bojan Šavrič a,b, Tom Patterson c and Bernhard
What is Geography? Lecture 1 The Earth As A Rotating Planet. What is Geography? What is geography? Subfields of Geography?
 Lecture 1 The Earth As A Rotating Planet Geog210 Physical Geography What is Geography? Much more than place names and locations The study of spatial variation How and why things differ from place to place
Critical Notice: Bas van Fraassen, Scientific Representation: Paradoxes of Perspective Oxford University Press, 2008, xiv pages
 Critical Notice: Bas van Fraassen, Scientific Representation: Paradoxes of Perspective Oxford University Press, 2008, xiv + 408 pages by Bradley Monton June 24, 2009 It probably goes without saying that
Part III: Unstructured Data
 Inf1-DA 2010 2011 III: 51 / 89 Part III Unstructured Data Data Retrieval: III.1 Unstructured data and data retrieval Statistical Analysis of Data: III.2 Data scales and summary statistics III.3 Hypothesis