Geoinformation in Environmental Modelling
|
|
|
- Ella Stephens
- 6 years ago
- Views:
Transcription
1 Geoinformation in Environmental Modelling Spatial analysis and modelling: grid data ENY-C2005 Jaakko Madetoja Slides by Paula Ahonen-Rainio
2 Topics today About spatial analysis and modelling Various viewpoints for categorizing Recap of data modelling Raster topology (back to L-3) Basic concepts of grid data Typical task with grid data Map overlay one of the basic methods Watershed, viewshed and cost surface analysis Map algebra a set of analysis functions Local, focal, zonal, and global functions
3 Examples of potential exam questions relating to this lecture Anna esimerkkejä pintojen, kuten korkeusmallin (DEM), spatiaalisesta analyysista. Give examples of spatial analysis on surfaces, such as digital elevation model (DEM). Selitä mitä tarkoittaa kartta-algebran lokaali/fokaali/zonaali operaatio. Anna esimerkkejä lokaaleista/fokaaleista/zonaaleista operaatioista ja konkreettisista sovelluksista, joissa niitä voidaan käyttää. Explain what a local/focal/zonal operation of map algebra means. Give examples of local/focal/zonal operations and concrete applications where they can be used. Suorita [annettu kartta-algebran operaatio] [annetuille 1 3] rasteritasoille. Perform [a given map algebra operation] on the [1...3 given] raster layers.
4 Spatial analysis A set of methods whose results change when the locations of the objects being analysed change or when the behaviour (i.e. values in various locations ) of a spatially continuous phenomenon changes Note: location can be absolute (metric relationships) or relative (topological relationships) The process of turning raw data into useful information e.g. for scientific discovery, or effective decision making From hypothesis to confirmation or rejection and then to conclusion (often recursive) Collaboration of computer and human user (computational and visual analysis) Examples of spatial analysis Analysis of a grid (raster, matrix) Analysis of a graph Spatio-statistical analysis, basis on statistics
5 Recap: Representation of fields Field data can be measured on Continuous scale values measured on ratio, interval, or cyclic scales e.g. height, elevation, temperature, humidity, wind direction Categorical scale values measured on nominal or ordinal scales e.g. soil types, land use, land ownership Spatially, a field can be represented by Irregular or regular point set (possibility to interpolate values between them) Triangulated irregular network, TIN Contours, isolines based on point set (only for visualisation) Polygon network Grid a regular tessellation, i.e. geometry is independent of the variation of the phenomenon

6 Example: continuous data R. Sunila 2009

7 Example: categorical data R. Sunila 2009


8 Example: Grid data Wegmann/Wikimedia Commons Categorical data Continuous data

9 Example: transformation of a point set to a grid > ratio data Pistemäiset kohteet voidaan muuntaa pintamaiseksi esitykseksi laskemalla pisteiden määrä annetun hilan ruuduissa Visual ization Transformation Point objects can be transformed into a field model by counting the sum of points in each cell of the given grid
10 grid representation Geometry Shape of a pixel: usually a square (can be a triangle, a hexagon) Square pixel: 4 neighbours (joint edge) 8 neighbours (joint edge or corner) X Implicit topology Joint edge adjacency (viereisyys) Joint edge or corner connectivity (yhdistävyys) X Orientation, origin, resolution (size of a pixel/grid cell)
11 Grid data management One layer (taso) presents one theme (or variable) Layers are stored in files Files can be compressed, e.g., RLE run length encoding The simplest compression method Good result when relatively large homogeneous areas Quadtree (nelipuu) One type of block encoding In addition to compression, also used for indexing Lossless methods: do not loose information
12 Spatial analysis of grid data Raster analysis Typical examples of grid analysis: Overlay analysis Watershed, Viewshed, Cost surface
13 Examples of applications Environmental analyses with satellite images E.g., detecting changes in land use, vegetation,... Analyses based on elevation models Viewshed (visibility, näkemäanalyysi) e.g. locating telecommunication towers, view from a road in landscape planning, military applications Slope (kaltevuus) and aspect (suunta) e.g. watershed (vedenjakaja), catchment areas, estimating growth conditions, risk of avalanche Analyses of demographic (population) and other statistical datasets (in grid form) Terrain analyses, e.g. for mobility For crisis management and military applications, prediction of animal movement, forestry
14 Overlay analysis History of map overlay (paper) transparencies on top of each other, analysis on the basis of several map layers A new data layer as a function of two or more source data layers Can be performed to any geometric data type Straightforward computation with grid data (if the resolution and orientation is the same) More complex with vector data (points, lines, polygons), e.g. slivers in polygon overlay Data type must be the same for all layers! -> transformation One of the basic operations at the backstage in GIS
15 Raster overlay Longley et al. 2015
16 About the overlay analysis Basic form based on binary logic Boolean logic On each layer, possible values for each cell are 1 or 0 E.g., suitability of a region to a certain purpose by logical reasoning: different layers have binary values for each location, the result based on the logics on these values Cf. Assignment A-1 Potential problems because of inconsistencies Input data may originally be in different scales or in different coordinate systems resampling Input data may be interpolated (DEMs) or cartographically generalized (e.g. roads on a map are wider than in reality) If the accuracy of the original datasets is not known, results may be of no value (as in any analysis)
17 Analysis of surfaces Typical data for analysis: Digital elevation model (DEM) The same methods are applicable for any kind of continuous surface with interval- or ratio-type variable the meaningfulness of the method for the phenomenon in question must be understood Key characteristics: slope, aspect (kaltevuus ja viettosuunta) Aim of the analysis, e.g. Catchment and watershed (valuma- ja kokooma-alueet) Viewshed, visibility (näkemä) [Route over] cost-surface (Reitti kustannuspinnan yli)
18 Slope (kaltevuus) Strongly dependent on scale, various expressions Calculation method based on elevations of eight neighbours: see Longley et al. Technical Box 14.2 p.325 Tangents in x- and y-directions; joint edge neighbours are given bigger weight There are three alternative definitions of slope The ratio of the change in elevation to the horizontal distance traveled, range from 0 to infinity The ratio of the change in elevation to the actual distance traveled, range from 0 to 1 The angle between the surface and the horizontal, range 0 to 90
19 A Example: hydrologic analysis of a DEM: watershed (A) the DEM and inferred flow directions using the rook s case move set B (B) accumulated flows in each cell and eroded channels based on a threshold flow of 4 units 2005 John Wiley & Sons, Ltd
20 example: hydrologic analysis A watershed is the area of land where all of the water that is under it or drains off of it goes into the same place. Example: forming a catchment area from DEM (previous slide) - Direction of flow for each cell: lowest elevation among the eight neighbours - If the cell in question is lower than any of its neighbours, water will pool to that cell - Cumulative amount of water for each cell - Recognition of watersheds, catchment areas and channels In practice, modelling the behaviour of water is more complex - Some portion of the rainfall is absorbed to the ground - Soil type has an effect to the flow


21 Example: Analysing the watershed Bolstad: GIS Fundamentals

22 Viewshed A viewshed is an area of land, water, or other environmental element that is visible to the human eye from a fixed vantage point. The term is used widely in such areas as urban planning, archaeology, and military science. Scale-dependent: Elevation model, or even buildings and trees? Analysis always for only one vantage point at the time Results can be merged with overlay analysis

23 Example: Viewshed Bolstad: GIS Fundamentals
24 Cost surface Route on cost surface Each cell has determined cost, for example: OR the density of the vegetation environmental impacts depth of snow How to travel from starting point to end point with minimum cost Spreading model from the starting point E.g. travel time maps

25 HSL matka-aikakartta (currently not available)
26 Map Algebra a formal language for raster analysis presented by Dana Tomlin in 1980 s - revised in: Tomlin, D. (2012) GIS and Cartographic Modeling. ESRI Press.
27 Map algebra (Kartta-algebra) A set of primitive operations which allows two or more raster layers (maps) of similar dimensions to produce a new raster layer (map) using arithmetic and logical operations operations on one pixel, neighborhood, zone, entire layer By combining these, one can define a procedure to perform complex tasks A formal language, an open standard Forms the basis of raster operations in many GISs E.g. ArcGIS Spatial analyst
28 map algebra Key concepts: Layers Input-1 input-n NewLayer (= output) Notice the types of data (nominal, ordinal, interval, ratio) Location, neighbourhood, zone Local, focal, zonal, global operations Focal: Specification of the neighbourhood (4-, 8-, 24-neighbours, ) Functions Min, max, Boolean, arithmetic,
29 map algebra Operations on a raster are of four types Local operations are determined by the attributes of each cell alone Focal operations are determined by a cell and its neighbors Zonal operations apply to cells with the same value Global operations compute properties of the entire raster layer
30 Examples plus 4 neighbourhood maximum Bolstad: GIS Fundamentals global maximum
 Comparison of")
31 Local functions Operations on one pixel at a time from one or more layers, e.g. LocalDifference LocalMaximum LocalRatio LocalProduct Figure by ESRI For example, AverageCost = LocalMean(YourCost and MyCost and HisCost) Comparison of layers: either-or, cf. map overlay From elevation model to contours (in Tomlin s book)

32 Example: Rate of change from period 1 to 2
33 Examples of local functions Notice the NULL values Bolstad: GIS Fundamentals
34 Example: Reclassification Bolstad: GIS Fundamentals
35 Example: Clipping Bolstad: GIS Fundamentals
36 Focal functions Operations on a pixel and its 4 (or 8, or 32, or ) neighbouring pixels, e.g. FocalMaximum FocalMean FocalRating For example, Smoothing the map layer by FocalAverage; high and low values are smoothed away (continuous values) Generalization by filtering out individual pixels that differ from their surrounding (categorical values) Mobility simulation by producing a cost surface of mobility


37 Examples Focal Sum Edge detection This is actually calculated using a custom mask called high-pass filter:

38 Example: Filtering with 4-neighbourhood Bolstad: GIS Fundamentals
39 Example: mobility Distance layer Distances from the starting point, each direction has the same weight, by FocalSpreading Raster layers of the mobility costs For various characteristics of terrain, e.g. vegetation: dense forest vs. open area, or soil type: rock vs. soft ground Layer-specific costs are summed up; can be weighted A road or a river cuts the area and causes more cost to these pixels, therefore, higher weight Local function, results to the cost surface Cost distances calculated FocalSpreading
40 Example: Calculating the cost distances Bolstad: GIS Fundamentals Continues
41 Example: Cost distances with weighting Bolstad: GIS Fundamentals Continues
42 Example: Manhattan distances Bolstad: GIS Fundamentals
43 Zonal functions Data is related to some zoning Zoning on one layer, other data in the other layers For example, ZonalSum ZonalMaximum ZonalAverage E.g. calculating how many houses in each block Blocks first formed by cutting the area by a road layer (a focal function). Then zonal functions use the blocks: Number of houses -> ZonalSum (value = 1 in each house) Number of residents -> ZonalSum (value = num. of residents in a house) Biggest house of a block -> ZonalMaximum Average size of houses in a block -> Zonal Average
44 Example: Zonal average Bolstad: GIS Fundamentals

45 Example Energy self-sufficiency in Otaniemi: how big portion of energy consumption can be gathered using solar panels on top of roofs Data: Solar energy data, buildings, energy consumption Analysis: ZonalSum to get total energy per building
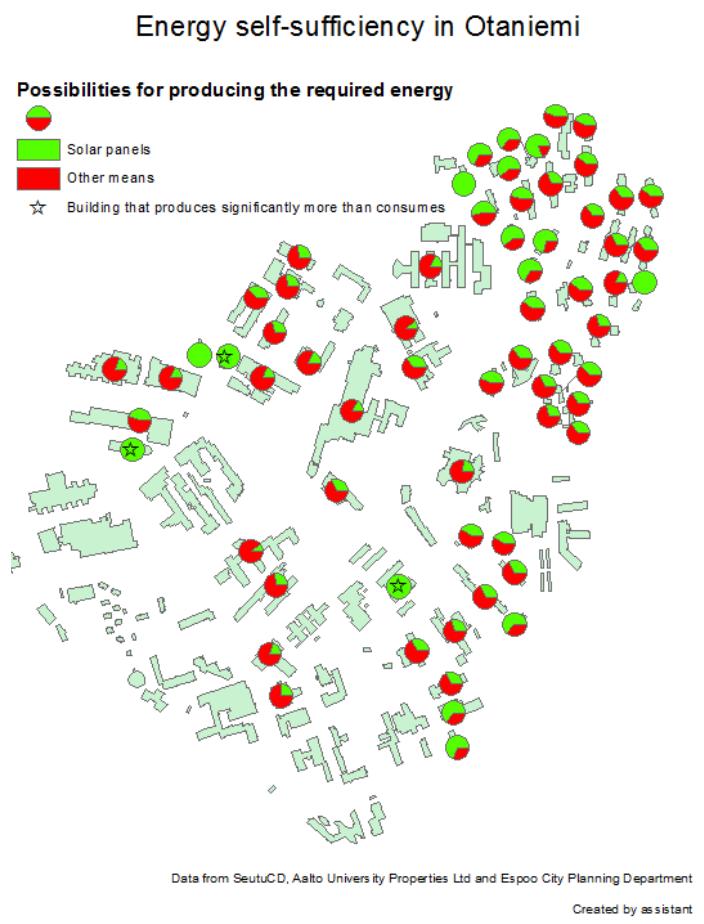
46 example
47 See more details, e.g., in ArcGIS help
48 Reading for the lecture O Sullivan & Unwin (2010): Chapter 9.5 Map Algebra (pp ) Longley et al. (2015): Chapter 14.3 Analysis of Surfaces
Geoinformation in Environmental Modelling
 Geoinformation in Environmental Modelling Spatial analysis and modelling: grid data ENY-C2005 Salla Multimäki 18.1.2017 Topics today About spatial analysis and modelling Various viewpoints for categorizing
Spatial Analyst. By Sumita Rai
 ArcGIS Extentions Spatial Analyst By Sumita Rai Overview What does GIS do? How does GIS work data models Extension to GIS Spatial Analyst Spatial Analyst Tasks & Tools Surface Analysis Surface Creation
An Introduction to Geographic Information System
 An Introduction to Geographic Information System PROF. Dr. Yuji MURAYAMA Khun Kyaw Aung Hein 1 July 21,2010 GIS: A Formal Definition A system for capturing, storing, checking, Integrating, manipulating,
Raster Spatial Analysis Specific Theory
 RSATheory.doc 1 Raster Spatial Analysis Specific Theory... 1 Spatial resampling... 1 Mosaic... 3 Reclassification... 4 Slicing... 4 Zonal Operations... 5 References... 5 Raster Spatial Analysis Specific
Geog 469 GIS Workshop. Data Analysis
 Geog 469 GIS Workshop Data Analysis Outline 1. What kinds of need-to-know questions can be addressed using GIS data analysis? 2. What is a typology of GIS operations? 3. What kinds of operations are useful
ENGRG Introduction to GIS
 ENGRG 59910 Introduction to GIS Michael Piasecki March 17, 2014 Lecture 08: Terrain Analysis Outline: Terrain Analysis Earth Surface Representation Contour TIN Mass Points Digital Elevation Models Slope
Introduction to GIS I
 Introduction to GIS Introduction How to answer geographical questions such as follows: What is the population of a particular city? What are the characteristics of the soils in a particular land parcel?
ENGRG Introduction to GIS
 ENGRG 59910 Introduction to GIS Michael Piasecki November 17, 2017 Lecture 11: Terrain Analysis Outline: Terrain Analysis Earth Surface Representation Contour TIN Mass Points Digital Elevation Models Slope
Applied Cartography and Introduction to GIS GEOG 2017 EL. Lecture-2 Chapters 3 and 4
 Applied Cartography and Introduction to GIS GEOG 2017 EL Lecture-2 Chapters 3 and 4 Vector Data Modeling To prepare spatial data for computer processing: Use x,y coordinates to represent spatial features
Overview key concepts and terms (based on the textbook Chang 2006 and the practical manual)
") Introduction Geo-information Science (GRS-10306) Overview key concepts and terms (based on the textbook 2006 and the practical manual) Introduction Chapter 1 Geographic information system (GIS) Geographically
Introduction Geo-information Science (GRS-10306) Overview key concepts and terms (based on the textbook 2006 and the practical manual) Introduction Chapter 1 Geographic information system (GIS) Geographically
Geoinformation in Environmental Modelling
 Geoinformation in Environmental Modelling Introduction to the topics ENY-C2005 Jaakko Madetoja 5.1.2018 Slides by Paula Ahonen-Rainio Topics today Orientation to geoinformation in environmental modelling
Using ArcGIS for Hydrology and Watershed Analysis:
 Using ArcGIS 10.2.2 for Hydrology and Watershed Analysis: A guide for running hydrologic analysis using elevation and a suite of ArcGIS tools Anna Nakae Feb. 10, 2015 Introduction Hydrology and watershed
GIS IN ECOLOGY: ANALYZING RASTER DATA
 GIS IN ECOLOGY: ANALYZING RASTER DATA Contents Introduction... 2 Raster Tools and Functionality... 2 Data Sources... 3 Tasks... 4 Getting Started... 4 Creating Raster Data... 5 Statistics... 8 Surface
Basics of GIS. by Basudeb Bhatta. Computer Aided Design Centre Department of Computer Science and Engineering Jadavpur University
 Basics of GIS by Basudeb Bhatta Computer Aided Design Centre Department of Computer Science and Engineering Jadavpur University e-governance Training Programme Conducted by National Institute of Electronics
Spatial Analysis I. Spatial data analysis Spatial analysis and inference
 Spatial Analysis I Spatial data analysis Spatial analysis and inference Roadmap Outline: What is spatial analysis? Spatial Joins Step 1: Analysis of attributes Step 2: Preparing for analyses: working with
+ = Spatial Analysis of Raster Data. 2 =Fault in shale 3 = Fault in limestone 4 = no Fault, shale 5 = no Fault, limestone. 2 = fault 4 = no fault
 Spatial Analysis of Raster Data 0 0 1 1 0 0 1 1 1 0 1 1 1 1 1 1 2 4 4 4 2 4 4 2 4 4 4 2 4 4 2 4 4 3 4 4 4 2 3 + = 0 = shale 1 = limestone 2 = fault 4 = no fault 2 =Fault in shale 3 = Fault in limestone
Raster Data Model. Examples of raster data Remotely sensed imagery (BV, DN) DEM (elevation) DRG (color) Raster Database
 DEM (elevation) DRG (color) Raster Database") Raster Data Model Why use a raster data model? Raster data representations Cell value Measurement, average, majority, significance Cell-based vs. point-based Raster data components Cells, Pixels, Grid
Raster Data Model Why use a raster data model? Raster data representations Cell value Measurement, average, majority, significance Cell-based vs. point-based Raster data components Cells, Pixels, Grid
GIS CONCEPTS ARCGIS METHODS AND. 2 nd Edition, July David M. Theobald, Ph.D. Natural Resource Ecology Laboratory Colorado State University
 GIS CONCEPTS AND ARCGIS METHODS 2 nd Edition, July 2005 David M. Theobald, Ph.D. Natural Resource Ecology Laboratory Colorado State University Copyright Copyright 2005 by David M. Theobald. All rights
GIS in Water Resources Midterm Exam Fall 2008 There are 4 questions on this exam. Please do all 4.
 Page 1 of 8 Name: GIS in Water Resources Midterm Exam Fall 2008 There are 4 questions on this exam. Please do all 4. 1. Basic Concepts [20 points] Find the letter with the best answer for each term: 1.
![)UDQFR54XHQWLQ(DQG'tD]'HOJDGR&](/thumbs/95/125846872.jpg ")UDQFR54XHQWLQ(DQG'tD]'HOJDGR&") &21&(37,21$1',03/(0(17$7,212)$1+
&21&(37,21$1',03/(0(17$7,212)$1+ Spatial Analysis of Raster Data
 Spatial Analysis of Raster Data 0 0 1 1 0 0 1 1 1 0 1 1 1 1 1 1 2 4 4 4 2 4 5 5 4 2 4 4 4 2 5 5 4 4 2 4 5 4 3 5 4 4 4 2 5 5 5 3 + = 0 = shale 1 = limestone 2 = fault 4 = no fault 2 =Fault in shale 3 =
GIS IN ECOLOGY: ANALYZING RASTER DATA
 GIS IN ECOLOGY: ANALYZING RASTER DATA Contents Introduction... 2 Tools and Functionality for Raster Data... 2 Data Sources... 3 Tasks... 4 Getting Started... 4 Creating Raster Data... 5 Summary Statistics...
MODULE 7 LECTURE NOTES 5 DRAINAGE PATTERN AND CATCHMENT AREA DELINEATION
 MODULE 7 LECTURE NOTES 5 DRAINAGE PATTERN AND CATCHMENT AREA DELINEATION 1. Introduction Topography of the river basin plays an important role in hydrologic modelling, by providing information on different
GIS Viewshed Analysis to Identify Zones of Potential Visual Impact on Protected Landscapes
 GIS Viewshed Analysis to Identify Zones of Potential Visual Impact on Protected Landscapes Background Natural England is consulted by local planning authorities on increasing numbers of development proposals,
Popular Mechanics, 1954
 Introduction to GIS Popular Mechanics, 1954 1986 $2,599 1 MB of RAM 2017, $750, 128 GB memory, 2 GB of RAM Computing power has increased exponentially over the past 30 years, Allowing the existence of
Tutorial 8 Raster Data Analysis
 Objectives Tutorial 8 Raster Data Analysis This tutorial is designed to introduce you to a basic set of raster-based analyses including: 1. Displaying Digital Elevation Model (DEM) 2. Slope calculations
Application of high-resolution (10 m) DEM on Flood Disaster in 3D-GIS
 DEM on Flood Disaster in 3D-GIS") Risk Analysis V: Simulation and Hazard Mitigation 263 Application of high-resolution (10 m) DEM on Flood Disaster in 3D-GIS M. Mori Department of Information and Computer Science, Kinki University, Japan
Risk Analysis V: Simulation and Hazard Mitigation 263 Application of high-resolution (10 m) DEM on Flood Disaster in 3D-GIS M. Mori Department of Information and Computer Science, Kinki University, Japan
A Basic Introduction to Geographic Information Systems (GIS) ~~~~~~~~~~
 ~~~~~~~~~~") A Basic Introduction to Geographic Information Systems (GIS) ~~~~~~~~~~ Rev. Ronald J. Wasowski, C.S.C. Associate Professor of Environmental Science University of Portland Portland, Oregon 3 September
A Basic Introduction to Geographic Information Systems (GIS) ~~~~~~~~~~ Rev. Ronald J. Wasowski, C.S.C. Associate Professor of Environmental Science University of Portland Portland, Oregon 3 September
Outline. Geographic Information Analysis & Spatial Data. Spatial Analysis is a Key Term. Lecture #1
 Geographic Information Analysis & Spatial Data Lecture #1 Outline Introduction Spatial Data Types: Objects vs. Fields Scale of Attribute Measures GIS and Spatial Analysis Spatial Analysis is a Key Term
GEO-DATA INPUT AND CONVERSION. Christos G. Karydas,, Dr. Lab of Remote Sensing and GIS Director: Prof. N. Silleos
 Christos G. Karydas,, Dr. xkarydas@agro.auth.gr http://users.auth.gr/xkarydas Lab of Remote Sensing and GIS Director: Prof. N. Silleos School of Agriculture Aristotle University of Thessaloniki, GR 1 0.
Quality and Coverage of Data Sources
 Quality and Coverage of Data Sources Objectives Selecting an appropriate source for each item of information to be stored in the GIS database is very important for GIS Data Capture. Selection of quality
Introduction to ArcGIS Spatial Analyst
 Esri International User Conference San Diego, California Technical Workshops July 2011 Introduction to ArcGIS Spatial Analyst Steve Kopp Elizabeth Graham ArcGIS Spatial Analyst Integrated raster and vector
Creating Watersheds from a DEM
 Creating Watersheds from a DEM These instructions enable you to create watersheds of specified area using a good quality Digital Elevation Model (DEM) in ArcGIS 8.1. The modeling is performed in ArcMap
Delineation of Watersheds
 Delineation of Watersheds Adirondack Park, New York by Introduction Problem Watershed boundaries are increasingly being used in land and water management, separating the direction of water flow such that
Model Integration - How WEPP inputs are calculated from GIS data. ( ArcGIS,TOPAZ, Topwepp)
") Model Integration - How WEPP inputs are calculated from GIS data. ( ArcGIS,TOPAZ, Topwepp) ArcGIS 9.1-9.3 Allows user to locate area of interest, assemble grids, visualize outputs. TOPAZ Performs DEM
Model Integration - How WEPP inputs are calculated from GIS data. ( ArcGIS,TOPAZ, Topwepp) ArcGIS 9.1-9.3 Allows user to locate area of interest, assemble grids, visualize outputs. TOPAZ Performs DEM
GEOGRAPHY 350/550 Final Exam Fall 2005 NAME:
 1) A GIS data model using an array of cells to store spatial data is termed: a) Topology b) Vector c) Object d) Raster 2) Metadata a) Usually includes map projection, scale, data types and origin, resolution
Display data in a map-like format so that geographic patterns and interrelationships are visible
 Vilmaliz Rodríguez Guzmán M.S. Student, Department of Geology University of Puerto Rico at Mayagüez Remote Sensing and Geographic Information Systems (GIS) Reference: James B. Campbell. Introduction to
Working with Digital Elevation Models in ArcGIS 8.3
 Working with Digital Elevation Models in ArcGIS 8.3 The homework that you need to turn in is found at the end of this document. This lab continues your introduction to using the Spatial Analyst Extension
Digital Elevation Models. Using elevation data in raster format in a GIS
 Digital Elevation Models Using elevation data in raster format in a GIS What is a Digital Elevation Model (DEM)? Digital representation of topography Model based on scale of original data Commonly a raster
Remote Sensing and GIS Applications for Hilly Watersheds SUBASHISA DUTTA DEPARTMENT OF CIVIL ENGINEERING IIT GUWAHATI
 Remote Sensing and GIS Applications for Hilly Watersheds SUBASHISA DUTTA DEPARTMENT OF CIVIL ENGINEERING IIT GUWAHATI Deciding Alternative Land Use Options in a Watershed Using GIS Source: Anita Prakash
8.9 Geographical Information Systems Advantages of GIS
 8.9 Geographical Information Systems A Geographic Information System (GIS) is a computer-based system that is used in input, storage, analysis manipulation, retrieval, and output, of spatial data. These
BASIC SPATIAL ANALYSIS TOOLS IN A GIS. data set queries basic statistics buffering overlay reclassification
 BASIC SPATIAL ANALYSIS TOOLS IN A GIS data set queries basic statistics buffering overlay reclassification GIS ANALYSIS TOOLS GIS ANALYSIS TOOLS Database tools: query and summarize (similar to spreadsheet
Geographic Information Systems (GIS) in Environmental Studies ENVS Winter 2003 Session III
 in Environmental Studies ENVS Winter 2003 Session III") Geographic Information Systems (GIS) in Environmental Studies ENVS 6189 3.0 Winter 2003 Session III John Sorrell York University sorrell@yorku.ca Session Purpose: To discuss the various concepts of space,
Geographic Information Systems (GIS) in Environmental Studies ENVS 6189 3.0 Winter 2003 Session III John Sorrell York University sorrell@yorku.ca Session Purpose: To discuss the various concepts of space,
4. GIS Implementation of the TxDOT Hydrology Extensions
 4. GIS Implementation of the TxDOT Hydrology Extensions A Geographic Information System (GIS) is a computer-assisted system for the capture, storage, retrieval, analysis and display of spatial data. It
[Figure 1 about here]
![[Figure 1 about here]](/thumbs/87/95828660.jpg "[Figure 1 about here]") TITLE: FIELD-BASED SPATIAL MODELING BYLINE: Michael F. Goodchild, University of California, Santa Barbara, www.geog.ucsb.edu/~good SYNONYMS: None DEFINITION: A field (or continuous field) is defined as
TITLE: FIELD-BASED SPATIAL MODELING BYLINE: Michael F. Goodchild, University of California, Santa Barbara, www.geog.ucsb.edu/~good SYNONYMS: None DEFINITION: A field (or continuous field) is defined as
Introduction to Geographic Information Systems (GIS): Environmental Science Focus
: Environmental Science Focus") Introduction to Geographic Information Systems (GIS): Environmental Science Focus September 9, 2013 We will begin at 9:10 AM. Login info: Username:!cnrguest Password: gocal_bears Instructor: Domain: CAMPUS
Introduction to Geographic Information Systems (GIS): Environmental Science Focus September 9, 2013 We will begin at 9:10 AM. Login info: Username:!cnrguest Password: gocal_bears Instructor: Domain: CAMPUS
Class 9. Query, Measurement & Transformation; Spatial Buffers; Descriptive Summary, Design & Inference
 Class 9 Query, Measurement & Transformation; Spatial Buffers; Descriptive Summary, Design & Inference Spatial Analysis Turns raw data into useful information by adding greater informative content and value
It s a Model. Quantifying uncertainty in elevation models using kriging
 It s a Model Quantifying uncertainty in elevation models using kriging By Konstantin Krivoruchko and Kevin Butler, Esri Raster based digital elevation models (DEM) are the basis of some of the most important
COMPARISON OF DIGITAL ELEVATION MODELLING METHODS FOR URBAN ENVIRONMENT
 COMPARISON OF DIGITAL ELEVATION MODELLING METHODS FOR URBAN ENVIRONMENT Cahyono Susetyo Department of Urban and Regional Planning, Institut Teknologi Sepuluh Nopember, Indonesia Gedung PWK, Kampus ITS,
Workshops funded by the Minnesota Environment and Natural Resources Trust Fund
 Workshops funded by the Minnesota Environment and Natural Resources Trust Fund Conservation Applications of LiDAR Data Workshops funded by: Minnesota Environment and Natural Resources Trust Fund Presented
SuperGIS Server 3.3 Functionality Matrix
 Functionality Matrix Apr 2017 Functionality Matrix SuperGIS Server, a comprehensive and server-based GIS, is designed for the organizations to create, manage, integrate and distribute a variety of GIS
SPOT DEM Product Description
 SPOT DEM Product Description Version 1.1 - May 1 st, 2004 This edition supersedes previous versions Acronyms DIMAP DTED DXF HRS JPEG, JPG DEM SRTM SVG Tiff - GeoTiff XML Digital Image MAP encapsulation
SRJC Applied Technology 54A Introduction to GIS
 SRJC Applied Technology 54A Introduction to GIS Overview Lecture of Geographic Information Systems Fall 2004 Santa Rosa Junior College Presented By: Tim Pudoff, GIS Coordinator, County of Sonoma, Information
Using GIS to Delineate Watersheds Ed Poyer NRS 509, Fall 2010
 Using GIS to Delineate Watersheds Ed Poyer NRS 509, Fall 2010 A watershed is an area that contributes flow to a point on the landscape. (Bolstad, 2005). Watersheds are an important focus of study because
Lab 7: Cell, Neighborhood, and Zonal Statistics
 Lab 7: Cell, Neighborhood, and Zonal Statistics Exercise 1: Use the Cell Statistics function to detect change In this exercise, you will use the Spatial Analyst Cell Statistics function to compare the
GIS CONCEPTS ARCGIS METHODS AND. 3 rd Edition, July David M. Theobald, Ph.D. Warner College of Natural Resources Colorado State University
 GIS CONCEPTS AND ARCGIS METHODS 3 rd Edition, July 2007 David M. Theobald, Ph.D. Warner College of Natural Resources Colorado State University Copyright Copyright 2007 by David M. Theobald. All rights
LiDAR APPLICATIONS REMS6090. Assignment 2 HYDROLOGICAL APPLICATIONS of LiDAR DATA Due Date April 8, Venessa Bennett W
 LiDAR APPLICATIONS REMS6090 Assignment 2 HYDROLOGICAL APPLICATIONS of LiDAR DATA Due Date April 8, 2015 Venessa Bennett W0279429 1.0 Introduction High accuracy Digital Elevation Models (DEM) derived from
USING GIS CARTOGRAPHIC MODELING TO ANALYSIS SPATIAL DISTRIBUTION OF LANDSLIDE SENSITIVE AREAS IN YANGMINGSHAN NATIONAL PARK, TAIWAN
 CO-145 USING GIS CARTOGRAPHIC MODELING TO ANALYSIS SPATIAL DISTRIBUTION OF LANDSLIDE SENSITIVE AREAS IN YANGMINGSHAN NATIONAL PARK, TAIWAN DING Y.C. Chinese Culture University., TAIPEI, TAIWAN, PROVINCE
Representation of Geographic Data
 GIS 5210 Week 2 The Nature of Spatial Variation Three principles of the nature of spatial variation: proximity effects are key to understanding spatial variation issues of geographic scale and level of
Terms GIS GPS Vector Data Model Raster Data Model Feature Attribute Table Point Line Polygon Pixel RGB Overlay Function
 FINAL REVIEW FOR GIS (2016) PRACTICAL COMPONENT The first 40 mins of the exam will be open book and will require you to make a map using all the techniques learned over the semester. This map will be e-mailed
Geo 327G Semester Project. Landslide Suitability Assessment of Olympic National Park, WA. Fall Shane Lewis
 Geo 327G Semester Project Landslide Suitability Assessment of Olympic National Park, WA Fall 2011 Shane Lewis 1 I. Problem Landslides cause millions of dollars of damage nationally every year, and are
Spatial Analysis II. Spatial data analysis Spatial analysis and inference
 Spatial Analysis II Spatial data analysis Spatial analysis and inference Roadmap Spatial Analysis I Outline: What is spatial analysis? Spatial Joins Step 1: Analysis of attributes Step 2: Preparing for
1 Introduction: 2 Data Processing:
 Darren Janzen University of Northern British Columbia Student Number 230001222 Major: Forestry Minor: GIS/Remote Sensing Produced for: Geography 413 (Advanced GIS) Fall Semester Creation Date: November
Geo-spatial Analysis for Prediction of River Floods
 Geo-spatial Analysis for Prediction of River Floods Abstract. Due to the serious climate change, severe weather conditions constantly change the environment s phenomena. Floods turned out to be one of
What is GIS? Introduction to data. Introduction to data modeling
 What is GIS? Introduction to data Introduction to data modeling 2 A GIS is similar, layering mapped information in a computer to help us view our world as a system A Geographic Information System is a
Working with Digital Elevation Models and Digital Terrain Models in ArcMap 9
 Working with Digital Elevation Models and Digital Terrain Models in ArcMap 9 1 TABLE OF CONTENTS INTRODUCTION...3 WORKING WITH DIGITAL TERRAIN MODEL (DTM) DATA FROM NRVIS, CITY OF KITCHENER, AND CITY OF
GIS in Water Resources Midterm Quiz Fall There are 5 questions on this exam. Please do all 5. They are of equal credit.
 Name: GIS in Water Resources Midterm Quiz Fall 2003 There are 5 questions on this exam. Please do all 5. They are of equal credit. 1. Data Representation (a) In ArcGIS, vector and tabular data have a number
ArcGIS Pro: Analysis and Geoprocessing. Nicholas M. Giner Esri Christopher Gabris Blue Raster
 ArcGIS Pro: Analysis and Geoprocessing Nicholas M. Giner Esri Christopher Gabris Blue Raster Agenda What is Analysis and Geoprocessing? Analysis in ArcGIS Pro - 2D (Spatial xy) - 3D (Elevation - z) - 4D
Week 7 Last week: This week s topics. GIS and Forest Engineering Applications. FE 257. GIS and Forest Engineering Applications.
 FE 257. GIS and Forest Engineering Applications Week 7 Week 7 Last week: Spatial Projections Questions? Next week- read: Chapter 10: Updating GIS Databases Chapter 12: Synthesis of Techniques Applied to
Geospatial Fire Behavior Modeling App to Manage Wildfire Risk Online. Kenyatta BaRaKa Jackson US Forest Service - Consultant
 Geospatial Fire Behavior Modeling App to Manage Wildfire Risk Online Kenyatta BaRaKa Jackson US Forest Service - Consultant Fire Behavior Modeling and Forest Fuel Management Modeling Fire Behavior is an
Using the Stock Hydrology Tools in ArcGIS
 Using the Stock Hydrology Tools in ArcGIS This lab exercise contains a homework assignment, detailed at the bottom, which is due Wednesday, October 6th. Several hydrology tools are part of the basic ArcGIS
a system for input, storage, manipulation, and output of geographic information. GIS combines software with hardware,
 Introduction to GIS Dr. Pranjit Kr. Sarma Assistant Professor Department of Geography Mangaldi College Mobile: +91 94357 04398 What is a GIS a system for input, storage, manipulation, and output of geographic
Spatio-temporal models
 Spatio-temporal models Involve a least a three dimensional representation of one or more key attribute variation in planar (X-Y) space and through time. (a 4 th dimension could also be use, like Z for
Waterborne Environmental, Inc., Leesburg, VA, USA 2. Syngenta Crop Protection, LLC, North America 3. Syngenta Crop Protection, Int.
 Application of High Resolution Elevation Data (LiDAR) to Assess Natural and Anthropogenic Agricultural Features Affecting the Transport of Pesticides at Multiple Spatial Scales Josh Amos 1, Chris Holmes
Introduction-Overview. Why use a GIS? What can a GIS do? Spatial (coordinate) data model Relational (tabular) data model
 data model Relational (tabular) data model") Introduction-Overview Why use a GIS? What can a GIS do? How does a GIS work? GIS definitions Spatial (coordinate) data model Relational (tabular) data model intro_gis.ppt 1 Why use a GIS? An extension
Introduction-Overview Why use a GIS? What can a GIS do? How does a GIS work? GIS definitions Spatial (coordinate) data model Relational (tabular) data model intro_gis.ppt 1 Why use a GIS? An extension
Lecture 5. Symbolization and Classification MAP DESIGN: PART I. A picture is worth a thousand words
 Lecture 5 MAP DESIGN: PART I Symbolization and Classification A picture is worth a thousand words Outline Symbolization Types of Maps Classifying Features Visualization Considerations Symbolization Symbolization
software, just as word processors or databases are. GIS was originally developed and cartographic capabilities have been augmented by analysis tools.
 1. INTRODUCTION 1.1Background A GIS is a Geographic Information System, a software package for creating, viewing, and analyzing geographic information or spatial data. GIS is a class of software, just
Watershed Modeling With DEMs
 Watershed Modeling With DEMs Lesson 6 6-1 Objectives Use DEMs for watershed delineation. Explain the relationship between DEMs and feature objects. Use WMS to compute geometric basin data from a delineated
Make it Spatial. Josh Tanner. Theresa Burcsu. Tools, techniques, and tips for incorporating GIS into your research
 Make it Spatial Tools, techniques, and tips for incorporating GIS into your research Theresa Burcsu Josh Tanner Oregon GIS Framework Coordinator GIS Analyst & Web Administrator Geospatial Enterprise Office
CS 350 A Computing Perspective on GIS
 CS 350 A Computing Perspective on GIS What is GIS? Definitions A powerful set of tools for collecting, storing, retrieving at will, transforming and displaying spatial data from the real world (Burrough,
GIS for ChEs Introduction to Geographic Information Systems
 GIS for ChEs Introduction to Geographic Information Systems AIChE Webinar John Cirucci 1 GIS for ChEs Introduction to Geographic Information Systems What is GIS? Tools and Methods Applications Examples
NR402 GIS Applications in Natural Resources
 NR402 GIS Applications in Natural Resources Lesson 1 Introduction to GIS Eva Strand, University of Idaho Map of the Pacific Northwest from http://www.or.blm.gov/gis/ Welcome to NR402 GIS Applications in
Geoinformation in Environmental Modelling
 Geoinformation in Environmental Modelling Introduction to the topics ENY-C2005 Salla Multimäki 4.1.2017 Topics today Orientation to geoinformation in environmental modelling to form the big picture and
Evaluation of gvsig and SEXTANTE Tools for Hydrological Analysis
 Evaluation of gvsig and SEXTANTE Tools for Hydrological Analysis 6th gvsig Conference, Valencia, SPAIN Prof. Dr-Ing Dietrich Schrödera Mudogah Hildahb and Franz Davidb Stuttgart University of Applied Sciences
What are the five components of a GIS? A typically GIS consists of five elements: - Hardware, Software, Data, People and Procedures (Work Flows)
") LECTURE 1 - INTRODUCTION TO GIS Section I - GIS versus GPS What is a geographic information system (GIS)? GIS can be defined as a computerized application that combines an interactive map with a database
LECTURE 1 - INTRODUCTION TO GIS Section I - GIS versus GPS What is a geographic information system (GIS)? GIS can be defined as a computerized application that combines an interactive map with a database
Delineation of high landslide risk areas as a result of land cover, slope, and geology in San Mateo County, California
 Delineation of high landslide risk areas as a result of land cover, slope, and geology in San Mateo County, California Introduction Problem Overview This project attempts to delineate the high-risk areas
Lecture 4. Spatial Statistics
 Lecture 4 Spatial Statistics Lecture 4 Outline Statistics in GIS Spatial Metrics Cell Statistics Neighborhood Functions Neighborhood and Zonal Statistics Mapping Density (Density surfaces) Hot Spot Analysis
SPATIAL MODELING GIS Analysis Winter 2016
 SPATIAL MODELING GIS Analysis Winter 2016 Spatial Models Spatial Modeling attempts to represent how the world works All models are wrong, but some are useful (G.E. Box, quoted in course textbook pg. 379)
FNRM 3131 Introduction to GIS in Natural Resource Management
 FNRM 3131 Introduction to GIS in Natural Resource Management Instructors: Andrew C Jenks 215 Green Hall ajenks@umnedu, @acjenks Paul V Bolstad 301H Green Hall pbolstad@umnedu Course Topics Motivation:
Math/Stat Classification of Spatial Analysis and Spatial Statistics Operations
 Draft3, April 2012 Math/Stat Classification of Spatial Analysis and Spatial Statistics Operations for MapCalc software distributed by Berry & Associates // Spatial Information Systems Alternative frameworks
GIS and Forest Engineering Applications FE 257 Lecture and laboratory, 3 credits
 GIS and Forest Engineering Applications FE 257 Lecture and laboratory, 3 credits Instructor: Michael Wing Associate Professor Forest Engineering, Resources, and Management Oregon State University Crop
GIS = Geographic Information Systems;
 What is GIS GIS = Geographic Information Systems; What Information are we talking about? Information about anything that has a place (e.g. locations of features, address of people) on Earth s surface,
Why Is It There? Attribute Data Describe with statistics Analyze with hypothesis testing Spatial Data Describe with maps Analyze with spatial analysis
 6 Why Is It There? Why Is It There? Getting Started with Geographic Information Systems Chapter 6 6.1 Describing Attributes 6.2 Statistical Analysis 6.3 Spatial Description 6.4 Spatial Analysis 6.5 Searching
Introduction to GIS. Dr. M.S. Ganesh Prasad
 Introduction to GIS Dr. M.S. Ganesh Prasad Department of Civil Engineering The National Institute of Engineering, MYSORE ganeshprasad.nie@gmail.com 9449153758 Geographic Information System (GIS) Information
In this exercise we will learn how to use the analysis tools in ArcGIS with vector and raster data to further examine potential building sites.
 GIS Level 2 In the Introduction to GIS workshop we filtered data and visually examined it to determine where to potentially build a new mixed use facility. In order to get a low interest loan, the building
Exercise 6: Working with Raster Data in ArcGIS 9.3
 Exercise 6: Working with Raster Data in ArcGIS 9.3 Why Spatial Analyst? Grid query Grid algebra Grid statistics Summary by zone Proximity mapping Reclassification Histograms Surface analysis Slope, aspect,
GIS Test Drive What a Geographic Information System Is and What it Can Do. Alison Davis-Holland
 GIS Test Drive What a Geographic Information System Is and What it Can Do Alison Davis-Holland adavisholland@gmail.com WHO AM I? Geospatial Analyst M.S. in Geographic and Cartographic Sciences Use GIS
EO Information Services. Assessing Vulnerability in the metropolitan area of Rio de Janeiro (Floods & Landslides) Project
 Project") EO Information Services in support of Assessing Vulnerability in the metropolitan area of Rio de Janeiro (Floods & Landslides) Project Ricardo Armas, Critical Software SA Haris Kontoes, ISARS NOA World
EO Information Services in support of Assessing Vulnerability in the metropolitan area of Rio de Janeiro (Floods & Landslides) Project Ricardo Armas, Critical Software SA Haris Kontoes, ISARS NOA World
Chapter 6. Fundamentals of GIS-Based Data Analysis for Decision Support. Table 6.1. Spatial Data Transformations by Geospatial Data Types
 Chapter 6 Fundamentals of GIS-Based Data Analysis for Decision Support FROM: Points Lines Polygons Fields Table 6.1. Spatial Data Transformations by Geospatial Data Types TO: Points Lines Polygons Fields
ENV208/ENV508 Applied GIS. Week 1: What is GIS?
 ENV208/ENV508 Applied GIS Week 1: What is GIS? 1 WHAT IS GIS? A GIS integrates hardware, software, and data for capturing, managing, analyzing, and displaying all forms of geographically referenced information.