Vacant Land Identification in the City of Lakeway Texas and Growth potential of the Lakeway Area
|
|
|
- Preston Greene
- 6 years ago
- Views:
Transcription
1 Vacant Land Identification in the City of Lakeway Texas and Growth potential of the Lakeway Area Troy Larsen School of Architecture The University of Texas at Austin December 14, 2007 CRP 386 Introduction to Geographic Information Systems
2 Table of Contents Executive Summary 3 Introduction 4 Problem Statement 4 Research Questions 5 Methodology 5 Findings 6 Conclusions 7 Caveats 7 Further Research 8 References 9 Appendix 11 2
3 Executive Summary Some government entities do not have the resources needed to access Geographic Information Systems (GIS) or to develop products using GIS. The City of Lakeway Texas currently does not have any type of GIS productivity, personnel, or resources. They desire a product that would utilize GIS to perform an analysis of current land use, zoning, and ownership to indicate where developable land is and show possible growth scenarios. The level of detail in the analysis would be at the most elementary level due to the lack of GIS data. Some of the data that will be used is not up to date or specific enough to show very detailed findings. Ideally the maps would display potential growth areas and give a sense to where the developable land is and the limits to constraining that growth. However, due to the lack of data, expertise, time, and resources; the level of analysis will be an experiment to see what can be done with existing data sources to accurately find vacant land in Lakeway and if the process of using GIS accurately reflects current undeveloped land. This is a first step in a larger process of research and body of work designed to enhance the City of Lakeway s use of GIS for planning and city management purposes. The area under study is experiencing an intense amount of growth and under current conditions the growth is placing an increased amount of stress on current open space, utilities, and roads. The city is limited in its growth control ability due to its relatively small city limits and extra territorial jurisdiction (ETJ). Within the city limits, the city has the strongest ability to shape development with zoning and building regulations. However, outside the city limits, the city is constrained by limited authority to control development and growth. There are several residential and commercial projects under construction and many more are in the planning stages. This will add hundreds of residential units to the immediate area and will have impacts beyond the Lakeway area. There are several habitat areas and environmentally sensitive areas within the vicinity of the City of Lakeway. The new development that is occurring in and around the city will most likely encroach on these areas. The need for the identification of these areas and the potential growth patterns will greatly enhance the ability of planners, the public, and developers to at least consider the impacts of the built environment on the natural landscape. Another area that is under increasing strain is the road network that serves the City of Lakeway and surrounding areas. Envision Central Texas (ECT) or any other desired growth scenarios do not indicate that Lakeway will be a development area; however they do list the nearby City of Bee Cave as a development node. Either way, access for current citizens will be lessened or the road network strained because the road that service Lakeway is limited to just two access points along Ranch Road 620. Traffic is increasing to the point that it is exceeding the built capacity of the current road network. 3
4 ECT seeks to control sprawl with a regional effort, but the ECT plan may be unrealistic as the areas that they deem undeveloped are already developing. To start to develop a base of knowledge using GIS, the city is taking its first steps toward utilizing GIS to influence its planning and management decisions and capability. Introduction This project hopes to highlight the potential for further development around the Lakeway area. Lakeway is situated along Ranch Road 620 and residents of the area rely solely on this road to access Farm Road 2222, Hwy 71, and Farm Road 2244 for vehicle trips to Austin the main regional employment center. The areas roads are reaching their built capacity and further development will only add to their use and expansion. The city desires to show future growth scenario under current zoning, land use, and ownership in a dynamic visual format for public presentation as well as for planning studies. A GIS product should fill that need and increase planning regarding growth. A more informed public and political body should increase informed decisions being made regarding growth. This project will use GIS to discover undeveloped properties within Lakeway s city limits. This could shed light on the potential for further development in and outside the city limits. Further analysis could show areas within the Lakeway area that are developed, could be developed, and areas that should be protected from development. Additionally, future research could focus on the limits to or the potential for growth management and projections of development and population within the Lakeway area. Those scenarios could be compared to Envision Central Texas vision and possible future protected areas that Conservancy organizations would be interested in protecting. Problem Statement The City of Lakeway is limited in how it attempts to control growth and protects sensitive environmental features and wildlife habitat in its city limits and beyond. Current land control devices in the city limits do little to control growth and development outside the city limits. The city has an increasing need to learn from planning exercises to inform planning decisions as well as educate the public about potential development in the Lakeway area. GIS could be used for this purpose; however, currently there is a lack of geospatial data that is available for the Lakeway area. 4
5 Research Questions The end result of the number of research questions answered depended on the quality and the extent of data that was available. The ideal outcome would have been to answer as many of the questions that are listed below with maps. What is the amount and location of developable land within the city limits and ETJ of Lakeway? How will the city s open space plan affect sensitive environmental areas? What are the short and long range plans for the Lakeway area? What transportation networks currently exist? What is the current land use within Lakeway s jurisdiction? Who owns the property within Lakeway s jurisdiction? What are the current open spaces and protected areas in Lakeway? What is the current population density within Lakeway s jurisdiction? Are there areas around Lakeway that need to be protected? Methodology The first step in the process of the study was to organize a plan of research and list of possible data sources to answer specific questions with GIS. The next step was to seek out the data needed to perform the analysis. Research questions guided the selection of data that was needed to find solutions to the problem statement. The first step in the process will be to develop a base map of the area. Formed base maps - Transportation - Land Use - Prop ownership - Protected areas - Pop density - Parcel map - Vacant Land The next step will be to construct multiple layers using overlay of base maps and perform analysis to answer research questions. Difficulty arose with the base data, specifically the manipulation of census information, address and population Excel files, and TCAD data. A significant amount of time was spent trying to work with this data to make it compatible with GIS. Other drawbacks included the level of data that was available for the area around Lakeway. Specific procedures for each map are listed in the appendix. 5
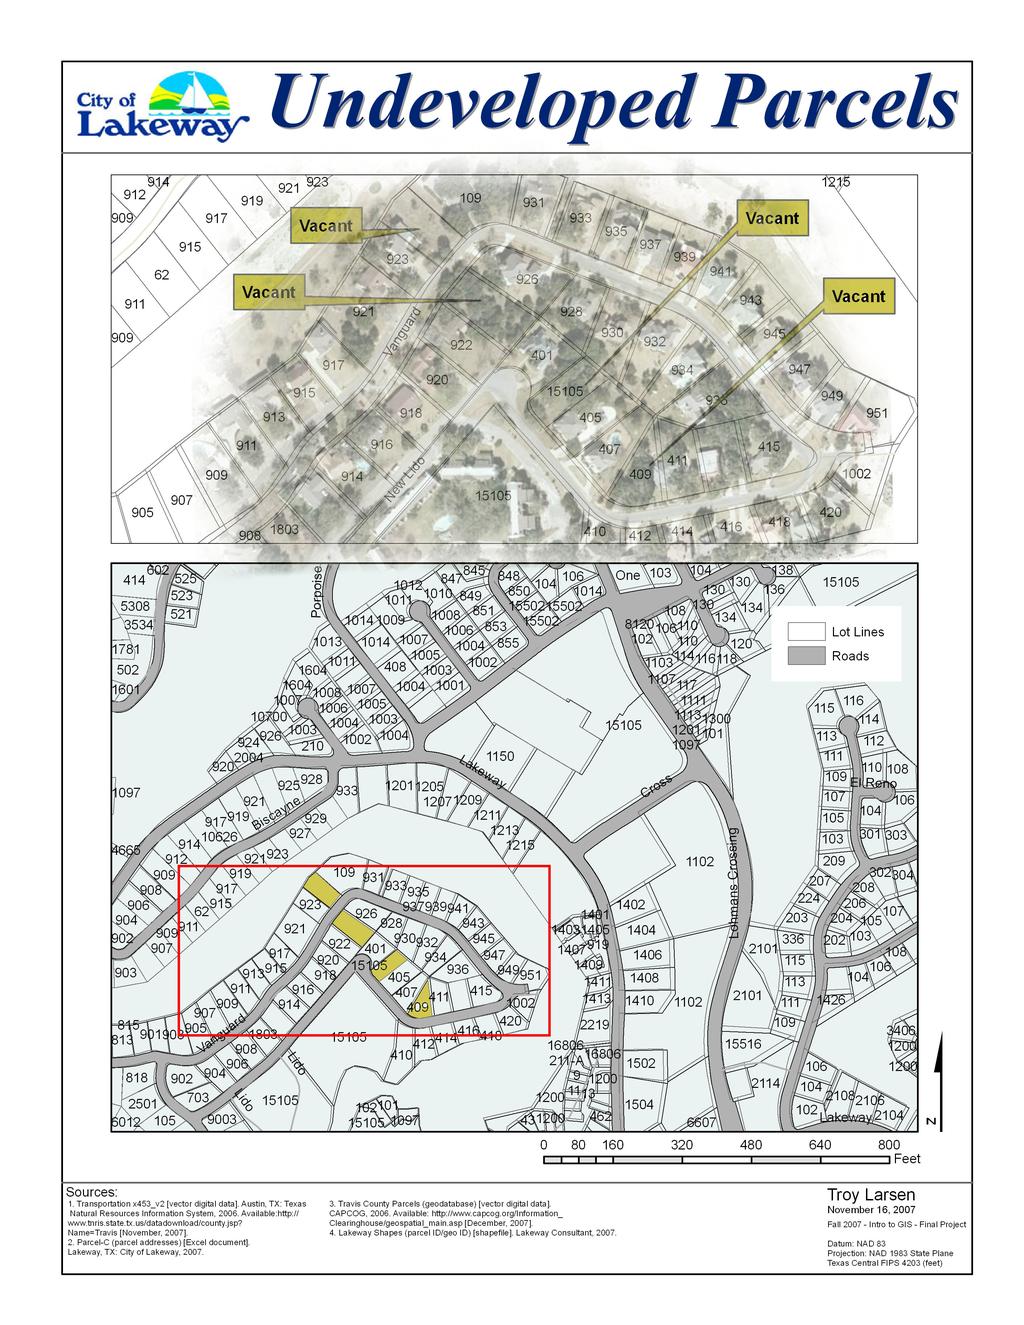
6 Findings The end result of the number of research questions answered depended on the quality and the extent of data that was available as well as the amount of time available to deal with it. The ideal outcome would have been to answer the statements that are listed below with maps. 1) Show areas that can be developed currently and possible build-out scenarios. 2) Show sensitive environmental areas in the West Austin area that need to be protected from development. Map 1: The Location Map is for understanding the context of the study; it shows the location of the City of Lakeway within Travis County as well as some other cities within the study area. IH 35 is shown of the map of Travis County because it is a landmark that many identify with. The map also shows the area that Travis County occupies within the State of Texas. Map 2: The Population Map shows three frames that display the population, broken into Census Blocks, of Travis County, the Lakeway area, and the City of Lakeway. Map 3: The Road Network Map presents the major and minor roads that service the Lakeway area. It shows that using Ranch Road 620 is the only way to access the City of Lakeway. There are no other significant transportation modes for this area. Map 4: The Improved Value Map shows what parcels are displayed by using the base Parcel layer and separating out all improved values that equal zero from all others. Two types of parcels are displayed ones with value and ones with no improved value. Map 5: The Vacant Land & Use Map is the result of data manipulation of basically three different shapefiles that could indicate vacant parcels by themselves. By taking the best attributes of the three files and fusing them together, the result is the most accurate representation of where vacant parcels are today. The map also shows the latest (2003) representation of the land use codes for each parcel. Map 6: The Vacant Parcel Values Map lists the value of land per acre of the lots that are currently vacant according to the data. Map 7: The Undeveloped Parcels Map tries to mesh the GIS data indicating vacant parcels to the most recent aerial photo (taken from Google Earth). This shows that the data manipulation was fairly successful in locating the actual vacant parcels. 6
7 Conclusions Based on the analysis completed in this study, it is possible to produce GIS maps for a city that may not have GIS capability of its own. By relying on various organizations, levels of governments, and nearby cities GIS departments, some geospatial data can be gathered and manipulated to produce various maps and analyses. Through this study, a number of data sets were collected and several descriptive maps were produced. The main question of whether vacant parcels could be located was answered with a resounding yes. However, the accuracy may not be as good as expected due to the age of data that was used. Other research questions would have to wait to be answered through future research. This project definitely created a good starting point and base for future research to contribute to an ongoing study of the Lakeway area. The maps developed for this study certainly give a sense of the potential growth that could occur in the Lakeway area. Caveats With additional data manipulation and time, additional maps and analysis could be produced using the base data that is currently available. Even though it is limited for the area under study, it is possible to create improved and more accurate results. For a better analysis, original data could be produced at the city level as long as it kept pace with new development, recorded many variables, and was organized in a usable format. Below are caveats for each map. Map 1: None to state. Map 2: The Population Map does not indicate the population density within the Census Blocks. This is due to the base data that was used to form the map. When the information is downloaded from the Geography Network, it does not include the area measurement of the Census Blocks. Because the blocks are not uniform in size, this will misrepresent the actual concentrations of population within Travis County. If area was included to normalize the population, it would present a better way to calculate and display population density. Map 3: The attribute table of the transportation shapefile did not separate out major and minor roads. The data could have been pared down a little more to symbolize each road differently. However the map does display the routes (in red) that people who reside in the study area have to use. 7
8 Map 4: By separating out all improved values that equal zero from all others in the attribute table of the Parcel layer, the Improved Value Map shows parcels separated into two classes. This does not take into account properties that cannot be developed like utility owned property or designated green belts among others. Map 5: Initial data that would have been used was from Travis County Central Appraisal District. This was in text (.txt) format and was accessible by using Microsoft Access which proved difficult to work with. The data might have been useful but do to time limitations other data sources were selected for this map. Due to the age of the base data that was used to form the Vacant Land & Use Map, the result is the most accurate representation of where vacant parcels are today, however this result is not totally grounded with reality. The data is several years old and the pace of development in the Lakeway area would quickly outpace this data as presented from the various organizations that produced them. Suggested improvement to this analysis would be to add a database that is updated at the city level to accurately represent the true locations of vacant parcels. Map 6: The values of these parcels may be higher than listed because the data is outdated and from Travis County Central Appraisal District which is also different from true market value on the real estate market. Map 7: Although the data manipulation was fairly successful in locating the actual vacant parcels according to the most recent aerial photo (taken from Google Earth). There are several problems with this analysis. In the Undeveloped Parcels Map, the data used is several years old and the pace of development in the Lakeway area would quickly outpace this data as presented. The aerial photo is also dated and therefore not an accurate representation of reality where the vacant parcels are today. Additional information about the addresses of parcels was incorporated in the map; however, the format of the information was not ideal and proved almost useless for this map. The data would need to be manipulated further before it was added to ArcGIS to be more useful as a tool for display or analysis. Further Research Questions that were partly answered with this study are listed below. This analysis could be improved with further research. What is the amount and location of developable land within the city limits and ETJ of Lakeway? What is the current land use within Lakeway s jurisdiction? Who owns the property within Lakeway s jurisdiction? 8
9 What are the current open spaces and protected areas in Lakeway? What is the current population density within Lakeway s jurisdiction? Questions listed below that were not answered with this study that could be answered with future research. What is the amount and location of developable land within the ETJ of Lakeway? How will the city s open space plan affect sensitive environmental areas? What are the short and long range plans for the Lakeway area? Are there areas around Lakeway that need to be protected? Work with local conservation organizations to identify the parcels and analyze the resources needed to protect those parcels. Compare that analysis with the vision of the City of Austin (Smart Growth Initiative) and Envision Central Texas. References Citation Datum: NAD 83 Projection: NAD 1983 State Plane Texas Central FIPS 4203 (feet) 1. Travis County [vector digital data]. Unknown. Austin, TX: CAPCOG. Available: [October,2007]. 2. Census Block (Travis County 453) [vector digital data]. U.S. Census Bureau Geography Division, Available: [November, 2007]. 3. U.S. Census Bureau, TIGER/Line files, 2002 Technical. Travis County Census Block. 4. Travis City Limits [vector digital data]. Available: [October,2007]. 5. Transportation x453_v2 [vector digital data]. Austin, TX: Texas Natural Resources Information System, Available: [November, 2007]. 6. Hydrography [vector digital data]. ASI, Available: [October,2007]. 7. Vacant land use inventory [vector digital data]. Available: [December, 2007]. 8. Land Use 2003 [vector digital data]. Austin, TX: City of Austin, Available: ftp://coageoid01.ci.austin.tx.us/gis-data/regional/coa_gis.html [November, 2007]. 9
10 9. Travis County Parcels (geodatabase) [vector digital data]. CAPCOG, Available: [December, 2007]. 10. Parcel-C (parcel addresses) [Excel document]. Lakeway, TX: City of Lakeway, Lakeway Shapes (parcel ID/geo ID) [shapefile]. Lakeway Consultant,
11 Appendix Map 1 Location Map Map 2 Population Map Map 3 Road Network Map Map 4 - Improved Value Map Map 5 - Vacant Land & Use Map Map 6 - Vacant Parcel Values Map Map 7 - Undeveloped Parcels Map Land Use Code Definitions Description of Map Procedures 11

12 L o c a t i o n Miles T r a v i s C o u n t y IH35 Lake Travis CITY OF AUSTIN Travis County Census Blocks Travis County Study Area S t u d y A r e a Lakes and Streams Roads Study Area Cities CITY CITY OF BEE CAVE CITY OF LAKEWAY VILLAGE OF POINT VENTURE VILLAGE OF THE HILLS Sources: 1. Travis County [vector digital data]. Unknown. Austin, TX: CAPCOG. Available: Information_Clearinghouse/geospatial_main.asp [October,2007]. 2. Census Block (Travis County 453) [vector digital data]. U.S. Census Bureau Geography Division, Available: Name=Travis [November, 2007]. 3. Travis City Limits [vector digital data]. Available: geospatial_main.asp [October,2007] Miles 4. Transportation x453_v2 [vector digital data]. Austin, TX: Texas Natural Resources Information System, Available: datadownload/county.jsp?name=travis [November, 2007]. 5. Hydrography [vector digital data]. ASI, Available: Information_Clearinghouse/geospatial_main.asp [October,2007]. Troy Larsen December 14, 2007 Fall Intro to GIS - Final Project Datum: NAD 83 Projection: NAD 1983 State Plane Texas Central FIPS 4203 (feet) $


![org/ Information_Clearinghouse/geospatial_main.asp [October,2007]. 2.](/docs-images/75/72416363/images/13-3.jpg "Census Block (Travis County 453) [vector digital data]. 4. Transportation x453_v2 [vector digital data].")

![Name=Travis [November, 2007]. 5. Hydrography [vector digital data]. ASI, 1997. 3.](/docs-images/75/72416363/images/13-5.jpg "Travis City Limits [vector digital data]. Available: http://www.capcog.")
![org/information_clearinghouse/ Available: http://www.capcog.org/ geospatial_main.asp [October,2007].](/docs-images/75/72416363/images/13-6.jpg "Information_Clearinghouse/geospatial_main.asp [October,2007]. $ 0 0.25 0.5 1 1.5 2 2.")
13 P o p u l a t i o n Miles T r a v i s C o u n t y Major & Study Area Cities CITY CITY OF AUSTIN CITY OF BEE CAVE CITY OF LAKEWAY VILLAGE OF THE HILLS Roads Lakes & Streams Travis County Sources: L a k e w a y 2000 Census Blocks Population Travis County [vector digital data]. Unknown. Austin, TX: CAPCOG. Available: Information_Clearinghouse/geospatial_main.asp [October,2007]. 2. Census Block (Travis County 453) [vector digital data]. 4. Transportation x453_v2 [vector digital data]. Austin, TX: Texas Natural Resources Information System, Available: U.S. Census Bureau Geography Division, Available: datadownload/county.jsp?name=travis [November, 2007]. Name=Travis [November, 2007]. 5. Hydrography [vector digital data]. ASI, Travis City Limits [vector digital data]. Available: Available: geospatial_main.asp [October,2007]. Information_Clearinghouse/geospatial_main.asp [October,2007]. $ Miles Troy Larsen December 14, 2007 Fall Intro to GIS - Final Project Datum: NAD 83 Projection: NAD 1983 State Plane Texas Central FIPS 4203 (feet)
14 R o a d N e t w o r k Travis County Cities Other Cities Major & Study Area Cities CITY OF AUSTIN CITY OF BEE CAVE CITY OF LAKEWAY VILLAGE OF THE HILLS Travis Conty Lakes & Streams Miles Venture T r a v i s C o u n t y Ci t y o f L a ke w a y Sources: Minor Roads Major Roads NAME & FM 2222 FM 2244 FM 620 Highway RR 620 I 35 I H 35 Southwest State Hwy 1 State Hwy 71 US Hwy 183 US Hwy 290 State Hwy 71 Champion Lakeway 2. Hydrography [vector digital data]. ASI, Transportation x453_v2 [vector digital data]. Available: Austin, TX: Texas Natural Resources Information Information_Clearinghouse/geospatial_main.asp [October,2007]. System, Available: 3. Travis County [vector digital data]. Unknown. Austin, TX: CAPCOG. Available: datadownload/county.jsp?name=travis [November, 2007]. Information_Clearinghouse/geospatial_main.asp [October,2007]. 4. Travis City Limits [vector digital data]. Available: geospatial_main.asp [October,2007]. Lohmans Crossing FM 620 Lakeway Miles Troy Larsen December 14, 2007 Fall Intro to GIS - Final Project Datum: NAD 83 Projection: NAD 1983 State Plane Texas Central FIPS 4203 (feet) $
15


![Travis County [vector digital data]. Unknown. Austin, TX: CAPCOG. Available: http://www.capcog.](/docs-images/75/72416363/images/16-3.jpg "org/ Information_Clearinghouse/geospatial_main.asp [October,2007]. 2.")
![Vacant land use inventory [vector digital data]. Available:http://www.capcog.](/docs-images/75/72416363/images/16-4.jpg "org/Information_Clearinghouse/ geospatial_main.asp [December, 2007]. 3. Travis City Limits [vector digital data].")
![Available: http://www.capcog.org/information_clearinghouse/ geospatial_main.asp [October,2007]. 4.](/docs-images/75/72416363/images/16-5.jpg "Land Use 2003 [vector digital data]. Austin, TX: City of Austin, 2003. Available: ftp://coageoid01.ci.austin.tx.")
![us/gis-data/ Regional/ coa_gis.html [November, 2007].](/docs-images/75/72416363/images/16-6.jpg "Porpoise Corsaire Lohmans Lohmans Crossing Cross 0 200 400 800 1,200 1,600 Feet 5.")
![Transportation x453_v2 [vector digital data]. Austin, TX: Texas Natural Resources Information System, 2006.](/docs-images/75/72416363/images/16-7.jpg "Available:http://www.tnris.state.tx.us/ *See Table for Land Use Code definitions datadownload/county.jsp?")
![name=travis [November, 2007]. 6. Hydrography [vector digital data]. ASI, 1997. Available: http://www.capcog.](/docs-images/75/72416363/images/16-8.jpg "org/ Information_Clearinghouse/geospatial_main.asp [October,2007]. 7.")
16 Lakeway Vacant Land & Use V a c a n t P a r c e l s a n d Z o n i n g Vacant Lots Addl. Vacant Lots City of Lakeway Travis County Galaxy Sailors Sunfish Deerfield Miles Sources: Roads Land Use LU2003 * Vacant Lots Travis County Biscayne Lido Lido Vanguard New Lido 1. Travis County [vector digital data]. Unknown. Austin, TX: CAPCOG. Available: Information_Clearinghouse/geospatial_main.asp [October,2007]. 2. Vacant land use inventory [vector digital data]. Available: geospatial_main.asp [December, 2007]. 3. Travis City Limits [vector digital data]. Available: geospatial_main.asp [October,2007]. 4. Land Use 2003 [vector digital data]. Austin, TX: City of Austin, Available: ftp://coageoid01.ci.austin.tx.us/gis-data/ Regional/ coa_gis.html [November, 2007]. Porpoise Corsaire Lohmans Lohmans Crossing Cross ,200 1,600 Feet 5. Transportation x453_v2 [vector digital data]. Austin, TX: Texas Natural Resources Information System, Available: *See Table for Land Use Code definitions datadownload/county.jsp?name=travis [November, 2007]. 6. Hydrography [vector digital data]. ASI, Available: Information_Clearinghouse/geospatial_main.asp [October,2007]. 7. Travis County Parcels (geodatabase) [vector digital data]. CAPCOG, Available: Information_Clearinghouse/ geospatial_main.asp [December, 2007]. Troy Larsen December 14, 2007 Fall Intro to GIS - Final Project Datum: NAD 83 Projection: NAD 1983 State Plane Texas Central FIPS 4203 (feet) $
17 Vacant Parcel Values L a n d V a l u e p e r A c r e VP2003Union Vacant Land Value / Acreage 0-40,000 50, , , , , ,000-1,000,000 Lot Lines City of Lakeway Travis County Miles Sources: 1. Travis County [vector digital data]. Unknown. Austin, TX: CAPCOG. Available: Information_Clearinghouse/geospatial_main.asp [October,2007]. 2. Travis City Limits [vector digital data]. Available: geospatial_main.asp [October,2007]. 3. Vacant land use inventory [vector digital data]. Available: house/geospatial_main.asp [December, 2007]. 4. Land Use 2003 [vector digital data]. Austin, TX: City of Austin, Available: ftp://coageoid01.ci.austin.tx.us/ GIS-Data/Regional/coa_gis.html [November, 2007]. 5. Travis County Parcels (geodatabase) [vector digital data]. CAPCOG, Available: Information_Clearinghouse/geospatial_main.asp [December, 2007]. $ Troy Larsen December 14, 2007 Fall Intro to GIS - Final Project Datum: NAD 83 Projection: NAD 1983 State Plane Texas Central FIPS 4203 (feet)
18
19 2003 Land Use Codes Detailed Code General Code Use Single Family Mobile Homes Duplexes Large-lot Single Family Three/Fourplex Apartment/Condo Group Quarters Retirement Housing Commercial Office Manufacturing Warehousing Miscellaneous Industrial Resource Extraction (Mining) Landfills Semi-institutional Housing Hospital Government Services Educational Meeting and Assembly Cemetery Cultural Services Parks/Greenbelts Golf Courses Camp Grounds Preserves Railroad Facilities Transportation Facilities Aviation Facilities Marinas Parking Streets and Roads Utilities Undeveloped Agricultural Water Unknown Appendix A12/14/2007
20 Location Map Used ArcCatalog to reproject (Geographic coordinates NAD83) Census Block Layer to NAD 1983 State Plane Texas Central FIPS 4203 (feet). Counties layer metadata matches the Census Block Layer. Reprojected Transportation layer to NAD 1983 State Plane Texas Central FIPS 4203 (feet). Add Counties, Census Block, and Transportation layer from [Created folder] o Selected and created Travis County only shapefile from Counties layer o Add Census Block Demographics to attributes of Census Block layer Add Hydrography layer (already projected) Add Travis County City Limits layer (already projected) Create map layout showing the City of Lakeway population and inset view of Travis County population. Used extent rectangle on inset map to show location of study area. o Created separate IH35 layer from roads layer o Include all necessary map elements and sources o Created two legends based on maps with different symbology Road Network Map Add Travis County layer Add City Limits layer o Clip to Travis County Add Transportation layer o Clip to Travis County o Select by attribute: "FCC" = 'A15' OR "FCC" = 'A35' OR "FCC" = 'A25' OR "FCC" = 'A31' OR "FCC" = 'A21' for major roads selection Add Hydrography layer o Clip to Travis County Create map with three layouts showing the major and minor roads near the City of Lakeway o Include all necessary map elements and sources Land Use / Property Ownership / Protected Areas (Vacant Land and Use Map) Add Travis County layer Add Hydro layer Add City Limits layer o Clip to Travis County o Created City of Lakeway shapefile Add Vacant Land Inventory layer (existing projection) o Clip to Travis County o Clip to City of Lakeway 20
21 Select by attributes (and reverse selection to get vacant land that s probably not dedicated park or open space): "Improv_Val" = 0 AND "Pct_Improv" = 0 AND "Ag_Land" = 'No' o VLI Clip Selection Add Land Use 2003 layer o Added layer first then link to shapefile o To large to clip to Travis County, so clipped to City of Lakeway o Symbolized land uses according to City of Austin categories o Select by attributes - "LU2003" = 630 OR "LU2003" = 640 OR "LU2003" = 710 OR "LU2003" = 720 OR "LU2003" = 750 OR "LU2003" = 830 OR "LU2003" = 860 OR "LU2003" = 870 OR "LU2003" = 940 to create selection Subtract (Erase) from Travis Pcls Clip Selection o Select by attribute - "LU2003" = 900 o Land use2003 Clip Selection 2 created Union with Travis Parcels Clip Erase Add Travis County Parcels layer o Symbolize: add only two categories 0-20,00 value and all other o Clip to City of Lakeway Symbolize: add only two categories lowest value and others Select by attributes "Improv_Val" = 0 OR "Improv_Val" = 1 OR "Improv_Val" = 2 to create selection o Travis Pcls Clip Selection Land Use2003 clip selection subtracted from this o Travis Parcels Clip Erase shapefile created Union with Land use2003 Clip Selection 2 Add Transportation layer o Clip to Travis County o Label roads in lot level only Created Union2003 layer that should be the most accurate at indicating the location of vacant parcels. o Show two displays the whole of Lakeway and zoomed-in to lot level o Symbolize by vacant lots and land use o Include all necessary map elements and sources Parcel Map (Improved Value Map) The purpose of this map is to show parcels that are potentially undeveloped by using assessed value information (improved value). If improved value is 0 or close to 0 then the property is most likely undeveloped. Contacted TCAD to retrieve City of Lakeway assessed value information. After a struggle with the TCAD (Microsoft Access [text files]), I was finally able to open the information with a Macro. There is a roadblock in 21
22 that the file that contains the improved value only has Property ID as an identifier (the text file contains Parcel ID) where as the shape files attributes contain Geo_IDs. This would have presented an additional complication due to the issue of trying to combine tables with no common attributes. However, all of this frustration is not necessary as I was finally able to figure out that the CAPCOG Travis 2005 Parcel Geodatabase, which was not downloading well, contains parcel information and an attribute column for improved value. Add Travis County layer Add Hydrography layer Add City Limits layer o Sybolize according to major cities and other Add Travis Parcel layer downloaded from CAPCOG o Symbolized according to Improved Value two categories, 0 and all other values showing the potential vacant parcels o Show two displays entire Travis County and the City of Lakeway o Include all necessary map elements and sources Vacant Parcel Values Map Add Travis County layer Add City of Lakeway layer Add Travis Parcel Clip shapefile created from Vacant Map Add Vacant Parcel 2003 shapefile created from Vacant Map Display two frames whole Lakeway and part of Lakeway o Symbolize Vacant Parcels according to Land Value normalized by Acreage Undeveloped Parcel (Address) Map Add Travis County layer Add Transportation layer Add Address Excel file from the City of Lakeway o Join to Parcel attribute table Add Travis Parcel Clip shapefile created from Vacant Map Add Parcels layer from consultant Display two frames Lakeway intersection and specific parcels o o Label property numbers and roads Insert aerial photo to indicate vacant parcels Create map layout showing the lots that are vacant o Add labels to aerial photo to close in display to indicate vacant parcels o Include all necessary map elements and sources Population Map 22
23 Used ArcCatalog to reproject (Geographic coordinates NAD83) Census Block Layer to NAD 1983 State Plane Texas Central FIPS 4203 (feet). Counties layer metadata matches the Census Block Layer. Reprojected Transportation layer to NAD 1983 State Plane Texas Central FIPS 4203 (feet). Add Counties, Census Block, and Transportation layer from [Created folder] o Selected and created Travis County only shapefile from Counties layer o Add Census Block Demographics to attributes of Census Block layer Add Hydrography layer (already projected) Add Travis County City Limits layer (already projected) Create map layout showing the City of Lakeway population and inset view of Travis County population. Used extent rectangle on inset map to show location of study area. Symbolized by number of people per census block o Include all necessary map elements and sources o Created two legends based on maps with different symbology 23
Analysis of Change in Land Use around Future Core Transit Corridors: Austin, TX, Eric Porter May 3, 2012
 Analysis of Change in Land Use around Future Core Transit Corridors: Austin, TX, 1990-2006 PROBLEM DEFINITION Eric Porter May 3, 2012 This study examines the change in land use from 1990 to 2006 in the
Urbanization factors in the Gilleland Creek watershed, Travis County, Texas. Michael Kanarek GEO386G Final Project Dec. 2, 2011
 Urbanization factors in the Gilleland Creek watershed, Travis County, Texas Michael Kanarek GEO386G Final Project Dec. 2, 2011 1 Introduction The watershed of Gilleland Creek, which flows through eastern
Neighborhood Locations and Amenities
 University of Maryland School of Architecture, Planning and Preservation Fall, 2014 Neighborhood Locations and Amenities Authors: Cole Greene Jacob Johnson Maha Tariq Under the Supervision of: Dr. Chao
presents challenges related to utility infrastructure planning. Many of these challenges
 1 Introduction: - a. Purpose According to U.S. Census Bureau the population of stark county was 367,585 in 1990, and in 2000 it was increase to 378,098. Thus County is experiencing a growth that presents
Proximity of Development to Balcones Canyonlands Preserves Travis County, Texas
 Travis County, Texas University of Texas at Austin Community and Regional Planning December 15, 2008 I. EXECUTIVE SUMMARY Over the past twenty years, the City of Austin, Texas has undergone an ambitious
Huron Creek Watershed 2005 Land Use Map
 Huron Creek Watershed 2005 Land Use Map Created By: Linda Kersten, 12/20/06 Created For: MTU Introduction to GIS Class (FW 5550) The Huron Creek Watershed Advisory Committee Michigan Technological University,
Creating a Pavement Management System Using GIS
 Christopher Castruita PPD 631 Prof. Barry Waite & Prof. Bonnie Shrewsbury Creating a Pavement Management System Using GIS Problem Definition As is the case with many cities, the city of La Cañada Flintridge
Acknowledgments xiii Preface xv. GIS Tutorial 1 Introducing GIS and health applications 1. What is GIS? 2
 Acknowledgments xiii Preface xv GIS Tutorial 1 Introducing GIS and health applications 1 What is GIS? 2 Spatial data 2 Digital map infrastructure 4 Unique capabilities of GIS 5 Installing ArcView and the
Spatial Analysis using Vector GIS THE GOAL: PREPARATION:
 PLAN 512 GIS FOR PLANNERS Department of Urban and Environmental Planning University of Virginia Fall 2006 Prof. David L. Phillips Spatial Analysis using Vector GIS THE GOAL: This tutorial explores some
Write a report (6-7 pages, double space) on some examples of Internet Applications. You can choose only ONE of the following application areas:
 on some examples of Internet Applications. You can choose only ONE of the following application areas:") UPR 6905 Internet GIS Homework 1 Yong Hong Guo September 9, 2008 Write a report (6-7 pages, double space) on some examples of Internet Applications. You can choose only ONE of the following application
UPR 6905 Internet GIS Homework 1 Yong Hong Guo September 9, 2008 Write a report (6-7 pages, double space) on some examples of Internet Applications. You can choose only ONE of the following application
GEOGRAPHIC INFORMATION SYSTEMS
 GEOGRAPHIC INFORMATION SYSTEMS 4-H Round-Up Community Transitions Workshop Daniel Hanselka June 14, 2011 Goals of the Workshop Answer the question: What is GIS? Uses of GIS. Some of the Common Terminology
Appendixx C Travel Demand Model Development and Forecasting Lubbock Outer Route Study June 2014
 Appendix C Travel Demand Model Development and Forecasting Lubbock Outer Route Study June 2014 CONTENTS List of Figures-... 3 List of Tables... 4 Introduction... 1 Application of the Lubbock Travel Demand
GIS Needs Assessment. for. The City of East Lansing
 GIS Needs Assessment for The City of East Lansing Prepared by: Jessica Moy and Richard Groop Center for Remote Sensing and GIS, Michigan State University February 24, 2000 Executive Summary At the request
Geodatabase for Sustainable Urban Development. Presented By Rhonda Maronn Maurice Johns Daniel Ashney Jack Anliker
 Geodatabase for Sustainable Urban Development Presented By Rhonda Maronn Maurice Johns Daniel Ashney Jack Anliker Objective Build a Geodatabase that will enable urban planners to create and assess the
Chapter 6. Fundamentals of GIS-Based Data Analysis for Decision Support. Table 6.1. Spatial Data Transformations by Geospatial Data Types
 Chapter 6 Fundamentals of GIS-Based Data Analysis for Decision Support FROM: Points Lines Polygons Fields Table 6.1. Spatial Data Transformations by Geospatial Data Types TO: Points Lines Polygons Fields
Public Transportation Infrastructure Study (PTIS) - 2 nd Technical Advisory Committee Meeting
 - 2 nd Technical Advisory Committee Meeting") Public Transportation Infrastructure Study (PTIS) - 2 nd Technical Advisory Committee Meeting Presentation to: Technical Advisory Committee (TAC) Presented by: and Team July 8th, 2009 Public Transportation
Public Transportation Infrastructure Study (PTIS) - 2 nd Technical Advisory Committee Meeting Presentation to: Technical Advisory Committee (TAC) Presented by: and Team July 8th, 2009 Public Transportation
Spatial Organization of Data and Data Extraction from Maptitude
 Spatial Organization of Data and Data Extraction from Maptitude N. P. Taliceo Geospatial Information Sciences The University of Texas at Dallas UT Dallas GIS Workshop Richardson, TX March 30 31, 2018 1/
Vector Analysis: Farm Land Suitability Analysis in Groton, MA
 Vector Analysis: Farm Land Suitability Analysis in Groton, MA Written by Adrienne Goldsberry, revised by Carolyn Talmadge 10/9/2018 Introduction In this assignment, you will help to identify potentially
In this exercise we will learn how to use the analysis tools in ArcGIS with vector and raster data to further examine potential building sites.
 GIS Level 2 In the Introduction to GIS workshop we filtered data and visually examined it to determine where to potentially build a new mixed use facility. In order to get a low interest loan, the building
Planning for Sea Level Rise in the Matanzas Basin
 Planning for Sea Level Rise in the Matanzas Basin Appendix E: Matanzas Future Development Scenarios June, 2015 Prepared by: Dr. Paul Zwick University of Florida Department of Urban and Regional Planning
Final Group Project Paper. Where Should I Move: The Big Apple or The Lone Star State
 Final Group Project Paper Where Should I Move: The Big Apple or The Lone Star State By: Nathan Binder, Shannon Scolforo, Kristina Conste, Madison Quinones Main Goal: Determine whether New York or Texas
Presented by: Bryan Bloch GIS Specialist DNREC Division of Watershed Stewardship
 Presented by: Bryan Bloch GIS Specialist DNREC Division of Watershed Stewardship Bryan Hall, AICP Sussex County Circuit Rider Planner, Office of State Planning Coordination, OMB November 19, 2012 UD Sustainable
GIS Level 2. MIT GIS Services
 GIS Level 2 MIT GIS Services http://libraries.mit.edu/gis Email: gishelp@mit.edu TOOLS IN THIS WORKSHOP - Definition Queries - Create a new field in the attribute table - Field Calculator - Add XY Data
GIS ADMINISTRATOR / WEB DEVELOPER EVANSVILLE-VANDERBURGH COUNTY AREA PLAN COMMISSION
 GIS ADMINISTRATOR / WEB DEVELOPER EVANSVILLE-VANDERBURGH COUNTY AREA PLAN COMMISSION SALARY RANGE INITIATION $43,277 SIX MONTHS $45,367 POSITION GRADE PAT VI The Evansville-Vanderburgh County Area Plan
The Dance Hall Goes in What School District?
 The Dance Hall Goes in What School District? Vern C. Svatos Jarrod S. Doucette Abstract This paper presents the results of a GIS mapping effort created for the Delaware State Department of Education using
TRAVEL DEMAND MODEL. Chapter 6
 Chapter 6 TRAVEL DEMAND MODEL As a component of the Teller County Transportation Plan development, a computerized travel demand model was developed. The model was utilized for development of the Transportation
A Method for Mapping Settlement Area Boundaries in the Greater Golden Horseshoe
 A Method for Mapping Settlement Area Boundaries in the Greater Golden Horseshoe Purpose This paper describes a method for mapping and measuring the lands designated for growth and urban expansion in the
DATA GATHERING AND PREPARATION
 SpaceX Texas: A By Karen Chohrach for ACC GISC 2420, Professor Sean Moran, August 1, 2016 EXECUTIVE SUMMARY SpaceX is a leader in the privatization of space. Where will they launch their next generation
Modeling Urban Sprawl: from Raw TIGER Data with GIS
 Modeling Urban Sprawl: from Raw TIGER Data with GIS Brady Foust University of Wisconsin-Eau Claire Lisa Theo University of Wisconsin-Stevens Point Modeling Urban Sprawl 1 Problem How to model & predict
GIS Final Project Determining Regions of Anthropogenic Recharge
 Michael Passarello 04/06/10 GIS Final Project Determining Regions of Anthropogenic Recharge Objective A grid for the recharge zone of the Barton Springs segment of the Edwards Aquifer within the city limits
GIS Lecture 5: Spatial Data
 GIS Lecture 5: Spatial Data GIS 1 Outline Vector Data Formats Raster Data Formats Map Projections Coordinate Systems US Census geographic files US Census data files GIS Data Sources GIS 2 Vector Data Formats
APPENDIX I: Traffic Forecasting Model and Assumptions
 APPENDIX I: Traffic Forecasting Model and Assumptions Appendix I reports on the assumptions and traffic model specifications that were developed to support the Reaffirmation of the 2040 Long Range Plan.
Geographic Systems and Analysis
 Geographic Systems and Analysis New York University Robert F. Wagner Graduate School of Public Service Instructor Stephanie Rosoff Contact: stephanie.rosoff@nyu.edu Office hours: Mondays by appointment
ENV208/ENV508 Applied GIS. Week 1: What is GIS?
 ENV208/ENV508 Applied GIS Week 1: What is GIS? 1 WHAT IS GIS? A GIS integrates hardware, software, and data for capturing, managing, analyzing, and displaying all forms of geographically referenced information.
ZONING DISTRICT REGULATIONS. Table 4-2 Permitted Uses by Zoning Districts Use Types AG RR R-1 R-2 R-3 MH LC CC DC GC LI GI P Addl Reg
 ZONING DITRICT REGULATION Table 4-2 Permitted Uses by Zoning Districts Agricultural Uses Horticulture P P P P P P P P P 39.06.002a Crop Production P P P 39.06.002a Type I Animal Production Type II Animal
Teaching GIS for Land Surveying
 Teaching GIS for Land Surveying Zhanjing (John) Yu Evergreen Valley College, San Jose, California James Crossfield California State University at Fresno, Fresno California 7/13/2006 1 Outline of the Presentation
A Comprehensive Inventory of the Number of Modified Stream Channels in the State of Minnesota. Data, Information and Knowledge Management.
 A Comprehensive Inventory of the Number of Modified Stream Channels in the State of Minnesota Data, Information and Knowledge Management Glenn Skuta Environmental Analysis and Outcomes Division Minnesota
Exercise on Using Census Data UCSB, July 2006
 Exercise on Using Census Data UCSB, July 2006 Purpose The purpose of this lab is to become familiar with Census Bureau data. Second, we will learn how to join tables which allows you to add data to the
Technical Memorandum #2 Future Conditions
 Technical Memorandum #2 Future Conditions To: Dan Farnsworth Transportation Planner Fargo-Moorhead Metro Council of Governments From: Rick Gunderson, PE Josh Hinds PE, PTOE Houston Engineering, Inc. Subject:
Chapter 1 Overview of Maps
 Chapter 1 Overview of Maps In this chapter you will learn about: Key points when working with maps General types of maps Incident specific maps Map legend and symbols Map sources A map is a navigational
Introduction. Project Summary In 2014 multiple local Otsego county agencies, Otsego County Soil and Water
 Introduction Project Summary In 2014 multiple local Otsego county agencies, Otsego County Soil and Water Conservation District (SWCD), the Otsego County Planning Department (OPD), and the Otsego County
Working with Census 2000 Data from MassGIS
 Tufts University GIS Tutorial Working with Census 2000 Data from MassGIS Revised September 26, 2007 Overview In this tutorial, you will use pre-processed census data from Massachusetts to create maps of
High Speed / Commuter Rail Suitability Analysis For Central And Southern Arizona
 High Speed / Commuter Rail Suitability Analysis For Central And Southern Arizona Item Type Reports (Electronic) Authors Deveney, Matthew R. Publisher The University of Arizona. Rights Copyright is held
WlLPEN L. GORR KRISTEN S. KURLAND. Universitats- und Landesbibliothek. Bibliothek Architektur und Stadtebau ESRI
 hj WlLPEN L. GORR KRISTEN S. KURLAND Universitats- und Landesbibliothek Darmstadt Bibliothek Architektur und Stadtebau ESRI Contents Acknowledgments Preface xvii XV GIS Tutorial 1 Introduction Launch ArcMap
Summary Description Municipality of Anchorage. Anchorage Coastal Resource Atlas Project
 Summary Description Municipality of Anchorage Anchorage Coastal Resource Atlas Project By: Thede Tobish, MOA Planner; and Charlie Barnwell, MOA GIS Manager Introduction Local governments often struggle
Pierce Cedar Creek Institute GIS Development Final Report. Grand Valley State University
 Pierce Cedar Creek Institute GIS Development Final Report Grand Valley State University Major Goals of Project The two primary goals of the project were to provide Matt VanPortfliet, GVSU student, the
Introduction. Purpose
 Introduction The Edwards Aquifer is a karst aquifer in Central Texas whose hydrogeological properties are not fully understood. This is due to exaggerated heterogeneity of properties, high anisotropy due
Delineation of Watersheds
 Delineation of Watersheds Adirondack Park, New York by Introduction Problem Watershed boundaries are increasingly being used in land and water management, separating the direction of water flow such that
Sea Level Rise Data. Southwest Florida Regional Planning Council 1926 Victoria Ave. Fort Myers, Florida (239)
") Southwest Florida Regional Planning Council 1926 Victoria Ave. Fort Myers, Florida 33901 (239) 338-2550 http://www.swfrpc.org 6/20/07 Tim Walker GIS Coordinator email: twalker@swfrpc.org Southwest Sealevel
Southwest Florida Regional Planning Council 1926 Victoria Ave. Fort Myers, Florida 33901 (239) 338-2550 http://www.swfrpc.org 6/20/07 Tim Walker GIS Coordinator email: twalker@swfrpc.org Southwest Sealevel
Sensitivity of estimates of travel distance and travel time to street network data quality
 Sensitivity of estimates of travel distance and travel time to street network data quality Paul Zandbergen Department of Geography University of New Mexico Outline Street network quality Approaches to
Analyzing Suitability of Land for Affordable Housing
 Analyzing Suitability of Land for Affordable Housing Vern C. Svatos Jarrod S. Doucette Abstract: This paper explains the use of a geographic information system (GIS) to distinguish areas that might have
INTRODUCTION TO GEOGRAPHIC INFORMATION SYSTEM By Reshma H. Patil
 INTRODUCTION TO GEOGRAPHIC INFORMATION SYSTEM By Reshma H. Patil ABSTRACT:- The geographical information system (GIS) is Computer system for capturing, storing, querying analyzing, and displaying geospatial
GIS in Community & Regional Planning
 GIS in Community & Regional Planning The The role role of of GIS GIS in in Re-writing the the Zoning Bylaw for for the the City City of of Vernon LandInfo Technologies Presentation Overview The GIS Initiative
Final Report. James Thomas. Chris Faulkner. Manager. Assistant Manager/Web Designer
 Final Report James Thomas Manager Chris Faulkner Assistant Manager/Web Designer Paul Kaiser Jordan Stanley Logan Weller-Alexander Analysts GIS Development and Implementation Woodcreek, Texas. Prepared
Utilizing Data from American FactFinder with TIGER/Line Shapefiles in ArcGIS
 Utilizing Data from American FactFinder with TIGER/Line Shapefiles in ArcGIS Web Adams, GISP Data Dissemination Specialist U.S. Census Bureau New York Regional Office 1 What We Do Decennial Census Every
Utilizing GIS Technology for Rockland County. Rockland County Planning Department Douglas Schuetz & Scott Lounsbury
 Utilizing GIS Technology for Rockland County Rockland County Planning Department Douglas Schuetz & Scott Lounsbury Presentation Agenda Introduction What is GIS What can GIS do GIS Efforts for BOE Resources
Application of GIS in Public Transportation Case-study: Almada, Portugal
 Case-study: Almada, Portugal Doutor Jorge Ferreira 1 FSCH/UNL Av Berna 26 C 1069-061 Lisboa, Portugal +351 21 7908300 jr.ferreira@fcsh.unl.pt 2 FSCH/UNL Dra. FCSH/UNL +351 914693843, leite.ines@gmail.com
BROOKINGS May
 Appendix 1. Technical Methodology This study combines detailed data on transit systems, demographics, and employment to determine the accessibility of jobs via transit within and across the country s 100
PIBC Annual Conference, 2016
 Land Use Quantified PIBC Annual Conference, 2016 A collaboration between: Christy & Associated Planning Consultants The Sustainable Transportation Partnership of the Central Okanagan Hazel Christy Rafael
PALS: Neighborhood Identification, City of Frederick, Maryland. David Boston Razia Choudhry Chris Davis Under the supervision of Chao Liu
 PALS: Neighborhood Identification, City of Frederick, Maryland David Boston Razia Choudhry Chris Davis Under the supervision of Chao Liu University of Maryland School of Architecture, Planning & Preservation
GIS Lecture 4: Data. GIS Tutorial, Third Edition GIS 1
 GIS Lecture 4: Data GIS 1 Outline Data Types, Tables, and Formats Geodatabase Tabular Joins Spatial Joins Field Calculator ArcCatalog Functions GIS 2 Data Types, Tables, Formats GIS 3 Directly Loadable
NR402 GIS Applications in Natural Resources
 NR402 GIS Applications in Natural Resources Lesson 1 Introduction to GIS Eva Strand, University of Idaho Map of the Pacific Northwest from http://www.or.blm.gov/gis/ Welcome to NR402 GIS Applications in
Mapping Accessibility Over Time
 Journal of Maps, 2006, 76-87 Mapping Accessibility Over Time AHMED EL-GENEIDY and DAVID LEVINSON University of Minnesota, 500 Pillsbury Drive S.E., Minneapolis, MN 55455, USA; geneidy@umn.edu (Received
MAPS AND THEIR CLASSIFICATION
 MAPPING MAPS AND THEIR CLASSIFICATION WHAT IS A MAP? A map is representation of the Earth's surface, showing how things are related to each other by distance, direction, and size. Maps are a way of showing
Lecture 9: Reference Maps & Aerial Photography
 Lecture 9: Reference Maps & Aerial Photography I. Overview of Reference and Topographic Maps There are two basic types of maps? Reference Maps - General purpose maps & Thematic Maps - maps made for a specific
Syllabus Reminders. Geographic Information Systems. Components of GIS. Lecture 1 Outline. Lecture 1 Introduction to Geographic Information Systems
 Syllabus Reminders Geographic Information s Lecture Introduction to Geographic Information s. Class Info: www.saigis.com/class/ 2. Office T / TH (8:00-9:30 a.m.) and (2:30 3:30pm) or Appt 3. Email: burgerpr@unk.edu
ArcGIS Pro: Essential Workflows STUDENT EDITION
 ArcGIS Pro: Essential Workflows STUDENT EDITION Copyright 2018 Esri All rights reserved. Course version 6.0. Version release date August 2018. Printed in the United States of America. The information contained
Evaluating access to jobs via transit from disparate neighborhoods
 Evaluating access to jobs via transit from disparate neighborhoods Clifford Kaplan GIS for Water Resources 2014, Term Project Burnet Corridor Manor Corridor Burnet Corridor Legend CapMetro bus lines Manor
A Socioeconomic Analysis of the Spatial Distribution of Fire Hydrants. History of Portland Fire Hydrants
 A Socioeconomic Analysis of the Spatial Distribution of Fire Hydrants By Dylan Carmody Robert Chappell Jana Tracy Allan McMillian 2003 History of Portland Fire Hydrants The first fire hydrant was installed
Transportation Statistical Data Development Report OKALOOSA-WALTON OUTLOOK 2035 LONG RANGE TRANSPORTATION PLAN
 Transportation Statistical Data Development Report OKALOOSA-WALTON OUTLOOK 2035 LONG RANGE TRANSPORTATION PLAN Prepared for the Okaloosa-Walton Transportation Planning Organization and The Florida Department
Town of Taos Request for Proposal Historic Preservation GIS Geodatabase Project April 2007
 Town of Taos Request for Proposal Historic Preservation GIS Geodatabase Project April 2007 1. Background The Town of Taos is requesting proposals from qualified firms or a team of firms who can develop
Land Use and Zoning Page 1 of 10 LAND USE AND ZONING
 LAND USE AND ZONING Land Use and Zoning Page 1 of 10 BACKGROUND The Clifton-Fruitvale planning area is about 3,962 acres (6.2 sq. miles) with a population of 14,000 residents. The density of the area is
An online data and consulting resource of THE UNIVERSITY OF TOLEDO THE JACK FORD URBAN AFFAIRS CENTER
 An online data and consulting resource of THE JACK FORD URBAN AFFAIRS CENTER THE CENTER FOR GEOGRAPHIC INFORMATION SCIENCE AND APPLIED GEOGRAPHICS DEPARTMENT OF GEOGRAPHY AND PLANNING THE UNIVERSITY OF
Google Maps and Beyond
 Google Maps and Beyond Aaron Paul First American Title apaul@firstam.com 2015 APRA Symposium Association of Professional Reserve Analysts May 2 nd, 2015 Google Maps and Beyond - Overview Business case
Louisiana Transportation Engineering Conference. Monday, February 12, 2007
 Louisiana Transportation Engineering Conference Monday, February 12, 2007 Agenda Project Background Goal of EIS Why Use GIS? What is GIS? How used on this Project Other site selection tools I-69 Corridor
HORIZON 2030: Land Use & Transportation November 2005
 PROJECTS Land Use An important component of the Horizon transportation planning process involved reviewing the area s comprehensive land use plans to ensure consistency between them and the longrange transportation
MARYLAND S LAND USE/LAND COVER MAP AND ASSOCIATED ANALYSIS
 MARYLAND S LAND USE/LAND COVER MAP AND ASSOCIATED ANALYSIS Maryland Department of Planning Daniel Baldwin Stephanie Martins November 19, 2012 http://www.planning.maryland.gov/ PURPOSE The primary purpose
REQUEST FOR PROPOSALS CLOSING DATE:
 Request for Proposals 110 Westlake Drive City of West Lake Hills 110 Westlake Drive REQUEST FOR PROPOSALS CLOSING DATE: Tuesday, October 23, 2018 City of West Lake Hills Request for Proposals 1 I. INTRODUCTION
HEC & GIS Modeling of the Brushy Creek HEC & GIS Watershed Modeling of the
 HEC & GIS Modeling of the Brushy Creek HEC & GIS Watershed Modeling of the By Cassandra Fagan 5, December 2014 http://ubcwatershedstudy.ursokr.com/images/ Contents Introduction... 3 Figure 1: 24-hour rainfall
The Framework and Application of Geographic Information Systems (GIS)
") The Framework and Application of Geographic Information Systems (GIS) The Framework and Application of Geographic Information Systems (GIS) Part I The Geographic Framework The Geographic Framework Spatial
The Framework and Application of Geographic Information Systems (GIS) The Framework and Application of Geographic Information Systems (GIS) Part I The Geographic Framework The Geographic Framework Spatial
APPENDIX D FOLSOM HOLDING CAPACITY METHODOLOGY
 APPENDIX D FOLSOM HOLDING CAPACITY METHODOLOGY This page intentionally left blank. APPENDIX D FOLSOM HOLDING CAPACITY METHODOLOGY 1. INTRODUCTION This document provides a description of the assumptions
Exercise 2: Working with Vector Data in ArcGIS 9.3
 Exercise 2: Working with Vector Data in ArcGIS 9.3 There are several tools in ArcGIS 9.3 used for GIS operations on vector data. In this exercise we will use: Analysis Tools in ArcToolbox Overlay Analysis
John Laznik 273 Delaplane Ave Newark, DE (302)
") Office Address: John Laznik 273 Delaplane Ave Newark, DE 19711 (302) 831-0479 Center for Applied Demography and Survey Research College of Human Services, Education and Public Policy University of Delaware
Office Address: John Laznik 273 Delaplane Ave Newark, DE 19711 (302) 831-0479 Center for Applied Demography and Survey Research College of Human Services, Education and Public Policy University of Delaware
BUILDING AN ASSET MANAGEMENT GEODATABASE FOR RANCHING. Matt Crawford, GISP
 BUILDING AN ASSET MANAGEMENT GEODATABASE FOR RANCHING Matt Crawford, GISP Introduction East Foundation Formed in 2007 Mission Research Education Outreach Properties Six ranches ~ 215,000 acres San Antonio
Traffic Impact Study
 Traffic Impact Study Statham DRI One University Parkway Prepared for: Barrow County Prepared by: October 2012 Table of Contents Executive Summary i Section 1. Introduction 1 Project Description 1 Methodology
Tools for GASB34 Implementation GIS/GPS
 Tools for GASB34 Implementation GIS/GPS Geographic Technologies Group February, 2002 Curtis Hinton Goldsboro, NC Augusta, GA Raleigh, NC Boynton Beach, FL Houston, TX http://www.geotg.com 919-759 759-92149214
GIS Analysis of Crenshaw/LAX Line
 PDD 631 Geographic Information Systems for Public Policy, Planning & Development GIS Analysis of Crenshaw/LAX Line Biying Zhao 6679361256 Professor Barry Waite and Bonnie Shrewsbury May 12 th, 2015 Introduction
A New Approach to Estimating Population Growth Along a Major Arterial Highway.
 . ABSTRACT In the last twenty years Texas has undergone extensive growth as people move across the country and relocate in the Lone Star State. Many of these new Texans choose suburbs outside major cities
Geospatial Intelligence
 Geospatial Intelligence Geospatial analysis has existed as long as humans have made and studied maps but its importance to the intelligence community has skyrocketed in the past several years, with Unmanned
Different Displays of Thematic Maps:
 Different Displays of Thematic Maps: There are a number of different ways to display or classify thematic maps, including: Natural Breaks Equal Interval Quantile Standard Deviation What s important to
Location Suitability Analysis
 2010 Fall 406 Final Project Location Suitability Analysis New Burger stores in San Fernando Valley Presenter: Rich Lee I. Introduction In-N-Out Burger is famous in South West America. Established in 1948
Course overview. Grading and Evaluation. Final project. Where and When? Welcome to REM402 Applied Spatial Analysis in Natural Resources.
 Welcome to REM402 Applied Spatial Analysis in Natural Resources Eva Strand, University of Idaho Map of the Pacific Northwest from http://www.or.blm.gov/gis/ Where and When? Lectures Monday & Wednesday
Frequently Asked Questions about MnDOT s Railroad Map Conversion Project
 Frequently Asked Questions about MnDOT s Railroad Map Conversion Project What were the main objectives of the project? What are the results and end products? What can these railroad maps be used for? Who
Proposed Scope of Work Village of Farmingdale Downtown Farmingdale BOA Step 2 BOA Nomination Study / Draft Generic Environmental Impact Statement
 Proposed Scope of Work Village of Farmingdale Downtown Farmingdale BOA Step 2 BOA Nomination Study / Draft Generic Environmental Impact Statement The scope of work that follows incorporates and covers
Internet GIS Sites. 2 OakMapper webgis Application
 Internet GIS Sites # Name URL Description 1 City of Sugar Land http://www.sugarlandtx.gov/index.htm It is a city in Texas with 65,000 Residents. The City of Sugar Land, Texas, provides ArcIMS-based maps
A Street Named for a King
 A Street Named for a King Dr. Jerry Mitchell University of South Carolina OVERVIEW This lesson adapts the work of Dr. Derek Alderman, a geographer who has used the Martin Luther King, Jr. street-naming
GIS Geographical Information Systems. GIS Management
 GIS Geographical Information Systems GIS Management Difficulties on establishing a GIS Funding GIS Determining Project Standards Data Gathering Map Development Recruiting GIS Professionals Educating Staff
STATE GEOGRAPHIC INFORMATION DATABASE
 STATE GEOGRAPHIC INFORMATION DATABASE Data Information and Knowledge Management STATE GEOGRAPHIC INFORMATION DATABASE EXECUTIVE SUMMARY Utah has developed one of the most comprehensive statewide GIS resources
ZIP Code Tabulation Areas For Census 2000
 ZIP Code Tabulation Areas For Census 2000 NCHS, CDC Andrew Flora June 13, 2000 TIGER Operations Branch Geography Division U S C E N S U S B U R E A U Helping You Make Informed Decisions ZIP Code Tabulations
CHAPTER 4: INVENTORY & LEVEL OF SERVICE ANALYSIS
 CHAPTER 4: INVENTORY & LEVEL OF SERVICE ANALYSIS A. Introduction This section provides an overview and analysis of the parks, recreation, trails, and open space system in Cary, North Carolina. First, the