M. Grazia Pennino, Facundo Munoz, David Conesa, Antonio Lopez- Quilez, Jose Maria Bellido
|
|
|
- Hannah Ramsey
- 6 years ago
- Views:
Transcription
000- DOI: doi:./j.seares..0.00 Reference: SEARES To appear in: Journal of Sea Research Received date: December Revised date: March Accepted date: 1 March Please cite this article as: Pennino, M.")
1 Accepted Manuscript Modelling sensitive elasmobranch habitats M. Grazia Pennino, Facundo Munoz, David Conesa, Antonio Lopez- Quilez, Jose Maria Bellido PII: S-01()000- DOI: doi:./j.seares Reference: SEARES To appear in: Journal of Sea Research Received date: December Revised date: March Accepted date: 1 March Please cite this article as: Pennino, M. Grazia, Munoz, Facundo, Conesa, David, Lopez- Quilez, Antonio, Bellido, Jose Maria, Modelling sensitive elasmobranch habitats, Journal of Sea Research (), doi:./j.seares This is a PDF file of an unedited manuscript that has been accepted for publication. As a service to our customers we are providing this early version of the manuscript. The manuscript will undergo copyediting, typesetting, and review of the resulting proof before it is published in its final form. Please note that during the production process errors may be discovered which could affect the content, and all legal disclaimers that apply to the journal pertain.
2 Modelling sensitive elasmobranch habitats M. Grazia Pennino a, Facundo Muñoz b, David Conesa b, Antonio López-Quílez b, José María Bellido a,c a Instituto Español de Oceanografía. Centro Oceanográfico de Murcia, Murcia, Spain. C/ Varadero 1. San Pedro del Pinatar. 00. Murcia. Spain. b Departament d Estadística i Investigació Operativa. Universitat de València. C/ Dr. Moliner 0. Burjassot. 0. Valencia. Spain. c School of Biological Sciences, University of Aberdeen, Tillydrone Avenue, AB TZ Aberdeen, Scotland, UK. Abstract Basic information on the distribution and habitat preferences of ecologically important species is essential for their management and protection. In the Mediterranean Sea there is increasing concern over elasmobranch species because their biological (ecological) characteristics makes them highly vulnerable to fishing pressure. Their removal could affect the structure and function of marine ecosystems, inducing changes in trophic interactions at the community level due to the selective elimination of predators or prey species, competitors and species replacement. In this study Bayesian hierarchical spatial models are used to map the sensitive habitats of the three most caught elasmobranch species (Galeus melastomus, Scyliorhinus canicula, Etmopterus spinax) in the western Mediterranean Sea, based on fishery-dependent bottom trawl data. Results show that habitats associated with hard substrata and sandy beds, mainly in deep waters and with a high seabed gradient, have a greater probability registering the presence of the studied species than those associated with muddy shallow waters. Temperature and chlorophyll-a concentration show a negative relationship with Scyliorhinus canicula occurrence. Our results identify some of the sensitive habitats for elasmobranchs in the western Mediterranean Sea (GSA0 South), providing essential and easy-to-use interpretation tools, such as predictive distribution maps, with the final aim of improving management and conservation of these vulnerable species. Keywords: Bayesian hierarchical spatial model, elasmobranch habitat, Mediterranean Sea, species distribution modelling. Preprint submitted to Journal of Sea Research March,
3 Introduction There is increasing concern worldwide over elasmobranch species because their K-selection life-history traits make them susceptible to population depletion as a result of anthropogenic activity, including unsustainable fisheries, by-catch, and habitat modification []. Most elasmobranchs are predators at or near the top of marine food chains and thus, play an important role in marine ecosystems, potentially regulating the size and dynamics of their prey populations []. Their removal could affect the structure and function of marine ecosystems, inducing changes in trophic interactions at the community level due to selective removal of predators or prey species, competitors and species replacement. In the Mediterranean Sea, this is of particular concern since sharks and rays make up an important percentage of the by-catch [] and their mobile nature makes them potentially accessible to several fisheries at various bathymetric ranges[]. Bottom trawling is considered responsible for a large proportion of the by-catch of elasmobranch species in the Mediterranean Sea, and throughout the world in general []. Evidence of changes in the number of elasmobranchs and the decrease in the abundance of several species (e.g. Raja clavata and Dipturus batis) over the last decade have been reported for the whole of the Mediterranean Sea and in particular, for the highly exploited area of the Gulf of Lions [1]. As a result cartilaginous fishes can be used as ecological indicators and their study and monitoring is considered essential for the conservation of the marine ecosystem []. In 0 the European Commission adopted the first Action Plan for the conservation and management of elasmobranchs [] with the aim of rebuilding their stocks under threat, and of setting down guidelines for the sustainable management of the fisheries concerned. Moreover, the implementation of an ecosystem approach to fisheries management (EAFM) and marine spatial planning(msp) contemplates the protection of priority habitats, a policy of reducing by-catches and the study of current and expected impacts with a view to preparing efficient strategies for the preservation of the marine environment and in particular its living marine resources []. In order to achieve these purposes the prerequisites are a solid knowledge of species-environment relationships and the identification of priority areas using robust analysis of existing information and databases [0]. Habitat and
4 species mapping is essential for conservation programmes because it provides a clear picture of the distribution and extent of these marine resources, and thus facilitates managing the marine environment []. Following Soberón and Peterson [0] and Soberón [] these objectives can be achieved by either using Species Distribution Models (SDMs; models containing biotic or accessibility predictors and/or being limited in spatial extent) or Ecological Niche based Models (ENMs; for forecasting an approximation to the species niche)[, ]. On the one hand, the theoretical framework of ENMs is based on the ecological niche concept which identifies a niche as a subdivision of the habitat containing the environmental conditions that enable individuals of a species to survive and reproduce, based on broad-scale variables (climate) that are not affected by species density []. On the other hand, SMDs aim to predict quantities of interest at unsampled locations based on measured values at nearby sampled locations, within the range of environments sampled by the training data and within the same general time frame as that in which the sampling occurred. In line with the SMD context, our study aims to identify sensitive habitats of elasmobranch species and develop probabilistic spatial scenarios as effective tools for supporting decision-making within the conservation framework. To this end we have analysed a group of georeferenced data of the presence/absence of the most common demersal cartilaginous species collected from fisheries-dependent bottom trawl sampling carried out along the continental shelf and slope of the Western Mediterranean Sea (GFCM Geographical Sub Area 0) during a six-year period of time. In particular, we have modelled the occurrence data of the three most frequently captured species: smallspotted catshark (Scyliorhinus canicula, Linnaeus, 1), blackmouth catshark(galeus melastomus, Rafinesque, 1) and velvet belly (Etmopterus spinax, Linnaeus, 1), which comprise more than 0% of the total demersal elasmobranch abundance caught during the period 0-. Cluster Analysis(CA) and Multi Dimensional Scaling(MDS) techniques have been applied to observers data in order to verify whether the three species studied are in fact representative of the whole elasmobranch community of this area. To accomplish spatial prediction, ordinary kriging can be used to obtain the best linear unbiased predictor. However, accuracy is not always easy to achieve because there is often a large amount of variability surrounding the measurements of response and environmental variables, and traditional prediction methods, such as ordinary kriging, do not account for an attribute
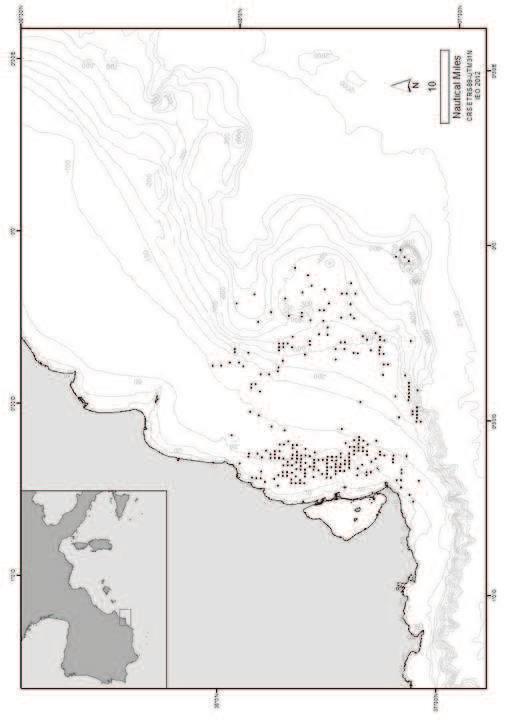
5 with more than one level of uncertainty. This variability leads to uncertain predictions, and consequently to uninformed decision making. In order to solve this problem, we have chosen to use hierarchical Bayesian spatial models and Bayesian kriging have been used. In our approach, one of the additional advantages is the possibility of integrating current modelling approaches (such as GLM and GAM) and uncertainty analyses into a more general hierarchical framework. Within the Bayesian framework, full inference about uncertainty, given what we have observed (the data) and what we know or assume about the process (the model), comes free with the model predictions []. Spatial autocorrelation can be incorporated into a regression model through random effects that capture spatial dependence in the data []. Since the random effects are model parameters, they also emerge with a full posterior distribution that allows quantification of uncertainty. Hierarchical stages can describe conceptual but unobservable latent processes that are ecologically important, as well as error in the observation process or gaps in the data []. However, until recently, it was computationally quite expensive to calculate these Bayesian hierarchical models with this spatial structure. In this study we overcome this problem by using the integrated nested Laplace approximation (INLA) methodology and software ( INLA provides accurate approximations to posterior distributions of the parameters, even in complex models, in a fast computational way []. In addition, INLA can be used through R software, providing a familiar interface with the programming of the model. But, more importantly to us, this methodology allows us both to estimate the processes that drive the distribution of elasmobranchs and also to generate predictive maps of the distribution of species in the study area, especially in non-observed locations. The establishment of regional marine protected areas for protecting sensitive habitats would benefit from an improved understanding of the spatial distribution of vulnerable species, such as elasmobranchs, and could help towarrds the more efficient management and control of marine resources.. Material and methods The study area was the Gulf of Alicante (Western Mediterranean), between º1. and º 0.0 N, and 1º 0.0 W and 0º 0.0 E (Figure 1). The Gulf of Alicante has a surface area of, km and an average shelf
6 width of approximately km. The largest fleet is the bottom trawl one, with vessels landing an average of,000 t per year. Seabed trawling usually takes place on the shelf, yielding a multispecific catch with European hake (Merluccius merluccius) as the main target species. The elasmobranch species most frequently caught are: Galeus melastomus, Scyliorhinus canicula, Etmopterus spinax, Raja clavata, Raja asterias and Squalus acanthias. Their distribution and abundance vary according to depth..1. Data The data set includes 00 hauls of different trawler vessels and has been provided by the Spanish Oceanographic Institute (Instituto Español de Oceanografía, IEO). The IEO provides the national input of the European Observers Programme for collecting fishery-dependent data. In particular, they collect samples from the commercial fleet with observers on board. This sampling has been carried out since 0, usually involving about - observer samplings every month for the trawler fleet, accounting for an average of hauls monthly. From this database we have used the geographical location and occurrence of the elasmobranch species for each haul. The fisheries were multispecies and none of the elasmobranchs were target species. Extrinsic factors influencing the spatial distribution of elasmobranch species used were depth, which is often the main gradient along which faunal changes occur when analyzing shelf and upper slope assemblages [1], type of substratum [], slope of seabed and physical characteristics of the water masses []. For ocean processes, chlorophyll-a concentration and Sea Surface Temperature (SST) data can be used to locate thermal and productivity-enhancing fronts and marine productivity hotspots and thus determine the influence of such features on species distribution []. In addition, SST and Chl-a are also strong functional links between surface primary productivity and biological activity at the sea floor through the episodic deposition of particulate material [, ]. Previous studies have shown that the distributions of many demersal fish species are likely to be influenced by overall ecosystem productivity [1, 1,, ]. In particular, Chl-a concentration can be used as an index of primary production of an ecosystem []. Obviously, primary production depends on a range of factors, including light, light penetration and temperature, which couldnotbetakenintoaccounthereduetotheabsenceofdata. Nevertheless, themeanvalueofchl-aconcentrationcanbeusedasanindependentindexof
7 primary production in the area of interest, since its variability could modify trophic conditions of the species habitat from oligotrophic to mesotrophic []. Sea Surface Temperature (SST) is strongly related with primary productivity and is thus a possible candidate to explain the distribution of the species []. Previous studies on elasmobranchs have implied that SST plays an important role in their distribution [1, ] from a physiological standpoint. The majority of coastal elasmobranchs are ectothermic and changes in the environmental temperature are rapidly transferred to the body of the animal, thus impacting most physiological processes [1]. The environmental satellite (SST and chlorophyll-a) data has been extracted as a monthly mean from the SeaWiFS ( nasa.gov). We have interpolated the raster surface of the SST and chlorophylla variables, using the Spline tool of ArcGIS. The Spline method is an interpolation method that estimates values using a mathematical function that minimizes overall surface curvature, resulting in a smooth surface that passes exactly through the input points. In particular, we have used the Tension method, twhich controls the stiffness of the surface according to the character of the modelled phenomenon. This method creates a less smooth surface with values more closely constrained by the sample data range ( index.html#//00z000000q htm) (Figure a,b). Bathymetry and type of substratum data were obtained from the IEO geoportal, accessible through the website of the Spanish Institute of Oceanography ( In order to obtain the value of depth at any precise location of the study area we have interpolated the bathymetric map, using GRASS GIS ( first rasterizing contours with a resolution of 00 m. and then using the function r.surf.contour, following guidelines given in the website ( to_dem) (Figure c). Log-transformed bathymetry was included in the analysis for smoothing the effect and preserving the linearity of this variable. The slope map has been derived by the bathymetry map, using the Slope tool of the ArcGIS. Slope values reflect the maximum rate of change (in degrees) in elevation between neighboring values derived with ArcGIS Spatial Analyst extension ( cfm?topicname=how%slope%works) (Figure d). The type of substratum polygon shapefile includes a classification of ten categories and a reduced version with four levels: Sand, Mud, Gravel and
8 Rock. In order to reduce the level of variability in the analysis, since we have no observations in all categories, we have used the simplified version (Figure e). Moreover, in the study area there are no areas of gravel, so the categories have been reduced to the remaining three. In order to meke it possible to work in the R framework maps have been transformed into SpatialPolygonsDataFrame objects using the sp R package... Multivariate analysis Our data set includes different elasmobranch species. We used multivariate analysis techniques in order to verify whether the three most captured species (Scyliorhinus canicula, Galeus melastomus and Etmopterus spinax) were truly representative of the whole elasmobranch community in this area. In particular, we applied Cluster Analysis (CA) and Multidimensional Scaling (MDS) techniques to analyse the 00 bottom trawl hauls. If results show a high degree of similarity in the species assemblage of the different hauls, we can assume that sensitive habitats identified for the three species studied are shared by the remaning elasmobranch species. Consequently, the conservationofthesehabitatswouldgoalongwaytoprotectingtheentirecommunity of elasmobranchs in this area. Both multivariate analyses were performed on a Euclidean similarity matrix with the average method, considering the occurrence of each species to identify possible differences between the habitats studied... Modelling sensitive habitats The spatial variation in the probability of occurrence of the three most captured species (Scyliorhinus canicula, Galeus melastomus and Etmopterus spinax) was modelled by using a hierarchical Bayesian spatial approach, specifically a point-reference spatial model. These models are highly suitable for situations (such as that of the present study) in which data are observed at continuous locations occurring within a defined spatial domain (geo-referenced Bernoulli data). Note that these models can also be considered as a spatial extension of logistic regression models because the modelling process describes the variability in the response variable as a function of the explanatory variables, with the addition of a stochastic spatial effect, which models the residual spatial autocorrelation []. Specifically, the response variable is a binary variable that represents the presence (1) or absence (0) of the species in each fishing location sampled: Z i represents the occurrence. Consequently, the conditional distribution of
9 the data is Z i Ber(π ij ), assuming that observations are conditionally independent given π ij, which is the probability of occurrence at location i (i = 1,...,n) and year j (j = 1,...,). At the first stage of the hierarchical model, we model the observed data (occurrence of elasmobranchs) as a GLM by using the customary (for binary data) logit link function, but incorporating a spatial and a possible temporal effect. That is, logit(π ij ) = Xβ +Y j +W i, (.1) where β represents the vector of the regression coefficients, X is the matrix of covariates, W i represents the spatially structured random effect, Y j is the component of the temporal unstructured random effect at year j, and the logit transformation is defined as logit(π ij ) = log(π ij /1 π ij ). W i is assumed to be Gaussian with a given covariance matrix σ W H(φ), depending on the distance between locations, and with hyperparameters σ W and φ representing respectively the variance and the range of the spatial effect: W N(0,σ WH(φ)). (.).. Bayesian inference Once the model has been determined, the next step is to estimate its parameters. Following Bayesian reasoning, the parameters are treated as random variables, and prior knowledge has to be incorporated via the corresponding prior distributions of the said parameters. In particular, for the parameters involved in the fixed effects, we use the Gaussian distribution β N(0, 0). In this second stage of the hierarchical model the uncertainty about the parameters used in the first level is incorporated and propagated across model stages to more accurately reflect overall inferential uncertainty. In the third, and final, level of hierarchy, prior knowledge about the hyperparameters is expressed. For the temporal effect we assume, following Rue and Held [], LogGamma prior distribution on the log-precision λ y (a=1, b= e -0). The choice of the priors of the hyperparameters of the spatial effect will be described in the following section. As usual in this context, the resulting hierarchical Bayesian model has no closed expression for the posterior distribution of all the parameters, and thus numerical approximations are needed. Here, due to speed of computational processing, we use the integrated nested Laplace approximation (INLA) methodology and software ( as an alternative to the Markov chain Monte Carlo (MCMC) method.
10 The INLA framework To better understand the idea behind this modelling, the key is to think of these models as a particular case of the Structured Additive Regression (STAR) models called Latent Gaussian models []. In these models the mean of the response variable Z i is linked to a structured predictor that accounts for the effects of various covariates in an additive way. Gaussian prior distributions are assigned to all the components of the additive predictor which is the latent Gaussian model. Here, the latent models represent the elasmobranch occurrence phenomena that exists independently of whether species are observed in a given location or not. Thus, we are not building hierarchical models solely for discretely observed data, but for approximations of entire processes defined on continuous domains. Until recently, the problem was the infeasibility of fitting the particular case of continuously indexed Gaussian models, as is the case with our spatial component W. Lindgren et al.[] have proposed a solution to this problem: the Stochastic Partial Differential Equation (SPDE) approach. This alternative solution is an explicit link between Gaussian models and the Gaussian Markov Random model []. The benefits are that the Markov property makes the covariance matrix sparse, enabling the use of efficient (and faster) numerical algorithms and the use of the Matérn covariance function, which is a highly flexible and general family of functions in spatial statistics. Under this perspective, the equation. changes as follows: W N(0,Q(κ,τ)). (.) Now the spatial effect depends on two different parameters: κ and τ, which determine the range of the effect and the total variance, respectively. Hyperpriors for κ and τ are centered in values such that the range is about % of the diameter of the region and the variance is equal to 1 []. Here, the two major bonuses are that INLA can be used through R, providing a familiar interface with the model specification (see Lindgren [] for a detailed explanation of the INLA syntaxis) and that inference and prediction in unsampled locations could be were performed simultaneously. INLA provides a variety of approximation strategies for the posterior distributions. In this study we have used the default ones: the simplified Laplace approximation for marginalization, and the Central Composite Design for the numerical integration of the hyperparameters. These are the
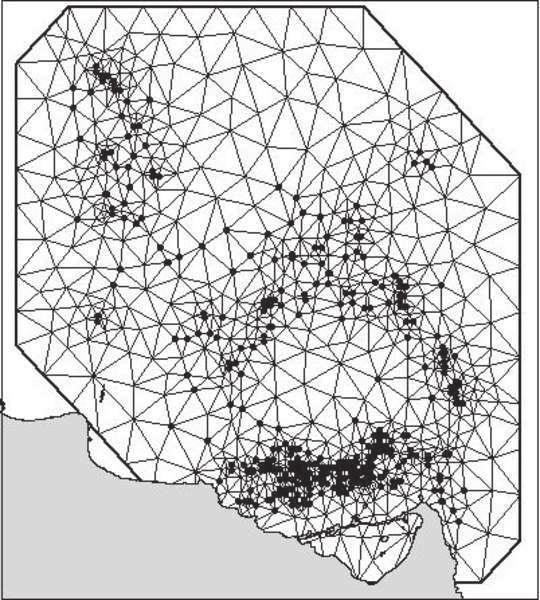
11 default and recommended settings providing reasonable accuracy with maximum computational efficiency (Held et al., )[1]... Model prediction Once the inference has been carried out, the next step is to predict the occurrence of elasmobranchs in the rest of the area of interest, especially in unsampled locations. Here, we adopted a Bayesian kriging, which allows for the incorporation of parameter uncertainty into the prediction process by treating the parameters as random variables. A common method for performing prediction with a Bayesian kriging is to take observations and construct a regular lattice over them. In this study, we have considered a more computationally efficient approach. Using the INLA SPDE module we created a triangulation around the sampled points in the region of interest (Figure ). As opposed to a regular grid, a triangulation is a partition of the region into triangles, satisfying constraints on their size and shape in order to ensure smooth transitions between large and small triangles. Initially, observations are treated as initial vertices for the triangulation, and extra vertices are added heuristically to minimize the number of triangles needed to cover the region subject to the triangulation constraints. These additional vertices are used as prediction locations. The triangulation approach has a number of advantages over a regular grid. Firstly, the triangulation is denser in regions where there are more observations and consequently there is more information, and more detail is needed. Secondly, it saves computing time, because prediction locations are typically much lower in number than those in a regular grid. And thirdly, it is possible to take boundary effects into account by generating a mesh with small triangles in the domain of interest, and using larger triangles in the extension used to avoid boundary effects. After obtaining the prediction in the selected location, there are additional functions that linearly interpolate the results within each triangle into a finer regular grid. As a result of the process, for each point of the area we obtain a predictive posterior distribution of elasmobranch occurrence for the whole study area. This means that for each posterior distribution, unlike the mean and confidence interval produced by classical analyses, we are able to make explicit probability statements about the estimation of elasmobranch occurrence.
12 Model selection Models were compared considering two criteria: the Deviance Information Criterion, usually denoted as DIC [1], which is computed routinely by INLA as the default criterion for comparing hierarchical models; and the Conditional Predictive Ordinate (CPO), which has been used as a predictive measure (of the models). In particular, as indicated by Roos and Held [], we computed the mean logarithmic CPO (LCPO). Lower values for both DIC and LCPO represent the best compromise between fit and parsimony... Model evaluation and calibration The dataset was randomly split into two main subsets: a training dataset including 0% of the total observations, and a validation dataset containing the remaining 0% of the data. The relationship between occurrence data and the environmental variables was modelled by using the training dataset and the quality of predictions was then assessed by using the validation dataset. We repeated validation times for the best model for each species and results were averaged over the different random subsets. We performed a validation procedure to formally evaluate overall model prediction using the area under the receiver-operating characteristic curve (AUC) [], specificity, sensitivity and kappa. AUC measures the ability of a model to discriminate between those sites where a species is present and those where it is absent, and has been widely used in the species distribution modelling literature []. AUC ranges from 0 to 1, with values below 0. indicating a performance no better than random, values between considered as useful, and values > 0. as excellent. AUC is tabulated through the confusion matrix indicating the true positive (TP), false positive (FP), false negative (FN), and true negative (TN) predictions. We can summarize that there are two types of prediction errors: false positive (FP) and false negative (FN). FP leads to an over-prediction while FN or omission error, leads to an under-prediction. From the confusion matrix we calculated the specificity, sensitivity and kappa criteria. Specificity is the proportion of TN correctly predicted and reflects a model s ability to predict an absence given that a species in fact does not occur at a location. Sensitivity is the proportion of TP correctly predicted and reflects a model s ability to predict a presence given that a species in fact occurs at a location. Kappa measures the proportion of correctly classified units after accounting for the probability of chance agreement. It requires a threshold to be
13 applied to the predictions in order to convert them to presence-absence predictions. Kappa provides an index that considers both FP and FN errors. In this study, a maxkappa is used for each model generated. All the analyses described in this paper were carried out using the R.1 software [].. Results The similarity dendrogram for the bottom trawl hauls revealed the existence of three different assemblages for the elasmobranchs, which were confirmed by the MDS analysis (Figure ). Picked dogfish (Squalus acanthias) and common eagle ray (Myliobatis Aquila) form a separate group, bull ray (Pteromylaeus bovines) are in a group of their own, and all the other elasmobranch species are included in one single group. This latter group includes out of the of elasmobranch species caught in the study area, including the three most caught species which are the ones used in this study. A total of 00 trawl fishery operations were observed during a period of six years. In the case of the smallspotted catshark (Scyliorhinus canicula), its presence was recorded in of these hauls, that of the blackmouth catshark (Galeus melastomus) in and that of the velvet belly (Etmopterus spinax) in. The main predictors of elasmobranch habitats in the western Mediterranean Sea were depth, slope and type of substratum. SST and chlorophyll-a concentration show a negative relationship with species occurrence but affect only the distribution of S. canicula (Table 1). The final models with the best fit for G. melastomus and E. spinax do not include SST and chlorophyll-a concentration as relevant variables (Table 1). No important yearly differences were found in this area for the occurrence of these species. All the models that include the temporal effect, show higher Deviance Information Criterion (DIC) than those without it. The model selected for its best fit (based on the lowest DIC and LCPO) with S. canicula has log-transformed bathymetry, type of substratum, slope, SST and chlorophyll-a concentration as covariates, and a stochastic spatial component that accounts for the residual spatial autocorrelation. Table 1 presents a numerical summary of the posterior distributions of the fixed effects for this final model. This summary contains the mean, the standard deviation, the median and a % credible interval, which is a central interval containing % of the probability under the posterior distribution.
14 Species predictor mean sd Q 0.0 Q 0. Q 0. S. canicula (Intercept) Log Depth Seabed(Mud) Seabed(Rock) Slope Chlorophyll-a SST G. melastomus (Intercept) Log Depth Seabed(Mud) Seabed(Rock) Slope E. spinax (Intercept) Log Depth Seabed(Mud) Seabed(Rock) Slope Table 1: Numerical summary of the posterior distributions of the fixed effects for the best model of the three species studied. This summary contains the mean, the standard deviation, the median and a % credible interval, which is a central interval containing % of the probability under the posterior distribution.
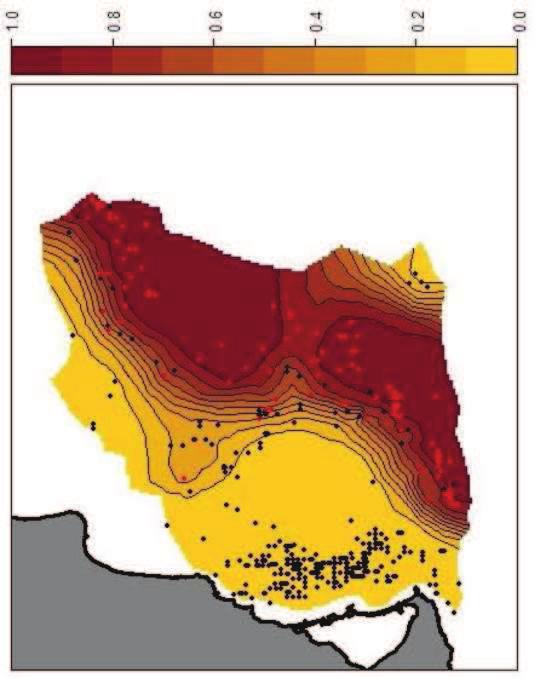
15 Results showed a positive relationship between bathymetry and the presence of S. canicula (posterior mean = 1.0; % CI = [-0.,.0]). Conversely, chlorophyll-a concentration showed a negative relation with respect to the presence of this species(posterior mean =-.; % CI =[-.,1.]). For low SST values, the occurrence of S. canicula is higher (posterior mean = -0.; % CI = [-0.,1.0]). Rock substratum is the type of seabed that shows the lowest estimated probability of occurrence(posterior mean =-1.1; % CI = [-.,-0.]) with respect to the reference level (sand substratum). Muddy substrata also showed a lower estimated coefficient than the reference level(posterior mean =-0.; % CI =[-1.,0.1]), leaving sandy substrata as the kind of sediment granulometry category with the highest probability of the presence of S. canicula. A positive correlation is characterized by a high slope gradient and the probability of occurrence (posterior mean = 0.; % CI = [-0.1,0.]) of S. canicula. As can be appreciated in Figure (a), the median posterior probability of the occurrence of S. canicula in the Gulf of Alicante, is greater over a high slope gradient, in deeper waters where chlorophyll-a and SST values are higher, and where there are sandy seabeds. Habitats associated with hard substrata and sandy beds, mainly from deeper waters and with a high slope gradient, show a greater probability of the presence of G. melastomus than those associated with mud from shallow waters and low slope gradient (Table 1 and Figure (b)). Table 1 showed a positive relation between log-bathymetry and the presence of G. melastomus (posterior mean = 0.; % CI = [0., 0.]). Rock substratum is the type of seabed that shows the highest estimated probability of occurrence (posterior mean = -0.; % CI = [-.,1.]) with respect to the reference level (sand substratum). Muddy substrata showed a lower estimated coefficient than the reference level (posterior mean = 0.1; % CI = [0.0,1.]). High slope gradient positively influences the probability of occurrence of G. melastomus (posterior mean = 0.1; % CI = [-0.0,0.]). Figure (b) shows high median posterior probability of occurrence of G. melastomus over steeper slopes, in deeper waters and where there are rocky and sandy seabeds. The results for E. spinax are very similar to those for G. melastomus. The best model fit for this species included depth, slope of seabed and type of substratum as relevant covariates. Table 1 shows a positive relation between log-bathymetry (posterior mean =.; % CI = [.0,.]), slope (posterior mean = 0.0; % CI =[-0.0,0.]) and E. spinax occurrence. Habitats associated with hard substrata (posterior mean = -0.; % CI = [-.,1.0]) show the highest estimated probability of occurrence with re-
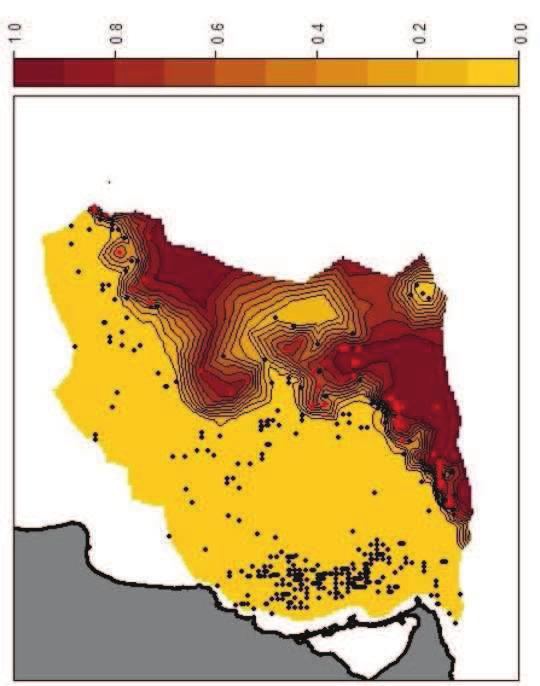
16 spect to the reference level (sand substratum), the lowest corresponding to muddy beds (posterior mean = 0.0; % CI = [-1.1,1.]). Figure (c) shows a map of the median posterior probability of occurrence of E. spinax, with a marked influence of depth. High probabilities appear in deep water, and low probabilities in coastal waters. Model prediction performance statistics of all models are presented in Table. All models have achieved AUC values greater than 0.0, which indicates an excellent degree of discrimination between those locations where a species is present and those where it is absent. All maxkappa values are between 0. and 0.0, which represents a good degree of similarity between the occurrence of the species and the available real evidence. Specificity and sensitivity also show high values(> 0.), reflecting a high ability of the model to predict true negative and true positive predictions correctly. AUC maxkappa sensitivity specificity S. canicula G. melastomus E. spinax Table : Model prediction performance statistics for the three species studied. AUC (Area Under the receiver-operated characteristic Curve), maxkappa, sensitivity and specificity.. Discussion.1. Biological conclusions Fishery-dependent data were used to improve our understanding of habitat utilization by elasmobranchs in the western Mediterranean Sea. In this study we used data from observers on board commercial trawlers, which represent one of the most important, but often underestimated, sources of data for the study of demersal fish. The methodology used is a Bayesian spatial hierarchical model that makes possible to assess the influence of the covariates on the presence/absence of species, as well as to predict the probability of occurrence in non-sampled areas. We have also introduced the spatialtempoarl component into the study, an important effect which is commonly overlooked in most fishery studies that use traditional methods. The estimated parameters have contributed to quantify habitat use and reveal important relationships of environmental variables with each species 1
17 habitat. With the available data, the main predictors of elasmobranch habitats in the western Mediterranean were found to be depth, slope of seabed and type of substrate. Elasmobranch species from the Gulf of Alicante show different optimum depths, which may indicate certain of fine-tuned bathymetric segregation, although they were in fact found to coexist on shelf and slope bottoms. However, the direct effect of depth on species occurrence is expected to be relatively small in relation to the indirect effects of bathymetry due to its correlation with many crucial environmental and biological parameters. Due to this, in the absence of such data (e.g. CTD data for oceanographic characteristics in the near bottom), a good knowledge of the bathymetric distribution of species could explain the spatial pattern and it is essential for fisheries management. From our results, we can summarize that, in our study area, E. spinax inhabits the deepest stratum, G. melastomus the middle and upper slope and S. canicula the shelf and the middle slope. On the upper slope, maps show a habitat overlap between G. melastomus and E. spinax, and on the middle slope a slight overlap between G. melastomus and S. canicula. Habitat overlap does not necessarily imply competition, except when resources are in short supply. Otherwise, on rich shelf bottoms, species that are spatially segregated are not driven to differentiate their diets and may easily converge in the use of resources in overlapping areas. Our spatial results are in accordance with a recent trophic study of these species in the Balearic Islands []. S. canicula and G. melastomus both prey mainly on euphausiids and share the habitat. However, in our study, G. melastomus expressed a wider and deeper distribution trend with respect to S. canicula. A possible explanation for this could be a phenomenon of competitive exclusion due to the exploitation of similar resources. Based on the competitive exclusion principle, other species are forced to retreat to the bathymetric and/or geographic range to which they are most highly adapted in relation to the other potential inhabitants. In this case G. melastomus retreat to a depth interval of between 00 m. and 00 m., usually home to the biomass peak of decapod crustaceans, which constitute an important part of the diet of this species. E. spinax feeds preferentially on cephalopods, while euphausiids are only a small part of the diet. This different trophic pattern with respect to G. melastomus would be a mechanism for reducing competition in the deepest stratum. In general, our results show a negative relationship between all the elas-
18 mobranch species studied and depth, and high slope gradient values. In addition, for S. canicula, the probability of their presence is higher where SST and chlorophyll-a concentration values are lower. This may be explained by the fact that shallow sunlight waters above the continental shelf are usually areas of high productivity and SST mean values, while the deeper waters away from coastlines usually lack sunlight and nutrients, and present low values of chlorophyll-a concentration and SST. This study confirms the importance of the type of substratum in the patterns of elasmobranch spatial distribution, as substrate type was included among the best models for all species. Our analysis shows that elasmobranchs prefer hard and sandy substrates while muddy ones affect their occurrence negatively. This preference has already been documented[] and is probably it is partly attributable to the distribution of their preferred prey, which as mentioned earlier, are crustaceans []. These patterns were also consistent with those from other studies reporting on habitat utilization by various species (e.g. R. brachyura, R. montagui and S. stellaris in []; R. clavata in [1]; S. canicula in []). Although the present study was limited to three species, multivariate analysis of elasmobranch assemblage show that out of species of elasmobranchscaughtinthisareaarealwaysfishedjointlywithoneofthespecies examined. These results indicate that sensitive habitats identified for the three species studied are shared by the other, less frequently caught elasmobranchs. The preservation of these habitats may be useful for protecting the majority of the species of the elasmobranch community in this area. However a more thorough analysis should be done to verify with which of the species studied a given elasmobranch species is usually fished and what kind of habitat shared. Finally, it should be noted that although the fishery-dependent data that we used were collected with a systematic sampling design, Bayesian spatial models may also aid analyses of data with geographically uneven levels of survey effort because such bias can be incorporated within the spatial random-effect term, thereby reducing its influence on estimates of the effects of environmental variables. By treating spatial effects as a variable of interest, hierarchical Bayesian spatial models can suggest the identity of additional environmental covariates that may improve model fit or the existence of area effects that may limit population viability. However, some other data are available for elasmobranch species from online databases, such as Fishbase and the Global Biodiversity Information 1
19 Facility (GBIF). These databases include presence-only data and provide probability maps on a more extensive spatial scale. Macro-scale studies allow for a broader and more complete view of ecosystem status, but their use often leads to a compromise in the analysis, because the quality and quantity of data available for large ecosystems and long time-series are often lower. Mapping sensitive habitats of vulnerable species within a region for conservation planning requires the highest level of accuracy. Here, Bayesian interpolations are sufficiently reliable for the purpose of effective decision making and a range of evaluation criteria demonstrated the good predictive performance and properties of this approach as well as its advantages in term of ecological interpretability... Applicability of the results for fisheries management Improved knowledge of the spatial distribution of commercially important fish species and their relationships with the marine environment could form an integral aspect of a precautionary approach []. There is growing worldwide support for the argument that fisheries should be conducted in a way that is robust to environmental change, and thus that fish stocks should never be exploited to a point where they cease to be resilient to environmental change. In order to achive this purpose, the European Marine Strategy Framework Directive has specifically requested the incorporation of any existing knowledge about environmental drivers in the assessment of ecosystems and fisheries and in advice []. Implementing plans and control schemes that would target specific species assemblages, based on a good knowledge of the species spatial distribution in relation to the environment, could serve as a sustainable approach to fisheries management and also for other marine activities and uses []. The establishment of marine protected areas for protecting sensitive habitats, in line with the recent trends for a holistic ecosystem-based approach to management and Marine Spatial Planning, would also benefit from an improved understanding of the spatial distribution of vulnerable species such as elasmobranchs. To achieve these objectives, predictive habitat maps, such as those generated by the approach presented here, could be useful source of information in the selection of areas for improved regional management or technical measures adoption. 1
20 We believe that the use of this approach for constructing maps of the spatial distribution of vulnerable species may help the design of integrated programmes for the more efficient management and control of marine resources.. Conclusions Species habitat analysis should be able to identify those areas within the distribution of a species that contribute most to sustain the long-term viability of a population. Although it may be complicated to define the boundaries of sensitive habitats, the definition of these areas, combined with an efficient fishery management that recognizes the importance of such areas, represents the first step towards facilitating an EAFM approach[]. However, accuracy isnot alwayseasyto achievebecausethereisoftenalargeamount ofvariability surrounding the measurements of response and environmental variables []. This variability leads to uncertain predictions, and consequently to uninformed decision making. It is therefore important to develop tools which account for measurements with significant variability. Here, we have shown a Bayesian spatial hierarchical model that makes it possible to identify sensitive habitats together with a full specification of associated uncertainty. In our study we have improved knowledge of the habitat utilisation of elasmobranchs in the Gulf of Alicante and provided practical tools for conservation planning and resource management. However, as both species and environmental data are sampled over a limited period of time and area of space, the models fitted can only reflect a snapshot view of the expected relationship. Future studies should compare the spatial distribution of these species from a fishery-independent scientific survey, which is often considered as being a more reliable abundance index because of its scientifically rigorous design []. However, this first approximation could be serve to promote a greater effort in data collection and to identify the areas on which future research attempts should concentrate.. Acknowledgments David Conesa, Antonio López-Quílez and Facundo Muñoz would like to thank the Ministerio de Educación y Ciencia for financial support (jointly financed by the European Regional Development Fund) via Research Grant MTM-1. The authors also wish to express their gratitude to Raúl Vilela for his valuable technical support. 1
21 References [1] Abdulla, A., 0. Status and conservation of sharks in the Mediterranean Sea. IUCN Technical Paper. [] Banerjee, S., Carlin, B., Gelfand, A., 0. Hierarchical Modeling and Analysis for Spatial Data. Chapman and Hall/CRC Press. [] Barberá, C., Moranta, J., Ordines, F., Ramón, M., de Mesa, A., Díaz- Valdés, M., Grau, A., Massutí, E.,. Biodiversity and habitat mapping of menorca channel (western mediterranean): implications for conservation. Biodiversity and Conservation, 01. [] Cao, J., Chen, X., Chen, Y., Liu, B., Ma, J., Li, S.,. Generalized linear bayesian models for standardizing cpue: an application to a squidjigging fishery in the northwest pacific ocean. Scientia Marina,. [] Carbonell, A., Azevedo, M., 0. Application of non-equilibrium production models to the red shrimp (Aristeus antennatus, Risso, 1) fishery in the northwestern Mediterranean. Fisheries Research,. [] Dell Apa, A., Kimmel, D.G., Clò, S.,. Trends of fish and elasmobranch landings in Italy: associated management implications. ICES Journal of Marine Science,. [] Demestre, M., Sanchez, P., Abello, P., 00. Demersal fish assemblages and habitat characteristics on the continental shelf and upper slope of the north-western Mediterranean. Journal of the Marine Biological Association of the UK 0, 1. [] Elith, J., Graham, C.H., Anderson, R.P., Dudık, M., Ferrier, S., Guisan, A., Hijmans, R.J., Huettmann, F., Leathwick, J.R., Lehmann, A., et al., 0. Novel methods improve prediction of species distributions from occurrence data. Ecography. [] Ellis, J., Cruz-Martinez, A., Rackham, B., Rogers, S., 0. The distribution of chondrichthyan fishes around the British Isles and implications for conservation. Journal of Northwest Atlantic Fishery Science, 1.
22 [] EU, 0. Communication from the Commission to the European Parliament and the Council on a European Community Action Plan for the Conservation and Management of Sharks. Technical Report. Com(0)0 Final. [] Ferretti, F., Myers, R.A., Serena, F., Lotze, H.K., 0. Loss of large predatory sharks from the Mediterranean Sea. Conservation Biology,. [] Fielding, A., Bell, J., 1. A review of methods for the assessment of prediction errors in conservation presence/absence models. Environmental conservation,. [] Gelfand, A., Silander, J., Wu, S., Latimer, A., Lewis, P., Rebelo, A., Holder, M., 0. Explaining species distribution patterns through hierarchical modeling. Bayesian Analysis 1, 1. [] Guisan, A., Zimmermann, N.E., 00. Predictive habitat distribution models in ecology. Ecological modelling,. [1] Held, L., Schrödle, B., Rue, H.,. Posterior and Cross-validatory PredictiveChecks: A Comparison of MCMC and INLA. Springer. [] Holden, M., Tucker, R., 1. The food of Raja clavata Linnaeus 1, Raja montagui Fowler 1, Raja naevus Müller and Henle 11 and Raja brachyura Lafont 1 in British waters. Journal du Conseil, 1 1. [1] Hopkins, T., Cech, J., 0. The influence of environmental variables on the distribution and abundance of three elasmobranchs in Tomales Bay, California. Environmental Biology of Fishes,. [1] Hunter, E., Buckley, A., Stewart, C., Metcalfe, J., 0. Migratory behaviour of the thornback ray, Raja clavata, in the southern North Sea. Journal of the Marine Biological Association of the United Kingdom, 0. [1] Kallianiotis, A., Sophronidis, K., Vidoris, P., Tselepides, A., 00. Demersal fish and megafaunal assemblages on the Cretan continental shelf and slope (NE Mediterranean): seasonal variation in species density, biomass and diversity. Progress in oceanography,.
23 [] Katara, I., Illian, J., Pierce, G.J., Scott, B., Wang, J., 0. Atmospheric forcing on chlorophyll concentration in the mediterranean. Hydrobiologia,. [] Katsanevakis, S., Maravelias, C.D., Damalas, D., Karageorgis, A.P., Tsitsika, E.V., Anagnostou, C., Papaconstantinou, C., 0. Spatiotemporal distribution and habitat use of commercial demersal species in the eastern Mediterranean Sea. Fisheries Oceanography 1,. [] Latimer, A.M., Wu, S., Gelfand, A.E., Silander Jr, J.A., 0. Building statistical models to analyze species distributions. Ecological Applications, 0. [] Leathwick, J., Elith, J., Francis, M., Hastie, T., Taylor, P., 0. Variation in demersal fish species richness in the oceans surrounding new zealand: an analysis using boosted regression trees. Marine Ecology Progress Series,. [] de Leiva Moreno, J., Agostini, V., Caddy, J., Carocci, F., 00. Is the pelagic-demersal ratio from fishery landings a useful proxy for nutrient availability? a preliminary data exploration for the semi-enclosed seas around europe. ICES journal of marine science, 1 0. [] Lindgren, F.,. Continuous domain spatial models in r-inla. ISBA Bulletin 1,. [] Lindgren, F., Rue, H., Lindström, J.,. An explicit link between Gaussian fields and Gaussian Markov random fields: the SPDE approach (with discussion). Journal of the Royal Statistical Society, Series B,. [] Maravelias, C., Tserpes, G., Pantazi, M., Peristeraki, P.,. Habitat Selection and Temporal Abundance Fluctuations of Demersal Cartilaginous Species in the Aegean Sea (Eastern Mediterranean). PloS one, e. [] Maravelias, C., Tsitsika, E., Papaconstantinou, C., 0. Environmental influences on the spatial distribution of European hake (Merluccius merluccius) and red mullet (Mullus barbatus) in the Mediterranean. Ecological Research,.
24 [] Martin, C., Vaz, S., Ellis, J., Lauria, V., Coppin, F., Carpentier, A.,. Modelled distributions of ten demersal elasmobranchs of the eastern English Channel in relation to the environment. Journal Of Experimental Marine Biology And Ecology 1 1, 1. [0] Massutı, E., Moranta, J., 0. Demersal assemblages and depth distribution of elasmobranchs from the continental shelf and slope off the Balearic Islands (western Mediterranean). ICES Journal of Marine Science 0,. [1] Matern, S., Cech, J., Hopkins, T., 00. Diel movements of bat rays, Myliobatis californica, in Tomales Bay, California: evidence for behavioral thermoregulation? Environmental biology of fishes, 1 1. [] Nodder, S.D., Pilditch, C.A., Probert, P.K., Hall, J.A., 0. Variability in benthic biomass and activity beneath the subtropical front, chatham rise, sw pacific ocean. Deep Sea Research Part I: Oceanographic Research Papers 0,. [] R Development Core Team,. R: A Language and Environment for Statistical Computing. R Foundation for Statistical Computing. Vienna, Austria. URL: [] Roos, M., Held, L.,. Sensitivity analysis in Bayesian generalized linear mixed models for binary data. Bayesian Analysis,. [] Rue, H., Held, L., 0. Gaussian Markov Random Fields. Theory and Applications. Chapman and Hall/CRC. [] Rue, H., Martino, S., Chopin, N., 0. Approximate Bayesian inference for latent Gaussian models by using integrated nested Laplace approximations. Journal of the Royal Statistical Society, Series B 1(), 1. [] Sillero, N.,. What does ecological modelling model? a proposed classification of ecological niche models based on their underlying methods. Ecological Modelling,. [] Skjæraasen, J., Bergstad, O., 00. Distribution and feeding ecology of Raja radiata in the northeastern North Sea and Skagerrak (Norwegian
25 Deep). ICES Journal of Marine Science: Journal du Conseil, 0. [] Soberón, J.,. Niche and area of distribution modeling: a population ecology perspective. Ecography, 1. [0] Soberón, J., Peterson, A., 0. Interpretation of models of fundamental ecological niches and species distributional areas. Biodiversity Informatics, 1. [1] Spiegelhalter, D.J., Best, N., Carlin, B., van der Linde, A., 0. Bayesian measures of model complexity and fit. Journal of the Royal Statistical Society, Series B,. [] Stevens, J.D., Bonfil, R., Dulvy, N.K., Walker, P.A., 00. The effects of fishing on sharks, rays, and chimaeras (chondrichthyans), and the implications for marine ecosystems. ICES Journal of Marine Science,. [] Thrush, S.F., Dayton, P.K.,. What can ecology contribute to ecosystem-based management? Annual Review of Marine Science, 1 1. [] Valavanis, V., Kapantagakis, A., Katara, I., Palialexis, A., 0. Critical regions: a GIS-based model of marine productivity hotspots. Aquatic Sciences-Research Across Boundaries,. [] Valavanis, V.D., Pierce, G.J., Zuur, A.F., Palialexis, A., Saveliev, A., Katara, I., Wang, J., 0. Modelling of essential fish habitat based on remote sensing, spatial analysis and gis. Hydrobiologia,. [] Valls, M., Quetglas, A., Ordines, F., Moranta, J.,. Feeding ecology of demersal elasmobranchs from the shelf and slope off the Balearic Sea (western Mediterranean). Scientia Marina,. [] Vaz, S., Martin, C., Eastwood, P., Ernande, B., Carpentier, A., Meaden, G., Coppin, F., 0. Modelling species distributions using regression quantiles. Journal of Applied Ecology,. [] Wiegand, J., Hunter, E., Dulvy, N.,. Are spatial closures better than size limits for halting the decline of the North Sea thornback ray, Raja clavata? Marine and Freshwater Research,.
26 [] Wiens, J.A., Stralberg, D., Jongsomjit, D., Howell, C.A., Snyder, M.A., 0. Niches, models, and climate change: assessing the assumptions and uncertainties. Proceedings of the National Academy of Sciences, 1.
27 Figure legends Figure 1: Map of the study area with the sampling locations indicated by black dots. Figure : The spatial patterns of the environmental variables used to map the habitat models, including(a) satellite derived Chlorophyll-a mean values; (B) satellite derived sea surface temperature mean values; (C) bathymetric map; (D) slope map; (E) seabed sediment type map. Figure : The triangulation of the Gulf of Alicante. The (ˆ) mark the fishing locantions. Figure : Analysis Cluster dendrogram (a) and MDS ordination (b) of elasmobranch species caught during bottom trawl commercial hauls carried out in the Gulf of Alicante. Figure : Median of the posterior probability of the presence of the studied elasmobranchs: S. canicula (a); G. melastomus (b); E. spinax (c). Sampling locations for the presence (ˆ) and the absence (ˆ) were plotted. 1
28 Fig1
29 Figa RI P T SC 0. NU MA 0. AC CE PT ED 0.0

30 Figb RI P T AC CE PT ED MA NU SC

31 Figc RI P T SC 0 NU 00 MA 00 AC CE PT ED 100

32 Figd SC RI P T AC CE PT ED MA NU
33 Fige Rock Mud Sand
34 Fig
35 Figa
36 Figb
37 Figa
38 Figb
39 Figc
2012 FORUM OF MARINE PROTECTED AREAS IN THE MEDITERRANEAN ANTALYA, TURKEY
 2012 FORUM OF MARINE PROTECTED AREAS IN THE MEDITERRANEAN ANTALYA, TURKEY SPECIAL EVENT Challenges for Open Seas MPAs in the Mediterranean region November 27, 2012. 15h00-16H00 Slide # 1 2012 FORUM OF
Introduction to Part III Examining wildlife distributions and abundance using boat surveys
 Baseline Wildlife Studies in Atlantic Waters Offshore of Maryland: Final Report to the Maryland Department of Natural Resources and Maryland Energy Administration, 2015 Introduction to Part III Examining
Abstract. Keywords: blue ling, GIS, marine protection areas, spatial management. 1. Introduction. P. Posen, P. Large and J. Lee
 Estimating uncertainty in deriving spatial distribution of blue ling landings from vessel monitoring system (VMS) data and implications for delineating marine protection boundaries to the northwest of
Niall McGinty, Pedro Afonso, Frederic Vandeperre 1. 1 IMAR, University of the Azores, Horta
 Niall McGinty, Pedro Afonso, Frederic Vandeperre 1 1 IMAR, University of the Azores, Horta Introduction Part 1. Common modelling procedures of Fisheries dependent data Part 2. Introduction of the MARS
9.0 Consistency with the Magnuson-Stevens Fishery Conservation and Management Act (MSFCMA)
") 9.0 Consistency with the Magnuson-Stevens Fishery Conservation and Management Act (MSFCMA) This analysis was prepared in accordance with the requirements of the Magnuson- Stevens Fishery Conservation and
9.0 Consistency with the Magnuson-Stevens Fishery Conservation and Management Act (MSFCMA) This analysis was prepared in accordance with the requirements of the Magnuson- Stevens Fishery Conservation and
Estimation and prediction of the spatial occurrence of fish species using Bayesian latent Gaussian models
 Stochastic Environmental Research and Risk Assessment manuscript No. (will be inserted by the editor) Estimation and prediction of the spatial occurrence of fish species using Bayesian latent Gaussian
Marine Spatial Planning: A Tool for Implementing Ecosystem-Based Management
 Marine Spatial Planning: A Tool for Implementing Ecosystem-Based Management Steven Murawski, Ph.D., Ecosystem Goal Team Lead National Oceanic and Atmospheric Administration NOAA November 16, 2009 1 To
Identifying and characterizing biodiversity hotspots in the BCLME: its relevance in the light of climate change
 Identifying and characterizing biodiversity hotspots in the BCLME: its relevance in the light of climate change Kirkman SP 1, Yemane D 2, Kathena J 3, Mafwila S 4, Nsiangango S 5, Samaai T 1, Singh L 2
Managing Uncertainty in Habitat Suitability Models. Jim Graham and Jake Nelson Oregon State University
 Managing Uncertainty in Habitat Suitability Models Jim Graham and Jake Nelson Oregon State University Habitat Suitability Modeling (HSM) Also known as: Ecological Niche Modeling (ENM) Species Distribution
Satellite-derived environmental drivers for top predator hotspots
 Satellite-derived environmental drivers for top predator hotspots Peter Miller @PeterM654 South West Marine Ecosystems 2017 21 Apr. 2017, Plymouth University Satellite environmental drivers for hotspots
A short introduction to INLA and R-INLA
 A short introduction to INLA and R-INLA Integrated Nested Laplace Approximation Thomas Opitz, BioSP, INRA Avignon Workshop: Theory and practice of INLA and SPDE November 7, 2018 2/21 Plan for this talk
Pelagic fisheries study using GIS and Remote Sensing imagery in Galicia (Spain).
.") ICES CM 24/ P:44 (Physical-biological Interactions: Experiments, Models and Observation) Pelagic fisheries study using GIS and Remote Sensing imagery in Galicia (Spain). Jesús M. Torres Palenzuela, Gema
ICES CM 24/ P:44 (Physical-biological Interactions: Experiments, Models and Observation) Pelagic fisheries study using GIS and Remote Sensing imagery in Galicia (Spain). Jesús M. Torres Palenzuela, Gema
Mapping ecosystem services provided by benthic habitats in the European Atlantic Ocean
 Mapping and Assessment Ecosystem Services and Links to Good Environmental Status Mapping ecosystem services provided by benthic habitats in the European Atlantic Ocean Ibon Galparsoro, Angel Borja and
Marine Spatial Planning Leslie-Ann McGee Battelle Memorial Institute
 Marine Spatial Planning Leslie-Ann McGee Battelle Memorial Institute Rev061708 1 Marine Spatial Planning What is it? Why is it different? Where is it currently being employed? What is happening in the
Distributional changes of west coast species and impacts of climate change on species and species groups
 Distributional changes of west coast species and impacts of climate change on species and species groups Elliott Hazen 1 Ole Shelton 2 Eric Ward 2 1 NOAA Southwest Fisheries Science Center 2 NOAA Northwest
Spatial point processes in the modern world an
 Spatial point processes in the modern world an interdisciplinary dialogue Janine Illian University of St Andrews, UK and NTNU Trondheim, Norway Bristol, October 2015 context statistical software past to
Beyond MCMC in fitting complex Bayesian models: The INLA method
 Beyond MCMC in fitting complex Bayesian models: The INLA method Valeska Andreozzi Centre of Statistics and Applications of Lisbon University (valeska.andreozzi at fc.ul.pt) European Congress of Epidemiology
Courtesy of John Mitchell
 Shrimp trawl fisheries Marine fish stocks are under increasing threat from a range of spatially based problems that might be natural or involve socio-economic factors. To best manage spatial problems,
Offshore Video Survey and Oceanographic Analysis: Georges Bank to the Chesapeake project
 Non-Technical Synopsis of the Offshore Video Survey and Oceanographic Analysis: Georges Bank to the Chesapeake project Executive Summary Dave Bethoney Kristin Kleisner Mark Anderson Changsheng Chen Bradley
Modelling spatially sampled proportion processes
 1 Modelling spatially sampled proportion processes 2 Authors: Iosu Paradinas Departament d Estadística i Investigació Operativa, Universitat de València. C/ Dr. Moliner 50, Burjassot, 46100, Valencia,
Spatial dynamics of small pelagic fish in the California Current system on the regime time-scale. Parallel processes in other species-ecosystems.
 PICES/GLOBEC Symposium Honolulu, Hawaii April 19-21, 2006 Spatial dynamics of small pelagic fish in the California Current system on the regime time-scale. Parallel processes in other species-ecosystems.
Biogeographic Approach to Coastal Assessments & Spatial Planning
 NOAA s Biogeographic Approach to Coastal Assessments & Spatial Planning Mark E. Monaco Mark.Monaco@noaa.gov Center for Coastal Monitoring and Assessment http://ccma.nos.noaa.gov/about/biogeography Biogeography
Kristina Enciso. Brian Leung. McGill University Quebec, Canada
 Embracing uncertainty to incorporate biotic interactions into species distribution modeling: creating community assemblages using interactive community distribution models Kristina Enciso Brian Leung McGill
Flexible Spatio-temporal smoothing with array methods
 Int. Statistical Inst.: Proc. 58th World Statistical Congress, 2011, Dublin (Session IPS046) p.849 Flexible Spatio-temporal smoothing with array methods Dae-Jin Lee CSIRO, Mathematics, Informatics and
Falkland Island Fisheries Department. Golden Chicha (ZDLC1) Falkland Islands. Ignacio Payá. - March
 Falkland Islands. Ignacio Payá. - March") Falkland Island Fisheries Department Vessel Golden Chicha (ZDLC1) Flag Falkland Islands Dates 8/02/2008-23/02/2008 Author Ignacio Payá Scientific Crew Ignacio Payá, Anna Schuhbauer - March 2008 - SUMMARY
Falkland Island Fisheries Department Vessel Golden Chicha (ZDLC1) Flag Falkland Islands Dates 8/02/2008-23/02/2008 Author Ignacio Payá Scientific Crew Ignacio Payá, Anna Schuhbauer - March 2008 - SUMMARY
National Perspectives - Portugal. Margarida Almodovar
 National Perspectives - Portugal Margarida Almodovar margarida.almodovar@mam.gov.pt from base line to the external limit of the continental shelf behind 200 miles and according to UNCLOS definitions Economic
MODELLING SPATIALLY SAMPLED PROPORTION PROCESSES
 REVSTAT Statistical Journal Volume 16, Number 1, January 2018, 71 86 MODELLING SPATIALLY SAMPLED PROPORTION PROCESSES Authors: Iosu Paradinas Departament d Estadística i Investigació Operativa, Universitat
Towards a Joint Monitoring Programme for the North Sea and the Celtic Sea (JMP NS/CS)
") Towards a Joint Monitoring Programme for the North Sea and the Celtic Sea (JMP NS/CS) ACTIVITY E Tools for designing a joint monitoring programme and case study Elasmobranchs May 2015 Co-funded by the
Towards a Joint Monitoring Programme for the North Sea and the Celtic Sea (JMP NS/CS) ACTIVITY E Tools for designing a joint monitoring programme and case study Elasmobranchs May 2015 Co-funded by the
Tools for designing a joint monitoring programme
 Tools for designing a joint monitoring programme Anne Sell, Francisco Marco Rius, Julia Wischnewski, Gert Van Hoey Thünen Institute of Sea Fisheries, Germany Institute of Agriculture and Fishery research,
Advice September 2012
 9.4.23 Advice September 2012 ECOREGION STOCK Widely distributed and migratory stocks European seabass in the Northeast Atlantic Advice for 2013 ICES advises on the basis of the approach to data-limited
LAND CHANGE MODELER SOFTWARE FOR ARCGIS
 LAND CHANGE MODELER SOFTWARE FOR ARCGIS The Land Change Modeler is revolutionary land cover change analysis and prediction software which also incorporates tools that allow you to analyze, measure and
Using GIS to locate hotspots for bluefin tuna
 Using GIS to locate hotspots for bluefin tuna Rob Schick 1 & Molly Lutcavage 2 1 Southwest Fisheries Science Center/Santa Cruz Lab 2 UNH Department of Zoology Bluefin and SST fronts We looked at 3 years
The Environmental Classification of Europe, a new tool for European landscape ecologists
 The Environmental Classification of Europe, a new tool for European landscape ecologists De Environmental Classification of Europe, een nieuw gereedschap voor Europese landschapsecologen Marc Metzger Together
Synthesis and Integrated Modeling of Long-term Data Sets to Support Fisheries and Hypoxia Management in the Northern Gulf of Mexico
 Synthesis and Integrated Modeling of Long-term Data Sets to Support Fisheries and Hypoxia Management in the Northern Gulf of Mexico Dan Obenour (Scientific/Hypoxia PI) Kevin Craig (Applications/Fisheries
MEMORANDUM OF UNDERSTANDING ON THE CONSERVATION OF MIGRATORY SHARKS HABITAT CONSERVATION. (Prepared by the Advisory Committee)
") MEMORANDUM OF UNDERSTANDING ON THE CONSERVATION OF MIGRATORY SHARKS CMS/Sharks/MOS3/Doc.10.2 24 August 2018 Original: English 3 rd Meeting of the Signatories (Sharks MOS3) Monaco, 10 14 December 2018 Agenda
MEMORANDUM OF UNDERSTANDING ON THE CONSERVATION OF MIGRATORY SHARKS CMS/Sharks/MOS3/Doc.10.2 24 August 2018 Original: English 3 rd Meeting of the Signatories (Sharks MOS3) Monaco, 10 14 December 2018 Agenda
Abstract. Introduction
 Southern California Aquaculture Site Assessment Model Caitlyn Raines University of Redlands Master of Science in Geographic Information Systems Program Abstract The Southern California Aquaculture Site
Part I History and ecological basis of species distribution modeling
 Part I History and ecological basis of species distribution modeling Recent decades have seen an explosion of interest in species distribution modeling. This has resulted from a confluence of the growing
Outline. - Background of coastal and marine conservation - Species distribution modeling (SDM) - Reserve selection analysis. - Results & discussion
 - Reserve selection analysis. - Results & discussion") Application of GIS for data preparation and modeling for coastal and marine conservation planning in Madagascar Rija Rajaonson Technical Assistant, REBIOMA Wildlife Conservation Society Madagascar Outline
Application of GIS for data preparation and modeling for coastal and marine conservation planning in Madagascar Rija Rajaonson Technical Assistant, REBIOMA Wildlife Conservation Society Madagascar Outline
A Small Migrating Herd. Mapping Wildlife Distribution 1. Mapping Wildlife Distribution 2. Conservation & Reserve Management
 A Basic Introduction to Wildlife Mapping & Modeling ~~~~~~~~~~ Rev. Ronald J. Wasowski, C.S.C. Associate Professor of Environmental Science University of Portland Portland, Oregon 8 December 2015 Introduction
Spatial differences in biological characteristics of Loligo forbesi (Cephalopoda: Loliginidae) in the Northeast Atlantic
 in the Northeast Atlantic") International Council for the Exploration of the Sea CM 4/CC:3 Cephalopod Stocks: Review, Analysis, Assessment, and Sustainable Management. (Session CC) Spatial differences in biological characteristics
International Council for the Exploration of the Sea CM 4/CC:3 Cephalopod Stocks: Review, Analysis, Assessment, and Sustainable Management. (Session CC) Spatial differences in biological characteristics
ACRONYMS AREAS COUNTRIES MARINE TERMS
 Natura 2000 ACRONYMS AREAS COUNTRIES MARINE TERMS DEFINITION A European network of protected sites under the European Habitats and Birds Directives, aiming to protect the most valuable and threatened European
HELSINKI COMMISSION Baltic Marine Environment Protection Commission
 HELSINKI COMMISSION Baltic Marine Environment Protection Commission HELCOM RECOMMENDATION 24/10 Adopted 25 June 2003, having regard to Article 20, Paragraph 1 b) of the 1992 Helsinki Convention IMPLEMENTATION
Modeling Fish Assemblages in Stream Networks Representation of Stream Network Introduction habitat attributes Criteria for Success
 Modeling Fish Assemblages in Stream Networks Joan P. Baker and Denis White Western Ecology Division National Health & Environmental Effects Research Laboratory U.S. Environmental Protection Agency baker.joan@epa.gov
A State-Space Model for Abundance Estimation from Bottom Trawl Data with Applications to Norwegian Winter Survey
 Dept. of Math. University of Oslo Statistical Research Report No 1 ISSN 0806 3842 September 2015 A State-Space Model for Abundance Estimation from Bottom Trawl Data with Applications to Norwegian Winter
Bayesian SAE using Complex Survey Data Lecture 4A: Hierarchical Spatial Bayes Modeling
 Bayesian SAE using Complex Survey Data Lecture 4A: Hierarchical Spatial Bayes Modeling Jon Wakefield Departments of Statistics and Biostatistics University of Washington 1 / 37 Lecture Content Motivation
Marine ecosystem mapping at the Prince Edward Islands
 Marine ecosystem mapping at the Prince Edward Islands Biodiversity Planning Forum NBA special session June 2018 R Adams, C von der Meden, A Dayaram, K Sink, A Lombard, A Bosman, M Dopolo, F Fourie, L Harris,
NGSS Example Bundles. Page 1 of 23
 High School Conceptual Progressions Model III Bundle 2 Evolution of Life This is the second bundle of the High School Conceptual Progressions Model Course III. Each bundle has connections to the other
Estimating the distribution of demersal fishing effort from VMS data using hidden Markov models
 Estimating the distribution of demersal fishing effort from VMS data using hidden Markov models D.L. Borchers Centre for Research into Ecological and Environmental Modelling, The Observatory, Buchanan
New Zealand Fisheries Assessment Report 2017/26. June J. Roberts A. Dunn. ISSN (online) ISBN (online)
 ISBN (online)") Investigation of alternative model structures for the estimation of natural mortality in the Campbell Island Rise southern blue whiting (Micromesistius australis) stock assessment (SBW 6I) New Zealand
Investigation of alternative model structures for the estimation of natural mortality in the Campbell Island Rise southern blue whiting (Micromesistius australis) stock assessment (SBW 6I) New Zealand
Community Structure. Community An assemblage of all the populations interacting in an area
 Community Structure Community An assemblage of all the populations interacting in an area Community Ecology The ecological community is the set of plant and animal species that occupy an area Questions
ENGRG Introduction to GIS
 ENGRG 59910 Introduction to GIS Michael Piasecki October 13, 2017 Lecture 06: Spatial Analysis Outline Today Concepts What is spatial interpolation Why is necessary Sample of interpolation (size and pattern)
Forecast of Nearshore Wave Parameters Using MIKE-21 Spectral Wave Model
 Forecast of Nearshore Wave Parameters Using MIKE-21 Spectral Wave Model Felix Jose 1 and Gregory W. Stone 2 1 Coastal Studies Institute, Louisiana State University, Baton Rouge, LA 70803 2 Coastal Studies
The University of Texas at Austin. Icebox Model Projections for Sea Level Fall in the Gulf Coast and Caribbean Sea Region
 The University of Texas at Austin Icebox Model Projections for Sea Level Fall in the Gulf Coast and Caribbean Sea Region Lizzadro-McPherson, Daniel J. December 3rd, 2015 Introduction Many climate scientists
Role of macrofauna and the impacts of natural and anthropogenic disturbance on sediment biogeochemical processes (Module 3)
") Biogeochemistry, macronutrient and carbon cycling in the benthic layer (BMCC) WP2 Role of macrofauna and the impacts of natural and anthropogenic disturbance on sediment biogeochemical processes (Module
Biogeochemistry, macronutrient and carbon cycling in the benthic layer (BMCC) WP2 Role of macrofauna and the impacts of natural and anthropogenic disturbance on sediment biogeochemical processes (Module
IUCN Red List Process. Cormack Gates Keith Aune
 IUCN Red List Process Cormack Gates Keith Aune The IUCN Red List Categories and Criteria have several specific aims to provide a system that can be applied consistently by different people; to improve
Introduction. Chapter 1
 Chapter 1 Introduction In this book we will be concerned with supervised learning, which is the problem of learning input-output mappings from empirical data (the training dataset). Depending on the characteristics
Functional Diversity. By Morgan Davies and Emily Smith
 Functional Diversity By Morgan Davies and Emily Smith Outline Introduction to biodiversity and functional diversity How do we measure functional diversity Why do we care about functional diversity Applications
MESMA: An integrated tool box to support an ecosystem based spatial management of marine areas
 MESMA: An integrated tool box to support an ecosystem based spatial management of marine areas Stelzenmüller, V., Stamford, T., Vassilopoulou, V., Kastanevakis, S., Vincx, M, Vanaverbeke, J., Rabaut, M.,
Marine Spatial Planning (MSP): A practical approach to ecosystembased
: A practical approach to ecosystembased") Marine Spatial Planning (MSP): A practical approach to ecosystembased management Erik Olsen, Institute of Marine Research, Norway Fanny Douvere, International Oceanographic Commission Overview Why we need
Marine Spatial Planning (MSP): A practical approach to ecosystembased management Erik Olsen, Institute of Marine Research, Norway Fanny Douvere, International Oceanographic Commission Overview Why we need
Linking Global and Regional Levels in the Management of Marine Areas Beyond National Jurisdiction
 Linking Global and Regional Levels in the Management of Marine Areas Beyond National Jurisdiction South Atlantic Region Session 4: «Experiences, Priorities and Opportunities in the South Atlantic and Indian
VCS MODULE VMD0018 METHODS TO DETERMINE STRATIFICATION
 VMD0018: Version 1.0 VCS MODULE VMD0018 METHODS TO DETERMINE STRATIFICATION Version 1.0 16 November 2012 Document Prepared by: The Earth Partners LLC. Table of Contents 1 SOURCES... 2 2 SUMMARY DESCRIPTION
COMMISSION STAFF WORKING DOCUMENT IMPACT ASSESSMENT. Accompanying the document PROPOSAL FOR A REGULATION OF THE EUROPEAN PARLIAMENT AND OF THE COUNCIL
 EUROPEAN COMMISSION Brussels, 8..8 SWD(8) 6 final PART /6 COMMISSION STAFF WORKING DOCUMENT IMPACT ASSESSMENT Accompanying the document PROPOSAL FOR A REGULATION OF THE EUROPEAN PARLIAMENT AND OF THE COUNCIL
WP 2. Data Collection Framework analysis
 DISCATCH 2nd Stakeholder Meeting, Madrid 11 June 2015 Pilot project Catch and discard composition including solutions for limitation and possible elimination of unwanted by-catches in trawl net fisheries
Biogeochemical modelling and data assimilation: status in Australia
 Biogeochemical modelling and data assimilation: status in Australia Richard Matear, Andrew Lenton, Matt Chamberlain, Mathieu Mongin, Emlyn Jones, Mark Baird www.cmar.csiro.au/staff/oke/ Biogeochemical
Blue and Fin Whale Habitat Modeling from Long-Term Year-Round Passive Acoustic Data from the Southern California Bight
 DISTRIBUTION STATEMENT A. Approved for public release; distribution is unlimited. Blue and Fin Whale Habitat Modeling from Long-Term Year-Round Passive Acoustic Data from the Southern California Bight
Incorporating Boosted Regression Trees into Ecological Latent Variable Models
 Incorporating Boosted Regression Trees into Ecological Latent Variable Models Rebecca A. Hutchinson, Li-Ping Liu, Thomas G. Dietterich School of EECS, Oregon State University Motivation Species Distribution
BAYESIAN MODEL FOR SPATIAL DEPENDANCE AND PREDICTION OF TUBERCULOSIS
 BAYESIAN MODEL FOR SPATIAL DEPENDANCE AND PREDICTION OF TUBERCULOSIS Srinivasan R and Venkatesan P Dept. of Statistics, National Institute for Research Tuberculosis, (Indian Council of Medical Research),
Toward Environmental Predictions MFSTEP. Executive summary
 Research Project co-funded by the European Commission Research Directorate-General 5 th Framework Programme Energy, Environment and Sustainable Development Contract No. EVK3-CT-2002-00075 Project home
California Sea Grant College Program
 California Sea Grant College Program Research Completion Reports (University of California, San Diego) Year 2006 Paper MA06 01 Empirical evaluation of regional scale marine reserves and the groundfish
Machine Learning Linear Classification. Prof. Matteo Matteucci
 Machine Learning Linear Classification Prof. Matteo Matteucci Recall from the first lecture 2 X R p Regression Y R Continuous Output X R p Y {Ω 0, Ω 1,, Ω K } Classification Discrete Output X R p Y (X)
2001 State of the Ocean: Chemical and Biological Oceanographic Conditions in the Newfoundland Region
 Stock Status Report G2-2 (2) 1 State of the Ocean: Chemical and Biological Oceanographic Conditions in the Background The Altantic Zone Monitoring Program (AZMP) was implemented in 1998 with the aim of
17-20 November 2007 Incidental Take Monitoring Methodology and Results
 Sample Site Selection Protocol 17-20 November 2007 Incidental Take Monitoring Methodology and Results On 16 November 2007, the U.S. Fish and Wildlife Service (USFWS) provided the USACE Mobile District
Complementary information to the Commission's Impact Assessment. European Parliament Meeting of the Fisheries Committee Brussels 18 June 2013
 Commission Proposal for a Regulation of the European Parliament and of the Council establishing specific conditions to fishing in international waters of the North-East Atlantic and repealing Regulation
J.P. Glazer and D.S. Butterworth
 A summary of the General Linear Modelling approach applied to standardize the CPUE data for the offshore trawl fishery for Merluccius capensis and M. paradoxus off the coast of South Africa. Introduction
Salinity Gradients in the Mission-Aransas National Estuarine Research Reserve. Kimberly Bittler GIS and Water Resources Fall 2011
 Salinity Gradients in the Mission-Aransas National Estuarine Research Reserve Kimberly Bittler GIS and Water Resources Fall 2011 INTRODUCTION Freshwater inflow has a widely recognized influence on estuary
Factors affecting the large scale distribution of deep sea corals and sponges in the Alaskan ecosystems of the North Pacific Ocean
 Factors affecting the large scale distribution of deep sea corals and sponges in the Alaskan ecosystems of the North Pacific Ocean Chris Rooper, Rachel Wilborn, and Pamela Goddard Alaska Fisheries Science
MODELS AND TOOLS FOR GOVERNANCE OF
 Working Papers Collection No. 1/2015 MODELS AND TOOLS FOR GOVERNANCE OF THE ADRIATIC AND IONIAN SEAS www.unimc.it/maremap NATIONAL POLITICS AND EU POLITICS: THE MARITIME SPATIAL PLANNING AND INTEGRATED
NORGES TEKNISK-NATURVITENSKAPELIGE UNIVERSITET
 NORGES TEKNISK-NATURVITENSKAPELIGE UNIVERSITET Investigating posterior contour probabilities using INLA: A case study on recurrence of bladder tumours by Rupali Akerkar PREPRINT STATISTICS NO. 4/2012 NORWEGIAN
ECE521 week 3: 23/26 January 2017
 ECE521 week 3: 23/26 January 2017 Outline Probabilistic interpretation of linear regression - Maximum likelihood estimation (MLE) - Maximum a posteriori (MAP) estimation Bias-variance trade-off Linear
BIOLOGICAL OCEANOGRAPHY
 BIOLOGICAL OCEANOGRAPHY AN INTRODUCTION 0 ^ J ty - y\ 2 S CAROL M. LALLI and TIMOTHY R. PARSONS University of British Columbia, Vancouver, Canada PERGAMON PRESS OXFORD NEW YORK SEOUL TOKYO ABOUT THIS VOLUME
Setting Priorities for Eelgrass Conservation and Restoration. Robert Buchsbaum Massachusetts Audubon Society
 Setting Priorities for Eelgrass Conservation and Restoration Robert Buchsbaum Massachusetts Audubon Society Eelgrass habitat values A rich, productive habitat for many marine organisms Nursery habitat
Bryan F.J. Manly and Andrew Merrill Western EcoSystems Technology Inc. Laramie and Cheyenne, Wyoming. Contents. 1. Introduction...
 Comments on Statistical Aspects of the U.S. Fish and Wildlife Service's Modeling Framework for the Proposed Revision of Critical Habitat for the Northern Spotted Owl. Bryan F.J. Manly and Andrew Merrill
AUTOCORRELATION OF PELAGIC FISH CATCH RATES. Kristin Kleisner David Die
 MODELING THE SPATIAL AUTOCORRELATION OF PELAGIC FISH CATCH RATES Kristin Kleisner David Die John F. Walter, III Spatial Geostatistics and Fisheries Typically use geostatistics for sessile species habitat
QUANTITATIVE INTERPRETATION
 QUANTITATIVE INTERPRETATION THE AIM OF QUANTITATIVE INTERPRETATION (QI) IS, THROUGH THE USE OF AMPLITUDE ANALYSIS, TO PREDICT LITHOLOGY AND FLUID CONTENT AWAY FROM THE WELL BORE This process should make
Designing Networks of Marine Protected Areas in DFO s Three Atlantic Bioregions
 Designing Networks of Marine Protected Areas in DFO s Three Atlantic Bioregions Presentation for Indigenous Protected Areas Workshop Max Westhead, DFO and Adrian Gerhartz-Abraham, Dalhousie March 29, 2017
Stewardship of the Central Arctic Ocean: The Arctic 5 versus the international community
 Stewardship of the Central Arctic Ocean: The Arctic 5 versus the international community The Central Arctic Ocean Ilulissat Declaration 2008 By virtue of their sovereignty, sovereign rights and jurisdiction
of a landscape to support biodiversity and ecosystem processes and provide ecosystem services in face of various disturbances.
 L LANDSCAPE ECOLOGY JIANGUO WU Arizona State University Spatial heterogeneity is ubiquitous in all ecological systems, underlining the significance of the pattern process relationship and the scale of
STATISTICS-STAT (STAT)
") Statistics-STAT (STAT) 1 STATISTICS-STAT (STAT) Courses STAT 158 Introduction to R Programming Credit: 1 (1-0-0) Programming using the R Project for the Statistical Computing. Data objects, for loops,
Statistics-STAT (STAT) 1 STATISTICS-STAT (STAT) Courses STAT 158 Introduction to R Programming Credit: 1 (1-0-0) Programming using the R Project for the Statistical Computing. Data objects, for loops,
Lectures 5 & 6: Hypothesis Testing
 Lectures 5 & 6: Hypothesis Testing in which you learn to apply the concept of statistical significance to OLS estimates, learn the concept of t values, how to use them in regression work and come across
Appendix I: Geographic Information System Data Sources
 Appendix I: Geographic Information System Data Sources Draft Environmental Impact Statement/Overseas Environmental Impact Statement Hawaii-Southern California Training and Testing TABLE OF CONTENTS...
STA 4273H: Statistical Machine Learning
 STA 4273H: Statistical Machine Learning Russ Salakhutdinov Department of Statistics! rsalakhu@utstat.toronto.edu! http://www.utstat.utoronto.ca/~rsalakhu/ Sidney Smith Hall, Room 6002 Lecture 3 Linear
Application of GIS in Marine Fisheries Trawl Surveys
 Philip Politis NRS 509, Fall 2003 Application of GIS in Marine Fisheries Trawl Surveys The goal of fisheries managers today is to achieve sustainability in our marine fisheries resources. Trawl surveys
Appendix 1: UK climate projections
 Appendix 1: UK climate projections The UK Climate Projections 2009 provide the most up-to-date estimates of how the climate may change over the next 100 years. They are an invaluable source of information
SPATIAL AND SPATIO-TEMPORAL BAYESIAN MODELS WITH R - INLA BY MARTA BLANGIARDO, MICHELA CAMELETTI
 Read Online and Download Ebook SPATIAL AND SPATIO-TEMPORAL BAYESIAN MODELS WITH R - INLA BY MARTA BLANGIARDO, MICHELA CAMELETTI DOWNLOAD EBOOK : SPATIAL AND SPATIO-TEMPORAL BAYESIAN MODELS WITH R - INLA
EUSAIR on sea topics from Slovenian perspective
 MINISTRY OF FOREIGN AFFAIRS REPUBLIC OF SLOVENIA EUSAIR on sea topics from Slovenian perspective Mag. Andreja Jerina National Coordinator 4 EU MRS: 270 millions of population 19 MS 12 non MS Sea basin
An international research expedition assess the biodiversity and health of New Caledonia coral reefs
 Nouméa, 28.11.2013. An international research expedition assess the biodiversity and health of New Caledonia coral reefs A research mission on coral reefs in New Caledonia conducted in association with
Directorate E: Sectoral and regional statistics Unit E-4: Regional statistics and geographical information LUCAS 2018.
 EUROPEAN COMMISSION EUROSTAT Directorate E: Sectoral and regional statistics Unit E-4: Regional statistics and geographical information Doc. WG/LCU 52 LUCAS 2018 Eurostat Unit E4 Working Group for Land
Bayesian statistics and modelling in ecology
 Bayesian statistics and modelling in ecology Prof Paul Blackwell University of Sheffield, UK February 2011 Bayesian statistics Bayesian statistics: the systematic use of probability to express uncertainty
Species distribution modelling with MAXENT Mikael von Numers Åbo Akademi
 Species distribution modelling with MAXENT Mikael von Numers Åbo Akademi Why model species distribution? Knowledge about the geographical distribution of species is crucial for conservation and spatial
Bayesian dynamic modeling for large space-time weather datasets using Gaussian predictive processes
 Bayesian dynamic modeling for large space-time weather datasets using Gaussian predictive processes Alan Gelfand 1 and Andrew O. Finley 2 1 Department of Statistical Science, Duke University, Durham, North