Space Syntax and Pervasive Systems
|
|
|
- Laura Robbins
- 6 years ago
- Views:
Transcription
1 Space Syntax and Pervasive Systems Vassilis Kostakos 1 Abstract In this paper we describe our novel use of space syntax for the design and development of pervasive systems. Pervasive systems are computer systems that are designed to be invisible to users because they are designed to blend in with their environment and become part of the fabric of everyday life. Pervasive systems consist of fixed, mobile and embedded components, each of which may entail interactive capabilities and intelligence. Due to their close relationship with the build environment, pervasive systems are an ideal domain for adopting a space syntax methodology. The contribution of this paper is two-fold. First, we present an adaptation of the space syntax methodology aimed at researchers and designers of space and pervasive systems. By developing an adaptation of the space syntax methodology we intend for space syntax to be added the arsenal of tools and theories that researchers use to understand and design pervasive systems. To exemplify how this can be achieved, we present three case studies that demonstrate crucial ways in which space syntax analysis can aid the design of pervasive systems. The case studies presented here show how space syntax can be used in the development of pervasive system as an application development tool, as an exploratory tool, and as a modelling tool. Keywords Space Syntax, Pervasive and Ubiquitous Computing, Observation, Methodology, Applications. 1 Introduction The relationship between computers and space is a topic that has persisted throughout the various advances in computer science, as early as when the first Multi User Dungeons (MUDs) were developed (Muramatsu and Ackerman 1998). With the advent of personal computers, researchers began considering the relationship between physical space and digital space (Dix 2000; Dix 2003) and examined how to optimise this relationship and convey it to users. Advances in 1 University of Madeira, and Carnegie Mellon University B. Jiang and X. Yao (Eds.) Geospatial Analysis and Modeling of Urban Structure and Dynamics, Springer Science + Business Media B.V. 2009
2 Kostakos, V. graphics enabled the development of virtual reality systems, in turn sparking a wave of interest in virtual space and its potential for replacing real space (e.g. Shiode and Kanoshima 1999). The popularity of the Internet, the World Wide Web, and online systems gave rise to research on cyberspace (e.g. Spinello 2000), interaction space (O Neill et al. 1999), and social space (Harrison and Dourish 1996). All such work suggests that computer systems generate various types of space that as designers we must understand, manipulate and optimise. Interestingly, while some theories consider digital and virtual space as potential alternatives to physical spaces, today we see that physical space is more important than ever before. With urbanisation levels reaching more than 50% for the first time in history (United Nations 2007), visions suggesting the end of cities and the rise of cyber cities seem more and more out of touch. As Stephen Graham suggests, We are not experiencing some wholesale, discrete break with the urban past ushered in by the impacts of new technology. Rather, we are experiencing a complex and infinitely diverse range of transformations where new and old practices and media technologies become mutually linked and fused in an ongoing blizzard of change (Graham 2005, pp 96). Urban space has become more relevant than ever, especially in light of pervasive systems operating at the urban scale. As the field of pervasive systems matures, the models, theories, and tools used in our research evolve. Hence, as computers move away from the desktop and into our cities and our lives, we need new theories and tools to help us understand the relationship between urban space and our systems. Urban space is now the infrastructure on top of which our pervasive systems operate (Dourish and Bell 2007). In an attempt to systematically incorporate this infrastructure in our systems, we here present our novel adaptation of space syntax (SS) and its use in the design and development of pervasive systems. To acquaint the reader with SS s concepts and methodology, we first describe SS and present its main ideas from the perspective of pervasive systems. We then present three case studies demonstrating our novel application and extension of SS in the course of designing pervasive systems. Our main contributions are, first, the adaptation and operationalisation of SS for use in pervasive computing, and second the use of SS to develop pervasive systems. 2 Space Syntax Space syntax, much like pervasive computing, is a relatively young and multidisciplinary domain. The central concept behind SS is that the configuration of space, rather than space itself, is the driving force behind how cities operate. Architectural and urban design, both in their formal and spatial aspects, are seen as configurations in that the way the parts are put together to form the whole is more important than any of the parts taken in isolation. The first major publication on SS
3 Space syntax and Pervasive Systems came in 1984 where Hillier and Hanson set out a theory of space as an aspect of social life (Hillier and Hanson 1984). In his second major publication Hillier (1996) brought together an array of configuration analysis techniques and applied them to issues of architectural and urban theory. What sets SS apart from other architectural theories is that SS aims to explain how cities are, rather than how cities ought to be. The basic motivation of SS is the realisation that in addition to functioning as bodily protection, buildings operate socially in two ways: they constitute the social organisation of everyday life, and they represent social organisation. The initial research finding that motivated the development of SS is that, ceteris paribus, movement in cities is generated by the configuration of the cities streets. This fundamental relationship underlies many aspects of cities including the distribution of land use and the spatial patterning of crime. SS research has shown that ineffective configuration in cities or housing estates can cause social segregation and antisocial behaviour. Such examples have given rise to the notion of good, or bad, syntax. To better illustrate this point, Hillier provides an analogy between architecture and language. Language is often naively conceptualised as a set of words and meanings, set out in a dictionary, and syntactic rules by which they may be combined into meaningful sentences, set out in grammars. This is not what language is, and the laws that govern language are not of this kind. This can be seen from the simple fact that if we take the words of the dictionary and combine them in grammatically correct sentences, virtually all are utterly meaningless and do not count as legitimate sentences. (Hillier 1996, pp 7). Similarly, successful architecture is not just about simply constructing streets and connecting buildings, and neighbourhoods; it is about how we connect the different parts of a city, neighbourhood or building. 2.1 Operationalisation We note that while SS covers a multitude of topics, including vision, isovists, and indoor space, here we focus on the application of SS to urban space. While cities are extremely rich in many respects, SS focuses on a single property: spatial configuration. All claims, findings, and understandings of SS derive from the analysis of spatial configuration. While SS is applied to both indoor and outdoor spaces, here we focus on the outdoor and urban use of SS Axial maps The fundamental premise of SS is that every city can be represented as an axial map. A city s axial map can be derived by simply drawing the set of least and longest straight lines (axial lines) such that all open spaces have an axial line passing through them. The next step in the analysis is to transform the axial map into a
4 Kostakos, V. graph. This transformation is a unique aspect of SS as it results in graphs that, at first, seem counter-intuitive (Figure 1). a) b) c) Fig. 1 a) map of city, b) axial map, c) graph representation. An axial map is transformed into a graph by representing each axial line as a node, and linking the nodes (i.e. axes) that intersect in the axial map. This graph representation is the edge-vertex dual of how we intuitively represent maps: street intersections as nodes and streets as edges. SS uses the opposite: streets become nodes, and intersections become links. It is worth highlighting the fact that in SS analysis streets become nodes. Each street, irrespective of its width, length, and location, is represented as a single node in the graph. This is an extremely powerful representation, because it enables researchers to identify concrete metrics for each street in a city. This is achieved by carrying out analysis of the graph, and deriving numerous metrics for each node (i.e. street) Metrics A city graph can be analysed in terms of its properties such as the integration of nodes. In SS, integration describes the deepness or shallowness of a node in relation to the other nodes in the graph. To arrive at a highly integrated street, pedestrians require on average fewer changes of direction (assuming a change of direction means changing streets). On the other hand, less integrated streets are relatively isolated from other streets, and require more changes of directions to get to them. Typical examples of highly integrated streets are high streets, while culde-sacs and alleyways are usually less integrated. Readers may realise that the metric of integration is identical to the concept of distance in traditional graph analysis. In fact, SS utilises many traditional graph metrics, but has developed its own jargon when referring to them. Additionally, SS researchers have developed new metrics. In Table 1 we show the most popular
5 Space syntax and Pervasive Systems metrics used by SS, their conventional name (if one exists), and their definition and description. space syntax Graph theory Description / Definition Integration Closeness The mean distance between an axis and all other axes of the system. Connectivity Degree The connectivity of axis i is the number of axes that it intersects. Choice Betweeness The number of times axis i is used when calculating the shortest paths between all pairs of axes in a system. Control - The degree to which axis i controls access from and to the axis it intersects. Global metric - A metric for an individual axis, calculated using the whole system. Local metric - A metric for an individual axis, calculated using the axis neighborhood (e.g. axes up to three intersections away). Intelligibility - The correlation between axes connectivity and global integration Synergy - The correlation between axes local and global integration. PageRank PageRank The popularity of an axis i as determined by the number of popular axes intersecting axis i (recursive) Table 1 Table basic space syntax metrics. For each metric we give the corresponding graph theory terminology (if it exists), along with a definition and description of the metric. Connectivity is a metric used to describe the number of streets that any particular street intersects. (Note that in terms of SS, streets and axes are identical, since all metrics are calculated based on the axial map representation shown in Figure 1b). Control is a metric that describes the extent to which an axis, or street, controls access to and from streets that it intersects. For instance, a street i connected to multiple cul-de-sacs has high control, as anyone wishing to go to the cul-de-sacs must use street i. Similarly, choice is a metric that describes the importance of a node in the context of a greater system. An axis i with high choice indicates that many shortest paths between pairs of axis use axis i. In other words, axis i is utilised by many pedestrians wishing to follow the shortest path to their destination. The metrics we describe here may be applied globally or locally. Global metrics consider the whole system when calculating a property of an axis, while local
6 Kostakos, V. metrics consider only the immediate neighbourhood of an axis. For instance, global integration describes the mean distance between an axis and all other axes of the system. Local integration, on the other hand, describes the mean distance between an axis and its immediate neighbourhood. Thus, local integration of radius 3 considers an axis neighbourhood up to three intersections away. Calculating the correlation of one metric with another generates a number of metrics. For instance, a city s intelligibility is the correlation between axes connectivity and global integration. In other words, intelligibility is a measure of how well we can predict an axis global integration given its connectivity, and vice versa. Practically, intelligible urban grids offer a good correlation between what pedestrians can see, and what they cannot see. A similar metric is synergy, which describes the correlation between axes local and global integration. This metric considers how well we can understand a neighbourhood given an understanding of a city, and vice versa. More recently, the PageRank algorithm (originally used by Google search) has been shown to provide a very good correlation with pedestrian movement (Jiang 2008; Jiang et al. 2008). It provides a means for relatively ranking the importance of an axis i by considering the importance of the axes pointing to i. 2.2 Data collection and observation An integral part of SS involves data collection, either through observation or analysis of publicly available data sources. While axial maps and graphs offer concrete metrics, it is only through observation and further data collection that one may understand how a city operates on an aggregate level. In the course of their work, some researchers may be interested in the economic aspects of the city, while others might focus, for example, on the flow of pedestrians. It is through data collection and observation that SS can make claims about such aspects of a city. Using correlation, SS analyses observational data in relation to the structural properties of streets described in the previous section. We now give examples of the most popular data sources utilised by SS, and then describe the techniques used to gather empirical data Data sources There is a virtually endless list of data sources that SS can utilise, provided that they are appropriately geo-tagged. This means that the data must be attributable to specific streets in a city. Examples of such data include statistics on crime, land use, land use change, movement & flows, economic growth, safety, social status, work habits, shopping behaviour, quality of life, demographics, prostitution, and human encounter. All these data sources can be utilised by SS, if they are fine-

7 Space syntax and Pervasive Systems grained enough to enable researchers to attribute this data to specific streets of a city. In addition to utilising existing datasets, SS employs three primary observational techniques, which enable researchers to gather data on people s use of cities. These techniques are gatecounts, static snapshots, and trails Gatecounts Gatecounts are used to establish the actual flows of people throughout the city over the course of a day. A gate is a conceptual line across a street, and gatecounts entail counting the number of people crossing that line. Using this technique the observer stands on the street and counts the number of people crossing the gate in either direction. A typical two-day observation (complemented by a one-day pilot) will involve about 100 gates throughout the city, as shown in Figure 2a (taken from one of our own studies). Here we counted the number of people crossing each gate, and to do so we deployed multiple observers. Our 12 observers took five-minute samples from each gate in five cycles throughout the day, from 8:30 a.m. to 4:00 p.m. over two days.
 to blue (low flow).")
8 Kostakos, V. Fig. 2 Gatecounts. In the top, a map of the city marked with the location of the gates. At the bottom, the observed flows of pedestrians, colour-coded from red (high flow) to blue (low flow). In Figure 2b we see a colour-coded graph of the observed flows of people, ranging from high flows of people per hour (red) to low flows of 250 people per hour or less (blue). This enables us to correlate between the (SS) predicted and actual flows of people across the city. In this manner we are able to identify the general trend of the city, as well as some outliers - i.e. streets that are over-performing or under-performing (in terms of pedestrian flows) in relation to their integration Static snapshots The next SS observation method we consider is static snapshots, in which various open spaces of the city are considered in detail (Figure 3). The method can be used for recording both stationary and moving activities, and is useful when a direct comparison is being made between the two types of space use. A strength of this method is that it makes the patterns of space use in an urban area apparent. For each open space under consideration, the observers record the movements in and out of the space, as well as the type of activity taking place in the space.


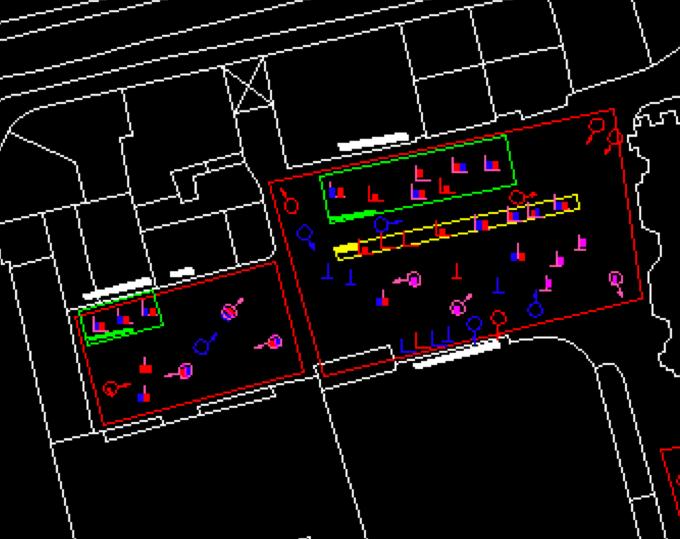
9 Space syntax and Pervasive Systems

10 Kostakos, V. Fig. 3 Static snapshots. The top shows a map of a city, with multiple convex spaces identified. The middle and bottom shows the static and mobile activity as recorded in one such space. In Figure 3 we present a sample observation of people s movement within a particular city. The top of Figure 3 shows the map of a city, with marked convex spaces where observation is to take place. For one such space we show our observation of static (middle of Figure 3) and moving activities (bottom of Figure 3). Here, we identify the entry and exit points that people used throughout the day. This gives us an understanding of how people perceive a particular space, and how it is utilised. For example, we may observe that a seating area in a park is actually not used for seating but for playing by children. A common observation is use of certain spaces by people making calls on the mobile phone or using their laptops. In Figure 3 we see our observations of people s activities in this space. We differentiated between instances of males, females, children, or groups of people. For each instance we recorded if they were standing or sitting, and also commented on their behaviour and activities Trails A third method used for understanding the urban landscape is called trails, or people following. This involves tracing the movement of a specific person or group for a fixed time period (e.g. three minutes as shown in Figure 4). This is an increasingly important technique for observing movement that disperses from a spe-

11 Space syntax and Pervasive Systems cific movement distributor for example, a train station or a shopping mall. It can be used to investigate three specific issues: The pattern of movement from a specific location, The relationship of a route to other routes in the area, and The average distance people walk from the specific location (this can help determine the pedestrian catchment area of architectural spaces such as a retail facility or public square). Fig. 4 Trails. A set of 3-minute trails are shown here, indicated by a beginning (circle) and end (triangle). Trails give us a sense of how people use the city in different ways. A mother pushing a pram will follow different routes compared to a young student or a tourist. In Figure 4 the two large trails at the bottom show two people walking at a fast pace who decided to take alternative routes for similar beginning and destination points. We also see at the top of Figure 4 two slow-paced pedestrians originating from the same location but going to different destinations. As part of this method, observed trails are augmented by comments that the observer can attach to a trail. Typically, trails are collected by people following or manual observation, but GPS trails can also be used. 2.3 Empirical results SS researchers have explored various aspects of space and cities in terms of axial maps. Aspects such as pedestrian flow, space use density, crime, cognitive maps,
12 Kostakos, V. and intelligibility, have been considered in relation to SS. Here we provide a brief overview of their results. The correlation between pedestrian movement and spatial integration has been elaborated in (Hillier and Hanson 1984), while further studies have identified this correlation in relation to a large sample of cities and towns (Hillier et al. 1987), galleries (Hillier 1996; Peponis et al. 2004), office buildings and workspaces (Sailer and Penn 2007; Peponis et al. 1997), and even research laboratories (Hillier et al. 1985). While the observational evidence provides strong correlations, causality has not been determined to date. The recent identification of PageRank as a metric that correlates extremely well with pedestrian movement may provide some insight into a possible causality (Jiang 2008; Jiang et al. 2008) In an attempt to understand the effect of space on cognition, the authors in (Kim and Penn 2004) analysed people s cognitive maps using SS. Their results suggest that the image of spatial configuration maintained in cognitive maps is highly associated with that of the physical built environment. The strong correlation between sketch maps and purely configurational measures of spatial patterns suggest that configurational and relational properties of spatial patterns are perhaps more important for the purposes of navigation than is precise local information. A further aspect of the relationship between space and movement is highlighted by the differences between weakly and strongly programmed spaces. Strong programmes exist when activity follows a strict pattern, while weak programs describe an all-play-all environment. Thus, while courts and schools are strongly programmed, research labs and shopping malls are weakly programmed. The study reported in (Hillier 1996) suggests that as the program becomes weaker, the distribution of space use and movement is defined less by the program and more by the structure of the layout itself. In other words, weakly programmed spaces exhibit a strong correlation between integration and density of space use. Similarly, the relationship between space and crime has been reported in a number of papers (e.g. Hillier and Sahbaz 2005; Hillier and Shu 2000). The findings suggest a relationship between spatial morphology and various types of crime, such as street robbery and residential burglary. The researchers note that conventional approaches to preventing crime, such as the creation of cul-de-sacs, may in fact be reinforcing crime. A fundamental difficulty in understanding space is that it is generally impossible to intervene in a systematic way. Because it is extremely difficult to modify aspects of cities and observe the effects, SS research utilises modelling experiments to observe the effect of spatial configuration. In such studies, virtual spaces are generated, analysed and modified. For instance, in a study reported in (Hillier 1996) the layout of a hypothetical deformed grid is shown to have a high correlation between integration and connectivity. The building blocks are then slightly shuffled, resulting in a weak correlation (Figure 5). This marginal reshuffling is shown to result in an unintelligent design, where what pedestrians can see from any location on the grid is not a good guide to what they cannot see.
.")
13 Space syntax and Pervasive Systems While difficult to generalise from such artificial experiments, researchers have found universal properties of cities. In a recent study, 36 cities in 14 countries were analysed in terms of axial maps (Carvalho and Penn 2004). The authors show that the cities form two main clusters when considering the distribution of axial length, irrespective of the size of cities. Their results point to an underlying self-similar morphological property of cities, suggesting that cities are fractal in nature. Fig. 5 The top figure shows an intelligible urban layout, where integration and connectivity are highly correlated. The bottom figure shows the effect of a slight misplacement of the buildings, resulting in an unintelligible layout (Hillier 1996). Some of the topics that SS-related research has recently begun to address relate to incorporating geometric and metric measures in the analysis of cities (Hillier et al 2007), measuring spatial capital (Marcus 2007), understanding presence, copresence and encounter (Hanson and Zako 2007; Kostakos and O Neill 2007), preserving and rehabilitating space, settlements and cities (Amorim et al. 2007; Greene and Mora 2007; Karimi et al. 2007), designing spaces for improved evacuation (Choi et al. 2007), transportation (Kisimoto et al. 2007), and quality of life (Ribeiro and Holanda 2007), considering the relationship between space and prostitution (Hadjichristos 2007), and extending SS to three-dimensional analyses (Wang et al. 2007). Further work has considered automated ways of generating axial maps (Peponis et al. 1998). Most of these topics are in early development, but provide a good indication of the issues SS researchers are interested in further exploring.
14 2.4 Criticism Kostakos, V. The simplicity of SS, and its apparent ability to attribute complex phenomena to just spatial configuration, has induced a lot of criticism. A point of debate is whether or not SS is a theory. It is the view of the authors that SS is not a theory in the traditional scientific sense, as it cannot predict phenomena a priori. However, SS does provide invaluable tools to explore and understand real world phenomena, and, more importantly, to generate hypotheses. A stream of criticism addressed at detailed aspects of SS was published in (Ratti 2004), where it was suggested that the same spatial configuration can result in more than one mapping, that SS cannot deal with regular grids, that SS ignores building height, discards metric information and land use information, and finally that axial maps are arbitrary. A rejoinder to this criticism (Hillier and Penn 2004) addresses each of the above points in detail. The authors claim that minor changes in the built environment can give rise to alternative mappings from apparently similar configurations, but point out that, syntactically, those changes are important. Additionally, they provide morphological and behavioural evidence to support their claim. On the issue of SS s inability to deal with regular grids, the authors respond by claiming that, in practice, such grids do not occur, and therefore SS is applicable. In respect to SS s disregard for building height, metric information, and land use information, the authors explain that these are considered in their analysis, rather than in the axial map. In response to the criticism of axial maps being arbitrary, the authors provide statistics evidence from 28 major cities to suggest that axial lines are significant elements of cities, and that the errors associated with tracing them are not statistically significant. 3 Pervasive systems and space syntax So far we have described the components of SS analysis. We identified axial and graph analysis as the basis of SS analysis, and pointed out that a number of metrics have been developed to describe and understand cities. We also highlighted data collection and analysis as important steps in SS analysis. We now summarise how SS integrates all these aspects in a workflow, and provide a sample outline of how to carry out SS analysis. The steps involved in SS analysis may be summarised as: 1. Generate an axial map of a city 2. Gather data (observation or data sources) 3. Identify correlations between data and SS metrics 4. (Optional) Evaluate alternative designs
15 Space syntax and Pervasive Systems The first two steps are a straightforward application of the processes we described in the previous sections: generating axial maps, and gathering data. Step three is in many ways the crucial step of SS analysis. Given a dataset on, say, crime, SS researchers try to correlate any of the multitude of metrics they have developed with instances of crime. To illustrate our example of crime, consider a dataset that describes the number of burglaries that took place on every street of a city over a five year period. Thus, some streets may have zero burglaries, others one or two, while other streets may have fifty or more. Such data may be correlated with any SS metric that can characterise streets, such as integration, connectivity or choice. Thus, we are able to plot a graph where one axis describes the number of burglaries, while the other axis describes connectivity, integration, or any other SS metric. Each plotted point in such a graph represents a street. Overall, crime and any SS metric may display a strong correlation that may be described by a mathematical function. Given the identification of a strong correlation, in step four we are able to evaluate alternative designs. For instance, let us assume a strong correlation between crime and integration. We can then explore the effect on crime if we introduce a new bridge, close a street, or replace a building block with a park. To evaluate such alternatives, we alter the axial map to reflect the proposed changes and assuming the correlation between crime and integration holds, observe how crime is distributed based on the newly calculated integration values for each street. To incorporate SS in the design of pervasive systems, we have modified the four steps described above by incorporating our own systems in the procedure. The result is the following iterative sequence: 1. Generate an axial map of a city 2. Gather geo-data about the pervasive system (logs, usability, etc.) 3. Identify correlations between data and SS metrics. 4. (Optional) Evaluate alternative designs of the pervasive system Our procedure describes a meaningful way of analysing data characterising our systems, and correlating them with the urban morphology of the environment in which our system is deployed. For instance, usability data can be captured about a system at various locations across a city, and then correlated with SS metrics just as crime data can be correlated with SS metrics. Furthermore, these correlations can provide a rationale for evaluating alternative designs and changes to our systems. This modified procedure is a concise summary of how we have integrated SS in the design of our systems. We now describe in detail three case studies in which we used SS in our research.
16 4 Case studies Kostakos, V. In this section we describe three case studies where we used SS in the course of research and development. These case studies demonstrate the role of SS as a simple application module, as an explanatory tool, and as a modelling tool. 4.1 Space syntax and application development In this case study we consider the redesign of a pedestrian way-finding application (Collomosse et al. 2006). The concept behind this application is that users can utilise their mobile phones camera to take a picture that may be analysed in order to correctly identify a user s location and orientation. This would be useful for phones that do not have GPS, or where GPS reception is poor. Our analysis is made possible by a server database that holds geo-tagged images of a city. The application originally worked by uploading a photograph to the server, which searched through the database for a close match. The server had a virtual map of the city, and many photographs attached to specific locations in this map. Finding a match for the uploaded image meant identifying the user s location and orientation. However, the search through such a database of images is linear, and therefore expensive. In our redesign, we suggest that the search can be optimised if we have some knowledge of the user s location. For instance, we can assume that users may have GPS that can be used to detect location, but this may not always function accurately within a city with tall buildings and narrow streets. Another source of location information may be proximity technologies, such as WiFi triangulation or Bluetooth beacons. Given such information, an obvious optimisation to the search process is to use the last known co-ordinates of a user s location in order to narrow down the search through the database. Thus, knowing that ten minutes ago the user was at location x, the search through the database may be limited to the streets within a radius of 1 km from location x (depending on user s average speed). In Figure 6 (top) we show this optimisation in the form of a white circle enclosing all the streets to be searched during a particular query. A further optimisation is to focus on the paths that have a total distance of up to 1 km, such that only a portion of the white circle is searched. These are shown as dark axes highlighted with red. In the bottom of Figure 6 we show how SS was used to further optimise the database search. Our intention was to identify an optimum ordering of the axes to be searched in the database. Since SS can give us a list of axes order by the likelihood of where a user might be, a sequential comparison between a user s submitted image and the images associated with the highlighted axes is more likely to


17 Space syntax and Pervasive Systems find a match sooner rather than later. Overall, therefore, the search effort is reduced. Fig. 6 Space syntax optimisation of searching through a database of geo-tagged images. Assuming a pedestrian was heading north, we identify the streets on which they may have moved to after x minutes, and further identify three zones based on the pedestrian s last known trajectory. Our SS optimisation was done through a series of iterations, each time measuring any obtained performance gains. Initially we ordered the axes using a radius-x SS metric, i.e. we considered a neighbourhood of diameter x segments around the user s last known location and ordered all of them with various SS metrics. However, this approach did not present significant performance gains. After a series of iterations, we settled on the following solution. First, the radius-x axes are segmented in three zones (Figure 6, bottom) based on the user s last known trajectory. Here, our assumption was that users are more likely to maintain their last known trajectory, rather than change it, as suggested by SS. Therefore we create three zones: zone A: assume the user kept his last known trajectory (blue, square-patterned grid in Figure 6b).
18 Kostakos, V. zone B: assume the user deviated slightly from his last know trajectory, either to the left or to the right (black, zigzag-patterned grid in Figure 6b) zone C: assume the user greatly deviated from his last known trajectory (green, tile-patterned grid in the lower-half of Figure 6b). Within every zone we rank each axis based on its local integration. The result is that rather than searching through the whole set of radius-x axes in an arbitrary order, the axes are ordered first based on the user s last known trajectory, and then based on each axis local integration (as defined in Table 1). Our optimisation reduced the search time by 75% on average (Mason 2007). The most successful aspect of our optimisation was zone ordering. Our further refinement of axes ordering based on local integration was successful, but to a smaller extent. This was in part due to the fact that the zones themselves where too small for any further ordering to have a considerable effect. 4.2 Space syntax as an explanatory tool In recent years, a considerable amount of research has focused on collecting mobility traces using networks of WiFi or Bluetooth scanners (Chaintreau et al. 2006; Crawdad 2007). Such traces describe the presence of people at different locations and different times. Earlier work (O Neill et al. 2006) has reported on a collection methodology, which involves augmenting the SS gatecount and static snapshot methods by employing a network of Bluetooth scanners. Further work (Kostakos and O Neill 2007) explains how mobility traces may be translated to sociographs describing users encounters across a city and over time. Effectively, each user gets represented as a node in a sociograph, and then link together nodes (i.e. users) that have encountered each other at some point in time. Doing so allows us to represent the dataset of each scanning location, as well as of all scanning locations, as a sociograph. This has yielded some interesting results, including the identification of underlying equations describing the degree, betweenness, and closeness of the derived sociographs. In Figure 7 we see a visualisation of the process: for various scanning locations across the city, a number of sociographs are derived over time. While merging all scanning locations may generate a complete sociograph, for our purposes here we choose to differentiate between each scanning location. Here, we show what each individual scanner can see.
.")
19 Space syntax and Pervasive Systems Fig. 7 Visualisation of sociographs obtained from various locations in a city. An observation we have made from the comparison of sociographs from different scanning locations is that they are similar, yet distinct (Kostakos and O Neill 2007). While visually it is difficult to accurately compare sociographs, we are able to compare them by plotting their various properties (such as degree distribution). In our research we have found that the sociographs are similar enough to make us hypothesise the existence of an underlying principle, yet distinct enough such that each location gives rise to unique sociograph properties. Our long-term research is focused on identifying the reasons for those small, yet distinctive differences in the sociograph properties. We do so by applying our modified SS procedure described earlier. Currently, our hypothesis is that spatial configuration has an effect on the observed sociographs. Much like researching the relationship between crime and spatial configuration, we are currently researching the relationship between spatial configuration and urban encounters as represented by sociographs. The understanding of this relationship can be a great help in the a priory design, as well as deployment of pervasive systems in cities. Our results suggest that spatial integration is correlated with sociograph density. However, there are many more relationships to be examined, since spatial layout and sociographs each have numerous properties, resulting in an exponential number of potential correlations to be examined. Hence, a key contribution of our work lies in developing a systematic way of identifying and examining these relationships.

20 Kostakos, V. Currently, however, the main obstacle in such a line of research is that many samples are required to derive strong correlations. In our case each sample corresponds to a scanning location: in Figure 7, for example, we show five such samples. In order to derive meaningful statistics, one requires a large number of scanning sites, which will operate over long periods of time. This can be quite expensive in terms of both computational and human resources. A way of overcoming this limitation is by using modelling and simulation, as we describe next. 4.3 Space syntax as a modelling tool As a direct result of observing people s movement in space, the authors in (Turner and Penn 2002) have developed an agent simulation of pedestrian movement. Drawing on Gibson s ecological theory of perception (Gibson 1979), they developed a vision-based mental model of the world, based on the concept of axial lines, which drives agent behaviour. Their approach is distinct in the sense that their system employs an exosomatic visual architecture, thus their agents may be programmed with movement rules originating from Gibson s principle of affordance. By doing so, they make space, rather than agent intelligence, the primary causality of movement. The resulting aggregate movement patterns of agents closely match those of humans. Based on these results, they have published a free simulation environment, called Depthmap (Turner 2001), which enables users to load city maps and observe aggregate pedestrian movement (Figure 8).
21 Space syntax and Pervasive Systems Fig. 8 A map of the city of Bath with virtual pedestrians. Within this simulation we are able to establish virtual scanners that collect synthetic mobility traces. In our research we have extended Depthmap in order to generate synthetic mobility traces. As we noted in the previous case study, it is really difficult and expensive to carry out longitudinal Bluetooth or WiFi scans at multiple locations in a city. To address this problem, we have focused our efforts on carrying out Bluetooth scans within Depthmap. By loading a map of the city of Bath inside Depthmap, we are able to establish virtual scanners in the exact locations where we carried out our real-world Bluetooth scans. At the moment, we are tweaking the Depthmap simulation rules so that the sociograph properties of the virtual scans match those of the real-world scans. Once we derive simulated data that match our empirical data, we will then extend the network of our virtual scanners within Depthmap. This will give us enough data to enable us to look for correlations between sociograph properties and spatial properties, as described in the previous section. Effectively, this approach will enable us to systematically identify the effect of spatial morphology on encounter and ultimately social behaviour. Moreover, these may be used to help us understand how to best integrate our systems in the fabric of everyday life. 5 Conclusion and ongoing work In this paper we describe our novel use of space syntax (SS) in the design and development of pervasive systems. Our two novel contributions are our modification of the SS methodology, and our use of SS in building three distinct systems. SS has a number of strengths that we find useful in our research. First, it helps us understand how space is, as opposed to how it ought to be. Additionally, the understanding and metrics derived from SS are in a form readily understood by computers. As such, SS can easily be used to design and augment pervasive applications. We demonstrate this in our case studies, where we used SS to simply augment and improve an existing application, as an explanatory tool, and as a modelling tool. Our ongoing work, hinted throughout the case studies, involves the development of an urban space simulation environment. Such an environment will enable us to quickly test pervasive applications that draw on people s mobility and sociability. Acknowledgments The author wishes to thank Eamonn O Neill, John Mason, Alan Penn, Ava Fatah gen. Schieck, Shinichi Iida, Bill Hillier, Alasdair Turner, and all other members of the UCL space syntax Lab.
22 References Kostakos, V. Amorim, L., Loureiro, C. & Nascimento, C. (2007). Preserving space: Towards a new architectural conservation agenda. Proceedings of the Space Syntax Symposium 2007, Istanbul, 32, Carvalho, R. & Penn, A. (2004). Scaling and universality in the micro-structure of urban space. Physica A, 332, Chaintreau A., Hui P., Crowcroft J., Diot C., Gass R. & Scott J. (2006). Impact of human mobility on the design of opportunistic forwarding algorithms. Proc. INFOCO, IEEE CS Press. Choi, J., Kim, M. & Choic, H. (2007). Evacuation efficiency evaluation model based on euclidean distance with visual depth. Proceedings of the Space Syntax Symposium 2007, Istanbul, 41, 1-16 Collomosse, J.P., Al Mosawi, K. & O Neill, E. (2006). Viewpoint invariant image retrieval for context in urban environments. Proceedings of the Conference of Visual Media Production (CVMP), IEEE Press, 177. Crawdad (2007), Crawdad project. Last access 22 August Dix, A. (2000). Welsh mathematician walks in cyberspace. Proceedings of the 3rd international conference on collaborative virtual environments. (pp 3-7), (New York: ACM Press) Dix, A. (2003). Managing multiple spaces. Proceedings of the Workshop on Space, Spatiality and Technology, Napier University, Edinburgh. Dourish P. & Bell, G. (2007). The Infrastructure of experience and the experience of infrastructure: Meaning and structure in everyday encounters with space. Environment and Planning B: Planning and Design, 34(3), Gibson, J.J. (1979). The ecological approach to visual perception. (Boston: Houghton Mifflin) Graham, S. (2005). Strategies for networked cities. (In L. Albrechts & S. Mandelbaum (Eds.), Planning in the network society, (pp ), Routledge) Greene, M. & Mora, R. (2007). Rehabilitation process in city centres: new residents in traditional areas. Proceedings of the Space Syntax Symposium 2007, Istanbul, 33, 1-14 Hadjichristos, C. (2007). Prostitution spatialised: Cyprians then and now. Proceedings of the Space Syntax Symposium 2007, Istanbul, 113, 1-6 Hanson, J. & Zako, R. (2007). Communities of co-rpesence and surveilalance: How public open space shapes awareness and behaviour in residential developments. Proceedings of the Space Syntax Symposium 2007, Istanbul, 21, 1-21 Harrison, S. & Dourish, P. (1996). Re-place-ing space: The roles of place and space in collaborative systems. Proceedings of the conference on Computer Supported Cooperative Work (CSCW), Boston, MA, USA, ACM Press, Hillier, B. (1996). Space is the machine. (Cambridge: Cambridge University Press) Hillier, B., Burdett, R., Peponis, J. & Penn, A. (1987). Creating life: Or, does architecture determine anything? Architecture & Behaviour, 3(3), Hillier, B. & Hanson, J. (1984). The social logic of space. (Cambridge: Cambridge University Press) Hillier, B. & Penn, A. (2004). Rejoinder to Carlo Ratti. Environment and Planning B, 31, Hillier, B., Penn, A., Grajewski, T. and Burdett, R. & Musgrove, J. (1985). Space standards and configuration in research laboratories. Technical report. Bartlett School of Architecture and Planning, UCL, London, UK Hillier, B. & Sahbaz, O. (2005). High resolution analysis of crime patterns in urban street networks: an initial statistical sketch from an ongoing study of a London borough. Proceedings of the Space Syntax Symposium 2005, 1, Hillier, B. & Shu, S. (2000). Crime and urban layout: the need for evidence. (In: S. Ballantyne, V. MacLaren & K. Pease (Eds), Secure foundations: Key issues in crime prevention, crime reduction and community safety, (PP ) London, UK: Institute for Public Policy Research)
23 Space syntax and Pervasive Systems Hillier, B., Turner, A., Yang, T. & Park, H.T. (2007). Metric and topo-geometric properties of urban street networks: some convergences, divergences and new results. Proceedings of the Space Syntax Symposium 2007, Istanbul, 1, 1-21 Jiang B. (2008). Ranking spaces for predicting human movement in an urban environment. International Journal of Geographical Information Science. Preprint, arxiv.org/abs/physics/ Jiang B., Zhao S. & Yin J. (2008). Self-organized natural roads for predicting traffic flow: A sensitivity study. Journal of Statistical Mechanics: Theory and Experiment, July, P07008, Preprint, arxiv.org/abs/ Karimi, K., Amir, A., Shafiei, K., Rafor, N., Abdul, E., Zhang, J. & Mavridou, M. (2007). Evidence-based spatial intervention for regeneration of informal settlements: The case of Jedda central unplanned areas. Proceedings of the Space Syntax Symposium 2007, Istanbul, 34, 1-14 Kim, Y.O. & Penn, A. (2004). Linking the spatial syntax of cognitive maps to the spatial syntax of the environment. Environment and Behaviour, 36(4), Kisimoto, T., Kawasaki, Sh., Nagata, N. & Tanaka, R. (2007). Optimal location of route and stops of public transportation. Proceedings of the Space Syntax Symposium 2007, Istanbul, 75, 1-10 Kostakos, V. & O Neill, E. (2007). Quantifying the effects of space on encounter. Proceedings of the Space Syntax Symposium 2007, Istanbul, 97, 1-9 Marcus, L. (2007). Spatial capital and how to measure it: an outline of an analytical theory of the social performativity of urban form. Proceedings of the Space Syntax Symposium 2007, Istanbul, 5, 1-11 Mason, J. (2007). I spy with my little eye. University of Bath, Department of Computer Science, undergraduate dissertation Muramatsu, J. & Ackerman, M. S. (1998). Computing, social activity, and entertainment: A field study of a game MUD. Computer Supported Cooperative Work, 7(1-2), O'Neill, E., Johnson, P. & Johnson, H. (1999). Representations and user-developer interaction in cooperative analysis and design. Human Computer Interaction, 14(1-2), O Neill, E., Kostakos, V., Kindberg, T., gen. Schieck, A.F., Penn, A., Fraser, D.S. & Jones, T. (2006). Instrumenting the city: Developing methods for observing and understanding the digital cityscape. Proceeding of the International Conference on Ubiquitous Computing (UbiComp) 2006, Peponis, J., Conroy-Dalton, R., Wineman, J & Dalton, N. (2004). Measuring the effects of layout upon visitors' spatial behaviors in open plan exhibition settings. Environment and Planning (B): Planning and Design, 31, Peponis, J., Wineman J, Bafna, S., Rashid, M. & Kim, S. H. (1998). On the generation of linear representations of spatial configuration. Environment and Planning (B): Planning and Design, 25, Peponis, J., Wineman, J., Rashid, M., Kim, S. H. & Bafna, S. (1997). On the description of shape and spatial configuration inside buildings: convex partitions and their local properties. Environment and Planning (B): Planning and Design, 24, Ratti, C. (2004). Space syntax: Some inconsistencies. Environment and Planning B, 31, Ribeiro, R.J.D.C. & Holanda, F.R.B.D. (2007). What integration adds to quality of life. Proceedings of the Space Syntax Symposium 2007, Istanbul, 81, 1-12 Sailer, K. & Penn, A. (2007). The performance of space exploring social and spatial phenomena of interaction patterns in an organisation. Proceedings of the International Architecture and Phenomenology Conference, Haifa, Israel. Shiode, N. & Kanoshima, T. (1999). Utilising the spatial features of cyberspace for generating a dynamic museum environment. Proceedings of the Symposium on the Virual Reality Modelling Language (VRML) 1999, Paderborn, Germany, ACM Press, Spinello, R. A. (2000). Excerpt from cyberethics: morality and law in cyberspace. SIGCAS Computers and Society, 30(1), Turner, A. (2001). Depthmap: A program to perform visibility graph analysis. Proceedings of the Space Syntax Symposium 2001, 31, 1-9
Public spaces revisted: a study of the relationship between patterns of stationary activity and visual fields
 Public spaces revisted: a study of the relationship between patterns of stationary activity and visual fields Abstract Maria Beatriz de Arruda Campos and Theresa Golka Space Syntax Limited, UK b.campos@spacesyntax.com,
Confeego: Tool Set for Spatial Configuration Studies
 14 Confeego: Tool Set for Spatial Configuration Studies Jorge Gil, Chris Stutz and Alain Chiaradia Space Syntax Limited, London, UK Abstract. Confeego is a suite of tools to understand and harness the
Place Syntax Tool (PST)
") Place Syntax Tool (PST) Alexander Ståhle To cite this report: Alexander Ståhle (2012) Place Syntax Tool (PST), in Angela Hull, Cecília Silva and Luca Bertolini (Eds.) Accessibility Instruments for Planning
Place Syntax Tool (PST) Alexander Ståhle To cite this report: Alexander Ståhle (2012) Place Syntax Tool (PST), in Angela Hull, Cecília Silva and Luca Bertolini (Eds.) Accessibility Instruments for Planning
ARCHITECTURAL SPACE AS A NETWORK
 ARCHITECTURAL SPACE AS A NETWORK PHYSICAL AND VIRTUAL COMMUNITIES Dr Kerstin Sailer Bartlett School of Graduate Studies, University College London Lorentz Workshop Innovation at the Verge Computational
Chapter IV. Space Syntax
 61 Chapter IV Space Syntax 1 INTRODUCTION Space Syntax is an important component of this dissertation because it deals with topologically derived configuration and has techniques that allow the environment
Ref 009 Visibility and Permeability Complementary Syntactical Attributes of Wayfinding
 Short Paper Ref 009 Visibility and Permeability Complementary Syntactical Attributes of Wayfinding Mateus Paulo Beck Ufrgs, Propar, Porto Alegre, Brazil mateuspbeck@gmail.com Benamy Turkienicz Ufrgs, Propar,
Analysis of a high sub-centrality of peripheral areas at the global urban context
 Analysis of a high sub-centrality of peripheral areas at the global urban context Adriana Dantas Nogueira Universidade Federal de Sergipe, Brazil adriananogueira02@hotmail.com Abstract This paper presents
M. Saraiva* 1 and J. Barros 1. * Keywords: Agent-Based Models, Urban Flows, Accessibility, Centrality.
 The AXS Model: an agent-based simulation model for urban flows M. Saraiva* 1 and J. Barros 1 1 Department of Geography, Birkbeck, University of London, 32 Tavistock Square, London, WC1H 9EZ *Email: m.saraiva@mail.bbk.ac.uk
Spatial Layout and the Promotion of Innovation in Organizations
 Spatial Layout and the Promotion of Innovation in Organizations Jean Wineman, Felichism Kabo, Jason Owen-Smith, Gerald Davis University of Michigan, Ann Arbor, Michigan ABSTRACT: Research on the enabling
Intelligent GIS: Automatic generation of qualitative spatial information
 Intelligent GIS: Automatic generation of qualitative spatial information Jimmy A. Lee 1 and Jane Brennan 1 1 University of Technology, Sydney, FIT, P.O. Box 123, Broadway NSW 2007, Australia janeb@it.uts.edu.au
MORPHOLOGICAL STUDY OF A SMALL TOWN BARKUR IN COASTAL KARNATAKA, INDIA 2 METHODOLOGY
 2 METHODOLOGY The understanding of form as a process with underlying structure, distinguishing it from the physical characteristics of town form itself by which the potentials of the town structure are
Space Syntax: Spatial Integration Accessibility and Angular Segment Analysis by Metric Distance (ASAMeD)
") Space Syntax: Spatial Integration Accessibility and Angular Segment Analysis by Metric Distance (ASAMeD) Nadia Charalambous, Magda Mavridou To cite this report: Nadia Charalambous, Magda Mavridou (2012)
Space Syntax: Spatial Integration Accessibility and Angular Segment Analysis by Metric Distance (ASAMeD) Nadia Charalambous, Magda Mavridou To cite this report: Nadia Charalambous, Magda Mavridou (2012)
The population within the AMC limits was 4.5 million in 2001 (Census of India 2001). The Sabarmati River divides the city in two parts. The city s tra
. The Sabarmati River divides the city in two parts. The city s tra") EXPLORING THE RELATIONSHIP BETWEEN URBAN ROADS, URBAN FORM AND ECONOMIC ACTIVITY IN AHMEDABAD USING SPACE SYNTAX Arindam Majumdar 1, Richard Sliuzas 2, Talat Munshi 1, Mark Brussel 2 1 Center for Environmental
EXPLORING THE RELATIONSHIP BETWEEN URBAN ROADS, URBAN FORM AND ECONOMIC ACTIVITY IN AHMEDABAD USING SPACE SYNTAX Arindam Majumdar 1, Richard Sliuzas 2, Talat Munshi 1, Mark Brussel 2 1 Center for Environmental
Housing visual quality in urban pattern; Application of isovist method in old fabric of Bushehr city
 International Journal of Architectural Engineering & Urban Planning Housing visual quality in urban pattern; Application of isovist method in old fabric of Bushehr city M. Alalhesabi 1,*, S. B. Hosseini
P. O. Box 5043, 2600 CR Delft, the Netherlands, Building, Pokfulam Road, Hong Kong,
 THE THEORY OF THE NATURAL URBAN TRANSFORMATION PROCESS: THE RELATIONSHIP BETWEEN STREET NETWORK CONFIGURATION, DENSITY AND DEGREE OF FUNCTION MIXTURE OF BUILT ENVIRONMENTS Akkelies van Nes 1, Yu Ye 2 1
Colleges of Cambridge: The Spatial Interaction between the Town and the Gown. Dima Srouri University College London, UK
 Colleges of Cambridge: The Spatial Interaction between the Town and the Gown Dima Srouri University College London, UK srourid@hotmail.com Abstract This paper investigates the notion of campus community
Wayfinding in traditional Chinese private gardens: a spatial analysis of the Yuyuan garden
 R.H. Crawford and A. Stephan (eds.), Living and Learning: Research for a Better Built Environment: 49 th International Conference of the Architectural Science Association 2015, pp.931 939. 2015, The Architectural
Space Syntax: Architecture and Cities MRes This programme information sheet includes details of the structure and content of the course.
 Space Syntax: Architecture and Cities MRes 2018-19 This programme information sheet includes details of the structure and content of the course. CONTENTS Overview 3 Structure 4 Content 5 Staff 6 Opportunities
Urban Geography. Unit 7 - Settlement and Urbanization
 Urban Geography Unit 7 - Settlement and Urbanization Unit 7 is a logical extension of the population theme. In their analysis of the distribution of people on the earth s surface, students became aware
Could A Road-centre Line Be An Axial Line In Disguise? Alasdair Turner University College London, UK
 Could A Road-centre Line Be An Axial Line In Disguise? Alasdair Turner University College London, UK a.turner@ucl.ac.uk Abstract Axial analysis is one of the fundamentals of space syntax. Hillier has proposed
THE STRUCTURE OF PUBLIC SPACEIN SPARSELY URBAN AREAS
 O L U M E I I P R O C E E D I N G S VO O L U M E THE STRUCTURE OF PUBLIC SPACEIN SPARSELY URBAN AREAS Vaso Trova, Eleni Hadjinikolaou, Solon Xenopoulos, John Peponis School of Architecture, National Technical
Economic and Social Council 2 July 2015
 ADVANCE UNEDITED VERSION UNITED NATIONS E/C.20/2015/11/Add.1 Economic and Social Council 2 July 2015 Committee of Experts on Global Geospatial Information Management Fifth session New York, 5-7 August
Spatial Configuration and Actual Crime Locations in a University Campus Setting
 Spatial Configuration and Actual Crime Locations in a University Campus Setting Yixiang Long and Perver K. Baran College of Design, NC State University Paper presented at EDRA37, Atlanta, 3-7 May, 2006
Similarities and differences between outdoor and indoor space from the perspective of navigation
 Similarities and differences between outdoor and indoor space from the perspective of navigation (Extended Abstract) Liping Yang, Michael Worboys Department of Spatial Information Science and Engineering,
Clustering Analysis of London Police Foot Patrol Behaviour from Raw Trajectories
 Clustering Analysis of London Police Foot Patrol Behaviour from Raw Trajectories Jianan Shen 1, Tao Cheng 2 1 SpaceTimeLab for Big Data Analytics, Department of Civil, Environmental and Geomatic Engineering,
transportation research in policy making for addressing mobility problems, infrastructure and functionality issues in urban areas. This study explored
 ABSTRACT: Demand supply system are the three core clusters of transportation research in policy making for addressing mobility problems, infrastructure and functionality issues in urban areas. This study
Collection and Analyses of Crowd Travel Behaviour Data by using Smartphones
 Collection and Analyses of Crowd Travel Behaviour Data by using Smartphones Rik Bellens 1 Sven Vlassenroot 2 Sidharta Guatama 3 Abstract: In 2010 the MOVE project started in the collection and analysis
Chapter 1 Introduction
 1 Chapter 1 Introduction Figure 1.1: Westlake Plaza A warm sunny day on a downtown street and plaza, pedestrians pass on the sidewalks, people sit on benches and steps, enjoying a cup of coffee, shoppers
Assessing pervasive user-generated content to describe tourist dynamics
 Assessing pervasive user-generated content to describe tourist dynamics Fabien Girardin, Josep Blat Universitat Pompeu Fabra, Barcelona, Spain {Fabien.Girardin, Josep.Blat}@upf.edu Abstract. In recent
GIS-based Smart Campus System using 3D Modeling
 GIS-based Smart Campus System using 3D Modeling Smita Sengupta GISE Advance Research Lab. IIT Bombay, Powai Mumbai 400 076, India smitas@cse.iitb.ac.in Concept of Smart Campus System Overview of IITB Campus
Relationship between Spatial Configuration and Ferry, Bus and Railway Patronage in Brisbane CBD
 Relationship between Spatial Configuration and Ferry, Bus and Railway Patronage in Brisbane CBD Sima Vaez 1, Matthew Burke 2,Tooran Alizadeh 3 Email for correspondence: sima.vaezeslami@griffithuni.edu.au
THE ONE- AND TWO- DIMENSIONAL ISOVISTS ANALYSES IN SPACE SYNTAX
 AKKELIES VAN NES THE ONE- AND TWO- DIMENSIONAL ISOVISTS ANALYSES IN SPACE SYNTAX 7.1 INTRODUCTION This contribution aims to show the spatial properties for indicating degrees of street life, safety and
ENV208/ENV508 Applied GIS. Week 1: What is GIS?
 ENV208/ENV508 Applied GIS Week 1: What is GIS? 1 WHAT IS GIS? A GIS integrates hardware, software, and data for capturing, managing, analyzing, and displaying all forms of geographically referenced information.
Research Group Cartography
 Research Group Cartography Research Group Cartography Towards supporting wayfinding LBS components 1. Mobile devices 2. Communication Network 3. Positioning Component 4. Service and Application Provider
CS188: Artificial Intelligence, Fall 2009 Written 2: MDPs, RL, and Probability
 CS188: Artificial Intelligence, Fall 2009 Written 2: MDPs, RL, and Probability Due: Thursday 10/15 in 283 Soda Drop Box by 11:59pm (no slip days) Policy: Can be solved in groups (acknowledge collaborators)
Implementing Visual Analytics Methods for Massive Collections of Movement Data
 Implementing Visual Analytics Methods for Massive Collections of Movement Data G. Andrienko, N. Andrienko Fraunhofer Institute Intelligent Analysis and Information Systems Schloss Birlinghoven, D-53754
Your web browser (Safari 7) is out of date. For more security, comfort and. the best experience on this site: Update your browser Ignore
 is out of date. For more security, comfort and. the best experience on this site: Update your browser Ignore") Your web browser (Safari 7) is out of date. For more security, comfort and Activityengage the best experience on this site: Update your browser Ignore Introduction to GIS What is a geographic information
Your web browser (Safari 7) is out of date. For more security, comfort and Activityengage the best experience on this site: Update your browser Ignore Introduction to GIS What is a geographic information
Space syntax analysis methodology of understanding the space
 Space syntax analysis methodology of understanding the space Weronika DETTLAFF Keywords: Space Syntax; way finding; spatial configuration; individual; spatial decision making Abstract: Nowadays space is
Data Collection. Lecture Notes in Transportation Systems Engineering. Prof. Tom V. Mathew. 1 Overview 1
 Data Collection Lecture Notes in Transportation Systems Engineering Prof. Tom V. Mathew Contents 1 Overview 1 2 Survey design 2 2.1 Information needed................................. 2 2.2 Study area.....................................
Typical information required from the data collection can be grouped into four categories, enumerated as below.
 Chapter 6 Data Collection 6.1 Overview The four-stage modeling, an important tool for forecasting future demand and performance of a transportation system, was developed for evaluating large-scale infrastructure
From axial to road-centre lines: a new representation for space syntax and a new model of route choice for transport network analysis
 From axial to road-centre lines: a new representation for space syntax and a new model of route choice for transport network analysis Alasdair Turner Abstract Axial analysis is one of the fundamental components
Neighborhood Locations and Amenities
 University of Maryland School of Architecture, Planning and Preservation Fall, 2014 Neighborhood Locations and Amenities Authors: Cole Greene Jacob Johnson Maha Tariq Under the Supervision of: Dr. Chao
arxiv: v1 [physics.soc-ph] 27 Sep 2007
![arxiv: v1 [physics.soc-ph] 27 Sep 2007](/thumbs/76/73949872.jpg "arxiv: v1 [physics.soc-ph] 27 Sep 2007") arxiv:0709.4415v1 [physics.soc-ph] 27 Sep 2007 Discovering Important Nodes Through Graph Entropy Encoded in Urban Space Syntax D. Volchenkov and Ph. Blanchard BiBoS, University Bielefeld, Postfach 100131,
arxiv:0709.4415v1 [physics.soc-ph] 27 Sep 2007 Discovering Important Nodes Through Graph Entropy Encoded in Urban Space Syntax D. Volchenkov and Ph. Blanchard BiBoS, University Bielefeld, Postfach 100131,
SocViz: Visualization of Facebook Data
 SocViz: Visualization of Facebook Data Abhinav S Bhatele Department of Computer Science University of Illinois at Urbana Champaign Urbana, IL 61801 USA bhatele2@uiuc.edu Kyratso Karahalios Department of
Appropriate Selection of Cartographic Symbols in a GIS Environment
 Appropriate Selection of Cartographic Symbols in a GIS Environment Steve Ramroop Department of Information Science, University of Otago, Dunedin, New Zealand. Tel: +64 3 479 5608 Fax: +64 3 479 8311, sramroop@infoscience.otago.ac.nz
Web Visualization of Geo-Spatial Data using SVG and VRML/X3D
 Web Visualization of Geo-Spatial Data using SVG and VRML/X3D Jianghui Ying Falls Church, VA 22043, USA jying@vt.edu Denis Gračanin Blacksburg, VA 24061, USA gracanin@vt.edu Chang-Tien Lu Falls Church,
Give 4 advantages of using ICT in the collection of data. Give. Give 4 disadvantages in the use of ICT in the collection of data
 Give 4 advantages of using ICT in the collection of data can use a handheld GPS to get accurate location information which can be used to show data linked to specific locations within a GIS can collect
Crime Analysis. GIS Solutions for Intelligence-Led Policing
 Crime Analysis GIS Solutions for Intelligence-Led Policing Applying GIS Technology to Crime Analysis Know Your Community Analyze Your Crime Use Your Advantage GIS aids crime analysis by Identifying and
Application of Space Syntax as Presentation and Analysis Technique in the Study of Spatial Integration in Contoured Landform
 2012, TextRoad Publication ISSN 2090-4304 Journal of Basic and Applied Scientific Research www.textroad.com Application of Space Syntax as Presentation and Analysis Technique in the Study of Spatial Integration
Lecture Notes on Inductive Definitions
 Lecture Notes on Inductive Definitions 15-312: Foundations of Programming Languages Frank Pfenning Lecture 2 September 2, 2004 These supplementary notes review the notion of an inductive definition and
Road Network Analysis as a Means of Socio-spatial Investigation the CoMStaR 1 Project
 Road Network Analysis as a Means of Socio-spatial Investigation the CoMStaR 1 Project F. Anders 1, R. König 1 1 Bauhaus-University Weimar, Faculty of Architecture, Chair Computer Science in Architecture,
USER PARTICIPATION IN HOUSING REGENERATION PROJECTS
 USER PARTICIPATION IN HOUSING REGENERATION PROJECTS Dr. Hatice Sadıkoğlu Bahçeşehir University, Faculty of Architecture and Design Prof. Dr. Ahsen Özsoy Istanbul Technical University, Faculty of Architecture
TOWARDS THE DEVELOPMENT OF A MONITORING SYSTEM FOR PLANNING POLICY Residential Land Uses Case study of Brisbane, Melbourne, Chicago and London
 TOWARDS THE DEVELOPMENT OF A MONITORING SYSTEM FOR PLANNING POLICY Residential Land Uses Case study of Brisbane, Melbourne, Chicago and London Presented to CUPUM 12 July 2017 by Claire Daniel Urban Planning/Data
It is clearly necessary to introduce some of the difficulties of defining rural and
 UNIT 2 CHANGING HUMAN ENVIRONMENTS G2 Theme 2 Investigating Settlement Change in MEDCs 2.1 What are the distinctive features of settlements? It is clearly necessary to introduce some of the difficulties
A STRUCTURAL ANALYSIS OF THE STREETS NETWORK TO URBAN FABRIC CHARACTERIZATION
 CO-165 A STRUCTURAL ANALYSIS OF THE STREETS NETWORK TO URBAN FABRIC CHARACTERIZATION HAMAINA R., LEDUC T., MOREAU G. Centre d'études et recherches méthodologiques d'architecture, NANTES, FRANCE ABSTRACT
Interactive Visualization Tool (InViTo)
") Interactive Visualization Tool (InViTo) Stefano Pensa To cite this report: Stefano Pensa (2012) Interactive Visualization Tool (InViTo), in Angela Hull, Cecília Silva and Luca Bertolini (Eds.) Accessibility
Interactive Visualization Tool (InViTo) Stefano Pensa To cite this report: Stefano Pensa (2012) Interactive Visualization Tool (InViTo), in Angela Hull, Cecília Silva and Luca Bertolini (Eds.) Accessibility
Cell-based Model For GIS Generalization
 Cell-based Model For GIS Generalization Bo Li, Graeme G. Wilkinson & Souheil Khaddaj School of Computing & Information Systems Kingston University Penrhyn Road, Kingston upon Thames Surrey, KT1 2EE UK
Cadcorp Introductory Paper I
 Cadcorp Introductory Paper I An introduction to Geographic Information and Geographic Information Systems Keywords: computer, data, digital, geographic information systems (GIS), geographic information
Geographical Bias on Social Media and Geo-Local Contents System with Mobile Devices
 212 45th Hawaii International Conference on System Sciences Geographical Bias on Social Media and Geo-Local Contents System with Mobile Devices Kazunari Ishida Hiroshima Institute of Technology k.ishida.p7@it-hiroshima.ac.jp
Hotspots A Methodology For Identifying, Prioritising And Tackling Litter In Urban Environments
 Hotspots A Methodology For Identifying, Prioritising And Tackling Litter In Urban Environments R Catchlove 1 and M Francey 2 1 Melbourne Water, robert.catchlove@melbournewater.com.au 2 Melbourne Water,
Place this Photo on a Map: A Study of Explicit Disclosure of Location Information
 Place this Photo on a Map: A Study of Explicit Disclosure of Location Information Fabien Girardin 1, Josep Blat 1 1 Department of ICT, Pompeu Fabra University, 08003 Barcelona, Spain {Fabien.Girardin,
VISUAL ANALYTICS APPROACH FOR CONSIDERING UNCERTAINTY INFORMATION IN CHANGE ANALYSIS PROCESSES
 VISUAL ANALYTICS APPROACH FOR CONSIDERING UNCERTAINTY INFORMATION IN CHANGE ANALYSIS PROCESSES J. Schiewe HafenCity University Hamburg, Lab for Geoinformatics and Geovisualization, Hebebrandstr. 1, 22297
Traffic accidents and the road network in SAS/GIS
 Traffic accidents and the road network in SAS/GIS Frank Poppe SWOV Institute for Road Safety Research, the Netherlands Introduction The first figure shows a screen snapshot of SAS/GIS with part of the
Multi-Criteria Spatial Analysis of Building Layouts
 Issues in Informing Science and Information Technology Volume 4, 2007 Multi-Criteria Spatial Analysis of Building Layouts Hissam Tawfik and Atulya Nagar, Intelligent and Distributed Systems Research Laboratory,
Cities in Space and Time: A Spatial-Temporal Visualization Model of Urban Environments
 Cities in Space and Time: A Spatial-Temporal Visualization Model of Urban Environments Li Yin Assistant Professor Department of Urban and Regional Planning University at Buffalo, The State University of
Metropolitan Wi-Fi Research Network at the Los Angeles State Historic Park
 Metropolitan Wi-Fi Research Network at the Los Angeles State Historic Park Vidyut Samanta vids@remap.ucla.edu Chase Laurelle Alexandria Knowles chase@remap.ucla.edu Jeff Burke jburke@remap.ucla.edu Fabian
The Concept of Geographic Relevance
 The Concept of Geographic Relevance Tumasch Reichenbacher, Stefano De Sabbata, Paul Crease University of Zurich Winterthurerstr. 190 8057 Zurich, Switzerland Keywords Geographic relevance, context INTRODUCTION
You are Building Your Organization s Geographic Knowledge
 You are Building Your Organization s Geographic Knowledge And Increasingly Making it Available Sharing Data Publishing Maps and Geo-Apps Developing Collaborative Approaches Citizens Knowledge Workers Analysts
Modeling Discrete Processes Over Multiple Levels Of Detail Using Partial Function Application
 Modeling Discrete Processes Over Multiple Levels Of Detail Using Partial Function Application Paul WEISER a and Andrew U. FRANK a a Technical University of Vienna Institute for Geoinformation and Cartography,
How Spatial Layout and Architecture Influence Everyday Work of Theoretical Physicists The Example of the mpipks
 How Spatial Layout and Architecture Influence Everyday Work of Theoretical Physicists The Example of the mpipks Dipl.-Ing. Kerstin Sailer Lehrstuhl Industriebau, TU Dresden Young Scientists Jam Session,
Dr. Wen-Chieh (Jeffrey) Wang Assistant Professor Department of Landscape and Urban Design Chaoyang University of Technology Taiwan, R.O.C.
 Wang Assistant Professor Department of Landscape and Urban Design Chaoyang University of Technology Taiwan, R.O.C.") Dr. Wen-Chieh (Jeffrey) Wang Assistant Professor Department of Landscape and Urban Design Chaoyang University of Technology Taiwan, R.O.C. This paper presents a generalization algorithm focusing specifically
Dr. Wen-Chieh (Jeffrey) Wang Assistant Professor Department of Landscape and Urban Design Chaoyang University of Technology Taiwan, R.O.C. This paper presents a generalization algorithm focusing specifically
052 Towards spatial network multiplicity:
 052 Towards spatial network multiplicity: A reference to Bangkok Apiradee Kasemsook Silpakorn University apikasemsook@gmail.com Pheereeya Boonchaiyapruek Space Syntax Laboratory, The Bartlett School of
Haslemere Design Statement
 For Beacon Hill, Critchmere, Grayswood, Haslemere, Hindhead and Shottermill Ensuring new development takes account of local character Contents Overview 3 1. Introduction 4 2. What makes Haslemere Special
Geographic Analysis of Linguistically Encoded Movement Patterns A Contextualized Perspective
 Geographic Analysis of Linguistically Encoded Movement Patterns A Contextualized Perspective Alexander Klippel 1, Alan MacEachren 1, Prasenjit Mitra 2, Ian Turton 1, Xiao Zhang 2, Anuj Jaiswal 2, Kean
SPATIAL DESIGN ANALYSIS WITHIN AN ATRIUM
 M. A. Schnabel (ed.), Cutting Edge: 47 th International Conference of the Architectural Science Association, pp. 517 524. 2013, The Architectural Science Association (ANZAScA), Australia SPATIAL DESIGN
Activity Identification from GPS Trajectories Using Spatial Temporal POIs Attractiveness
 Activity Identification from GPS Trajectories Using Spatial Temporal POIs Attractiveness Lian Huang, Qingquan Li, Yang Yue State Key Laboratory of Information Engineering in Survey, Mapping and Remote
A Computable Language of Architecture
 A Computable Language of Architecture Description of Descriptor Language in Supporting Compound Definitions Introduction Sora Key Carnegie Mellon University, Computational Design Laboratory, USA http://www.code.arc.cmu.edu
Belfairs Academy GEOGRAPHY Fundamentals Map
 YEAR 12 Fundamentals Unit 1 Contemporary Urban Places Urbanisation Urbanisation and its importance in human affairs. Global patterns of urbanisation since 1945. Urbanisation, suburbanisation, counter-urbanisation,
Introduction to GIS. Dr. M.S. Ganesh Prasad
 Introduction to GIS Dr. M.S. Ganesh Prasad Department of Civil Engineering The National Institute of Engineering, MYSORE ganeshprasad.nie@gmail.com 9449153758 Geographic Information System (GIS) Information
Monsuru Adepeju 1 and Andy Evans 2. School of Geography, University of Leeds, LS21 1HB 1
 Investigating the impacts of training data set length (T) and the aggregation unit size (M) on the accuracy of the self-exciting point process (SEPP) hotspot method Monsuru Adepeju 1 and Andy Evans 2 1,
Exploit your geodata to enable smart cities and countries
 Exploit your geodata to enable smart cities and countries Carsten Rönsdorf, Head of Advisory Services Middle East Practice Manager Future Cities, standards and 3D 24 November 2014 Importance of Standards
2002 HSC Notes from the Marking Centre Geography
 2002 HSC Notes from the Marking Centre Geography 2003 Copyright Board of Studies NSW for and on behalf of the Crown in right of the State of New South Wales. This document contains Material prepared by
ON SPACE SYNTAX AS A CONFIGURATIONAL THEORY OF ARCHITECTURE FROM A SITUATED OBSERVER S VIEWPOINT
 Environment and Planning B: Planning and Design, In Press ON SPACE SYNTAX AS A CONFIGURATIONAL THEORY OF ARCHITECTURE FROM A SITUATED OBSERVER S VIEWPOINT Mahbub Rashid, PhD, RA Professor of Architecture,
Designing and Evaluating Generic Ontologies
 Designing and Evaluating Generic Ontologies Michael Grüninger Department of Industrial Engineering University of Toronto gruninger@ie.utoronto.ca August 28, 2007 1 Introduction One of the many uses of
CS188: Artificial Intelligence, Fall 2009 Written 2: MDPs, RL, and Probability
 CS188: Artificial Intelligence, Fall 2009 Written 2: MDPs, RL, and Probability Due: Thursday 10/15 in 283 Soda Drop Box by 11:59pm (no slip days) Policy: Can be solved in groups (acknowledge collaborators)
El Botellón: Modeling the Movement of Crowds in a City
 El Botellón: Modeling the Movement of Crowds in a City Jonathan E. Rowe Rocio Gomez School of Computer Science, University of Birmingham, Birmingham B15 2TT, United Kingdom A simulation of crowd movement
Location does not matter in the informational age? a case study on the distribution of restaurants listed in dazhongdianping in Beijing
 Beijing City Lab SHENG Qiang, LI Miaoyi, ZHANG Xingyi, 2015, Location does not matter in the informational age? a case study on the distribution of restaurants listed in dazhongdianping in Beijing. Beijing
6.207/14.15: Networks Lecture 12: Generalized Random Graphs
 6.207/14.15: Networks Lecture 12: Generalized Random Graphs 1 Outline Small-world model Growing random networks Power-law degree distributions: Rich-Get-Richer effects Models: Uniform attachment model
Improving the travel time prediction by using the real-time floating car data
 Improving the travel time prediction by using the real-time floating car data Krzysztof Dembczyński Przemys law Gawe l Andrzej Jaszkiewicz Wojciech Kot lowski Adam Szarecki Institute of Computing Science,
NAME: DATE: Leaving Certificate GEOGRAPHY: Maps and aerial photographs. Maps and Aerial Photographs
 NAME: DATE: Leaving Certificate Geography Maps and Aerial Photographs Please see Teachers Notes for explanations, additional activities, and tips and suggestions. Learning Support Vocabulary, key terms
Travel Time Calculation With GIS in Rail Station Location Optimization
 Travel Time Calculation With GIS in Rail Station Location Optimization Topic Scope: Transit II: Bus and Rail Stop Information and Analysis Paper: # UC8 by Sutapa Samanta Doctoral Student Department of
GEOG 3340: Introduction to Human Geography Research
 GEOG 3340: Introduction to Human Geography Research Lecture 1: Course Overview Guofeng Cao www.myweb.ttu.edu/gucao Department of Geosciences Texas Tech University guofeng.cao@ttu.edu Fall 2015 Course Description
Developing a Community Geographical Information System (GIS) in Rural India
 in Rural India") Developing a Community Geographical Information System (GIS) in Rural India Before rushing off and describing the unique challenges of developing a small scale GIS system India I better first describe
Developing a Community Geographical Information System (GIS) in Rural India Before rushing off and describing the unique challenges of developing a small scale GIS system India I better first describe
FIRST PASS METHODOLOGY OF CITYWIDE FLOOD INUNDATION MAPPING
 FIRST PASS METHODOLOGY OF CITYWIDE FLOOD INUNDATION MAPPING R. VanDrie 1 *, M. Simon 2 1 Shellharbour City Council, PO Box 155, Shellharbour City Centre, 2529 NSW, Australia e-mail rudy.vandrie@shellharbour.nsw.gov.au
Planning in a Geospatially Enabled Society. Michael F. Goodchild University of California Santa Barbara
 Planning in a Geospatially Enabled Society Michael F. Goodchild University of California Santa Barbara What is a geospatially enabled society? Knowing the locations of all points of interest and their
Compact guides GISCO. Geographic information system of the Commission
 Compact guides GISCO Geographic information system of the Commission What is GISCO? GISCO, the Geographic Information System of the COmmission, is a permanent service of Eurostat that fulfils the requirements
MODELLING AND UNDERSTANDING MULTI-TEMPORAL LAND USE CHANGES
 MODELLING AND UNDERSTANDING MULTI-TEMPORAL LAND USE CHANGES Jianquan Cheng Department of Environmental & Geographical Sciences, Manchester Metropolitan University, John Dalton Building, Chester Street,
GIS ANALYSIS METHODOLOGY
 GIS ANALYSIS METHODOLOGY No longer the exclusive domain of cartographers, computer-assisted drawing technicians, mainframes, and workstations, geographic information system (GIS) mapping has migrated to
A study of Spatial Analysis using Space Syntax. Table of Contents
 A study of Spatial Analysis using Space Syntax Oh, ChungWeon *, Hwang, Chulsue ** Table of Contents I. Introduction... 2 II. Spatial Structure... 2 1. Urban spatial structure... 2 2. New town development...
Urban land use information retrieval based on scene classification of Google Street View images
 Urban land use information retrieval based on scene classification of Google Street View images Xiaojiang Li 1, Chuanrong Zhang 1 1 Department of Geography, University of Connecticut, Storrs Email: {xiaojiang.li;chuanrong.zhang}@uconn.edu