Stormwater Management Master Plan
|
|
|
- Job Rodgers
- 6 years ago
- Views:
Transcription
1 City of New Berlin Stormwater Management Master Plan June 2000 Report
2 Contents Executive Summary... ES Section 1 Introduction Project Background Purpose and Scope Section 2 Objectives and Criteria Section 3 Project Setting Study Area Land Use Climate Topography Soils Surface Water Resources Wetlands Natural Areas Wisconsin Storm Water Regulations Other Storm Water Management Related Regulations Section 4 Storm Water Management System Introduction Hydraulic Structure Inventory Water Resources System Streambank Inventory Wetlands Inventory Section 5 Storm Water Management System Analysis Introduction Definition of the Primary Storm Water Management System (PSMS) Hydrologic Model Development Rainfall Input Conveyance System Data Hydraulic Model Development Hydraulic Analysis Results Citywide Culvert Capacity Analysis Section 6 Water Quality Analysis Introduction Water Quality Analysis Methodology Study Area Analysis Industrial Analysis AB i
3 Contents (continued) 6.3 Water Quality Analysis Results Study Area Analysis Industrial Analysis Section 7 Problem Area Identification Introduction Flooding Problem Areas Primary Flooding Problems Problem Area Underwood Problem Area Underwood Problem Area Root Problem Area Root Problem Area Root Problem Area Root Problem Area Deer Minor System Flooding Problems Culvert Capacity Problems Drainage Ditch Problems Streambank Problems Water Quality Problems Section 8 Storm Water Management Options Introduction Storm Water Drainage and Flooding Options Storm Water Drainage and Flooding Option Criteria Storm Water Flooding Options Culvert Capacity Improvements Drainage Ditch Improvements Further Study of Minor System Problems Storm Water Quality Options Source Control Options for Storm Water Quality Improvement Treatment Options for Water Quality Improvement Discussion of Storm Water Quality Options Streambank Stabilization Options Regional Storage Options Section 9 Recommended Storm Water Management Plan Option Selection Storm Water Drainage and Flood Control Plan Primary Flooding Problems Culvert Replacement Program Drainage Ditch Improvements Storm Water Quality Improvement Plan Regional Storage Opportunities Urban Land Development Guidelines Cost Estimate for the Recommended Plan Operations and Maintenance Program Corrective Maintenance AB ii
4 Contents (continued) Preventative Maintenance Aesthetic Maintenance Monitoring and Training Program Drainage Concern Response Strategy Regulatory and Permit Issues Overall Maintenance Costs Storm Water Management Ordinance Section 10 Plan Implementation Prioritization and Implementation of Plan Components Authorities and Partnerships for Plan Implementation City of New Berlin Wisconsin Department of Natural Resources Developers Wisconsin Department of Transportation University of Wisconsin Extension Private Property Owners Waukesha County Technical College Funding the Recommended Plan Plan Re-evaluation and Updating Appendices Appendix A Appendix B Appendix C Appendix D Appendix E Appendix F Appendix G Appendix H Plate 1 - Storm Water Resources Map Plate 2 - Recommended Plan Map Streambank Inventory Storm Water Management System Analysis Water Quality Model Results Suggested Best management Practices for Selected Industries Model Draft Shoreland Management Ordinance Operations and Maintenance Activities Drainage Investigation Form List of Tables Table 1-1 Watershed Areas in the City of New Berlin Table 2-1 Objectives and Criteria for the New Berlin Storm Water Management Plan Table 3-1 City of New Berlin Zoning Rank System for Residential Land Use Table 3-2 Summary of Subwatershed Topography Table 3-3 Soil Characteristics Within the New Berlin Study Area Table 3-4 Major Streams within the New Berlin Study Area Table 3-5 Designated and Known Natural Areas Within the New Berlin Study Area Table 3-6 Summary of Storm Water Management Related Regulations Table 4-1 Summary of Stream Inventory Indicators and Classification Table 4-2 Summary of Streambank Conditions AB iii
5 Contents (continued) Table 4-3 Table 4-4 Table 5-1 Table 5-2 Table 5-3 Table 5-4 Table 6-1 Table 6-2 Table 6-3 Table 6-4 Table 6-5 Table 6-6 Table 7-1 Table 7-2 Table 7-3 Table 7-4 Table 7-5 Table 7-6 Table 7-7 Table 8-1 Table 8-2 Table 8-3 Table 8-4 Table 8-5 Table 8-6 Table 8-7 Table 8-8 Table 9-1 Table 9-2 Table 9-3 Table 10-1 Table 10-2 Table 10-3 Summary of Wetland Areas Within the New Berlin Study Area Significant Wetland Areas Within the New Berlin Study Area New Berlin Primary Storm Water Management System Bulletin 71 - Rainfall Depths in Inches Overtopping Results at Major Culverts Selected Existing and Future Land Use Flows Major Storm Water Pollutants, Sources, and Water Quality Impacts Unit Area Pollutant Loading Rates for the City of New Berlin Study Area Existing Annual Pollutant Loadings by Land Use Existing Annual Pollutant Loadings by Drainage Area Future Annual Pollutant Loadings by Land Use Future Pollutant Loadings by Drainage Area Flood Control and Drainage Problems Culvert Capacity Analysis Results - Undersized Primary Culverts Culvert Capacity Analysis Results - Undersized Secondary Culverts Drainage Ditch Problem Areas Summary of Streambank Stabilization Problem Locations Critical Land Uses in New Berlin by Pollutant Significant Storm Water Pollutant Contributor Areas Summary of Flooding Problem Options Comparison of Source Control Alternatives Comparison of Street Sweeping Schedules Comparison of Storm Water Treatment Alternatives Summary of Water Quality Detention Pond Options Summary of Retrofit Wetland Options Summary of Recommended Water Quality Options Summary of Streambank Stabilization Locations Selected Drainage and Flood Control Plan Selected Water Quality Control Measures Recommended Plan and Estimated Cost Implementation Schedule Storm Water Management Plan Implementation Responsibilities Funding Options for Implementation of the Storm Water Management Plan List of Figures Figure 1-1 Figure 3-1 Figure 3-2 Figure 3-3 Figure 3-4 Figure 3-5 Figure 3-6 Figure 4-1 Figure 4-3 Figure 4-4 Figure 4-5 Figure 4-6 Watershed Map Existing Land Use within the New Berlin Study Area Future Land Use within the New Berlin Study Area Comparison of Existing and Future Land Use within the New Berlin Study Area Average Monthly Precipitation Average Monthly Temperature Soil Textures Map New Berlin Culvert Inventory Worksheet Examples of Stream Reaches Rated Good Examples of Stream Reaches Rated Fair Examples of Stream Reaches Rated Poor Summary of Streambank Indicator Classification AB iv
6 Contents (continued) Figure 4-7 Existing Wetland Areas Figure 6-1 Annual Pollutant Loadings Figure 6-2 Comparison of Existing and Future Annual Pollutant Loadings Figure 6-3 Comparison of Subwatershed Pollutant Loadings Figure 8-1 Typical Wet Detention Pond Figure 8-2 Typical Dry Detention Pond Figure 9-1 Underwood 1 Figure 9-2 Underwood 2 Figure 9-3 Root 1 Figure 9-4 Root 2 Figure 9-5 Root 3 Figure 9-6 Root 4 Figure 9-7 Buena Park Figure 9-8 Urbanization Impacts on Streams AB v
7 Executive Summary City of New Berlin Storm Water Management Plan Introduction Storm water management is a critical municipal responsibility. The effectiveness and efficiency of storm water management have a direct impact on public health and safety, storm water system planning, surface water quality, environmental habitat, and future development. The City of New Berlin and the Wisconsin Department of Natural Resources (WDNR) have joined in a cooperative effort to prepare a Storm Water Management Master Plan for the City of New Berlin. This report presents a summary of the storm water management plan prepared for the City of New Berlin. The development and preparation of the plan have been funded by a local assistance grant received by the City of New Berlin from the WDNR. The Storm Water Management Plan is intended to assist in the implementation of the Nonpoint Source Control Plan for the Root River, Menomonee River, Upper Fox River, and Muskego-Wind Lakes Priority Watershed Projects. The City of New Berlin was recently designated for municipal storm water discharge permitting under NR216 of the Wisconsin Administrative Code by the WDNR. The purpose of the Plan is to identify an approach for the City of New Berlin to: control storm water drainage and flooding in the primary drainage system within the study area, improve the water quality of storm water runoff from urban non-point sources, and meet the municipal permitting application and compliance requirements. The primary tasks conducted as part of preparing the storm water management master plan include: Establishing project objectives to guide the development of the Storm Water Management Plan. Establishing a storm water advisory group Providing guidance regarding the WDNR municipal storm water permit regulations. Inventorying existing conditions related to the drainage system and land use. Conducting the hydrologic-hydraulic analysis. Conducting a citywide culvert capacity analysis. AB ES-1
8 City of New Berlin Storm Water Management Plan Executive Summary Conducting the water quality analysis. Developing storm water management options to mitigate major flooding problems, provide sufficient storm water flow capacity, and reduce pollutant loadings. Reviewing plans prepared by others for specific areas within the city of New Berlin. Evaluating potential regional storage areas. Developing a recommended storm water management plan which addresses flood control, water quality improvement, development guidelines, operation and maintenance practices, development of a storm water management ordinance, and plan implementation. Objectives and Criteria Objectives and criteria guide the development of the Storm Water Management Master Plan. The objectives and criteria developed for the City of New Berlin Storm Water Management Master Plan are compatible with the Nonpoint Source Control Plans prepared for the Root River, Menomonee River, Upper Fox River, and Muskego-Wind Lakes Priority Watersheds and address local issues and concerns. The objectives are listed in Table ES-1. Table ES-1: City of New Berlin Storm Water Management Master Plan Objectives Objective #1 Objective #2 Objective #3 Objective #4 Objective #5 Provide water quality suitable to support the designated potential recreational and biological uses of the streams. Provide storm water drainage and flood control facilities to prevent flood damages to property, prevent health and safety hazards, and prevent drainage-related nuisance and inconvenience. Develop a storm water management system that effectively serves both existing and anticipated future land uses at the lowest practicable cost. Reduce erosion and sedimentation from construction of new development and agricultural activities. Protect environmentally sensitive areas that provide significant surface water quantity or quality benefits. Project Setting The project area incorporates approximately 37 square miles of land including the entire City of New Berlin in Waukesha County, Wisconsin. The study area is generally bordered by College Avenue to the south, by Springdale Road to the west, by Greenfield Avenue to the north, and by 124th Street to the east as shown on Figure 1-1. AB ES-2
9 City of New Berlin Storm Water Management Plan Executive Summary Land use within the study area effects both the quantity and quality of storm water runoff. Imperviousness, materials exposed to storm water, and traffic patterns are a few examples of land use characteristics which affect the hydraulics and potential pollutant loading from an area. The city is developed in urban and rural land uses. The future land use, based on the City of New Berlin Zoning Map, indicates that about 59 percent of the current agricultural lands will be developed into urban land uses. A breakdown of the existing and future land uses is shown on Figures ES-1 and ES-2. Storm Water Management System Storm water runoff from the area is conveyed by a network of drainage ditches, storm sewers, culverts, and streams. A majority of the study area is drained by drainage ditch and culvert systems. Culverts Culverts are a major conveyance element in the City of New Berlin storm water management system. Information regarding about 1,400 culverts was obtained during a citywide field inventory. The inventory included documentation of: the shape, dimensions, length, and construction material of the culvert, the upstream and downstream invert elevations, the presence of debris or obstructions, the culvert end condition, and the structural condition of each culvert. Information collected in the field inventory was used to identify blocked culverts and also used in the citywide culvert capacity analysis. Culverts which are significantly AB ES-3
10 City of New Berlin Storm Water Management Plan Executive Summary undersized or obstructed reduce the efficiency of the storm water drainage system and may cause flooding. Streambanks Streambank erosion is responsible for the delivery of hundreds of tons of sediment to receiving streams annually. In order to reduce the sediment loading, existing and potential streambank erosion areas must be identified and repaired. Approximately 34 miles of channel were evaluated using field techniques developed by the U.S. Department of Agriculture. Nine stability indicators of the upper and lower bank areas of the stream channel were evaluated and classified as excellent, good, fair, or poor. The inventory of the streambank conditions indicated that: # Of the streambanks inventoried, the overall reach condition of 19.8 miles, or 59 percent, is classified good; 13.4 miles, or 40 percent, is classified fair; and 0.2 miles, or 1 percent, is classified poor. # Bank rock content is classified poor for 88 percent of the stream. This indicates that 20 miles of streambank have less than 30 percent rock in the bank and is a reflection of the overall geology of the area. # Vegetative bank protection, debris jam potential, and landform slope are the most common indicators, other than bank rock content, to be rated fair or poor. < 9.5 miles, or 29 percent, of the streambanks have less then 70 percent plant density. < 8.7 miles, or 26 percent, of the streambanks have the quantity and size materials present for the potential to create a flow deflection or debris jam. < 7.2 miles, or 22 percent, of the streambanks have a slope steeper than 40 percent. # Evidence of mass wasting (severe slope failure) was generally not observed in the streambanks inventoried. # The Upper Root River, Poplar Creek, Calhoun Creek, and Underwood Creek subwatersheds have the greatest percentage of streambanks showing significant signs of erosion, streambanks with an overall classification of fair or poor. # The Deer Creek, Tess Corners Creek, and Mill Creek subwatersheds have the greatest percentage of streambanks in good overall condition. Poplar Creek and Deer Creek subwatersheds have the most miles of streambank in good overall condition. Drainage Ditches Drainage ditches convey storm water runoff to the receiving streams throughout a majority of the City of New Berlin storm water management system. The drainage ditches were visually evaluated based on location, shape, lining, erosion, AB ES-4
11 City of New Berlin Storm Water Management Plan Executive Summary sedimentation, vegetation, trash, and standing water. The evaluation identified 32 areas of drainage ditch experiencing erosion, sedimentation, standing water, or debris buildup. Erosion, sedimentation, standing water, and debris buildup within the drainage ditches may significantly reduce the efficiency of the storm water management system. Storm Water Management System Analysis A computer analysis of the Primary Storm Water Management System in the City of New Berlin was conducted. The objectives of this analysis were to: evaluate the capacity and performance of major drainage structures, determine the extent of floodplain areas, assess the magnitude of future increases in flows and flood elevations due to future development areas, and identify existing and possible future capacity problems. The system analysis consisted of the following tasks: Definition of the Primary Storm Water Management System Assembly of watershed surface runoff data Preparation of hydrologic model information Assembly of conveyance system data Formulation of the hydraulic model The hydraulic analysis models were run using the 2-, 10-, 25-, and 100-year recurrence interval storm event runoff flows as input. The models were run under both existing land use and future land use conditions. The results of the hydraulic analysis consist of the flow rate, velocity, and depth at each location considered in the hydraulic model. This information can be used to identify areas of high flood level, channel and culvert capacity shortfalls, and areas of high erosion potential. Road overtopping was detected at 31 locations in the model including 16 locations where overtopping occurs in the 10-year event or less. Differences between existing and future land use flows are shown in Table ES-2 for selected locations in each subwatershed. Flow increases are greatest in the Calhoun Creek, Deer Creek, and Poplar Creek subwatersheds, while flow increases are the smallest in the Underwood Creek and Upper Root River subwatersheds. The flow increases are typically due to future development within the subwatershed. AB ES-5
12 City of New Berlin Storm Water Management Plan Executive Summary Table ES-2: Existing and Future Land Use Flows at Selected Locations Location Existing Flow (cfs) Future Flow (cfs) Percent Change (%) Upper Root River at 124th Street Deer Creek at Rogers Drive 1,250 1, Deer Creek at Moorland Road Deer Creek at National Avenue Calhoun Creek at City Limit Calhoun Creek at upstream of Racine Drive Calhoun Creek at upstream of Calhoun Road Underwood Creek at Meadow Lane Poplar Creek at Cleveland Avenue Water Quality Analysis A water quality analysis was conducted to estimate the amount of pollutants that are discharged into the major streams within New Berlin via storm water runoff. The results of the water quality analysis can be used to target appropriate best management practices to effectively reduce the pollutant loadings in critical areas. The water quality model, a unit-area loading model, is based in part on the Source Loading and Management Model (SLAMM) developed by the WDNR. The analysis is based on: the study area land use, pollutant loading rates for each land use category based on SLAMM, research results, and professional judgement, and existing practices, such as the use of drainage swales. The analysis was conducted for sediment, phosphorous, copper, lead, and zinc, which are typically associated with urban storm water runoff and often cause water quality problems in urban streams. Urban stream water quality problems typically include decreased water clarity, sedimentation, excessive algal growth, and water toxicity. The estimated annual pollutant loadings under existing and future land use conditions from the water quality analysis are shown on Figure ES-3. AB ES-6
13 City of New Berlin Storm Water Management Plan Executive Summary The analysis indicated that: Agricultural and residential land use account for 49 and 44 percent of the total sediment loading under existing and future land use conditions, respectively. Extractive land use accounts for more than 20 percent of the total sediment loading under existing and future conditions. Agricultural and park land uses account for 57 and 46 percent of the phosphorous loading under existing and future conditions. Figure ES-3: Total Annual Pollutant Loadings Phosphorous (lb/yr) Copper (lb/yr) Sediment (tons/yr) Lead (lb/yr) Zinc (lb/yr) Existing Conditions Future Conditions Commercial, industrial, and highway land use account for 46 to 78 percent of the total metals loadings under existing and future conditions, respectively. The total sediment and phosphorous loading are reduced by 12 and 6 percent, respectively from existing to future conditions, while the metal loadings are increased by more than 30 percent due to development of agricultural lands. A separate industrial pollutant loading analysis was conducted to further evaluate the amount of pollutants discharged to storm water runoff from industries within the City of New Berlin. The results can then be used to identify those industries that have the greatest potential for contributing significant storm water pollutant loadings and to identify appropriate best management practices for those industries. The analysis indicates that five of the industrial categories, fabricated metal products, transportation equipment, electronics, land transportation, and printing and publishing, contribute over one-half of the total industrial loading of all pollutants. The industrial facilities in these five categories occupy approximately 350 acres, or over 80 percent of the industrial areas evaluated. Based on the total loading calculated by the industrial water quality analysis: A majority of the industrial metals loading is contributed by fabricated metal products, transportation equipment, electronics, land transportation, and printing and publishing facilities. A majority of the industrial sediment loading is contributed by Timber Products and Land Transportation facilities. AB ES-7
14 City of New Berlin Storm Water Management Plan Executive Summary A majority of the industrial nutrient loading is contributed by transportation equipment and land transportation facilities. Problem Areas The analysis conducted as part of this storm water management master plan identified potential problem areas related to flooding and drainage, streambank stability, culvert capacity, and water quality. The problems identified are described in the following paragraphs. Flooding and Drainage Problem Areas Flooding and drainage areas were reported by City of New Berlin residents and representatives. In order to evaluate the flooding problems, a priority system was developed to differentiate varying degrees of problem severity. Priorities are based upon two factors: the cost-effectiveness of the project and whether storm water management improvements can adequately solve the problem. Primary problems encompass both factors. Seven primary problems were identified from the reported problems. The primary problems are presented in Table ES-3. Table ES-3 Summary of Primary Flooding and Drainage Problem Areas Problem Area Designation General Location Description of Problem UNDERWOOD1 Underwood Creek at Meadow Lane Along Meadow Lane between 128th and 124th Street, the South Branch of Underwood Creek is enclosed in a rectangular storm sewer. There are numerous reports of house, yard, and street flooding associated with this enclosed channel. UNDERWOOD 2a Underwood Creek near Elm Grove Road This problem involves overbank flooding of yards and homes along a reach of the South Branch of Underwood Creek beginning about 500 feet upstream of Arcadian Drive. The primary cause of the problem is that the properties are in or very close to the 100-year floodplain. UNDERWOOD 2b Gatewood Park This residential area, east of Sunny Slope Road and South of Greenfield Avenue, experiences extensive yard and basement flooding due to slow drainage of the neighborhood and adjacent cemetery. The cause of the problem is mild roadside ditch slopes and inadequate outlet capacity under Sunny Slope Road. ROOT1 Upper Root River- 130th Block of Park Avenue One residence experiences flooding along Park Avenue due to inadequately sized downstream culvert at Graham Street. Also, inadequate drainage ditch capacity exists between Elm Grove Road and Honey Lane south to the golf course. ROOT2 Upper Root River 132nd Street to Lagoon Road along Cleveland Avenue Approximately 15 homes are within the floodplain in the area bounded by Cleveland Avenue, National Avenue, 124th Street, and 132nd Street. Road flooding occurs on Lagoon Road north of Cleveland Avenue. A private bridge at 128th Street and Cleveland Avenue has been washed out. ROOT3 Upper Root River - A structure located adjacent to a tributary of the Upper Root River near Grange Avenue AB ES-8
15 City of New Berlin Storm Water Management Plan Executive Summary Table ES-3 Summary of Primary Flooding and Drainage Problem Areas Problem Area Designation General Location LaSalle Drive and Grange Avenue Description of Problem experiences flooding. The problem is caused by inadequate culvert capacity downstream at St. Mary s Drive. ROOT4 Upper Root River - Honey Lane Yard flooding and erosion are experienced by several residences along a tributary to the Upper Root River and also drainage problems along the railroad tracks north of Honey Lane near Elm Grove Road. The problem is due to inadequate drainage capacity and culvert capacity. DEER1 Deer Creek - Buena Park Six residences along 168th Street experience structural flooding. Several additional residences experience yard and basement flooding. The problem stems from backup from inadequate culverts, ditch capacity, and lot grading. The general area slope is very flat. In addition, most homes have sump pump discharge into the ditch. Lawn clippings and yard waste contribute to culvert blockage. Thirteen storm water flooding problems were identified as minor. The New Berlin Storm Water Management Master Plan does not provide conceptual engineering solutions to minor system problems. Culvert Capacity Problem Areas The hydrologic and hydraulic computer modeling included a capacity analysis of 73 road crossings culverts in the primary storm water management system. The analysis indicates that 32 of the primary culverts have capacity deficiencies. Capacity deficiencies within the primary system are defined by the following criteria: overtopping of a main arterial in the 100-year storm, insufficient flow capacity for the 100-year storm, or excessive backwater behind a culvert in a developed area. Approximately 41 percent of the primary culverts with capacity deficiencies are located within the Upper Root River subwatershed. Secondary culverts were analyzed as part of the citywide culvert capacity analysis. The analysis indicates that 83 culverts have culvert deficiencies. Capacity deficiency within the secondary system is defined as not being able to pass the 10-year storm. Drainage Ditch Problem Areas The drainage ditch inspection identified 32 problem areas. A problem area is defined as a location where erosion, sedimentation, debris accumulation, or standing water were observed. About 65 percent of the drainage ditch problem areas are located in the Deer Creek and Upper Root River subwatersheds. Streambank Problem Areas The streambank inventory classified approximately 14 miles of channel as fair or poor based on the US Department of Agriculture/Phankuch method. A majority of the AB ES-9
16 City of New Berlin Storm Water Management Plan Executive Summary miles of streambanks rated as fair or poor are located in the Poplar Creek, Calhoun Creek, and Upper Root River subwatersheds. Water Quality Problem Areas Based on the annual pollutant loadings generated by the analysis, critical land uses, land uses which contribute a majority of the storm water pollutants, were identified. Critical land uses for sediment include agriculture, extractive, and residential land use; critical land uses for phosphorous include agriculture, residential, and park land uses, and critical land uses for metal include highway/arterial, commercial, and industrial land uses. Based on an overall consideration of the pollutant loadings, areas which are significant contributors of pollutants within New Berlin are identified and presented on Table ES-4. Table ES-4: Significant Storm Water Pollutant Contributor Areas Area Contributing Land Use Pollutants of Concern Critical Land Use Areas throughout the City of New Berlin Industrial, agricultural, residential, highways and arterials, and developing and redeveloping areas Various Rock Freeway Highway Metals Industrial Park Industrial and commercial areas Metals 6C010 - Northwest area of Poplar Creek subwatershed Industrial and agricultural areas Metals, Phosphorous, Sediment 5A020 - Southeast area of Tess Corners Creek subwatershed Agricultural and commercial areas Sediment, Phosphorous, Metals 4C010 - Northern area of Calhoun Creek subwatershed Residential, highway, and agricultural areas Metals, Phosphorous Sediment 7D010 & Various - Northern area of Mill Creek subwatershed Extractive Sediment The industrial analysis further evaluated the pollutant loadings from industries within New Berlin. Based on the analysis, the industries with the greatest potential for contributing significant storm water pollutant loadings are fabricated metal product manufacturers; transportation equipment manufacturers; land transportation facilities(warehouses and trucking facilities); electronic, electrical, photographic and optical facilities, and printing and publishing industries. Extractive industries are also considered a potential significant contributor based on the study area analysis. AB ES-10
17 City of New Berlin Storm Water Management Plan Executive Summary Regional Detention Evaluation The purpose of regional detention is to mitigate the cumulative impacts of existing and future development in an area. Regional detention is often proposed because it is perceived to be more effective at controlling flood peaks than constructing individual storage ponds at numerous sites. Presumably, a regional detention facility is also more cost effective than individual basins because of the economy of scale associated with building one large pond. Sites evaluated for potential regional detention are located in the Poplar Creek and Tess Corners Creek Watersheds. The site locations and relative sizes are : Site RD-1 is located just north of College Avenue on the northeast side of Tess Corners Creek. This site will hold 240 acre-feet of water which will reduce the existing landuse 100-year peak flow by 100 cfs and reduce the future conditions peak flow by as much as 300 cfs. The detention facility would have a design depth of about 7 feet and cover an area of 38 to 40 acres. Site RD-2 is located just east of Calhoun Road, on the east side of Poplar Creek and south of Coffee Road. This site would be designed to hold 51 acre-feet of water which will reduce the future conditions 100-year peak flow by as much as 80 cfs. The detention facility would have a design depth of about 4.4 feet and cover an area of 20 acres. Site RD-3 is located on the west side of Poplar Creek, just south of Coffee Road. This site would be designed to hold 200 acre-feet of water which will reduce the future conditions 100-year peak flow by as much as 260 cfs. The detention facility would have a design depth of about 7.7 feet and cover an area of 45 acres. Site RD-4 is located on the east side of Calhoun Road, just north of Coffee Road. This site would be designed to hold 236 acre-feet of water which will reduce the future conditions 100-year peak flow by as much as 240 cfs. The detention facility would have a design depth of about 5.9 feet and cover an area of 67 acres. The site locations are shown on the Recommended Plan Map presented in Appendix A of this report. These regional sites will help prevent future flooding problems due to development and may reduce flooding problems that already exist. Regional detention sites recommended in the Stormwater Management Plan for the Deer Creek Watershed prepared by Bonestroo Rosne Anderlick & Associates in 1993 and in the Westridge Storm Water Management Plan prepared by Ruekert /Mielke in 1995 have been incorporated into this report. The recommendations presented in the reports prepared by others were not analyzed as part of this Plan. The location of these storage locations recommended by others are presented in Appendix I. AB ES-11
18 City of New Berlin Storm Water Management Plan Executive Summary Recommended Plan The recommended plan includes a variety of structural and non-structural measures which will effectively and efficiently meet the goals and objectives of this plan, reduce flooding and drainage problems, and improve the quality of storm water runoff. The elements of the drainage and flood control plan, the water quality improvement plan, and the regional detention opportunities are presented on Tables ES-5, ES-6, and ES-7 respectively. The recommended plan also includes adoption and enforcement of a storm water management ordinance to prevent new flooding areas from occurring and reduce pollutant loadings from new development areas. The estimated capital cost of the recommended plan is $4,681,000. The estimated annual operation and maintenance cost is $537,000. The estimated costs are for planning purposes only and do not include land acquisition, construction site erosion control, unknown environmental constraints, legal fees, or utility relocation costs. The recommended plan provides a 100-year level of protection from flooding and drainage problems when feasible and results in a reduction in the total annual pollutant loading of 37 percent of sediment, 26 percent of phosphorous, and 7 percent of lead. AB ES-12
19 City of New Berlin Storm Water Management Plan Executive Summary Table ES-5: Selected Drainage and Flood Control Plan Problem Number Problem Summary Selected Alternative Level of Protection Capital Cost Annual Operations and Maintenance Cost UNDERWOOD 1 Along Meadow Lane between 128th and 124th Streets, the South Branch of Underwood Creek is enclosed in a storm sewer. Overflow of the box culvert entrance at 124th Street and Meadow Lane floods basements and backyards. There are numerous reports of house, yard, and street flooding associated with this enclosed channel. Reduce flow with upstream storage recommended as part of UNDERWOOD 2a, increase conveyance capacity of the storm sewer entrance, including a sloped trash rack which is less susceptible to debris clogging. 100 year $50,000- $100,000 $8,000 UNDERWOOD 2a Overbank flooding of yards and homes along the South Branch of Underwood Creek beginning about 500 feet upstream of Arcadian Drive. Flooding southwest of the intersection of Elm Grove Road and Meadow Lane. 30 acre-foot storage facility located north of Greenfield Avenue in the City of Brookfield. Also provides necessary storage for Problem UNDERWOOD year $790,000 $10,000 UNDERWOOD 2b Yard, street, and basement flooding in the Gatewood Park neighborhood. Additional 60-inch storm sewer to serve Gatewood Park area. 25 year 1 $400,000 $1,000 ROOT 1 One residence experiences flooding along Park Avenue near Elm Grove Road. Yard flooding and erosion in backyards on the north side of Park Avenue. Installation of a new culvert at Graham Street and channel expansion between Graham Street and Elm Grove Road. 25 year 1 $101,000 $1,000 ROOT 2 15 homes are within the floodplain in the area bounded by Cleveland Avenue, National Avenue, 124th Street, and 132nd Street. Road flooding on Online detention storage at four locations in the area and floodplain lowering. 100 year $2,500,000 $10,000 AB ES-13
20 City of New Berlin Storm Water Management Plan Executive Summary Table ES-5: Selected Drainage and Flood Control Plan Problem Number Problem Summary Selected Alternative Level of Protection Capital Cost Annual Operations and Maintenance Cost Lagoon Road north of Cleveland Avenue. Washout of private bridge at 128th Street and Cleveland Avenue ROOT 3 House flooding upstream of Grange Avenue near Francis Avenue. Replace culverts at St. Mary=s Drive and lower floodplain south of Grange Avenue. 100 year $350,000 $1,000 ROOT 4 Yard flooding and erosion near Honey Lane and Elm Grove Road. Flooding of one residence and several yards east of the intersection at Elm Grove Road and Honey Lane. Regrade roadside and railroad ditches in the area. 10 year 1 $30, DEER 1 Six residences experience structural flooding along 168th Street in the Buena Park neighborhood south of Greenfield Avenue. The flooding is caused by inadequate drainage. Sump pumps discharge to the drainage ditch and lawn clippings and yard waste contribute to culvert blockage. Reconstruct ditches with some segments of storm sewer from Fullerton Avenue to Roosevelt Avenue. Also redirect sump pumps to lawn areas rather than direct discharge to the drainage ditches. Clean debris from ditches and culverts. 10 year 1 $180,000 $2,000 Various Minor System Flooding Problems- Upper Root River subwatershed: < Parkwood Lane Storm Sewer Capacity Calhoun Creek subwatershed: < Sediment and debris blockage at Sovereign Dr. Poplar Creek subwatershed: To be determined to be determined to be determined to be determined AB ES-14
21 City of New Berlin Storm Water Management Plan Executive Summary Table ES-5: Selected Drainage and Flood Control Plan Problem Number Problem Summary Selected Alternative Level of Protection Capital Cost Annual Operations and Maintenance Cost < Minor erosion on Poplar Creek between Calhoun Road and Victor Road < Drainage easement backup at 157th Street and Monterey Drive. < Insufficient ditch storage at 158th Street and Santa Rosa Boulevard < Sediment and debris blockage at Calhoun Road and Salentive Drive Underwood Creek subwatershed: < Insufficient drainage from Highland Memorial Park < Lack of storm water conveyance at Gatewood Drive and Clover Knoll Place < Inadequate culvert capacity at Kostner Lane and C & NW Railroad < Sediment and debris blockage of Sunny Slope Road culvert < Surcharging manhole at block of Greenfield Avenue. < Insufficient ditch storage at 124th Street and Prospect Drive. Deer Creek: Inadequate local drainage in backyards between 164th and 168th Street and Roosevelt Avenue. AB ES-15
22 City of New Berlin Storm Water Management Plan Executive Summary Table ES-5: Selected Drainage and Flood Control Plan Problem Number Problem Summary Selected Alternative Level of Protection Capital Cost Annual Operations and Maintenance Cost Citywide Undersized culverts Replace designated culverts $50,000 Citywide Drainage ditch problem locations Repair ditch areas to improve the conveyance efficiency $25,000 Drainage and Flood Control Total $4,426,000 2 $108,000 2 Notes: 1 an alternative to achieve 100-year level of protection was not considered economically feasible. 2 these costs do not include alternatives to address minor system flooding problems. These estimated costs are for planning purposes only and do not include land acquisition, construction site erosion control, unknown environmental constraints, legal fees, or utility relocation costs. Table ES-6: Selected Water Quality Control Measures Source Control Measure Description Estimated Reduction of Total Annual Load Comments Capital Cost Annual Operations & Maintenance Costs Source Control Measures Develop in Accordance The change from existing to future land use, based on the zoning map. sediment 12% phosphorous 6% As new areas are developed, the land use will transform from agricultural to urban. Sediment AB ES-16
23 City of New Berlin Storm Water Management Plan Executive Summary Table ES-6: Selected Water Quality Control Measures Source Control Measure Description Estimated Reduction of Total Annual Load Comments Capital Cost Annual Operations & Maintenance Costs with the Zoning Map lead -34% and phosphorous loading will be reduced. However, due to the more urban land use, the metals loading is expected to increase. Adopt & Enforce Storm Water Ordinance The draft storm water ordinance requires new development to provide storm water quality improvement. sediment 9% phosphorous 5% lead 14% The storage and water quality requirements will be essential in eliminating new flooding or water quality problems caused by urban development. --- $10,000 Industrial Best Management Practices Industries regulated by NR216 are required to implement best management practices. Additionally, industries which are potential significant pollutant contributors should implement applicable suggested best management practices. sediment 4% phosphorous 0.3% lead 3% To ensure we achieve the estimated pollutant reduction, routine monitoring/reporting may be necessary. Cost incurred by industries Cost incurred by industries Roadway Pavement Sweeping Arterials and Industrial Park Area: Seasonal sweeping program (weekly from April through May, bi-weekly June through August, monthly from September through November and during March) sediment 1% phosphorous 0.5% lead 3% $125,000 Ice Management Practices Implement improved salt distribution methods, train personnel involved with salt distribution variable Ice management should involve a policy decision on the part of the common council regarding the frequency, level, and extent of deicing. Minimal Minimal Catch Basin Clean catch basins twice per year / install catch sediment -- $5,000 per $70/yr./catch AB ES-17
24 City of New Berlin Storm Water Management Plan Executive Summary Table ES-6: Selected Water Quality Control Measures Source Control Measure Description Estimated Reduction of Total Annual Load Comments Capital Cost Annual Operations & Maintenance Costs Cleaning / Retrofit basins in new development or redeveloping areas which will be serviced by storm sewer tons/acre drained lead 0.05 lbs./ acre drained new catch basin installed basin cleaned (assume 200 basins cleaned /yr. for cost estimate) Landscape Practices Implement environmentally friendly landscape practices in institutional yards, park areas, school yards, city building yards, and vegetated median strips. sediment 0.4% phosphorous 2% lead 2% Examples of environmentally friendly practices include increased turf height, reduced weed control, replacement of turf with low maintenance ground cover or perennials, and reduced fertilizer application. Minimal Minimal Snow Storage Practices Locate snow storage areas in a well-vegetated area at least 200 feet from a drainage way or storm sewer inlet. variable Implementation of this practice provides the snow melt an opportunity to filter though the vegetated area which will remove a portion of the pollutant loading. Minimal Minimal Erosion Control Ordinance Increase the construction site inspection program, and train inspectors on erosion control techniques. variable -- Minimal Minimal Agricultural Practices Encourage use of Agricultural BMPs such as conservation tillage and adopt a shoreline management ordinance. sediment 6.5% phosphorous 7% lead 0.1% County may be primarily responsible for implementation of agricultural practices. Cost incurred by farmers Cost incurred by farmers AB ES-18
25 City of New Berlin Storm Water Management Plan Executive Summary Table ES-6: Selected Water Quality Control Measures Source Control Measure Description Estimated Reduction of Total Annual Load Comments Capital Cost Annual Operations & Maintenance Costs Streambank Stabilization Stabilize key streambanks as identified in Section 7 (about 1.2 miles per year) variable Streambank stabilization measures may include: vegetation, erosion protection, and debris removal in designated areas. --- $250,000 Public Education and Information Program Provide information to the general public and industries on the Storm Water Management Master Plan variable Topics may include: Lawn care, pet waste handling, other best management practices, as well as the NR216 requirements. May utilize newsletters, newspaper articles, school programs, cable TV and use of preprinted materials and videos. Variable Variable Treatment Measures Water Quality Detention Basin Construct a water quality detention basin west of Kelly Lake. sediment 2% phosphorous 1.5% lead 3% -- to be determined to be determined Retrofit Wetland Retrofit three prior converted wetlands into storm water treatment wetlands for highway runoff. Locations: north of I-43 west of Calhoun Road, north of I-43 west of Moorland Road, and south of I- 43 east of Moorland Road. sediment 2% phosphorous 3% lead 15% -- $75,000 $10,000 Retrofit Wetland Retrofit one prior converted wetland within Basin 5A020 south of National Avenue and east of sediment 1% phosphorous 1% Will collect runoff from agricultural and residential land use areas. $165,000 $10,000 AB ES-19
26 City of New Berlin Storm Water Management Plan Executive Summary Table ES-6: Selected Water Quality Control Measures Source Control Measure Description Estimated Reduction of Total Annual Load Comments Capital Cost Annual Operations & Maintenance Costs Moorland Road. lead 0.5% Retrofit Wetland Retrofit one prior converted wetland within Basin 3A060 north of College Avenue, west of Sunny Slope Road, and east of Small Road sediment 0.2% phosphorous 0.1% lead 0.9% Will collect runoff from commercial land use area. $15,000 $10,000 Water Quality Control Measures Total $255,000* $429,000 * cost for installation of new catch basins not included. Note: These estimated costs are for planning purposes only and do not include land acquisition, construction site erosion control, unknown environmental constraints, legal fees, or utility relocation costs. Table ES-7: Potential Regional Detention Sites Pond Number Location Approximate Drainage Area (acres) Volume (acre-feet) Capital Cost RD-1 Northeast side of Tess Corners Creek, North of College Avenue $2,651,000 1 RD-2 East of Calhoun Road, south of Coffee Road $1,712,130 1 RD-3 West side of Poplar Creek, south of Coffee Road 2, $8,430,030 1 RD-4 East of Calhoun Road, north of Coffee Road $13,504,870 1 Regional ponds recommended in the Stormwater Management Plan for the Deer Creek Subwatershed prepared by Bonestroo Rosene Anderlick & Associates 2 AB ES-20
27 City of New Berlin Storm Water Management Plan Executive Summary Table ES-7: Potential Regional Detention Sites Pond Number Location Approximate Drainage Area (acres) Volume (acre-feet) Capital Cost NP-1 NW & NE1/4 of Section 3 not available 1,64.3 $971,000 CP-1 NW1/4 of Section 11 not available 0.3 not available CP-2 NW1/4 of Section 11 not available 11.9 not available CP-3 NE1/4 of Section 10 not available 24.1 not available CP-4 SW1/4 of Section 3 not available 9.9 $244,000 CP-5 SW1/4 of Section 3 not available 10.3 $171,000 CP-6 SW1/4 of Section 3 not available 45.8 $180,000 CP-7 SE1/4 of Section 3 not available 50.5 not available CR-2 not available not available $10,000 CR-3 not available not available $26,000 SCP-1 SW1/4 of Section 11 not available 0.4 $74,000 SCP-2 SW1/4 of Section 11 not available 2.2 $24,000 SCP-3 SW1/4 of Section 11 not available 1.2 $37,000 SCP-4 SW1/4 of Section 11 not available 5.3 $144,000 SCP-5 SW1/4 of Section 11 not available 4.8 not available SCP-6 SW1/4 of Section 11 not available 34.9 $466,000 AB ES-21
28 City of New Berlin Storm Water Management Plan Executive Summary Table ES-7: Potential Regional Detention Sites Pond Number Location Approximate Drainage Area (acres) SCP-7 Volume (acre-feet) Capital Cost SE1/4 of Section 10 not available 5.4 $32,000 SCP-8 SE1/4 of Section 10 not available 8.8 $50,000 CR-1 SE1/4 of Section 10 not available 25.1 $10,000 SP-1 SW1/4 of Section 23 not available 11.2 $4,000 SP-2 N1/2 of Section 23 & S1/2 of Section 14 not available 90.9 $516,000 SP-3 SW1/4 of Section 14 not available 10.3 $41,000 SP-4 SE1/4 of Section 14 not available 13 $54,000 SP-5 SW1/4 of Section 14 not available 4.4 $535,000 CR-4 Section 11,14,&23 not available 7.5 $26,000 Regional ponds recommended in the Westridge Stormwater Management Plan prepared by Ruekert/Mielke 2 G3 NE1/4 of Section 34 not available 18.5 not available H1/2 SW1/4 of Section not available H1/4 NW1/4 of Section not available H1/5 NW1/4 of Section not available H1/6 NE1/4 of Section not available H2/1 SE1/4 of Section not available AB ES-22
29 City of New Berlin Storm Water Management Plan Executive Summary Table ES-7: Potential Regional Detention Sites Pond Number Location Approximate Drainage Area (acres) H2/3 Volume (acre-feet) Capital Cost SW1/4 of Section 26 not available 3.00 not available H3/2 NE1/4 of Section 27 not available 7.08 not available H3/3 SW1/4 of Section 27 not available not available H3/4 NE1/4 of Section 27 not available 3.10 not available Note: 1 - These costs are for planning purposes only and do not include land acquisition, construction site erosion control, unknown environmental constraints, legal fees, or utility relocation costs which may be associated with the plan. 2 - The recommendations presented in reports prepared by others were analyzed as part of this plan. The costs listed in this table have not been updated. The plans should be referred to far additional information. AB ES-23
30 Section 1 Introduction 1.1 Project Background Storm water management is a critical municipal responsibility. The effectiveness and efficiency of storm water management have a direct impact on: Public health - polluted and contaminated waters can come into contact with citizens Public safety - streets and buildings can become damaged by flood water Storm water system planning, design, and construction Control and reduction of inflow and infiltration of storm water into the sanitary sewer Surface water quality Maintenance and enhancement of environmental habitats Future development Regulatory compliance The City of New Berlin and the Wisconsin Department of Natural Resources (WDNR) have joined in a cooperative effort to prepare a Storm Water Management Master Plan for New Berlin. The New Berlin study area incorporates about 37 square miles including the entire City of New Berlin. The study area is located within five major watersheds: the Upper Fox River watershed, the Middle Fox watershed, the Root River watershed, the Muskego-Wind Lakes watershed, and the Menomonee River watershed. These five watersheds are further divided into seven subwatersheds. Table 1-1 presents the drainage areas within each watershed and subwatershed. The study area and watershed boundaries are shown on Figure 1-1. Each of these major watersheds, except the Middle Fox River, has been designated a Apriority watershed.@ Because these watersheds incorporate major portions of the region including several governmental entities, the New Berlin Storm Water Management Master Plan must be consistent with, and assist in the implementation of comprehensive flood control and non-point source plans. Under the Wisconsin Non-point Source Water Pollution Abatement Program, the Wisconsin Department of Natural Resources developed non-point source control plans for several priority watersheds. Each non-point source control plan: assesses AB 1-1
31 Section 1 Introduction the watershed characteristics including cultural natural resources, surface water, and groundwater features; describes watershed planning methods including evaluation of water quality and aquatic habitat; describes water resource conditions, non-point sources, and water resource objectives for the watershed; describes non-point control needs for urban and rural sources; and describes a detailed program for implementation. The WDNR prepared priority non-point source control plans for the Root River watershed (1980), the Menomonee River watershed (1991), the Upper Fox River watershed (1994), and the Muskego-Wind Lakes watershed (1994). The priority watersheds cover the entire city except for the 3.6 square mile area of the Mill Creek subwatershed within the Middle Fox River watershed. The Middle Fox River watershed is expected to be selected for priority watershed planning in 1999 or AB 1-2
32
33 Section 1 Introduction Table 1-1 Watershed Areas in the City of New Berlin Watershed Subwatershed Upper Fox River Area (square miles) Percent Total Deer Creek Poplar Creek subtotal Muskego-Wind Lakes Calhoun Creek subtotal Middle Fox River Mill Creek subtotal Root River Upper Root Tess Corners Creek subtotal Menomonee River Underwood Creek subtotal TOTAL The Menomonee River, Upper Fox River, Root River, and Muskego - Wind Lakes watershed=s non-point source control plans include the following specific information: Water Resource Objectives: The overall water resource objective is to contribute to the full attainment of the designated potential recreational and biological uses of the AB 1-4
34 Section 1 Introduction Menomonee, Upper Fox and Root Rivers, and the Muskego - Wind Lakes. The designated potential recreational and biological uses of each river/lake are as follows. - Root River Watershed: Upper Root River - limited fish and aquatic life Tess Corners Creek - warm water fish and aquatic life - Upper Fox River Watershed Poplar Creek - warm water sport fish Tributaries to Poplar Creek - warm water sport fish and forage fish, or limited aquatic life - Menomonee River Watershed South Branch Underwood Creek - limited to aquatic life - Muskego - Wind Lakes Watershed Calhoun Creek - warm water sport fish or warm water forage fish Only the South Branch of Underwood Creek in the Menomonee River watershed is currently fully meeting its potential biological use. The remaining portion of the Menomonee River watershed and the other priority watersheds are currently partially meeting the potential biological use classifications. The WDNR recommends that biological uses be protected in those waters fully meeting their potential, enhanced in those waters partially meeting their potential, and improved in those waters not meeting their potential. In order to achieve the potential uses of the rivers, a 50 to 75 percent reduction in sediment loading, a 30 to 75 percent reduction in nutrient loading, and a 40 to 53 percent reduction in the loading of toxic substances, such as lead, was recommended for the Menomonee, Upper Fox and Root Rivers, and the Muskego - Wind Lakes. Critical Urban Land Uses and Significant Rural Sources: Critical urban land uses for the City of New Berlin identified within the priority watershed plans include: Root River: Industrial, commercial, and planned development Upper Fox River: Industrial, commercial shopping malls, and commercial strip areas Menomonee River: Industrial, commercial, high density, residential, and planned development Muskego-Wind Lakes: Industrial, high density, residential, freeway, and commercial Significant rural non-point pollution sources identified include barnyard runoff, manure spreading, streambank erosion, and cropland erosion. AB 1-5
35 Section 1 Introduction Recommended Pollution Control Measures: ACore@ urban management measures recommended to achieve pollutant reductions included construction erosion controls, early spring street sweeping, leaf and lawn management, pet waste handling and disposal, used oil management, stream bank erosion control, and storm water management of new development. Each Priority Watershed Plan recommended a level of pollution control equivalent to providing wet detention (ponds) for 100 percent of the critical urban land uses. Recommended non-point source pollution control measures include grassed swales, infiltration basins and trenches, wet detention ponds, construction erosion controls, streambank stabilization, and agricultural land management practices and livestock controls. To assist in implementation of the Non-point Source Plans the WDNR provides local assistance grants to communities. The City of Berlin received a local assistance grant from the WDNR to assist in funding the development of this storm water management plan. This planning effort is intended to assist in the implementation of the Non-point Source Control Plans for the Menomonee, Upper Fox, and Root Rivers, and the Muskego - Wind Lakes. 1.2 Purpose and Scope The purpose of this Storm Water Management Master Plan for New Berlin is to: control storm water drainage and flooding in the primary system, such as in major storm sewers, natural streams and channels, and manmade channels, improve water quality from non-point sources, and assist New Berlin in their municipal permitting application and compliance efforts. The development of the Storm Water Management Master Plan for the City of New Berlin includes the following tasks: Establishing objectives which are compatible with the WDNR priority watershed plans. Objectives are the goals that the plan will be designed to achieve. Project objectives are developed for water quality improvement, drainage and flood control, effective storm water management, erosion and sedimentation control, and environmentally sensitive area protection. The plan objectives and supporting criteria are presented in Section 2 of this report. Establishing a storm water advisory group including representatives from the City of New Berlin, WDNR, Wisconsin Department of Transportation (WDOT), and interested citizens. The primary role of the group is to guide the planning process by involvement in the plan and to support the plan recommendations. Providing guidance to New Berlin regarding the WDNR municipal storm water permit regulations including permit application options and requirements. AB 1-6
36 Section 1 Introduction Inventory of existing conditions related to the drainage system and land use including a review of available information from New Berlin, Waukesha County, Southeastern Wisconsin Regional Planning Commission (SEWRPC), WDOT, and WDNR, as well as field inventories of drainage culverts and storm sewers, stream channels, and wetlands. The project setting and storm water management system are described in Sections 3 and 4 of this report, respectively. Reviewing the storm water management plans prepared for the Deer Creek watershed and the Westridge area to identify recommendations to incorporate into the Storm Water Management Master Plan. Recommendations from the storm water management plans prepared by others are presented in Section 9 of this report. Conducting hydrologic-hydraulic analysis to develop peak flow conditions and to identify major storm water drainage and flooding problem areas. The hydrologichydraulic analysis methodology and results are presented in Section 5 of this report. Conducting water quality analysis to estimate the pollutant loadings to the major receiving streams within the project area. The water quality analysis methodology and results are presented in Section 6 of this report. Conducting an evaluation of regional storage sites to mitigate the cumulative impact of existing and future development in an area. The regional storage evaluation and results are presented in Section 8 of this report. Developing storm water management options to mitigate identified major flooding problems, provide sufficient capacity for storm water flows, reduce pollutant loadings to the receiving waters, and improve receiving water quality. The major flooding and water quality problem areas are identified in Section 7 and storm water management options are presented in Section 8 of this report. Develop a recommended storm water management master plan that consists of three elements: urban land development guidelines, flood control options, and water quality improvement recommendations. In addition, the three tasks listed below are included: - Develop an operation and maintenance program for the City=s open channels, culverts, and detention facilities. The program will identify needed maintenance procedures and activities, establish a priority and schedule for maintaining individual system components and define program management needs. - Developing a prioritization system based on property damage, inconvenience, cost, and other factors, and outline procedures to address resident complaints and concerns about drainage or pollution problems. AB 1-7
37 Section 1 Introduction - Developing a storm water management ordinance for the City of New Berlin. The ordinance will be based on the model ordinances prepared by the Waukesha County Department of Parks and Land Use and by the WDNR, but will be tailored to the City of New Berlin=s specific needs and conditions. The ordinance will be drafted in coordination with the City, WDNR, and the Advisory Group. The recommended storm water management plan is presented in Section 9. Develop an implementation strategy for the recommended storm water management master plan. A schedule is developed to prioritize the recommended measures for implementation and funding. The implementation strategy is presented in Section 10. AB 1-8
38 Section 2 Objectives and Criteria Objectives and criteria guide the development of the Storm Water Management Master Plan. The project objectives are the goals that this plan is designed to achieve. Each objective is supported by several criteria. Criteria are used to evaluate the degree to which each objective is achieved, to design plan components, and to measure the effectiveness of the plan. Objectives and criteria established for this plan, presented on Table 2-1, are compatible with the Priority Watershed Plans and address local issues and concerns. The objectives and criteria address surface water quality, storm water drainage and flood control, protection of wetlands and other environmentally sensitive areas, and cost effectiveness. Table 2-1: Objectives and Criteria for the New Berlin Storm Water Management Master Plan Objective No. 1 Provide water quality suitable to support the designated potential recreational and biological uses of the streams. The designated use classifications are: # Root River Watershed < Upper Root River -- limited fish and aquatic life < Tess Corners Creek -- warm water fish and aquatic life # Upper Fox River Watershed < Poplar Creek -- warm water sport fish < Tributaries to Poplar Creek -- warm water sport fish, warm water forage fish, or limited aquatic life # Muskego - Wind Lakes Watershed < Calhoun Creek -- warm water sport fish, warm water forage fish, or limited forage fish # Menomonee River Watershed < South Branch Underwood Creek -- limited aquatic life Criteria a. Achieve the water quality standard set forth in NR 102, 104, and 105 of the Wisconsin Administrative Code that support the designated use classifications. b. Achieve the pollutant reduction goals set forth in the non-point source control plans for the Root River watershed (1980), the Menomonee River watershed (1991), the Upper Fox River watershed (1994), and the Muskego - Wind Lakes watershed (1994). The pollutant reduction goals for sediment, phosphorous, and metals are: # Sediment: < Root River watershed -- 50% reduction in 1975 loadings < Menomonee River watershed -- 50% reduction in 1985 loadings < Upper Fox River watershed -- 60% reduction in 1985 loadings < Muskego -Wind Lakes watershed -- 50% to 75% reduction in 1985 loadings AB 2-1
39 Section 2 Objectives and Criteria Objective No. 1 Criteria continued # Phosphorous: < Root River watershed -- 50% reduction in 1975 loadings < Menomonee River watershed -- 50% to 70% reduction in 1985 loadings < Upper Fox River watershed -- 35% reduction in 1985 loadings < Muskego -Wind Lakes watershed -- 30% to 50% reduction in 1985 loadings # Metals: < Root=s River watershed -- 50% reduction in 1975 loadings < Menomonee River watershed -- 53% reduction in 1985 loadings < Upper Fox River watershed -- 40% to 53% reduction in 1985 loadings < Muskego -Wind Lakes watershed -- no reduction required b. Achieve a level of pollution control equivalent to providing wet detention for 100 percent of existing critical land uses for established urban areas, and for 100 percent of planned urban growth. Objective No. 2 Provide storm water drainage and flood control facilities to prevent flood damages to property, prevent health and safety hazards, and prevent drainage-related nuisance and inconvenience. Criteria a. Design the minor storm water drainage system (storm sewers, roadside ditches) to accommodate runoff from a 10-year recurrence interval storm event. b. Design the major storm water drainage system (channels, bridges and major culverts) to accommodate runoff from a 100-year recurrence interval storm event. c. Prevent flood damages to buildings and significant road overtopping during a 100-year recurrence interval storm event. d. Establish emergency spillways for detention basins that would safely convey flow during a 100-year recurrence interval storm event. Objective No. 3 Develop a storm water management system that effectively serves both existing and anticipated future land uses at the lowest practicable cost. Criteria a. Modify existing drainage facilities and structures where necessary to accommodate the estimated design storm flows under both existing and future land use conditions. AB 2-2
40 Section 2 Objectives and Criteria b. Design new storm water drainage systems to utilize, where possible, the natural drainage and storage system, to complement the proposed street layout and topography, and to accommodate anticipated peak flows and volumes under future land use conditions. Objective No. 4 Reduce erosion and sedimentation from construction of new development and agricultural activities. Criteria 1. Achieve a 75 percent reduction in uncontrolled construction site loadings of sediment by properly installing construction site erosion controls in accordance with the Wisconsin Construction Site Handbook, and by adequately maintaining those erosion controls to retain their effectiveness throughout the construction activity. 2. Within environmentally sensitive areas, achieve at least a 90 percent reduction in construction site sediment loading by utilizing procedures such as those described in the Special Erosion and Sediment Control issue of Watershed Protection Techniques (Vol.2, No. 3, February 1997) 3. Achieve at least a 50 percent decrease in 1985 agricultural loadings of sediment, as set forth in the priority watershed plans. Objective No. 5 Protect environmentally sensitive areas that provide significant surface water quantity or quality benefits. Criteria a. Identify wetlands and woodlands that provide storm water detention and infiltration, sediment retention, or nutrient removal. b. Protect, enhance, and/or preserve high quality environmentally sensitive areas that provide storm water benefits. c. Integrate valuable environmentally sensitive areas into the storm water management plan and into zoning. d. Prevent the discharge of increased storm water flows and pollutant loadings that would damage environmentally sensitive areas. AB 2-3
41 Section 3 Project Setting 3.1 Study Area The study area incorporates 37 square miles within Waukesha County, Wisconsin including the entire City of New Berlin. The study area is located within five major watersheds: Upper Fox River watershed, the Middle Fox River watershed, the Root River watershed, the Muskego - Wind Lakes watershed, and the Menomonee River watershed. The study area is generally bordered to the south by College Avenue, to the west by Springdale Road, to the north by Greenfield Avenue, and to the east by 124th Street. The study area is shown on Figure Land Use Land use affects both the quantity and quality of storm water runoff. Imperviousness, materials exposed to storm water, and traffic patterns are a few examples of land use characteristics which affect the hydraulics and potential pollutant loading from an area. The study area is developed in urban and rural land uses. Existing land use conditions (1995) are based on the City of New Berlin Land Use Map. Future land use conditions within the City of New Berlin are based on the City of New Berlin Zoning Map, as directed by City staff. A breakdown of the existing and anticipated future land use within the study area is presented in Figures 3-1 and 3-2. Agricultural land comprises about 30 percent, or 7,152 acres, of the study area under existing land use. The future land use AB 3-1
42 Section 3 Project Setting conditions indicate that about 4,200 acres, or 59 percent, of the current agricultural land will be developed into urban land uses. A majority of the future development within the study area is planned to be residential. Residential land use is divided into low, medium, and high density. The residential density level relationship to the City of New Berlin zoning rank is presented on Table 3-1. Table 3-1: Summary of Residential Density Level and City of New Berlin Zoning Rank System Residential Land Use Description City of New Berlin Zoning Rank Average Number of Dwelling Units per Net Residential Acre 1 Low Density R1, R2, R3, R4 < 2.2 Medium Density R4.5, R5, Rd1 2.3 to 6.9 High Density Rm1 >7 1 as defined Southeastern Wisconsin Regional Planning Commission A majority of the current agricultural land is located in the north and west portions of the study area. Urban land uses, such as residential, commercial, industrial, and institutional are generally located within the areas bounded by Calhoun Road, Greenfield Road, 124th Street, and Grange Road. The future land use conditions indicate that a significant increase in residential, industrial, and other urban land use is anticipated. Figure 3-3 shows a comparison between the existing and future land use conditions within the study area. The hydrologichydraulic and water quality analysis were conducted under both the existing and anticipated future land use conditions. AB 3-2
43 Section 3 Project Setting 3.3 Climate Climate affects the quantity and quality of storm water runoff from any given area. Variations in temperature, type of precipitation, and seasonal freezing and thawing all effect the runoff and drainage conditions. Flooding potential and pollutant delivery rates increase when spring thaws combine with rain events or major thaws occur when the ground is frozen. Freezing conditions may also affect the performance of certain types of storm water management best management practices (BMPs). The Milwaukee area has a wide range of seasonal variation with average temperatures ranging from approximately 19 degrees Fahrenheit in January to 70 degrees Fahrenheit in July. The average annual precipitation (rain, snow, sleet, and/or hail) in the Milwaukee area is 31 inches. Average precipitation amounts vary from 1.4 inches in February to 3.5 inches in April and July. Approximately 50 storm events with at least 0.1 inches of precipitation occur each year. The average monthly temperature and precipitation amounts based on data collected by SEWRPC from 1951 through 1985 are presented in Figures 3-4 and 3-5, respectively. Figure 3-4: Average Monthly Precipitation Milwaukee, Wisconsin: Jan. Feb. Mar. April May June July Aug. Sept. Oct. Nov. Dec. 3.4 Topography The ground surface within the study area has gently rolling topography which generally slopes downward toward the east. The ground surface elevations range from a maximum of 1070 feet above mean sea level, within the Mill Creek subwatershed, to a minimum of 746 feet above mean sea level, within the Upper Root River subwatershed. Approximately one-fourth of the study area lies east of the AB 3-3
44 Section 3 Project Setting Figure 3-5: Average Monthly Temperature Milwaukee, Wisconsin: Jan. Feb. Mar. April May June July Aug. Sept. Oct. Nov. Dec. subcontinental divide and drains to Lake Michigan. The subwatersheds that drain to the east include Underwood Creek, Upper Root River, and Tess Corners Creek. The remaining three-fourths of the study area drains west to the Mississippi River. A summary of the topography within each major subwatershed is presented in Table 3-2. Table 3-2: Summary of Subwatershed Topography Subwatershed Area (acres) Maximum Elevation (feet above mean sea level) Minimum Elevation (feet above mean sea level) Maximum Change in Elevation (feet) Underwood Creek Upper Root River 4, Tess Corners Creek 1, Deer Creek 2, Calhoun Creek 4, Poplar Creek 8, Mill Creek 2, Maximum Elevation in Study Area = 1070 feet Minimum Elevation in Study Area = 746 feet Maximum Elevation Change in Study Area = 324 feet AB 3-4
45 Section 3 Project Setting 3.5 Soils Soil type influences the storm water infiltration capacity and erosion potential. Infiltration capacity and erosion potential are based on the soil texture, structure, content, permeability, slope, and position on the landscape. Soils are classified hydrologically by the U.S. Department of Agricultural (USDA) Soil Conservation Service (SCS) as A, B, C, or D. Group A soils are generally well drained and have a low runoff potential; Group B soils are generally moderately drained and have a moderate runoff potential; Group C soils are somewhat poorly drained and have a moderate to high runoff potential; and Group D soils are very poorly drained and have a high runoff potential. According to the Soil Survey of Milwaukee and Waukesha Counties, Wisconsin (USDA, 1971) the soils in the project area are typically silt loam in either the Hochheim - Theresa or Ozaukee-Mequon associations. The characteristics of the soils are presented in Table 3-3. Approximately 25 percent of the soils within the study area are classified as SCS Soil Group B which indicates water infiltration into the soils is fair and water runoff is moderately low. These areas are located in the southwest quarter of the study area and are valuable for storm water infiltration techniques described in Section 8. The general soil texture across the city of New Berlin is shown on Figure 3-6. Table 3-3: Soil Characteristics within the New Berlin Study Area Soil Association Texture Drainage Runoff Rate Erodibility SCS Hydrologic Soil Group Percent of Study Area Montgomery- Martinton- Hebron Saylesville Clay to Clay Loam Poor to Well High Runoff Potential Moderate D 10 Ozaukee- Morley-Mequon Silt Clay Loam to Silty Clay Poor to Well Moderately High Runoff Potential Slight C 50 Houghton - Palms- Adrian Organic Very Poor High Runoff Potential Moderate D 10 Hochheim- Theresa Clay Loam to Silty Clay Loam Well Low Runoff Potential Slight to High B 25 Other Includes mucky peat, silt loam, Varies Varies Varies AB 3-5
46 SOUTH VALLEY LN CT AMOR LOU RAIN CT I DOVE R VALLE AMOR G RD Y WOODLAND CT ORCHARD BEEHEIM RD GLENGARRY RD CT HILL T WINSTON CT - S W E LINCOLN AVE BARTON RD LILLY LN DOWNIE RD COURT COFFEE RD SWARTZ RD LAWNSDALE RD I DANNY RD JOHNSON RD JOHNSON RD HICKORY TRAILS TANS RINDT LN RUN CT PFEIL RD RD WESTWOOD CIR GREENFIELD AVE PINECREST LN SOUTHVIEW LN HIGHLAND VISTA VISTA CT TIM CLEVELAND GLENWOOD LN AVE NORWOOD LINNIE LAC LAC PL MILLER LN EVERGREEN PL LYNETTE LN DENA WILLOW RD LAWNSDALE RD RIDGEWOOD LN ANN ST OAK RIDGE RD LN O OAK ROOSEVELT AVE APPLE CT WEST VIEW LN LN ROGERS LN COFFEE RD MARS JOHNS ELMWOOD RD LN LIBERTY LA ELM CT HORIZON CALHOUN RD CALHOUN RD 171 TH FUL LER TON OBSERVATORY HOMESTEAD 170 TH GREENFIELD AVE ADD ISO N AVE 170 TH 170 ST 169 TH VICTOR RD SUNDOWN 168 TH 167 TH AVE DAKOTA 166 TH 166 ST ST 165 TH NSEN CRESENT LONGVIEW MARIETTA TOWN RD RENO 162 TH REGAL MANOR CT MANOR 162 ST CYNTHIA REGAL CHURCH LN CANARY ROSA LN CARDINAL LAUREL PLEASANT CHIPMUNK LN MAYFLOWER CYNTHIA ALLISON RIDGE ARMOUR RD AVE LN SCOT JAMES RIDGE KATHERINE RD MOORLAND RD. SCHNEIDER LN LINCOLN GRAYLOG LN GLENDALE PIN CR MOORLAND RD RONKE LN ACREDALE RD GRAYLOG LN 152 ST GLEN CT RD KRAHN CLEVELAND AVE SAN COFFEE RD MARK ST CAMROSE DOVER HILL LN VERA ELMONT LN HARCOVE GLENORA CT LINFIELD LN KINGSWAY FENWAY FENWAY MAYFLOWER DAKOTA ST VERA CRUZ MATEO CT MANOR CT I GATEWOOD WOOD SHIRE CT SIGNET LN LN BROOKLAND RD PARK AVE HONEY LA MEADOWSHIRE MEADOWMERE PKWY CT DAKOTA ST RF I E LD 145 CT OKLAHOMA OKLAHOMA AVE CT REGAL CT MAPLE RIDGE RD FENWAY REGAL CT MAYFLOWER CT GRANGE AVE COTTONWOOD F BUTTERNUT TRAIL CEDAR TRAIL REDWOOD OVERLAND TR WILBUR SPRUCE RD GLEN PARK CT NETTESHEIM LN ARMOUR LINDENWOOD COLLEGE AVE WATERFORD BEECHWOOD HEMLOCK CT LOMBARDY GLEN PARK RD CT PARK CRIMSON VALLEY FOREST AVE R Q U ARE GLEN PROSPECT GATEWOOD GATEWOOD MEADOW POP LAR AVE VIEW RD LA CT TRAIL ELMWOOD POPLAR RD LN CARDINAL GLENCOVE PKWY PROSPECT HONEY LA PARK AVE GRAHAM ST FOREST KNOLL OLD OAK LN FERGUSON RD PADDOCK LILAC LN ROBIN TR L CT PKWY CLEVELAND AVE MAPLE RIDGE ELIZA MARIA B LOFTUS T CT AVE CT WEMBLY WEMBLY CT LINFIELD CT LOFTUS MARQUETTE WILSHIRE WOOD CT WEMBLY CT LN FOXWOOD NORTH LN CT WEATHER- EDGE- TIMBER MARIN I W RIDGE LINCOLN RD GLENDALE WILBUR R HARCOVE AVE LANGLADE A NEEDHAM GREEN LAWN CT PICCARD ANAE BALBOA GOLDEN CT A COURTLAND 129 ST HONEY LA PARK AVE GRAHAM ST M 129 ST O OHIO WHITE CT NEEDHAM MEADOW LN PROSPECT FOREST LAGOON MONTANA AVE MANITOBA HICKORY VERONA EDEN TR NORTH EDEN CT SCARBOROUGH CIR CHERRYTREE LN MAGELLAN WESTERIA I LN CT MURRAY LN ST JONATHAN LN CT CT TREE RADI CT AVE AVE WOODHILL CT CT ST MARY'S LOWER SSON RD I E T KELLY LAKE NICOLET E RTON AVE HOPE MARQU Y AVE ST SPRINGDALE RD S.T.H. "59" CRAF TSMAN HIL L EEN CRAF TS MAN PL E ASANT BROOK PK W Y S UN NYC REST V IL L A T ERRACE TWIN W ST I E L AUR L L OW S LN NORWOOD B IRCHWOOD LN C & NW RR DL AWN WO WEST RIDGEWAY RIDGEWAY WEST ELGER CT WES TWARD RD S.T.H. "59" WEST LN D R EAST CALHOUN ROAD SCH. EAST EAST LN ROGERS TODD LN CT ROOSEVELT AVE NEW ROGERS BERLIN LINCOLN AVE 164 TH LN CARRIAGE BUENA PARK 3 COACH LIGHT HERITAGE RIVER RD ROBIN RD DEER CREEK CIR BROOK SUBWATERSHED DEER CREEK BLUE JAY C.T.H. "O" CT MOORLAND RD SPRING WOODVIEW CT VALLEY ROGERS WOO VALLEY SPRING DV IEW MISTY WO CT CHANCEL O D L AND FOXGLOVE PICKFORD CT AVE PICKFORD WOODVIEW SIDE CT CT CT WOOD CT PAR KS I DE WOODSHIRE SHERWOOD 2 WILDWOOD WOODSIDE GREEN RIDGE TER CLOVER KNOLL PL CT GATEWOOD KOSTNER CT CREST VIEW WOODLAND KOSTNER LN GATEWOOD PARK MEADOW PARK MERE CT PKWY WOOD LN RANCH RD MEADOWSHIRE HONEY LANE CT ORCHARD LANE SCH. PL MEADOW BERLIN AVE TRIANGLE AVE ROCK S.T.H. "59" UNDERWOOD PL MILTON CT C & NW RR PARK CT BRIAR WOOD LN FOREST KNOLL CT PARKVIEW PARK VIEW AVE LNAVE PROSPECT PARKWAY ARCADIAN FOREST PKWY CREEK SUBWATERSHED CT OAK ELM GROVE RD ELM GROVE RD OLD 1 CONRAD PL NEW BERLIN HILLS GOLF COURSE BROADALE OAK IS E BEVERLY PAR K ANN MINOOKA PARK C.T.H. "D" CT ANN LOUISE (COUNTY) BOW RAINBOW HANKE OAKCREST CT HIDDEN VALLEY WOODLAN D LUCY L L E HI-VIEW HILLVIEW LN CANARY WOODLAND SHADY LN CT HILLVIEW CT 19 LAWNSDALE CT C.T.H. "Y" MIDDLE FOX RIVER WATERSHED I E W H MILL I L L V KOHLER RACINE CT JEFFERS JEFFERS MULBERRY CIR CHESTNUT CT AVE WEHR COUNTR Y BATES PL RD 200TH ST WEHR B I T LA RD PHE ASAN T CT RACINE WEDGEWOOD IMPERIAL CT WEHR RD CAR I TE RSWEET 199TH ST -ADAM CT ADAM CT ADAM ROLL I NG CATAMOUNT ADAM CT P IN EWOOD CATAMOUNT HILLCRE S T LN WOOIDGE PROSPECT HILL SCH. EGOFSKE POPLAR CREEK C.T.H. "D" NEW BERLIN WEST MIDDLE & HIGH SCH. LN HEIDE THORNAPPLE LN CR ABTR EE WOODSVIEW CT OBSERVATORY RD HILLSIDE HILLCRES T CREEK SUBWATERSHED FOX UPPER RIVER WATERSHED POPLAR CT H I LLCREST OVERLOOK EGOFSKE RD MARTHA LOOKOUT MARTIN RD CREEK SUBWATERSHED LN BRENNAN FAIRVIE W MICHAELS TRILLIUM CROWN LN WOELFEL RD WOODLAND WILLIAMS CR STIGLER RD CT 179 MAJOR'S ST WILLIAMS STIGLER NATURE PRESERVE C.T.H. "I" RD S ATURN VENUS STEVEN JACQUEL INE CLEVELAND HEIGHTS NEW BERLIN SCH. CENTER SCH. CT STEVEN BERES ROAD J I L L S 171 ST MOORLAND INDUSTRIAL PARK MALONE PARK CALHOUN PARK COMMERCE INDUSTRIAL GLENDALE 167 ST RYERSON RD 166 ST CASPER HA 163 ST TOP-O-HIL L VOGEL STAR OF BETHLEHEM YUMA 160 ST SANTA CT HOLY APOSTLES SCH. OVERLAND PARK RYERSON RD RIVIERA VE N TURA MONTEREY VOGEL CT 159 ST ST FRANCIS 158 ST BLVD EL DORADO 157 ST CHURCH VIEW EW EEK OOD EL CT HOWARD MAGDALE NA VISTA GR ANADA SIRROCO AV E BROOKSIDE CT KRAHN BROOK S PARKSIDE IDE REGAL NORTH 153 TESCH RD LN FREMONT ACREDALE CT TER DALE PARK LYNWOOD PKWY CRUZ SAN MATEO CT CT MANOR CT PARKS CT O L ACREDALE RD 149 ST DE 149 ST IV I A LN REGAL LIONS PARK FRANKLIN CT F L E E TWOOD REGAL CT K LIN FR AN FIELDPOINTE CT 147 JANICE FIELD POINTE CT HIDDEN ST PARK CT D IANNE BR I AN F AI 146 ST JANICE PL DWIGHT D. EISENHOWER MIDDLE & HIGH SCH. VALLEY MAYLORE CT FAIRFIELD 145 ST CT VIEW PARK LA LILAC GLENDALE CONNIE LN TAMM Y MAY L ORE I E LDPO INTE NATIONAL AVE GLEN GLEN CT PARK McINTOSH LN SAN A LN LN TIFFANY PL GLEN PARK SCH. CT McINTOSH LONG ACRE HICKORY GROVE CENTER FIELDPOINTE W T HOMAS PLE ASAN T I L BUR ELMWOOD SCH. GREEN MEADOW MONTANA SALLY MAPLEWOOD HOWARD AVE DAKOTA CT FOXWOOD CRAWFORD V IE W WILBUR CT TA LORET ST LARK 134 MEADOW FOUNTAIN SUNNY LN CT PLEASENT VIEW CT SQ BLVD G LEN L LOW 134 ST 133 ST DAKOT A 133 ST FOUNTAIN SQUARE NATURAL AREA FOUNTAIN FOUNTAIN VIEW SUNNY OAKDAL E RIDGE LA WEATHER STONE PARK ST 132 ST CT POINTE BIWER PARK CE T E R GREENL AWN C LO V ER LN TREE TOP NATIONAL AVE C.T.H. "ES" MARY ROSS HARLAND MELO DY HE AR THS ID E SALENTINE CRESENT HEATH ERLY CT HARMONY CALDWELL MAR MELODY MELODY CIVIC CALDWELL CT IE T TA CT BELOIT RD REGAL MANOR MAYFLOWER HEATHERLY DEERWOOD HEARTH RIDGE HEA RTH ALLISON LN R CT I D GE MELODY SOVEREIGN REGAL MANOR CT CHURCH MAPLE MARK HEATHE R MAR IETTA RAVEN LN DELPHINE CALHOUN CREEK SUBWATERSHED 27 CT WESTRIDGE LY WESTR I DGE DELPHINE C.T.H. "O" ADELL AVE MAYFLOWER CT DORA LN I - 43 AVE GLENORA AVE CT RACHEL QUIMBY AVE HARCOVE CT TIE AVE MAYFLOWER CT CT RACHEL LN HARMONY REGAL CAMROSE AVE QUIMBY AVE MAPLE REGAL 23 RIDGE CT 26 CREEK 147 ST OAK WOOD CLEARWATE R TERRACE SUN VAL LEY MAPLE PL C.T.H. WAT ERS S IDGE NORTH B L VD NOR T H FARRELL AVE NORTHFIELD OAK CT "I" TRAIL WATERS WAY OAK SUN VALLEY RDCT ASPEN CT ASH CT STRATFORD CT SUN VALLEY CT ABBOTT LN I NF I E L D S TRATFORD MORNINGVIEW SOMMERSE T MARQUE MARYK N O L L CT SUN T E SKYLINE ETH VALLEY JESSICA SU CT LN WILSHIRE AVON COVENTRY CT C.T.H. "D" HIGH HIGHPOINTE POHL SANDALWOOD SANDALWOOD CT 130 ST OHIO OHIO CT CT RAY ND EUCLID 128 ST 127 ST HERBERT HOOVER SCH. 126 ST C.T.H. "ES" EUCLID AVE CT HICKORY CT BRENTWOOD BRENTWOOD WILBUR COLD SPRING ROAD CT N BURST MARIA CT BELOIT RD GUERIN NIC O LET CT GUERIN CT SUNBURST LN MAR Y PASS CIR S T ONE G AT E VAN CT WAY KIRKWOOD ARMOUR RADISSON MENARD ANAE EDGEWOOD 12 UPPER ROOT RIVER RIDGECREST SUBWATERSHED CT WADE VICTORIA CT CO VEN TRY ST 131 V VICTORIA WIMBL EDON WHITE CT RD WEATHER CREEK CT I C TOR RD OROUGH VICTORIA CT IA NO R M AN AVE VICTORIA LN CT CIR CT CARNABY CARNABY L L ERTON ARMOUR APPLEBLOSSOM COURTLAND CT CT LN PKWY MAG E L L AN MARQUE TTE AVE ST 129 PEACHTREE NICOLE GREEN WOOD CAVENDISH RD HILL CT LN WOODHILL RUSSEL LN WEATHER STONE CT WEATHERS TONE AVE GRE E N TREE 127 ST CT RUSSEL CRAW NORTH RD BURDICK CT BELGRAVE AVE RD WILBUR FORD STONEWOOD RD RD CT VICTORIA CT WEATHER STONE CT BOBWOOD RD I - 43 CT IVY HOLLY CT DESOTO CORTE Z L A DESOTO LN HAWTHORN E BARBERY CT DE S O OT JOSEP H BL V D PARK- CHERRY- PARK- CARI- CARI- CARI- SCARB- STONE OLE T N IC LN E DG MAR QU E T TE SAL L E N ICO L E T JOL CT 124 ST TARTAN ABERDE EN MA LOCHNI VAR ABERDEEN TOLBERT MABERRY E D NBOURGH CGREG OR L OCH L E BALMORAL VEN LN ST LN DUNVEGAN LN ANEWS CT BAGPIPE OXFORD CULLODEN C.T.H. "ES" WINDSOR 31 NATIONAL AVE KOINIA CIRCLE HISTORIC PARK JULIUS HEIL RACINE AVE 32 TERRACE CT RACINE BERLA NE INEZ RACINE PL LINNIE LAC CT LINNIE LINNIE LAC MARTIN ROAD PLATEAU SUMM I T HI L L TO P LA BAAS HI- KNOLL DALE 33 I - 43 S HADOW CT 34 SMALL RD C.T.H. "HH" 35 TESS CORNERS CREEK SUBWATERSHED SUNNY SLOPE ROAD L BOA BA WOODF RAIN 36 GOLDEN E L D RAIN CT HAWTHORNE EMERSON LN GREENTREE FRAN CES C.T.H. "L" JANESVILLE LOWELL PLACE KELLY LAKE ROSEM AR LAKE UPPER KELLY PARK RD COLLEGE AVE CROWBAR RD I C.T.H. "Y" HILLEDALE C.T.H. "HH" MUSKEGO - WIND LAKES WATERSHED N LEGEND SOIL GROUP SOIL GROUP B C SOIL GROUP D " = 4000' Figure No. 3-6 CITY OF NEW BERLIN SOIL TEXTURES MAP
47 Section 3 Project Setting and alluvial land 3.6 Surface Water Resources Predominant surface water resources within the study area include perennial streams, intermittent streams, and lakes. More than 30 miles of perennial stream channels are located within the study area. Numerous intermittent streams, which flow when runoff or groundwater discharge is high, discharge into the perennial streams. Named lakes include Upper Kelly Lake and Lower Kelly Lake located in the southeast portion of the study area. Linnie Lac is located the southwest portion of the study area. Numerous unnamed lakes exist throughout the study area and are typically water-filled quarries. Major streams located within the study area are identified in Table 3-4. Surface water resources are shown on Plate 1 in Appendix A. 3.7 Wetlands Wetlands are an important feature of the study area due to their value in supporting wildlife habitats, ability to stabilize storm water runoff and flood flows, and their ability to remove sediment and nutrients from surface waters. Approximately 82 wetland areas, incorporating more than 2,800 acres, were identified within the City of New Berlin study area. Table 3-4: Major Streams within the New Berlin Study Area Stream Name Approximate Stream Subwatershed Area within the Study Area (square miles) Upper Fox River Watershed Deer Creek 4.7 Poplar Creek 12.5 Middle Fox River Watershed Mill Creek 3.6 Root River Watershed Upper Root River 6.4 Tess Corners Creek 2.8 Muskego Wind Lakes Watershed Calhoun Creek 6.2 Menomonee River Watershed Underwood Creek 0.6 AB 3-6
48 Section 3 Project Setting 3.8 Natural Areas Natural areas are defined by the Wisconsin Natural Areas Preservation Council as tracts of land or water so little modified by human activity, or sufficiently recovered from the effects of such activity, that they contain intact native plant and animal communities believed to be representative of the pre-european settlement landscape. One natural area has been designated within the study area. This natural area is summarized in Table 3-5. Table 3-5: Designated and Known Natural Areas within the New Berlin Study Area Area Name Location Ownership Size (acres) Description New Berlin Woods T6N, R20E Sections 11,14 City of New Berlin Private 35 Small dry-mesic hardwoods with shallow depressions that retain water in spring. Dominant trees include white and red oaks and sugar maple. Rare species habitat, natural area with county or regional significance. Source: A Regional Natural Areas and Critical Species Habitat Protection and Management Plan for Southeastern Wisconsin (SEWRPC, 1997) In addition to the natural area designated by Natural Areas Preservation Council, one nature preserve, Stigler Nature Preserve, is located within the study area. 3.9 Wisconsin Storm Water Regulations Wisconsin Administrative Code NR 216, which contains the storm water regulations, was promulgated on November 1, These regulations establish criteria for permitting storm water discharges from certain municipalities, industries, and construction sites. Most industries which are covered by the permit are required to prepare a storm water pollution prevention plan, while construction sites which disturb more than five acres are required to prepare a construction site erosion control plan. Municipalities that are covered by the Permit may be required to prepare a storm water pollution prevention plan for certain industrial facilities. Subchapter 1 of NR 216 contains the specific storm water permit requirements for municipalities and requires that the following municipal dischargers of storm water obtain a storm water discharge permit: Municipal separate storm sewer systems serving incorporated areas with a population of 100,000 or more: - Cities of Madison and Milwaukee Municipalities in the Great Lakes Areas of Concern: AB 3-7
49 Section 3 Project Setting - Cities of Green Bay, Allouez, Ashwaubenon, DePere, Marinette, Sheboygan, and Superior Municipalities in priority watersheds with a population of 50,000 or more: - Cities of Eau Claire, Racine, West Allis, and Waukesha Discharges from a municipal separate storm sewer system which either contribute to a violation of a water quality standard or are a significant contributor of pollutants to waters of the state. Municipalities may either be identified by the WDNR or by a municipality previously listed. The City of Milwaukee has been under a storm water discharge permit since October During the permitting process, 29 surrounding municipalities were identified as potential significant contributors of storm water pollution to Wisconsin waters. The WDNR evaluated all of the designated municipalities using the criteria listed below to determine which municipalities will be required to obtain storm water discharge permits: Physical connection between the municipal separate storm sewer system and the City of Milwaukee system. Location of the separate storm sewer system discharge relative to the City of Milwaukee=s discharge The quantity and nature of pollutants discharged to waters of the state The nature of the receiving waters Protection of the watershed or basin drainage area receiving the discharge Population of the municipality On August 2, 1996 the WDNR notified 21 municipalities that they will be required to obtain a Municipal Storm Water Discharge Permit. The City of New Berlin was not among the municipalities notified to obtain a storm water discharge permit at that time. However, the City was recently notified by the WDNR that New Berlin will be required to obtain a municipal storm water discharge permit. The permit application requirements include the following items. A demonstration that the applicant has legal authority established by statue, ordinance, or series of contract to: AB 3-8
50 Section 3 Project Setting < control the contribution of pollutants to the municipal separate storm sewer from industrial storm water discharges. < prohibit illicit discharges to the storm sewer system. < control the discharge of spills, dumping, or disposal of materials to the storm sewer system. < control through inter-municipal agreements between co-applicants the contribution of pollutants from one municipal storm sewer system to another. < require compliance with conditions in ordinances, permits, contracts, or orders. < carry out all inspections, surveillance, and monitoring procedures necessary. A storm sewer system map including: < identification and outline of the storm water drainage basins, the watersheds, and the municipal separate storm sewer systems. < boundary defining the final Urban Storm Water Planning Area and all municipal borders within the area. < listing and location of all known municipal separate storm sewer outfalls discharging to waters of the state with pipe size and consideration of Amajor.@ < location and description of each currently operating or closed municipal landfill or other treatment, disposal, or storage facility for municipal waste < the location of major structural controls for storm water discharges. < identification of publicly owned parks, recreational areas, and other open lands. A description of existing management practices to control pollutants from municipal separate storm sewer systems including the following: < existing source area controls and structural Best Management Practices, including operation and maintenance measures. < existing programs to identify illicit connections to the municipal separate storm sewer including inspection procedures, methods for detecting and preventing illicit discharges, areas where this program has been implemented, and summary of the results. An inventory, by watershed, of the industrial facilities which likely discharge storm water to the municipal separate storm sewer system including: < name and address of each facility < Standard Industrial Classification (SIC) or other description of products or services provided by the industry. A characterization of the quality and quantity of storm water runoff and the effects on the receiving waters including: AB 3-9
51 Section 3 Project Setting < monthly mean rainfall and snow fall estimates, or summary of weather bureau data, and monthly average number of storm events. < location and description of land use activities, including estimated average runoff coefficient, population densities, and projected growth for a ten-year period within the drainage area. < if available, quantitative data describing the volume and quality of discharges including a description of the outfalls, sampling procedures, and analytical methods. < listing of water bodies that receive discharges from the municipal separate storm sewer system, locations in these water bodies where pollutants from storm water discharges may accumulate and cause water quality degradation, and known water quality impacts. A proposed schedule to provide pollutant loadings to receiving water bodies and the event mean concentrations. A proposed monitoring program for data collection for the term of the permit. A schedule to provide a proposed storm water management program that will be developed and initiated during the term of the permit. A fiscal analysis of the estimated capital and operation and maintenance expenditure necessary to implement the proposed management programs, including a description for the source of funds, incorporating any restrictions on the use of the funds. Permit application requirements will be partially completed as part of this Storm Water Management Plan. The WDNR will review the Permit application submitted by New Berlin, and issue a Storm Water Permit. The Permit conditions will likely include requirements for best management practices, pilot studies, ordinance, and monitoring Other Storm Water Management Related Regulations In addition to the Wisconsin Storm Water Regulations, contained in NR 216 and described in the previous section, there are several federal, state, and local regulations which affect storm water management. A summary of the current regulations and requirements is provided in Table 3-6. It should be noted that regulatory requirements will likely change over time. AB 3-10
52 Section 3 Project Setting Table 3-6: Summary of Storm Water Management Related Regulations Regulating Authority Regulation Description Regulated Community/Activity US EPA Clean Water Act 40 CFR Part CFR Part 122 directs regulated municipalities, most industries, and construction sites over 5 acres to obtain and comply with a storm water discharge permit. The WDNR has permitting authority for this regulation and administers the program through NR 216. Χ Municipalities Χ Industries Χ Construction sites disturbing over 5 acres US Army Corps of Engineers Clean Water Act Section 404 Section 404 provides the federal government with the federal authority to administer activities which may impact navigable waters of the United States. Χ Dredging within a navigable waterway or wetland Χ Placing fill within a navigable waterway or wetland Χ Other activities which may impact a navigable water of the United States WDNR NR Wisconsin Storm Water Regulations WDNR NR Wisconsin Nonpoint Source Pollution Abatement Program WDNR NR Wisconsin Floodplain Management Program WDNR NR Wisconsin Shoreland - Wetland Protection Program NR 216 requires regulated municipalities, most industries, and construction sites over 5 acres to obtain and comply with a storm water discharge permit. Section 3.9 of this report describes NR 216 more completely. NR 120 establishes the administrative framework for the implementation of the State=s Non-point Source Pollution Program. NR 116 requires municipalities to adopt reasonable and effective floodplain zoning ordinances. NR 117 establishes minimum standards for city and village shoreland-wetland zoning ordinances. Χ Municipalities Χ Industries Χ Construction sites over 5 acres Χ Governmental units, state agencies, landowners and land operators that receive grants of cost sharing monies from the WDNR Χ Regulates the type of land use, site design, and structural design of development in floodplains Χ Projects which effect wetlands five acres or larger within shoreland areas of cities and villages AB 3-11
53 Section 3 Project Setting Table 3-6: Summary of Storm Water Management Related Regulations Regulating Authority Regulation Description Regulated Community/Activity WDNR NR State Wetland Permit WDNR Chapter 30 - State Water Regulation Permit NR 103 describes the review process used by WDNR to determine the impacts of projects which may affect delineated wetlands. The review criteria include dependancy on the wetland, potential practical alternatives, impacts on the wetland water quality standard, cumulative wetland impacts, and secondary wetland impacts. Chapter 30 regulates activities which affect navigable waterways within Wisconsin. Χ Projects which effect delineated wetlands Χ streambank stabilization Χ dredging of navigable waterway Χ filling of navigable waterway Χ channel improvements Χ other activities which affect a Wisconsin navigable waterway City of New Berlin Erosion Control Requirements The erosion control ordinance regulates land disturbing and land developing activities within the City of New Berlin. projects which: Χ disturb greater that 4,000 square feet Χ excavate or fill 400 cubic yards Χ disturb greater that 300 linear feet of trenching Χ involve any road or waterway City of New Berlin Zoning Ordinance The Zoning Ordinance promotes the health, safety, morals, comfort, prosperity, and general welfare of the City of New Berlin. Χ regulates and restricts the use of all structures, lands, and waters within the City of New Berlin AB 3-12
54 Section 4 Storm Water Management System 4.1 Introduction The storm water management system within the New Berlin study area includes storm sewer, drainage ditches, culverts, streams, and wetlands. An inventory of the storm water management system was conducted as part of the preparation of this Storm Water Management Master Plan. The information gathered is used to provide input into the modeling analyses, help define the existing storm water related problems, and provide the database needed to develop storm water management measures. 4.2 Hydraulic Structure Inventory An inventory to identify and document drainage and hydraulic control structures was conducted by Ruekert and Mielke, Inc. staff during the Summer of The primary purpose of the inventory was to collect data on the roadway culverts and storm sewers. Nearly 1,400 culverts were observed and documented during the inventory. The inventory included culverts that crossed public roads. During the inventory, each culvert was assigned an identification number based on its location. The identification number includes the public land survey section, the quarter section, and a culvert number. For example culvert is located in section 36, and is in the 01 quarter section and is culvert number 3. The inventory included: visual survey of all roadways within the study area to identify culvert crossing locations, field inspection and survey of each culvert or structure, and completion of a culvert inventory worksheet. The field inspection documented: the shape, dimensions, length, and construction material of the culvert, the upstream and downstream inverts, the percent blocked, the culvert end condition, and the structural condition of each culvert. A copy of a completed inventory worksheet is shown on Figure 4-1. The information collected during the field inspection, along with the nearest cross street, is AB 4-1
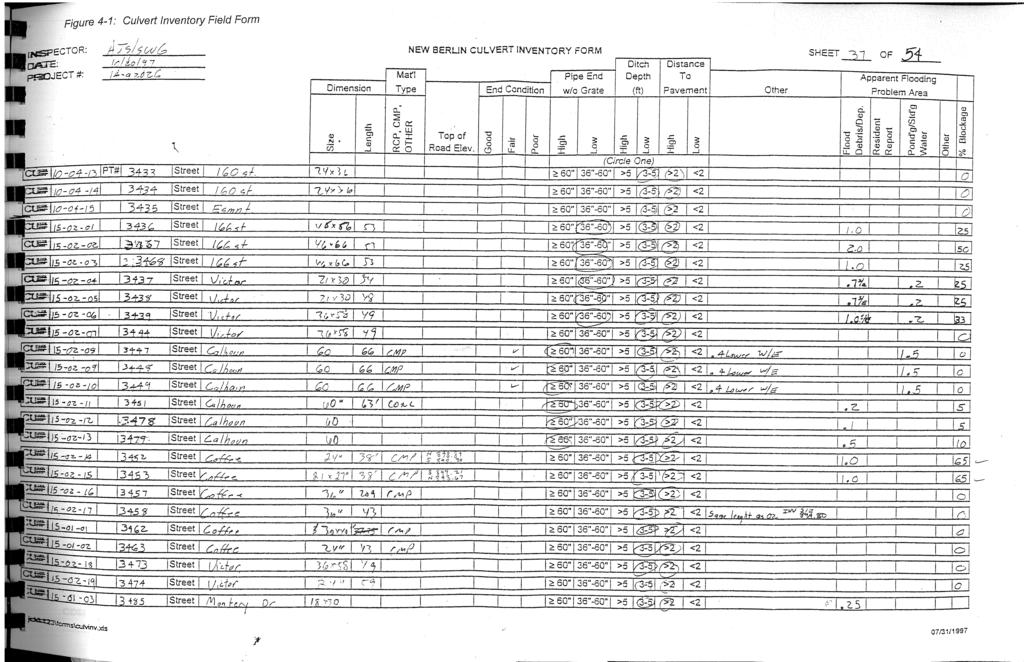
55
56 Section 4 Stormwater Management System summarized on a database which is presented in Appendix C and was provided to the City of New Berlin. Of the 1,400 culverts observed, 65 culverts were identified as being more than 50 percent blocked. The culverts with the most significant maintenance problems which require near term maintenance have been identified in a separate memorandum submitted to the City for prompt corrective action. 4.3 Water Resources System The water resource system within the study area includes waterways, storm sewers, and drainage ditches. Approximately 20 percent of the study area is serviced by storm sewer and the remainder of the study area is serviced by drainage ditches and culverts. A majority of the City of New Berlin is serviced by drainage ditches and culverts. The condition and size of the drainage ditches are widely varied. Field inspection indicated that some sections of the drainage ditch system have been filled or are otherwise blocked. Storm sewer system service areas throughout the City of New Berlin. The storm sewered areas are generally located east of Moorland Road and north of Beloit Road. Each subwatershed was divided into subbasins in order to evaluate the hydraulics and water quality impacts. In general, the subbasins are delineated so that each subbasin contains an area which drains to a specific inflow point or connecting point on the main storm water drainage system. The subbasins vary in size from approximately 10 acres to more than 900 acres. The majority of the subbasins are less than 300 acres. The subbasins are delineated based on a review of existing topographic maps, existing storm sewer maps, and, if necessary, field inspection. Major features of the New Berlin drainage system are presented on a water resources map shown on Plate 1 in Appendix A. Major features shown on the map include: <Watershed boundaries <Subwatershed boundaries <Subbasin areas <Primary drainage system <Culverts and storm sewers <Road planimetry <Stream rating <Water quantity problem areas <Water quality problem areas 4.4 Streambank Inventory Streambank erosion is responsible for the delivery of hundreds of tons of sediments to receiving streams annually. In order to reduce the sediment loading existing and AB 4-2
57 Section 4 Stormwater Management System potential streambank erosion areas must be identified and repaired. A detailed field inventory of the stream channels within the study area was conducted to evaluate the channel stability and to prioritize streambank reaches which require stabilization measures. Approximately 34 miles of channel were evaluated using field techniques developed by the U.S. Department of Agriculture. The channels included in the inventory are shown on Plate 1 in Appendix A. The inventory technique used, known as the Pfankuch Method, evaluates nine stability indicators of the upper and lower bank areas of the stream channel. Each indicator is classified as excellent, good, fair, or poor. The Pfankuch Method assigns a numeric value to each classification which, when totaled for all of the indicators, results in an overall stream reach classification. A description of the indicators and classifications is presented in Table 4-1. The streambank inventory included: Identification of streams within the study area based on base maps provided by the City of New Berlin. Field inspection of identified streams including completion of a field form evaluating each stream reach. Evaluation of overall streambank conditions. Figures 4-3, 4-4, and 4-5 show examples of stream reaches inventoried and the classification rating. The inventory of the streambank conditions indicated that: Of the streambanks inventoried, the overall reach condition of 19.8 miles, or 59 percent, is classified good; 13.4 miles, or 40 percent, is classified fair, and 0.2 miles, or 1 percent, is classified poor. Bank rock content is classified poor for 88 percent of the stream. This indicates that 20 miles of streambank have less than 30 percent rocks in the bank and is a reflection of the overall geology of the area. Vegetative bank protection, debris jam potential, and landform slope are the most common indicators, other than bank rock content, to be rated fair or poor. 9.5 miles, or 29 percent, of the streambanks have less then 70 percent plant density. 8.7 miles, or 26 percent, of the streambanks have the quantity and size materials present for the potential to create a flow deflection or debris jam. 7.2 miles, or 22 percent, of the streambanks have a slope greater steeper than 40 percent. AB 4-3
58 Section 4 Stormwater Management System Evidence of mass wasting was generally not observed in the streambank inventoried. The Upper Root River, Poplar Creek, Calhoun Creek, and Underwood Creek subwatersheds have the greatest percentage of treambanks showing significant signs of erosion, streambanks with an overall classification of fair or poor. The Deer Creek, Tess Corners Creek, and Mill Creek subwatersheds have the greatest percentage of streambanks in good overall condition. Poplar Creek and Deer Creek subwatersheds have the most miles of streambank in good overall condition. A summary of the streambank classifications is presented in Table 4-2 and shown on Figure 4-6. Inventory results for each reach of stream inventoried are presented in Appendix B. The overall stream classification rating based on the inventory is also shown on Plate 1 in Appendix A. Based on overall condition of the streambanks, the stream reaches with the most significant stability concerns are summarized in Section 7. The reaches identified with significant stability concerns should be repaired. Alternatively, streambanks which received the highest ratings, should be protected. The streambank reaches rated most stable are summarized in Appendix B. AB 4-4
59 Section 4 Stormwater Management System Table 4-1: Summary of Stream Inventory Indicators and Classification Location Indicator Item Rated Classification Excellent Good Fair Poor Upper Bank - area between normal high water line and extreme high water line Landform Slope - steepness of land adjacent to the channel, related to extent and ease of erosion Mass Wasting or Failure - detachment of soil and movement downslope, potential for large volumes of material to be introduced into the stream Debris Jam Potential - floatable objects such as branches or logs located along the bank, potential for the development of flow deflection and creation of debris jams Vegetative Bank Protection - density of vegetation on the bank, related to stability of bank soils and reduction in erosion potential Slope <30% Slope % Slope 40-60% Slope >60% No evidence of occurrence Essentially absent Infrequent or very small occurrences Mostly small twigs and limbs Moderate frequency and size occurrences Present - quantity and size of material increasing Frequent or large occurrences Moderate to heavy amounts - mostly large size materials Over 90% plant density 70-90% plant density 50-70% plant density <50% Plant density Lower Bank - area between the waters edge during low flow period to the normal high water line Channel Capacity - ability of channel to transmit the volume of water Bank Rock Content - amount and size of rocks in the bank materials, related to the resistance to flow forces which may cause erosion Obstructions - objects within the stream channel, obstructions may change in flow direction and velocity Ample for present flow and increases 65% rock - large boulders >12" diameter Rocks/old logs embedded - flow pattern without cutting or deposition Adequate - Overbank flow rare 40-65% rock - mostly small boulders and cobbles 6-12" diameter Some present - causing erosive cross currents and minor pool filling Barely contains present peak flow 20-40% rock - 3-6" diameter Moderately frequent - causing bank cutting and filling of pools Inadequate - overbank flow common <20% rock - 1-3" diameter Frequent obstructions - causing yearlong bank erosion and channel migration Cutting - loss of vegetation protection on bank or increase in bank steepness Little or none evident: raw banks infrequent and less than 6" high Some present: raw banks up to 12" high Significant: raw banks 12-24" high Almost continuous cuts: some over 24" high Deposition - deposition of sediment resulting in growth of sediment bars, indication of upstream erosion Little or no evidence Some new increases Moderate deposition Extensive deposition Source: Stream Reach Inventory and Channel Stability Evaluation (U.S. Department of Agriculture Forest Service 1975) B 4-5


60 Section 4 Stormwater Management System Figure 4-3: Examples of stream reaches rated good. AB 4-6


61 Figure 4-4: Examples of stream reaches rated fair. Section 4 Stormwater Management System AB 4-7


62 Figure 4-5: Examples of stream reaches rated poor. Section 4 Stormwater Management System AB 4-8
63 Table 4-2: Summary of Streambank Condition SUBWATERSHED Landform Slope Mass Wasting or Failure UPPER BANK Debris Jam Potential Vegetative Bank Protection LOWER BANK Channel Capacity Bank Rock Content Obstructions Cutting Deposition Overall Reach Conditions Excellent Good Fair Poor Excellent Good Fair Poor Excellent Good Fair Poor Excellent Good Fair Poor Excellent Good Deer Creek # of Reaches Miles of Stream Upper Root River # of Reaches Miles of Stream Tess Corners Creek # of Reaches Miles of Stream Underwood Creek # of Reaches Miles of Stream Calhoun Creek # of Reaches Miles of Stream Poplar Creek # of Reaches Miles of Stream Mill Creek # of Reaches Miles of Stream Total # of Reaches Miles of Stream % Based on Miles Fair Poor Excellent Good Fair Poor Excellent Good Fair Poor Excellent Good Fair Poor Excellent Good Fair Poor Excellent Good Fair Poor CDM Camp Dresser McKee nbstream_pdf Create_2010_0122_nh.XLS 1/22/2010
64 Figure 4-6: Summary of the Streambank Indicator Classification Section 4 Stormwater Management System 4.5 Wetlands Inventory The value of wetlands include their capacity to drain surges of storm water runoff and their ability to remove sediment and nutrients from surface water. The large storage capacity and controlled outfall of many wetlands detain storm water and release it slowly in more evenly distributed flow after a storm event. The long detention time, complex flow patterns, and nutrient uptake by wetland plants combine to make many wetlands very effective for removal and storage of sediment and for the removal and transformation of some dissolved nutrients from surface waters. The physical attributes of wetlands which provide storage capacity and flow control, such as very slow flow and a large storage capacity, also are favorable for water quality improvements. An inventory of wetlands greater than two acres located within the study area was conducted. The wetlands inventory evaluated existing wetlands, as well as, wetlands which have been previously disturbed and prior converted wetlands. The purpose of the wetland inventory is to evaluate the existing wetland conditions based on: effectiveness - the existing wetland capacity to contribute to storm water management, and opportunity - the potential of the wetland to provide additional storm water management benefits with modification or restoration. Wetlands which are currently effective have high functional value and typically posses little opportunity for improvement, while wetlands which are not currently effective have high opportunity for improvement. AB 4-10
65 The wetland inventory conducted for the study area included: Section 4 Stormwater Management System Location and mapping of wetlands in the study area over two acres based on the following information: <topographic maps (1 inch = 200 feet scale) <1995 SEWRPC aerial photographs <WDNR, 1986, Final Wetland Inventory maps for New Berlin <NRCS Draft Wetland Inventory Maps showing an estimated boundary of wetland, farmed wetland, and prior-converted wetland areas. Field inspection of mapped existing and previously altered/prior converted wetland areas Evaluation of the effectiveness of the wetland areas to provide flood flow detention, sediment retention, and nutrient removal and transformation based on: <wetland acreage, <slope, <wetland soil elevation relative to the mean water surface elevation, <presence of inlets and outlets, <outlet water level control and flow characteristics, and <flooding extent and duration. Evaluation of the opportunity of each wetland area to perform flow and water quality improvement functions based on: <sediment and nutrient sources within the drainage basin of the wetland, <surface water drainage area of the wetland, <size of the wetland relative to its watershed, <relationship to other wetlands within the subbasin, and <local slope and topography related to delivery of surface water runoff to the wetland. The inventory identified 82 wetland areas within the study area incorporating 2,800 acres, or 12 percent of the total study area. The inventoried wetlands are shown on Figure 4-7. Over half (57%) of the total wetland areas are designated as prior converted. The prior converted wetland areas incorporate 1,570 acres. All of the wetland areas identified have been disturbed by development activities. Wetland areas within each subwatershed are summarized on Table 4-3. AB 4-11
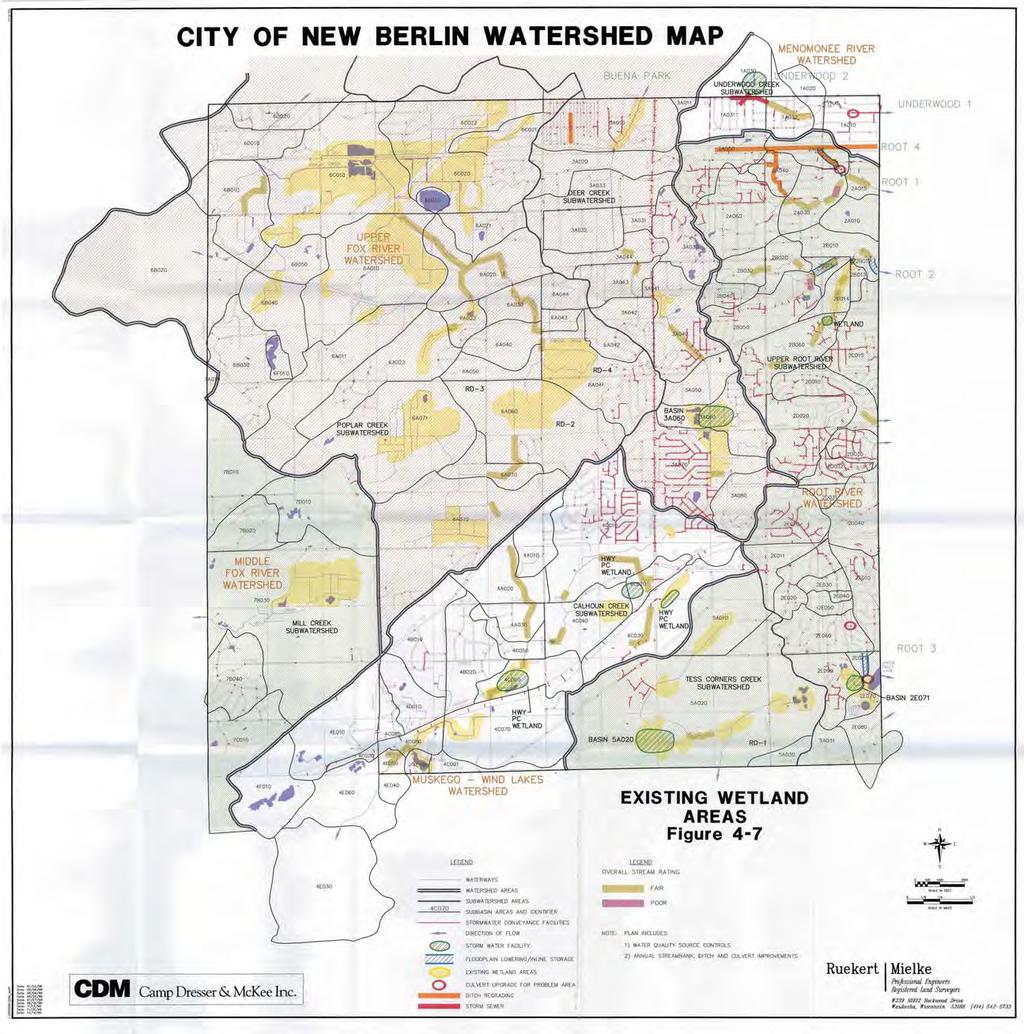
66
67 Section 4 Stormwater Management System Table 4-3: Summary of Wetland Areas within the New Berlin Study Area Subwatershed Total Acres of Wetlands Acres of Existing Acres of Prior Converted Total Value Acres 1 Total Potential Acres 2 Inventoried Wetlands Wetlands Deer Creek Upper Root River Tess Corners Underwood Creek Calhoun Creek Poplar Creek Mill Creek notes: 1- total value acres = the total acres with a current value (effectiveness) rating of moderately-high or greater. 2- total potential acres = the total acres with a potential for additional effectiveness (opportunity) rating of moderately high or higher. AB 4-12
68 Section 4 Stormwater Management System A more detailed summary of the analysis results including the evaluation of each inventoried wetland is presented in Appendix C. The evaluation of the wetland areas indicates that: 1,145 acres, 41 percent, of the wetland areas inventoried currently have at least moderately high value for surface water quality and flow improvement. 1,982 acres, 71 percent, of the wetland areas inventoried currently have at least moderately high additional potential for surface water improvement. A majority of the wetland areas with high potential for storm water management are in prior converted wetland areas. Many of the prior converted wetlands have been ditched. Ditching has substantially impacted the hydrology of 74 percent of the wetland areas inventoried. The area with the highest potential for storm water management is located northwest of the City of New Berlin, within the Poplar Creek watershed. All of the wetland areas inspected in the City of New Berlin were disturbed, most of them severely. Although all of the existing wetland areas identified in the inventory were disturbed by urban development, two areas maintain a high value as a wetland area and should be protected from future disturbance. The wetland areas which are identified as having the greatest value are summarized in Table 4-4. Table 4-4: Significant Wetland Areas within the New Berlin Study Area Subwater shed Wetland Reference Number: Location Area (acres) Importance Poplar Creek 5-1: North of railroad tracks and south of the intersection of Birchwood Lane and Norwood Drive 5-3: South of railroad tracks and northeast of the intersection of Lincoln Avenue and Johnson Road 36 These wetland areas are important because they contain tamarack conifer swamp, which was one of the most common presettlement wetland vegetation types of New Berlin. 197 These wetland areas are important ecologically because they contain an uncommon species of goldenrod, Solidago ohioensis, Ohio goldenrod. AB 4-13
69 Section 5 Storm Water Management System Analysis 5.1 Introduction A computer analysis was conducted of the Primary Storm Water Management System (PSMS), in the City of New Berlin. The objectives of this analysis were to: evaluate the capacity and performance of major drainage structures, determine the extent of floodplain areas, assess the magnitude of future increases in flows and flood elevations due to likely future development areas, and identify existing and possible future capacity problems. The results of the computer analysis were incorporated into the system-wide capacity analysis. The results of the analyses provided information for the identification of storm water quantity problems and development of both flood control and water quality solutions. The system analysis consisted of the following tasks: Definition of the Primary Storm Water Management System Assembly of watershed surface runoff data Preparation of hydrologic model information Assembly of conveyance system data Formulation of the hydraulic model System analysis for existing and future land use Procedures used to complete the analysis are presented in the following sections. 5.2 Definition of the Primary Storm Water Management System (PSMS) The Primary Storm Water Management System (PSMS) is the system of channels and culverts designed to safely convey major storm flows to a downstream outfall. Usually, the PSMS is defined as channels and watercourses draining at least 160 acres and, it is almost always designed to convey the 1 percent chance of exceedance flow rate. The one percent chance flow is also commonly called the 100-year storm event. The PSMS in New Berlin is divided into seven independent subwatersheds. Three of the subwatersheds drain to the east toward Lake Michigan via Underwood Creek, the AB 5-1
70 Section 5 Storm Water Management System Analysis Upper Root River, or Tess Corners Creek, while the remaining four subwatersheds drain to the Muskego Lake or the Fox River, which are part of the Mississippi River Basin. The Fox River tributaries are Deer Creek, Poplar Creek, Calhoun Creek, and Mill Creek. The boundaries of these major subwatersheds are shown on Figure 1-1. The PSMS in each of these subwatersheds is identified within each watershed and is also shown in Figure 1-1. The extent of the PSMS was defined by tracing the major open channels back to their inceptions as shown on USGS topographic maps. If the drainage area exceeded 160 acres, the system was extended based on New Berlin 1/4 section maps. Data describing the PSMS in each major subwatershed is presented in Table 5-1. Table 5-1: New Berlin Primary Storm Water Management System Number Subwatershed Area (acres) Channel Length (miles) Number of Primary System Culverts 1 Underwood Creek Upper Root River Deer Creek Calhoun Creek Tess Corners Creek Poplar Creek Mill Creek A listing of subwatershed parameters, including the anticipated runoff and runoff rate, is provided in Appendix D. 5.3 Hydrologic Model Development The hydrologic computer model used to evaluate the New Berlin PSMS is the RUNOFF module of the USEPA Storm Water Management Model (SWMM). This model calculates the storm flow hydrograph for each subbasin based on a particular rainfall storm. Key model inputs include subbasin physical parameters such as area, percent impervious, land use, and soils, and the depth and distribution of the desired rainfall. A separate hydrologic model was created for each of the seven major subwatersheds. Models were formulated for both existing and future land use conditions. Verification of modeled flows was conducted based on previous experience with road overtopping and overbank flooding. Model flows were also checked for consistency with the published flood insurance study flows. To develop the hydrologic model, each major subwatershed was delineated into a series of subbasins. As described in Section 4.3, subbasins were delineated in the AB 5-2
71 Section 5 Storm Water Management System Analysis manner necessary to define flows at culvert crossings and major stream confluences and generally ranged in size from 10 to 900 acres. A total of 122 subbasins were delineated. The hydrologic model requires physical parameters describing the runoff characteristics of each subbasin. The physical parameters and procedures to derive these parameters are: Subbasin Area: Delineated on 1"-100' scale Southeastern Wisconsin Regional Planning Commission (SEWRPC) topographic maps. The areas were determined using an electronic planimeter. Percent Impervious: Based on proportions assigned to standard land uses identified in Appendix D. Current Land Use: Proportion of standard land uses in each subbasin were estimated from aerial photos and compared to the City=s land use plan. Future Land Use: Future development within each subbasin was determined by using the New Berlin Zoning Map. Flow Path Analysis: The length, roughness, and slope of the typical subwatershed overland flow paths are required to calculate the effective subbasin width. This characteristic width is used to compute the overland flow velocity which controls the travel time. The flow path data were measured in each subbasin from the SEWRPC 1"-100' scale maps. The average length and slope of two or three flow paths were used to characterize each subbasin. Soils: A map of hydrologic soils groups in New Berlin was developed from the Natural Resource Conservation Service publication Soil Survey of Milwaukee and Waukesha Counties (1971). 5.4 Rainfall Input Hydrologic analysis was conducted for rainfall event recurrence intervals of 2, 10, 25, and 100-years. Rainfall depths for these frequencies were obtained from data prepared by the Midwest Climate Center and published as Bulletin 71 of the Illinois State Water Survey (1992). Bulletin 71 is an interim source of rainfall information used to replace outdated information previously published by SEWRPC and the National Weather Service. SEWRPC is currently preparing revised resign rainfall depths which are anticipated to be published in The Bulletin 71 rainfall depth duration data is shown in Table 5-2. The rainfall must be distributed through time for use in the model. This was done according to rainfall distributions published in Bulletin 71. The structure of these distributions is shown in Appendix D. AB 5-3
72 Section 5 Storm Water Management System Analysis Table 5-2: Bulletin 71 - Rainfall Depths in Inches Recurrence Interval (years) Storm Duration in Hours The total amount of rainfall varies according to the specified storm duration. Longer storms have greater rainfall volume but less rainfall intensity. The New Berlin system was evaluated for several storm durations to determine the combination of duration and intensity that produces the greatest peak runoff rate. The analysis showed that the 3-hour storm produced the greatest peak flow in each subwatershed except for the South Branch of Underwood Creek. The 1-hour storm is the critical event in the South Branch of Underwood Creek subwatershed. 5.5 Conveyance System Data The conveyance system consists of the stream channels and roadway crossing structures that provide for drainage of storm water flows. The hydraulic analysis required channel data includes, typical channel cross-sections, the Manning roughness coefficient, and the upstream and downstream flow line elevations. The channel data was taken from existing flood insurance study computer models of the stream reaches. Additional cross-sections were obtained from SEWRPC 1" = 100' scale topographic maps. The hydraulic analysis also requires data for culverts and bridges. The required culvert and bridge data include, the upstream and downstream invert elevations, the Manning roughness values, waterway opening dimensions, structure length, and the road overtopping elevation. The culvert data was obtained from the 1" = 100' scale drainage system maps prepared by Ruekert & Mielke. 5.6 Hydraulic Model Development The EXTRAN module of SWMM was used to conduct hydraulic analysis of the New Berlin PSMS. The objective of the hydraulic analysis is to determine the depth of flow in the open channels that make up the primary system. The hydraulic analysis also evaluates the performance of roadway culverts in the primary system. Five separate EXTRAN models were developed, one model for each of the five major subwatersheds within the New Berlin study area. There is no primary drainage AB 5-4
73 Section 5 Storm Water Management System Analysis system in the Mill Creek or Tess Corners subwatersheds within New Berlin. The miles of channel and number of hydraulic structures represented in each model for each subwatershed is presented in Table Hydraulic Analysis Results The hydraulic analysis models were run using the 2-, 10-, 25-, and 100-year recurrence interval storm event runoff flows as input. The models were run under both existing land use and future land use conditions. The results of the hydraulic analysis consist of the flow rate, velocity, and depth at each location considered in the hydraulic model. This information can be used to identify areas of high flood level, channel and culvert capacity shortfalls, and areas of high erosion potential. The complete results of the hydraulic analysis are provided in the Appendix D. Model results at the major culverts within the study area are shown in Table 5-3. Four of the modeled major system culverts have less than the 2-year recurrence interval storm event capacity. Road overtopping in the 25-year recurrence interval storm event or less was detected at 28 of the major culvert locations in the model including 12 locations where overtopping occurs in the 10-year recurrence interval storm event or less. Differences between existing and future land use flows are shown in Table 5-4 for selected locations in each subwatershed. Flow increases are greatest in the Calhoun Creek, Deer Creek, and Poplar Creek subwatersheds, while flow increases are the smallest in the Underwood Creek and Upper Root River subwatersheds. The flow increases are typically due to future development within the subwatershed. Table 5-4: Existing and Future Land Use Flows at Selected Locations Location Existing Land Use Flow (cfs) Future Land Use Flow (cfs) Percent Change (%) Upper Root River at 124th Street Deer Creek at Rogers Drive 1,250 1, Deer Creek at Moorland Road Deer Creek at National Avenue Calhoun Creek at City Limit Calhoun Creek at upstream of Racine Drive Calhoun Creek at upstream of Calhoun Road Underwood Creek at Meadow Lane Poplar Creek at Cleveland Avenue AB 5-5
74 Section 5 Storm Water Management System Analysis 5.8 Citywide Culvert Capacity Analysis An extensive culvert capacity analysis was completed to estimate the capacity and level of service provided by all identified culverts in New Berlin greater than 18 inches in size. The nominal capacity of each culvert was calculated based on its size, shape, construction material, and slope. Culverts were assumed to have sufficient headwater to cause them to flow full, and assumed to be unobstructed. Each was evaluated for inlet control and barrel control and the limiting flow condition was taken as the capacity. An entrance loss coefficient of between 0.1 and 0.5 was used to represent entrance conditions. Additional information regarding the capacity analysis calculations is presented in Exhibit C-4 in Appendix D. Design flows corresponding to the 10-year and 100-year storms were estimated at each culvert location. These flows were determined by delineating the area tributary to each culvert and multiplying the area by unit flows obtained from the SWMM model results. The capacity analysis results are presented in Appendix D. The level of service provided by each culvert has been determined by comparing the design flows to the nominal capacity. Culverts in the minor storm water management system should provide at least 10-year capacity. Culverts included in the primary storm water management system should provide at least the 100-year level of protection for capacity and road overtopping. The analysis results indicate that 115 of the analyzed culverts do not meet these criteria. Of the 115 undersized culverts, 32 are primary system culverts and 83 are secondary system culverts. A program to address these deficiencies is presented in Section 8 of this plan. AB 5-6
75 Table 5-3: Flow Capacity and Overtopping Results at Primary System Culverts Capacity Future Conditon Flow (cfs) Level of Protection Road Street Name Subwatershed Culvert ID Culvert Description (cfs) 2yr 10yr 25yr 100yr Flow Capacity Overtopping* 124th Street Root /09 38" x 54" Arch <2 year 2 year 124th Street /07/08 72" x 100" & 2@ 48" <100 year 100 year Lagoon Road /07 67" x 95" Arch year 100 year Cleveland Avenue " x 128" Arch year 100 year 128th Street / " CMP <100 year 100 year 130th Street /02 60" RCP year 100 year 132nd Street /17 48" CMP <25 year 25 year 133rd Street /14 48" RCP <25 year 25 year Dakota Street /12 48" RCP year 100 year Sunny Slope Road " RCP year 100 year Dakota Street " x 30" ACMP <2 year 100 year 128th Street South " RCP <25 year 25 year 130th Street " RCP <10 year 25 year National Avenue " RCP <25 year 2 year 124th Street " x 71" Arch <100 year 25 year 124th Street " x 72" Box year 100 year Weatherstone Boulevard /13 38" x 57" & 43" x 64" Arches year 100 year South Carnaby Lane /19 38" x 57" & 43" x 64" Arches year 100 year Victoria Circle /15 38" x 57" & 43" x 64" Arches year 100 year Coldspring Road " CMP <100 year 100 year St. Mary's Drive /07 11'x3' Box year 25 year Grange Avenue " CMP < 100 year 100 year Marquette Drive /15/16 38" x 57" Arch year 100 year Balboa Drive /09 38" x 57" Arch < 25 year 25 year Cherrytree Lane /20 38" x 57" Arch <100 year 25 year Radisson Court /13 38" x 57" Arch <100 year 25 year Marin Way /38 x 68" Elliptical year 100 year Beloit Road /34 7'x3' Box year 100 year Rock Freeway (I-43) 'x5' Box year 100 year Frances Street " x 24" Arch < 100 year 10 year Rock Freeway (I-43) Calhoun /10 30" RCP year 100 year Racine Place ' x 8' Box <100 year 100 year College Avenue /07 60" RCP year 100 year Racine Drive " CMP year 100 year Tans Drive " RCP <100 year 2 year Rock Freeway (I-43) 'x7' Box year 100 year Rock Freeway (I-43) 'x8' Box year 100 year Beres Road /14/13 60" CMP <25 year <2 year Calhoun Road /02 48" x 60" Arch <25 year 2 year Rock Freeway (I-43) /07 48" RCP <10 year 25 year Rock Freeway (I-43) " RCP <100 year 100 year Rock Freeway (I-43) /10 6'x10' Box year 100 year Martin Road / " CMP <25 year 10 year Beloit Road " CMP <100 year 25 year Greenfield Avenue Deer 'x10' Box <100 year 100 year C & NW Railroad /12 84" CMP <25 year 100 year Rogers Drive 'x20' Box year 2 year Lincoln Avenue 'x10' Box <10 year 10 year Glendale Drive /06 5.8'x12' Box <100 year 100 year Cleveland Avenue /02/03 72" CMP <10 year 100 year James Drive /03/04 5'x10' Concrete Box <25 year 100 year Moorland Road /16 8'x9' Box year 100 year West San Mateo Drive 'x16' Box year 100 year National Avenue 'x10' Box and 63" x 98" Elliptical <25 year 100 year 162nd Street ' RCP year 100 year Cleveland Avenue Poplar /02 54" RCP <10 year 100 year Calhoun Road /09/10 60" RCP year 100 year Calhoun Road /12/13 80" CONC, 5' RCP year 100 year Coffee Road /02/03 66" RCP <100 year 100 year Observatory Road " x 72" Arch <2 year 100 year Observatory Road " x 102" Arch <100 year 25 year Cleveland Avenue /10 42" <10 year < 2 year Cleveland Avenue /02 30" & 60" CMP year 100 year Willow Road " x 35" Arch year < 2 year 166th Street /02/03 45" x 66" Box year 100 year Victor Road /07 36" x 58" Arch year 25 year Ryerson Drive /07 x 57" Arch year 100year C & NW Railroad " RCP year 100 year Gravel Road " RCP <100 year 25 year Lincoln Avenue " x 24" Arch <25 year 10 year Cleveland Avenue " x 87" Arch year 100 year Arcadian Drive Underwood " x 71" Arch <25 year 50 year Elm Grove Road " x 71" Arch <10 year 2 year * Road overtopping can occur even though the flow capacity is not exceeded when there is backwater from downstream. AB 5-3.xls/Table 5_3 1/22/2010
76 Section 6 Water Quality Analysis 6.1 Introduction A water quality analysis was conducted to estimate the amount of pollutants that are discharged to the major streams within New Berlin via storm water runoff. The water quality analysis was conducted using a unit-area loading model which is based in part on the Source Loading and Management Model (SLAMM) developed by the WDNR. The type and amount of pollutants carried with storm water depend on the types of land use. Transportation, industrial, and commercial areas are typically major contributors of sediments and metals due to vehicular traffic and outside material storage. Residential areas typically contribute sediment and metals, along with pesticides, fertilizers, and bacteria. The pollutant loading rate for residential areas varies with the density of development. Park and open space areas generally contribute relatively minor amounts of metals and sediment. Park areas typically contribute significant amounts of nutrients due to landscaping practices. The type of storm water conveyance system affects the quality of the storm water runoff. Grassed swales, when properly designed and maintained, filter out pollutants and reduce runoff quantity through infiltration. Engineered storm sewer systems convey runoff and pollutants to the receiving stream without an opportunity for filtration. The water quality analysis was conducted for five pollutants: sediment, phosphorous, copper, lead, and zinc. These five pollutants are associated with urban storm water runoff and often cause water quality problems in urban streams as identified in Table 6-1. Table 6-1: Major Storm Water Pollutants, Sources, and Water Quality Impacts Pollutant Typical Sources Water Quality Impacts Sediment Phosphorous Copper Lead Zinc Soil, atmospheric deposition (dust), litter and debris, particles from automobiles and tires, deteriorated pavement Fertilizer, organic matter (leaves, grass clippings), soil Automobile brake pads, wire, roof materials Atmospheric deposition, automobiles, paint, medical equipment Galvanized steel roof drains and downspouts, coatings, rubber products Decreases water clarity, covers valuable plants and bottom dwelling organisms, destroys breeding sites, reduces aquatic plant photosynthesis Excessive algal growth, dissolved oxygen reduction, odors Toxic to aquatic life Toxic to aquatic life Toxic to aquatic life AB 6-1
77 Section 6 Water Quality Analysis A separate industrial pollutant loading analysis was conducted to further evaluate the amount of pollutants discharged to storm water runoff from industries within the City of New Berlin. The analysis was conducted for conventional and toxic pollutants anticipated being discharged in storm water from various types of industries. The objective of the industrial analysis is to determine the pollutants with the highest loading rate from industries within New Berlin, the industries with the greatest potential for contributing significant storm water pollutant loadings, and identification of selected best management practices which, when implemented will reduce the pollutant loading. 6.2 Water Quality Analysis Methodology Study Area Analysis The amount of pollutants which are contained in storm water runoff discharging to the major streams within the City of New Berlin were estimated using a unit-area loading rate model. The analysis was based on the following information: Land use in accordance with the areal photographs, land use maps, and other information provided by the City of New Berlin. Land use was calculated for the study area under current (1995) and future development conditions as shown on the zoning map. Land use conditions are described in Section 3.2 of this report. Pollutant loading rates for each land use category based on previous studies using the Source Loading and Management Model, research results, and professional judgement. The pollutant loading rates utilized in the model are presented in Table 6-2. Existing storm water control practices and study area characteristics including use of drainage swales or retention ponds. AB 6-2
78 Section 6 Water Quality Analysis Table 6-2: Unit Area Pollutant Loading Rates for the City of New Berlin Study Area Unit Area Loading Rates (lb./ac./yr.) Land Use Sediment Phosphorous Lead Copper Zinc Wetland, Forest, Preservation Park Institutional / Business Park Low Density Residential Medium Density Residential High Density Residential Commercial Industrial Highway Arterial Agriculture Construction 6, Extractive, Landfill 3, Open Water Industrial Analysis The industrial pollutant loading analysis was conducted to further evaluate the amount of pollutants discharged to storm water runoff from industries within the City of New Berlin. The analysis was based on the following information: Industrial facility information including Standard Industrial Classification (SIC) Code, acres, and percent impervious. The industrial facility information was provided by the City of New Berlin through tax records and the New Berlin Industrial Park Directory. Pollutant loading rates for specific types of industries based on storm water sampling data collected from 6,500 industrial facilities nationwide as part of the U.S. Environmental Protection Agency=s (USEPA=s) group industrial storm water permitting program. AB 6-3
79 Section 6 Water Quality Analysis 6.3 Water Quality Analysis Results Study Area Analysis The water quality analysis summarizes the annual anticipated pollutant loadings, in pounds per year, by land use category and by subwatershed / subbasin designation. The results can then be used to target appropriate best management practices (BMPs) to effectively reduce the pollutant loadings in critical areas. The analysis indicates that construction, extractive, commercial, and highway land use contributes the highest loading of sediment per acre, while parks, highways, and construction land use contributes the highest loading of phosphorous per acre, and commercial, industrial, and highway land use contributes the highest per acre loading of metals. Based on total loadings of pollutants from the City of New Berlin: agriculture and residential land use account for 49 and 44 percent of the total sediment loading under existing and future conditions, respectively; extractive land use accounts for more than 20 percent of the total sediment loading; agriculture and park land use account for 57 and 46 percent of the phosphorous loading under existing and future conditions, respectively; commercial, industrial, and highway land use account for 46 to 78 percent of the total metals loadings under existing and future land use conditions; and the total sediment and phosphorus loadings are reduced by 12 and 6 percent, respectively from existing to future conditions while metal loadings are increased by more than 30 percent due to development of agricultural lands. The annual anticipated pollutant loadings, by land use, under the existing and future land use conditions are presented on Table 6-3 and 6-4. The distribution of the annual pollutant loading by land use for existing and future conditions is shown on Figure 6-1. A comparison of the total annual pollutant loadings under existing and future conditions is shown on Figure 6-2. Tables 6-5 and 6-6 present a summary of the annual anticipated loadings by subwatershed within the City of New Berlin under existing and future conditions. Generally, the subwatersheds which contribute the highest pollutant loading correlate with the land uses discussed above. In order to reduce the influence of the subwatershed size on the pollutant loadings, a pound per acre per year loading was evaluated for each subwatershed. The sediment and metals pollutant loading, based on pounds per acre per year, varies in accordance with the percentage of urban land use. The phosphorous pollutant loading, based on pounds per acre per year, does not vary significantly between subwatershed. A comparison of pollutant loadings based on pounds per acre per year is presented in Figure 6-3. The water quality model results are presented in Appendix E. AB 6-4
80 Table 6-3: Existing Annual Pollutant Loadings By Land Use City of New Berlin - Storm Water Management Study Pollutant Land Use Area Sediment Phosphorous Lead Copper Zinc ( acres ) ( lb./yr. ) (lb./ac./yr.) ( % Total) ( lb./yr. ) (lb./ac./yr.) ( % Total) ( lb./yr. ) (lb./ac./yr.) ( % Total) ( lb./yr. ) (lb./ac./yr.) ( % Total) ( lb./yr. ) (lb./ac./yr.) ( % Total) Wetland, Forest, Preservation 5,147 15, % % % % % Agriculture 7,152 3,218, % 6, % % % % Park , % 1, % % % % Institutional , % 1, % % % % Low Density Residential 4, , % % % % % Medium Density Residential 2, , % % % % % High Density Residentia , % % % % % Commercial ,511 1,056 6% % 1, % % 1, % Industrial , % % 1, % % 3, % Highway ,559 1,003 3% % 2, % % % Arterial , % % % % % Open Water , % % % % % Extractive, Landfill 668 2,233,227 3,344 21% % % % % Railroad 83 44, % % % % % Construction 200 1,200,000 6,000 11% % % % % Total 23,644 10,635, % 12, % 6, % 1, % 7, % AB Page 1 1/22/2010
81 Table 6-4: Existing Annual Pollutant Loadings By Drainage Area City of New Berlin - Storm Water Management Plan Pollutant Drainage Areas Area Sediment Phosphorous Lead Copper Zinc ( acres ) ( lb./yr. ) (lb./ac./yr) ( % Total) ( lb./yr. ) (lb./ac./yr) ( % Total) ( lb./yr. ) (lb./ac./yr) ( % Total) ( lb./yr. ) (lb./ac./yr) ( % Total) ( lb./yr. ) (lb./ac./yr) ( % Total) Calhoun Creek 4,135 2,518, , , , Upper Root River 4,106 1,636, , , Tess Corners Creek 1, , , Underwood Creek , Deer Creek 2,769 1,211, , , , Poplar Creek 8,075 3,125, , , , Mill Creek 2,391 1,405, , Total 23,644 10,635, , , , , AB Page 1 1/22/2010
82 Table 6-5: Future Annual Pollutant Loadings By Land Use City of New Berlin - Storm Water Management Study Pollutant Land Uses Area Sediment Phosphorous Lead Copper Zinc ( acres ) ( lb./yr. ) (lb./ac./yr.)( % Total) ( lb./yr. ) (lb./ac./yr.) ( % Total) ( lb./yr. ) (lb./ac./yr.) ( % Total) ( lb./yr. ) (lb./ac./yr.) ( % Total) ( lb./yr. ) (lb./ac./yr.) ( % Total) Wetland, Forest, Preservation 4,596 13, Agriculture 2,925 1,316, , Park 1, , , Institutional , , Low Density Residential 6,525 1,337, , Medium Density Residential 2,820 1,156, , High Density Residentia , Commercial ,680 1, , Industrial 1, , , Highway ,522 1, , Arterial , Open Water , Extractive, Landfill 665 2,225,368 3, Railroad 83 44, Total 23,644 9,364, , , , , AB Page 1 1/22/2010
83 Table 6-6: Future Annual Pollutant Loadings By Drainage Area City of New Berlin - Storm Water Management Study Pollutant Type Drainage Areas Area Sediment Phosphorous Lead Copper Zinc ( acres ) ( lb./yr. ) (lb./ac./yr.) ( % Total) ( lb./yr. ) (lb./ac./yr.) ( % Total) ( lb./yr. ) (lb./ac./yr.) ( % Total) ( lb./yr. ) (lb./ac./yr.) ( % Total) ( lb./yr. ) (lb./ac./yr.) ( % Total) Calhoun Creek 4,135 2,442, , , , Upper Root River 4,106 1,505, , , , Tess Corners Creek 1, , Underwood Creek , Deer Creek 2,769 1,203, , , , Poplar Creek 8,075 2,394, , , , Mill Creek 2,391 1,104, , Total 23,644 9,364, , , , , AB Page 1 1/22/2010
84 Section 6 Water Quality Analysis Existing Conditions Sediment Phosphorous Park - 2% Institutiona l - 2% Agriculture - 3 0% Agriculture - 4 7% Resid ent ial - 19 % Park - 10% Con structi on - 3% Other - 4 % Commercial - 6% New Constructi on - 11% Institutiona l - 9% Hig hway/arte rial - 8 % Industri al - 3% Hig hway/arte rial - 4 % Other - 2% Extractive - 21% Resid ential - 14 % Commercial - 5% Lead Copper Zinc Commercial - 24% Resid ent ial - 20 % Resid ent ial - 37 % Commercial - 16% Resid ent ial - 11 % Industri al - 17 % Institutiona l - 2% Other - 2 % Commercial - 15% Institutiona l - 3% Agriculture - 5 % Other - 7 % Institutiona l - 9% Other - 4 % Industri al - 45 % Hig hway/arte rial - 1 5% Hig hway/arte rial - 3 5% Industri al - 17 % Hig hway/arte rial - 1 8% Future Conditions Sediment Phosphorous Institutiona l - 4% Resid ent ial - 30 % Park - 5% Park - 25% Agriculture - 1 4% Agriculture - 2 1% Commercial - 9% Industri al - 8% Hig hway/arte rial - 5 % Extractive - 24% Other - 1 % Institutiona l - 13% Resid ential - 22 % Other - 1 % Hig hway/arte rial - 9 % Industri al - 2% Commercial - 7% Lead Copper Zinc Commercial - 26% Resid ential - 21 % Resid ential - 40 % Commercial - 15% Resid ential - 10 % Institutiona l - 8% Institutiona l - 4% Other - 4 % Commercial - 16% Other - 5 % Other - 3 % Industri al - 23 % Industri al - 54 % Hig hway/arte rial - 1 0% Hig hway/arte rial - 2 6% Industri al - 21 % Hig hway/arte rial - 1 4% AB 6-5
85 Section 6 Water Quality Analysis Figure 6-3: Comparison of Subwatershed Pollutant Loadings Note: The pollutant loadings for copper and zinc are not shown because the variation between the subwatersheds is similar to that shown for lead. AB 6-6
86 6.3.2 Industrial Analysis Section 6 Water Quality Analysis The industrial analysis estimated storm water pollutant loadings from 182 industries within the City of New Berlin. The water quality analysis summarizes the annual anticipated pollutant loading, in pounds per year, by industrial category. The results can then be used to identify those industries that have the greatest potential for contributing significant storm water pollutant loadings and to identify appropriate best management practices for those industries. The industries included in the analysis, are industries which, based on their SIC code, are likely required to obtain a Wisconsin Industrial Storm Water Permit. The industries are grouped into 13 different categories based on the general type of manufacturing facility. A majority of the industries included in the analysis are grouped in the categories of fabricated metal products, transportation equipment, electronics, land transportation, or printing and publishing. These industrial categories also occupy a majority of the total acres included in the analysis. A description of the industrial categories included in the analysis is presented in Table 6-7. Table 6-7: Summary of Industrial Facilities in New Berlin Industrial Category Number of Facilities Total Acres Occupied Percent of Total Industrial Acres Average Percent Impervious Timber Products Fabricated Metal Products Transportation Equipment, Industrial & Commercial Electronic, Electrical, Photographic and Optical Paper & Allied Products Chemical and Allied Products Asphalt Paving and Roofing Materials Manufacturers and Lubricant manufacturers Glass, Clay, Cement, Concrete, and Gypsum Land Transportation Food and Kindred Products Textile Mill, Apparel and Other Fabric Products Printing and Publishing Rubber, Misc. Plastic Products TOTAL AB 6-7
87 Section 6 Water Quality Analysis The industries included in the analysis are based on information provided by the City of New Berlin through tax key records and the New Berlin Industrial Park Directory. It should be noted that the quarries located within the City of New Berlin were not included in the industrial water quality analysis because specific information regarding these facilities was not provided. The quarries are included in the study area analysis as extractive land use areas. The analysis indicates that five of the industrial categories, fabricated metal products, transportation equipment, electronics, land transportation, and printing and publishing, contribute over one-half of the total industrial loading of all pollutants. The industrial facilities in these five categories occupy approximately 350 acres, or more than 80 percent of the industrial areas evaluated. Based on the total loading calculated by the industrial water quality analysis: A majority of the industrial metals loading is contributed by fabricated metal products, transportation equipment, electronics, land transportation, and printing and publishing facilities. A majority of the industrial sediment loading is contributed by Timber Products and Land Transportation facilities. A majority of the industrial nutrient loading is contributed by transportation equipment and land transportation facilities. The unit area pollutant loading contributed by the different types of industries vary greatly. Pollutants of Concern and the industrial category with the highest unit area loading are presented in Table 6-8. Table 6-8: Highest Industrial Unit Area Loadings Pollutant of Concern Total Suspended Solids Phosphorous Biochemical Oxygen Demand Copper Lead Zinc Industry with the Highest Unit Area Loading Timber Products Timber Products Timber Products Rubber and Misc. Plastic Products Paper and Allied Products Paper and Allied Products The annual anticipated pollutant loading, by industrial category, is presented on Table 6-9. AB 6-8
88 Table 6-9: Summary of Industrial Storm Water Pollutant Loadings Acres Industry Sector Number of Total % of Average Percent Lead Zinc Cadmium Chromium (% of (% of (% of (% of (lbs.) total) (lbs.) total) (lbs.) total) (lbs.) total) Copper (% of (lbs.) total) Annual Pollutant Loading (lbs.) Nickel (% of total) Total Suspended Solids (% of (lbs.) total) Total Phosphorous (% of (lbs.) total) Total Kjeldahl Nitrogen (% of (lbs.) total) Chemical Oxygen Demand (% of (lbs.) total) Biochemical Oxygen Demand (% of (lbs.) total) Facilities Acres Total Impervious (lbs.) Timber Products % 45% % % 2.1 6% % % % % % Fabricated Metal Products % 46% % % 1.0 6% 1.8 7% % % % % % % % Transportation Equipment, Industrial or Commercial % 54% % % % % % % % % % % % Electronic, Electrical, Photographic and Optical Goods % 42% % % % % % % % % % % % Paper & Allied Products Manufacturing 3 5 1% 54% 0.7 2% % % 0.5 0% 4.4 0% % % Chemical & Allied Products Manufacturing 5 5 1% 56% 0.2 1% 5.2 2% 0.2 1% 0.1 1% 0.3 1% 0.2 1% 600 1% 1.6 1% % % % Asphalt Paving and Roofing Materials Manufacturers and Lubricant Manufacturers 1 2 1% 30% % 0.8 0% 6.2 0% % % Glass, Clay, Cement, Concrete, and Gypsum Product Manufacturing 2 4 1% 44% 0.1 0% 2.5 1% 0.1 0% 0.1 0% 0.5 2% 0.1 0% % 3.1 1% % % % Land Transportation % 57% % % % 1.1 4% 1.6 5% % % % % % % Food & Kindred Products % 43% 2.4 6% 6.4 2% 0.3 2% 0.5 2% 2.7 8% 0.9 5% % % % % % Textile Mills, Apparel and Other Fabric Products % 69% 1.3 3% 9.8 3% % 0.8 2% 0.5 2% 938 1% 5.1 2% % % % Printing & Publishing % 52% % % % % % % % % % Rubber, Misc. Plastic Products, and Misc. Manufacturing 6 9 2% 75% 0.5 1% % % 2.3 7% % 7.9 3% % % % Total % AB tbl6-9.xlssummary page 1 of 1 1/22/2010
89 Section 7 Problem Area Identification 7.1 Introduction The analysis described in the previous sections of this report identified potential problem areas related to flooding and drainage, streambank stability, culvert capacity and blockage, and water quality. This section presents a description of the problem areas and the methods used to identify the potential problems. A variety of flooding and drainage problems have been reported to the City of New Berlin by its residents and public officials. The problems are classified as either primary or minor according to whether they are located on the primary storm water management system or not. The flooding problems associated with primary and minor systems are discussed in Section 7.2. The storm water management plan will address the primary system problems only. The hydraulic structure inventory, described in Section 4, evaluated culverts for various deficiencies including insufficient flow capacity, backwater effects, and road over topping. Section 7.3 presents the culverts identified as having deficiencies. In addition to capacity, another key problem concerning culverts is blockage or obstruction of culverts. During the inventory culverts were identified as partly or substantially blocked. A summary of the blocked culverts was submitted directly to the City of New Berlin for prompt maintenance. Drainage problems were identified based on evaluation of 556 ditch segments located within the study area. A segment is a road ditch along one side from one road crossing to the next road crossing. Erosion, sedimentation, vegetation, trash, and standing water are the criteria under which possible drainage problems were identified. Drainage ditch problems are discussed in Section 7.4. The streambank inventory, described in Section 4, evaluated the channel stability of the major streams within the City of New Berlin. Each reach was rated as either excellent, good, fair, or poor. The stream reaches rated as fair or poor are considered generally unstable and should be repaired and/or stabilized. Section 7.5 describes the unstable reaches. The water quality analysis, described in Section 6, identified critical land uses which contribute a majority of the storm water pollutants and areas which are significant contributors of pollutants within the City of New Berlin. Industries which have the greatest potential for contributing significant storm water pollutant loadings are also identified. Section 7.6 describes the critical land uses, the areas which are significant storm water pollutant contributors, and the industrial areas which have the greatest potential for contributing significant storm water pollutant loadings. AB 7-1
90 Section 7 Problem Area Identification 7.2 Flooding Problem Areas There is a wide range of perceived flooding and drainage problems experienced by the residents of New Berlin. Not all of these problems can be solved within the context of a storm water management plan, while other problems may not be cost effective to solve. Flood problems are identified through citizen and City of New Berlin representative reports of nuisance ponding or property damage. Reports resulted primarily from incidents stemming from rainfalls on June 20 through 21, 1997; July 2, 1997; and August 6, However, several of the reported problems were well known prior to these storms. Generally, the reported problems fall into one of the following categories: Basement flooding - ranging from a few inches to several feet in depth. Yard flooding - by either ponded or moving water. Street flooding - due to overtopping at cross-drainage structures or ponding over storm inlets. Streambank and drainage way erosion. The problem locations identified by residents and City of New Berlin Representatives are shown on Plate 1 in Appendix A. Table 7-1 presents a summary of the reported problems. While these might all be problems worth solving, the cause of a particular problem may be such that the problem cannot be solved through storm water management improvements. Examples of problems for which solutions are beyond the scope of a storm water management plan include: Basement flooding caused by sump pump failure due to interruption of electrical service or inadequate sump pump capacity. Basement flooding is caused by sanitary sewer backup. This is either a sanitary sewer collection system maintenance problem or the result of illegal connections of sump pumps or storm water drains to the sanitary sewer. Street flooding during heavy rainfalls. Storm sewers and roadside ditches typically are designed to convey the 10-year storm. Rainfalls in excess of the 10-year volume will cause street and yard flooding up to six inches deep. Flood threats on structures or other improvements that have been constructed within the 100-year floodplain that has been delineated according to the FEMA flood insurance study procedures. AB 7-2
91 Table 7-1: Flood Control and Drainage Problems Reported by City of New Berlin Residents and Representatives Subwatershed Subbasin Section Map ID* Problem Description System Likely Cause Underwood Creek 1A010 1 B,N,BB Overflow of box culvert entrance at 124th and Meadow Lane floods basements and back yards Primary Clogging of trash rack at culvert inlet and inlet grates along culvert Underwood Creek 1A010 1 J Flooded Basement at 1517 S. 124th Street Primary Inadequate clogged or surcharged inlets to enclosed channel Underwood Creek 1A020 1 Z Home in floodplain upstream of Elm Grove Road Primary Home located within Floodplain Underwood Creek 1A032 1 AA Overtopping of Arcadian Drive and Elm Grove Road Primary Inadequate culvert capacity Upper Root River 2E G,U House flooding upstream of Grange Road Primary Road grade higher than low water entry elevation of house. Backup from culvert floods house Upper Root River 2B C Road flooding on Lagoon Road north of Cleveland Primary Inadequate culvert capacity or obstructed by debris Avenue Upper Root River 2B R Washout of private bridge at 128th and Cleveland Primary Property straddles major tributary of Root River. Property is surrounded by 100-year floodplain. Upper Root River 2A020 1 L Yard flooding and erosion in back yards on north side of Primary Inadequate culvert capacity under downstream culvert Park Avenue Deer Creek 3A010 3 M Not Stated Primary Culvert under 164th north of th is too small Deer Creek 3A010 3 CC Inadequate drainage of backyard at 1534 South 168th causing yard flooding Primary No drainage path Calhoun Creek 4C H,DD Yard or common area? Flooding at outlet of 60-inch storm sewer Minor Inadequate positive drainage toward main channel. Possible siltation problem Calhoun Creek 4A T Unspecified flooding problem on Mary Ross, Minor Not determined Homestead and Selentine Poplar Creek 6A P Yard flooding, driveway culverts washed out Minor Ditch capacity inadequate to handle large upstream tributary area Poplar Creek 6A S Erosion Problems on Poplar Creek Tributary Minor Cutting of stream banks Upper Root River 2A020 1 F Flooding of one house and several yards east of the Minor Inadequate flow path toward main channel intersection of Elm Grove and Honey Lane Upper Root River 2A020 1 K Yard flooding at Honey Lane Minor Inadequate driveway culvert Upper Root River 2A050 2 A,W Road flooding on Koestner Lane creates access Minor Inadequate flow path toward railroad problems and yard flooding Underwood Creek 1A031 2 E Basement and yard flooding at 1600 Sherwood Drive Minor Cemetery drainage flows through yards to reach street Underwood Creek 1A010 1 Q Yard flooding with possible ditch overflow to basement Minor Yard is in former drainageway at 124th and Prospect Underwood Creek 1A010 1 D Flooding southwest of the intersection of Elm Grove Minor Unclear and Meadow Lane Underwood Creek 1A032 1 O Road overtopping near Prospect Place Minor Insufficient Drainage Upper Root River 2B FF Yard flooding at Brian Drive Minor Insufficient Drainage AB tbl71.xls 1/22/2010
92 Section 7 Problem Area Identification Flood threat on structures and other improvements during rainfall in excess of the 100-year events. This plan examines options for solving specific residential and street flooding problems that are caused by inadequate capacity of the Primary Storm Water Management System (PSMS) and erosion problems in PSMS channels. The plan also presents solutions for serious capacity deficiencies in the minor drainage system. The PSMS is defined as the system of ponds, open channels, overflows, and roadway crossing structures designed to convey floodwaters. The PSMS is usually designed to handle the 1 percent recurrence interval, or 100-year event without damage or threat to public safety. The minor system is designed to carry flows resulting from frequent or Aeveryday rainfalls without disruption. The minor system consists of storm sewers, street inlets, roadside ditches, and driveway culverts. These minor system facilities are usually designed to convey the 10-year storm flow. Therefore, significant ponding and street flow should be expected in storms greater than the 10-year recurrence interval storm event. In order to evaluate the flooding problems, a priority system was developed to differentiate varying degrees of problem severity. Priorities are based upon two factors: the cost-effectiveness of the project and whether storm water management improvements can adequately solve the problem. Primary problems encompass both factors. Minor problems meet either one or none of the priority factors. Recommended solutions are developed only for the primary problems Primary Flooding Problems Seven primary problems were identified from the reported problems of the City of New Berlin. Each problem is associated with one or more map identification letters which represent specific citizen reports. This form of identification is based upon the time the problem was reported to the City of New Berlin. The map identification was used to mark the problem location on Plate 1 in Appendix A. The location and the type of flooding problem for each primary flooding problem is discussed below Problem Area UNDERWOOD1 - Underwood Creek at Meadow Lane (Map ID - A, B, J, N, BB) Along Meadow Lane between 128th and 124th Street, the South Branch of Underwood Creek is enclosed in a rectangular storm sewer that is initially nine-feet wide by four-feet high, and is ultimately 14 feet wide where it discharges into the Greenfield Park Golf Course, east of 124th Street. There are numerous reports of house, yard, and street flooding associated with this enclosed channel. AB 7-3
93 Section 7 Problem Area Identification Problem Area UNDERWOOD2 Problem Area UNDERWOOD 2a - Underwood Creek near Elm Grove Road (Map ID - D, Z, AA) This problem involves overbank flooding of yards and homes along a reach of the South Branch of Underwood Creek beginning about 500 feet upstream of Arcadian Drive. The primary cause of the problem is that the properties are in or very close to the 100-year floodplain. Problem Area UNDERWOOD 2b - Gatewood Park (Map ID - E,X) This residential area consists of six streets east of Sunny Slope Road and South of Greenfield Avenue. Residents experience extensive yard and basement flooding due to slow drainage of the neighborhood and adjacent cemetery. The cause of the problem is mild roadside ditch slopes and inadequate outlet capacity under Sunny Slope Road Problem Area ROOT1 - Upper Root River - 130th Block of Park Avenue (Map ID - L) One residence experiences flooding along Park Avenue due to inadequately sized downstream culvert at Graham Street. Also, inadequate drainage ditch capacity exists between Elm Grove Road and Honey Lane south to the golf course Problem Area ROOT2 - Upper Root River - 132nd Street to Lagoon Road Along Cleveland Avenue (Map ID - C, R) Approximately 15 homes are within the floodplain in the area bounded by Cleveland Avenue, National Avenue, 124th Street, and 132nd Street. The inlet and outlet configuration of the culverts are not parallel to the stream at the eastern Lagoon Road culverts at Cleveland Avenue. Road flooding occurs on Lagoon Road north of Cleveland Avenue. A private bridge at 128th Street and Cleveland Ave. has been washed out Problem Area ROOT3 Upper Root River - LaSalle Drive and Grange Avenue (Map ID - G, U) A structure located adjacent to a tributary of the Upper Root River near Grange Avenue experiences flooding. Although a citizen report indicates a problem at Grange Avenue, the problem is caused by inadequate culvert capacity downstream at St. Mary=s Drive Problem Area ROOT4 - Upper Root River - Honey Lane (Map ID - F, K) Yard flooding and erosion are experienced by several residences along a tributary to the Upper Root River and also drainage problems along the railroad tracks north of Honey Lane near Elm Grove Road. The problem is due to inadequate drainage capacity and culvert capacity. AB 7-4
94 Section 7 Problem Area Identification Problem Area DEER1 - Deer Creek - Buena Park (Map ID - M, CC) Six residences experience structural flooding. Several additional residences experience yard and basement flooding. The problem stems from backup from inadequate culverts, ditch capacity, and lot grading. The general area slope is very flat. In addition, most homes have sump pump discharge into the ditch. Lawn clippings and yard waste contribute to culvert blockages Minor System Flooding Problems Storm Water flooding problems identified as resulting from deficiencies in the minor storm water drainage system are listed below. The New Berlin Storm Water Management Master Plan does not provide conceptual engineering solutions to minor system problems. Further study of these problem areas may be warranted based on City of New Berlin staff recommendations. It may not be cost effective to solve minor system problems based on the current level of damages. Deer Creek: <Inadequate local drainage in backyards between 164 th and 168 th Street and Roosevelt Avenue Underwood Creek: <Insufficient drainage from Highland Memorial Park <Lack of storm water conveyance at Gatewood Drive and Clover Knoll Place <Inadequate culvert capacity at Kostner Lane and C. & N.W. Railroad <Sediment and debris blockage of Sunny Slope Road culvert <Surcharging manhole at block of Greenfield Avenue <Insufficient ditch storage at 124th Street and Prospect Drive Poplar Creek: <Minor erosion on Poplar Creek between Calhoun Road and Victor Road <Drainage easement backup at 157th Street and Monterey Drive <Insufficient ditch storage at 158th Street and Santa Rosa Boulevard <Sediment and debris blockage at Calhoun Road and Salentine Drive Calhoun Creek: <Sediment and debris blockage at Sovereign Drive Upper Root River: <Parkwood Lane storm sewer capacity AB 7-5
95 Section 7 Problem Area Identification 7.3 Culvert Capacity Problems The hydrologic and hydraulic computer modeling analysis, described in Section 5, included a capacity analysis of approximately 73 road crossing culverts in the primary system in the City of New Berlin. The SWMM representation simulated road crossing culverts which incorporate energy losses in the culvert barrel(s) as well as the culvert entrance and departure reaches. The model also accounts for backwater (ponding) behind the culverts and the possibility of road overtopping. The culverts were analyzed for the flow conditions generated by the 2-, 10-, 25-, and 100-year recurrence interval storm events. Culverts were evaluated for several potential deficiencies including insufficient flow, capacity, excessive backwater, and over road topping. The following criteria were employed in identifying primary system culvert capacity deficiencies: Overtopping of main arterials in the 100-year storm, Insufficient flow capacity for the 100-year storm, and Excessive backwater behind a culvert in a developed area. The analysis results indicate that 32 of the primary culverts modeled have capacity deficiencies. Primary system culverts determined to have capacity deficiencies are presented in Table 7-2. As part of the citywide culvert capacity analysis, described in Section 5, 715 culverts in the minor storm water management system were evaluated for capacity and level of service. Culverts in the minor or secondary storm water management system should provide at least 10-year capacity. Minor culverts determined to have capacity deficiencies are presented in Table 7-3. The analysis results indicate that approximately 83 culverts do not meet this criterion. 7.4 Drainage Ditch Problems Drainage problems are identified through the examination of 556 ditch segments located within the New Berlin study area. Based on the inventory, ditches were evaluated based upon location, shape, and levels of erosion, sedimentation, vegetation, garbage, and standing water. Upon field inspection, 32 locations are determined to be problem areas. Problem areas are defined as locations requiring maintenance operations for erosion, restabilization, clearing of sedimentation, or collection of trash deposits to ensure proper drainage. Table 7-4 presents the drainage ditch problem locations. 7.5 Streambank Problems The streambank inventory, discussed in Section 4, classified approximately 34 miles of channel in the New Berlin study area. This inventory evaluated the channel stability AB 7-6
96 Table 7-1: Flood Control and Drainage Problems Reported by City of New Berlin Residents and Representatives Subwatershed Subbasin Section Map ID* Problem Description System Likely Cause Underwood Creek 1A010 1 B,N,BB Overflow of box culvert entrance at 124th and Meadow Lane floods basements and back yards Primary Clogging of trash rack at culvert inlet and inlet grates along culvert Underwood Creek 1A010 1 J Flooded Basement at 1517 S. 124th Street Primary Inadequate clogged or surcharged inlets to enclosed channel Underwood Creek 1A020 1 Z Home in floodplain upstream of Elm Grove Road Primary Home located within Floodplain Underwood Creek 1A032 1 AA Overtopping of Arcadian Drive and Elm Grove Road Primary Inadequate culvert capacity Upper Root River 2E G,U House flooding upstream of Grange Road Primary Road grade higher than low water entry elevation of house. Backup from culvert floods house Upper Root River 2B C Road flooding on Lagoon Road north of Cleveland Primary Inadequate culvert capacity or obstructed by debris Avenue Upper Root River 2B R Washout of private bridge at 128th and Cleveland Primary Property straddles major tributary of Root River. Property is surrounded by 100-year floodplain. Upper Root River 2A020 1 L Yard flooding and erosion in back yards on north side of Primary Inadequate culvert capacity under downstream culvert Park Avenue Deer Creek 3A010 3 M Not Stated Primary Culvert under 164th north of th is too small Deer Creek 3A010 3 CC Inadequate drainage of backyard at 1534 South 168th causing yard flooding Primary No drainage path Calhoun Creek 4C H,DD Yard or common area? Flooding at outlet of 60-inch storm sewer Minor Inadequate positive drainage toward main channel. Possible siltation problem Calhoun Creek 4A T Unspecified flooding problem on Mary Ross, Minor Not determined Homestead and Selentine Poplar Creek 6A P Yard flooding, driveway culverts washed out Minor Ditch capacity inadequate to handle large upstream tributary area Poplar Creek 6A S Erosion Problems on Poplar Creek Tributary Minor Cutting of stream banks Upper Root River 2A020 1 F Flooding of one house and several yards east of the Minor Inadequate flow path toward main channel intersection of Elm Grove and Honey Lane Upper Root River 2A020 1 K Yard flooding at Honey Lane Minor Inadequate driveway culvert Upper Root River 2A050 2 A,W Road flooding on Koestner Lane creates access Minor Inadequate flow path toward railroad problems and yard flooding Underwood Creek 1A031 2 E Basement and yard flooding at 1600 Sherwood Drive Minor Cemetery drainage flows through yards to reach street Underwood Creek 1A010 1 Q Yard flooding with possible ditch overflow to basement Minor Yard is in former drainageway at 124th and Prospect Underwood Creek 1A010 1 D Flooding southwest of the intersection of Elm Grove Minor Unclear and Meadow Lane Underwood Creek 1A032 1 O Road overtopping near Prospect Place Minor Insufficient Drainage Upper Root River 2B FF Yard flooding at Brian Drive Minor Insufficient Drainage AB tbl71.xls 1/22/2010
97 Table 7-2: Culvert Capacity Analysis Results - Undersized Primary System Culverts Capacity Future Conditon Flow (cfs) Level of Protection Street Name Subwatershed Culvert ID# (cfs) 2yr 10yr 25yr 100yr Flow Capacity Road Overtopping* 124th Street Root / <2 year 2 year 132nd Street / <25 year 25 year 133rd Street / <25 year 25 year Dakota Street <2 year 100 year 128th Street South <25 year 25 year 130th Street <10 year 25 year National Avenue <25 year 2 year 124th Street <100 year 25 year Coldspring Road <100 year 100 year Balboa Drive / < 25 year 25 year Cherrytree Lane / <100 year 25 year Radisson Court / <100 year 25 year Frances Street < 100 year 10 year Beres Road Calhoun /14/ <25 year <2 year Calhoun Road / <25 year 2 year Rock Freeway (I-43) / <10 year 25 year Martin Road / <25 year 10 year Greenfield Avenue Deer <100 year 100 year C & NW Railroad / <25 year 100 year Lincoln Avenue <10 year 10 year Cleveland Avenue /02/ <10 year 100 year James Drive /03/ <25 year 100 year National Avenue <25 year 100 year Cleveland Avenue Poplar / <10 year 100 year Coffee Road /02/ <100 year 100 year Observatory Road <2 year 100 year Cleveland Avenue / <10 year < 2 year Willow Road year < 2 year Gravel Road <100 year 25 year Lincoln Avenue <25 year 10 year Arcadian Drive Underwood <25 year 50 year Elm Grove Road <10 year 2 year * Road overtopping can occur even though the flow capacity is not exceeded when there is backwater from downstream. AB 7-2&7-3.xls/Table 7-2A 1/22/2010
98 Table 7-3: Culvert Capacity Analysis Results- Undersized Minor System Culverts CULVERT Size Shape & Length Upstream Downstream Slope Capacity 100 yr Flow 10 yr Flow 10 yr Shortfall Percent ID Location (inches) Material (feet) Invert (feet) Invert (feet) (ft/ft) (cfs) (cfs) (cfs) Shortfall (cfs) Short OBSERVATORY & WOELFEL 21X30 ARCP % CALHOUN 30 CMP % C&NW RR 24 RCP % C & NW RR 18X24 CMPA % COURTLAND PARKWAY 18X24 ACMP % GREENFIELD & 124th 24 RCP % CALHOUN S. OF COFFEE 30 CMP % BELOIT 48 RCP % NATIONAL & CROWBAR 24 CMP % BELOIT & TRIBUTARY 30X42 ACMP % CLEVELAND & JOHNSON 24 CMP % LAWNSDALE 24 CCP % TH & JOLIET 18X27 ACMP % RADISSON & MENARD 18X27 ACMP % CRAWFORD & WILBUR 24 CMP % NEEDHAM & 124th 27 RCP % RACINE & JULIUS 24 RCP % GREENFIELD 24 CMP % GLENWOOD & TIMBERLANE 21X27 ACMP % TERRACE & TIMBERLANE 21X27 ACMP % C&NW RR 48 CONC % I-43 & MOORLAND 24 RCP % LINCOLN & BROOKSIDE 24 CMP % BELOIT 18X24 ACMP % MARTIN & EGOFSKE 24 CMP % OBSERVATORY & WOELFEL 36X72 ACMP % COFFEE & WOELFEL 18X24 ACMP % PROSPECT & 124th 30 CMP % PROSPECT PLACE & MILTON 17X42 ACMP % I-43 ROCK FREEWAY 30 CMP % I-43 & MOORLAND 24 RCP % MARQUETTE AND MAGELLAN 24 CMP % PROSPECT & CONRAD 24 CMP % RACINE IVE (AVENUE) 72 CMP % LINCOLN & MEADOWMERE 18X30 ACMP % AMOR & CLEVELAND 30 CMP % CLEVELAND & PARKWAY 30 CMP % PROSPECT & ELM GROVE 24 CMP % GREENFIELD & ELM GROVE 24 CMP % MONTANA & S.128TH 48 RCP % BTWN LINCOLN & C&NW RR 48 RCP % GRAHAM & TRIB 15X27 ACMP % EGOFSKE & OVERLOOK 27 RCP % ST. FRANCIS & TOP-O-HILL 18X30 ACMP % AB 7-2&7-3.xls/Table 7_3 page 1 of 2 1/22/2010
99 Table 7-3: Culvert Capacity Analysis Results- Undersized Minor System Culverts CULVERT Size Shape & Length Upstream Downstream Slope Capacity 100 yr Flow 10 yr Flow 10 yr Shortfall Percent ID Location (inches) Material (feet) Invert (feet) Invert (feet) (ft/ft) (cfs) (cfs) (cfs) Shortfall (cfs) Short ROOSEVELT & S. 167th 24X36 ACMP % RACINE & JULIUS 24 RCP % S. 170th & LINCOLN 24 ACMP % BELOIT & FREEWAY 24 CMP % THORNAPPLE 20X28 ACMP % MOORLAND & I RCP % ROCK I RCP % TIMBERLANE & VISTA 18X24 ACMP % VICTOR & CALHOUN 60" CMP % SALENTINE & CALDWELL 18X30 ACMP % ARMOUR & NORMAN 21 CMP % LANGLADE & CTH I 24X36 ACMP % ST. FRANCIS 24 CMP % PARKWAY 36 RCP % BERLIN 21 RCP % RACINE & ORCHARD 24 CMP % ADDISON &168th 18X27 ACMP % JANESVILLE 24 CMP % MENARD & GUERIN 21X27 ACMP % CALHOUN 24X36 ACMP % BERES & MARTIN 20X30 ACMP % WOODLAND 36X48 CMP % CLEVELAND & SUNNYSLOPE 18X30 ACMP % WOODLAND 24X36 ACMP % RYERSON & 30' UTILITY EASEMENT 42X54 ACMP % C&NW RR & TRIB 36X58 ACMP % SATURN 21X27 ACMP % LINCOLN & BROOKLAND 24X32 ACMP % th 20' AINAGE EASEMENT 24 CMP % ANAE & GRANGE 27X42 ACMP % ST. FRANCIS & 159th 18X30 ACMP % RIVIERA & MONTERREY 18X30 ACMP % CLEVELAND & 152nd 24 CMP % CLEVELAND & 149th 24 CMP % DAKOTA & MONTANA 15x30 ACMP % LINCOLN AVE UTILITY & RR & AINAGE 30X42 ACMP % EGOFSKE & BERES 24X36 ACMP % FRANCES & ST. MARY'S 36x132 CONC % SANTA ROSA BLVD 32X48 ACMP % AB 7-2&7-3.xls/Table 7_3 page 2 of 2 1/22/2010
100 Table 7-4: Summary of Drainage Ditch Problem Areas Subwatershed Section Location Depth Width Shape Identified Problem Calhoun Creek 26 North side of Beloit Road, west of Small Road 2'-5' 5'-10' U Bottom erosion, trash accumulation Deer Creek 2 South side of Rogers Drive, east of Valley Spring Court 1'-2' 5'-10' V - U Bottom Erosion Deer Creek 2 North side of Gatewood Drive, east of Woodside Drive 1'-2' 5'-10' V Bottom erosion, sedimentation, standing water Deer Creek 3 South side of Rogers Drive, west of Deer Bottom and side erosion, sedimentation, trash 2'-5' 5'-10' flat Creek accumulation, standing water Deer Creek 3 South Side of Greenfield Avenue, between Calhoun and Moorland Roads 2'-5' 5'-10' V - U Bottom erosion, trash accumulation Deer Creek 2 South side of Greenfield Avenue, east of Moorland Road 2'-5' 5'-10' U Bottom erosion, trash accumulation Deer Creek 3 Deer Creek 9 Deer Creek 15 Deer Creek 10 Deer Creek 10 Deer Creek 11 Deer Creek 10 Poplar Creek 11 Poplar Creek 16 Poplar Creek 4 North and east side of Carriage Lane, south of Greenfield Ave. west of Coach Light West side of Calhoun Road, south of Lincoln Avenue North side of El Dorando Drive, west of Moorland Road East side of 162nd Street, north of Glendale Drive East side of 170th Street, north of Glendale Drive South side of Cleveland Avenue, between 149th and 152nd Street South side of Lincoln Avenue, east of 170th Street South side of Graylog Lane, east of Ranke Lane North side of Coffee Road, west of Calhoun Road South side of Greenfield Avenue, east of Ridgeway Road 2'-5' 5'-10' flat to U Bottom erosion 2'-5' 5'-10' V - U Bottom and side erosion, sparse/dry vegetation 2'-5' 5'-10' flat to U Bottom erosion Bottom and side erosion, sedimentation, trash 2'-5' 5'-10' flat to V accumulation Bottom and side erosion, sedimentation, trash 2'-5' 5'-10' flat to V accumulation, standing water 2'-5' 5'-10' V - U Bottom erosion and trash accumulation 2'-5' 5'-10' V - U Bottom erosion 1'-2 5'-10' V - U Bottom erosion 2'-5' 5'-10' V - U Bottom and side erosion, sedimentation, trash accumulation, sparse vegetation 1'-2' 5'-10' V Bottom erosion, standing water AB tbl 7-4.xls
101 Table 7-4: Summary of Drainage Ditch Problem Areas Subwatershed Section Location Depth Width Shape Identified Problem East side of Calhoun Road, north of Poplar Creek 2'-5' 5'-10' flat to V Bottom erosion Observation Road Poplar Creek 14 West side of Spruce Road at Crimson Lane 2'-5' 5'-10' to be determined Poplar Creek 16,21 Woelfel Road, south of Coffee Road 2'-5' 5'-10' V Bottom and side erosion, sedimentation Tess Corners Creek 25,26 East side of Sunny Slope Road, north and south of Grange Avenue 2'-5' 5'-10' Area is under construction, erosion Underwood Creek 1 West side of Sunny Slope Road, south of Bottom erosion, sedimentation, standing water, 2'-5' 5'-10' U Gatewood Drive trash accumulation Underwood Creek 2 South side of Greenfield Avenue, at Woodside Drive 2'-5' 5'-10' V Bottom and side erosion, standing water Underwood Creek 1 South side of Greenfield Avenue, east of Parkview Avenue 2'-5' 5'-10' U Bottom erosion, trash accumulation Upper Root River 1 West side of Old Oak Lane at Park Avenue 2'-5' 5'-10' V - U Bottom and side erosion, standing water Upper Root River 12 South Side of Cardinal Parkway at Sunny Slope Road 2'-5' 5'-10' V - U Bottom erosion, sedimentation, standing water Upper Root River 14 East side of Glen Park Road, North of Butternut 2'-5' 5'-10' to be determined Upper Root River 13 West side of 124th Street, north of Wilbur Drive 2'-5' 5'-10' flat to V Bottom erosion, sedimentation Upper Root River 13 North side of Howard Avenue, east of Sunny Ridge 2'-5' 5'-10' flat to V Bottom and side erosion, trash accumulation Upper Root River 2 South side of Park Avenue, west of Sunny Slope Road 1'-2' 5'-10' V - U Bottom Erosion Upper Root River 1 South side of Honey Lane, east of Sunny Slope Road 1'-2' 5'-10' V - U Bottom Erosion Upper Root 1 Upper Root River 24 West side of 124th Street, south of Graham Street North side of Beloit Road, east of Armor Avenue 2'-5' 5'-10' V Bottom and side erosion, sedimentation, sparse and uprooted vegetation, trash accumulation 2'-5' 5'-10' flat to U Bottom erosion, trash accumulation AB tbl 7-4.xls
102 Table 7-5: Summary of Stream Reaches with the Most Significant Streambank Stability Concerns Subwatershed and Stream Reach Designation Reach Length (miles) Location Overall Stream Rating Streambank Stability Concern Upper Root River - A Designation 0.1 Tributary to Root River from point 0.2 mile east of New Berlin Hills Golf Course property line northeast 0.1 mile Poor Poor landform slope cutting; fair mass wasting, debris jam potential, and vegetative bank protection Upper Root River - C Designation Upper Root River-A Designation Tributary to Root River from pond north 0.1 mile to point extending south of Dakota St. and east of 134th St. Tributary to Root River from point 0.1 mile west of New Berlin Hills Golf Course property line east to New Berlin Hills Golf Course property line Poor Fair Poor landform slope and vegetative bank protection; fair mass wasting, debris jam potential, obstructions, cutting, and deposition Fair landform slope, debris jam potential, vegetative bank protection, obstructions, cutting, and deposition Tess Corners Creek - A Designation 0.1 Tributary to Root River from College Ave. north 0.1 mile Fair Poor debris jam potential, vegetative bank protection, and obstructions; fair cutting Upper Root River - B Designation 0.1 Tributary to Root River from point 0.4 mile east of Sunny Slope Rd. southeast 0.1 mile Fair Poor landform slope; fair cutting and deposition Upper Root River - A Designation 0.1 Tributary to Root River from point 0.3 mile east of New Berlin Hills Golf Course property line north 0.1 mile Fair Poor landform slope; fair mass wasting, debris jam potential, and vegetative bank protection Poplar Creek 0.8 From Cleveland Ave. south to corner of Calhoun Rd. and Victor Rd. Fair Poor obstructions; poor/fair debris jam potential and vegetative bank protection; fair channel capacity, cutting, and deposition Upper Root River - A Designation 0.1 Tributary to Root River from point 0.1 mile east of New Berlin Hills Golf Course property line east 0.1 mile Fair Poor mass wasting; fair landform slope and debris jam potential Tess Corners Creek - A Designation 0.1 Tributary to Root River between Grange Ave. and College Ave. Fair Fair vegetative bank protection, cutting, and deposition Calhoun Creek - B Designation 0.2 Tributary to Calhoun Creek from point 0.2 mile south of Beloit Rd. southwest 0.2 mile to pond in Calhoun Park Fair Fair debris jam potential, obstructions, cutting, and deposition Underwood Creek - A Designation 1.0 Tributary to Underwood Creek from corner of Meadow Ln. and Sunny Slope Rd. east to storm sewer under Meadow Ln. Fair Poor/fair cutting; fair landform slope, debris jam potential, vegetative bank protection, and deposition Upper Root River - D Designation 0.1 Tributary to Root River from point extending southwest of Manitoba Ave. north 0.1 mile Fair Fair landform slope, mass wasting, vegetative bank protection, and cutting Upper Root River - G Designation 0.1 Tributary to Root River from point extending northeast of White Ct. southeast 0.1 mile to corner of Howard Ave. and 128th St. Fair Fair debris jam potential, vegetative bank protection, and cutting AB 7-5.xls page 1 of 4 1/22/2010
103 Table 7-5: Summary of Stream Reaches with the Most Significant Streambank Stability Concerns Subwatershed and Stream Reach Designation Reach Length (miles) Location Overall Stream Rating Streambank Stability Concern Upper Root River - C Designation 0.2 Tributary to Root River form point extending south of Dakota St. and east of 134th St. northeast to 133rd St. Fair Poor vegetative bank protection; poor/fair landform slope and cutting; fair mass wasting Poplar Creek - F Designation 0.6 Tributary to Poplar Creek from Cleveland Ave. northwest to junction with Poplar Creek Fair Poor/fair debris jam potential; fair landform slope, vegetative bank protection, obstructions, and cutting Deer Creek 0.2 From point south of 162nd St. east 0.6 mile to point between Glendale Dr. and Cleveland Ave. Fair Fair landform slope, mass wasting. cutting, and deposition URR-A Designation 0.3 Tributary to Root River from point 0.2 mile west of 124th St. in New Berlin Hills Golf Course east 0.3 mile Fair Fair landform slope, debris jam potential, obstructions, and deposition Deer Creek Designation 0.1 From Cleveland Ave. south 0.1 mile Fair Poor landform slope; fair debris jam potential and obstructions URR-A Designation 0.2 Tributary to Root River from Meadowlark Dr. east to point 0.1 mile west of New Berlin Hills Golf Course Fair Fair debris jam potential, vegetative bank protection, cutting, and deposition URR-D Designation 0.5 Tributary to Root River from point extending west of Ohio Dr. east to Highpointe Dr. Fair Fair obstructions, cutting, and deposition Poplar Creek Designation 1.3 From junction with tributary UF-E southeast 1.3 miles Fair Fair debris jam potential, vegetative bank protection, cutting, and deposition CC-B Designation 0.5 Tributary to Calhoun Creek from I-43 south to Westridge Dr. Fair Fair debris jam potential and vegetative bank protection Deer Creek Designation 0.6 From National Ave. northwest 0.6 mile Fair Poor obstructions; fair landform slope, debris jam potential, cutting, and deposition Deer Creek Designation 0.2 From junction with tributary DC-C north 0.2 mile Fair Poor obstructions; fair landform slope and cutting CC-B Designation 0.7 Tributary to Calhoun Creek from I-43 northwest 0.7 mile Fair Fair debris jam potential, vegetative bank protection, obstructions, and deposition CC-C Designation 0.3 Tributary to Calhoun Creek from I-43 north to point extending east of Dale Dr. Fair Fair landform slope and debris jam potential AB 7-5.xls page 2 of 4 1/22/2010
104 Table 7-5: Summary of Stream Reaches with the Most Significant Streambank Stability Concerns Subwatershed and Stream Reach Designation Reach Length (miles) Location Overall Stream Rating Streambank Stability Concern UF-A Designation 1.4 Tributary to Poplar Creek from Cleveland Ave. north 1.4 miles Fair Poor vegetative bank protection; fair landform slope, debris jam potential, obstructions, cutting, and deposition Poplar Creek Designation 0.1 From Calhoun Rd. west 0.1 mile Fair Fair landform slope and cutting CC-B Designation 0.1 Tributary to Calhoun Creek from Beloit Rd. northeast 0.1 mile Fair Fair debris jam potential and vegetative bank protection CC-H Designation 0.4 Tributary to Calhoun Creek from Linnie Lac southwest 0.4 mile to point extending north of College Ave. Fair Fair vegetative bank protection and obstructions URR-B Designation 0.3 Tributary to Root River from point extending north of Tammy Ln. east 0.3 mile to point 0.1 mile east of Sunny Slope Rd. Fair Fair vegetative bank protection and depostion Poplar Creek Designation 0.7 From junction with tributary UF-L northeast 0.7 mile Fair Poor debris jam potential; fair obstructions and cutting URR-D Designation 0.1 Tributary to Root River from beginning near Long Acre Dr. east 0.1 mile Fair Fair deposition URR-E Designation 0.2 Tributary to Root River from 132nd St. east 0.2 mile Fair Fair landform slope, vegetative bank protection, and cutting CC-A Designation 1.0 Tributary to Calhoun Creek from junction with CC-B and CC-C north 1.0 mile Fair Fair landform slope, debris jam potential, and vegetative bank protection CC-C Designation 0.2 Tributary to Calhoun Creek from Bener Rd. southwest 0.2 mile Fair Fair landorm slope CC-G Designation 0.1 Tributary to Calhoun Creek from junction with CC-H northwest to I-43 Fair Fair vegetative bank protection UF-F Designation 0.2 Tributary to Poplar Creek from Willow Rd. northwest to New Berlin West High School Fair Fair debris jam potential and vegetative bank protection UF-H Designation 0.2 Tributary to Poplar Creek from junction with UF-L east 0.2 mile Fair Fair vegetative bank protection AB 7-5.xls page 3 of 4 1/22/2010
105 Table 7-5: Summary of Stream Reaches with the Most Significant Streambank Stability Concerns Subwatershed and Stream Reach Designation Reach Length (miles) Location Overall Stream Rating Streambank Stability Concern URR-F Designation 0.2 Tributary to Root River from Cleveland Rd. north 0.2 mile to beginning of concrete lining on northern wall of creek Fair Fair vegetative bank protection URR-F Designation 0.1 Tributary to Root River from Cleveland Rd. southwest to 128th St. Fair Fair vegetative bank protection Deer Creek Designation 0.1 From point 0.1 mile north of Glendale Rd. north 0.1 mile Fair Fair landform slope, cutting, and deposition URR-D Designation 0.1 Tributary to Root River from point extending between National Ave. and Cleveland Ave. north 0.1 mile to point extending west of Montana Ave. Fair Fair landform slope, vegetative bank protection, obstructions, and cutting AB 7-5.xls page 4 of 4 1/22/2010
106 Section 7 Problem Area Identification and prioritized streambank reaches which require stabilization measures. Based on the inventory, each reach was classified as excellent, good, fair or poor. Only the streams classified as fair and poor are identified as potential problem areas that will be addressed in the Storm Water Management Master Plan for New Berlin. The streambank inventory identified about 13.4 miles of streambank which were classified as fair and 0.2 miles of streambank which were classified as poor. The streambank problem areas are described in Table 7-5 and shown on Plate 1 in Appendix A. 7.6 Water Quality Problems The water quality analysis, described in Section 6, was conducted to estimate the amount of pollutants discharged to the major streams within New Berlin. Based on the annual pollutant loadings generated by the analysis, critical land uses, land uses which contribute a majority of the storm water pollutants, were identified. The critical land uses are presented in Table 7-6. Table 7-6: Critical Land Uses in New Berlin by Pollutant Pollutant Critical Land Use (% of total annual load) Existing Land Use Conditions Sediment Agriculture (30%); Extractive (21%); Residential (19%) Phosphorous Agricultural (47%); Residential (14%); Park (10%); Institutional (9%) Lead Highway/Arterial (35%); Commercial (24%); Residential (20%); Industrial (16%) Copper Residential (37%); Highway/Arterial (18%); Commercial (15%); Industrial (15%) Zinc Industrial (43%); Commercial (16%); Highway/Arterial (15%) Future Land Use Conditions Residential (28%); Extractive (24%); Agricultural (14%) Agriculture (21%); Park (25%); Residential (22%) Highway/Arterial (26%); Commercial (26%); Industrial (23%); Residential (21%) Residential (40%); Industrial (21%) Commercial (16%); Highway/Arterial (14%) Industrial (50%); Commercial (15%); Based on an overall consideration of the pollutant loadings, areas which are significant contributors of pollutants within New Berlin are identified and presented on Table 7-7. AB 7-7
107 Section 7 Problem Area Identification Table 7-7: Significant Storm Water Pollutant Contributor Areas Area Contributing Land Use Pollutants of Concern Critical Land Use Areas throughout the City of New Berlin - Industrial areas - Agricultural areas - Residential - Highways and Arterials - Developing and redeveloping areas Various Rock Freeway Highway Metals Industrial Park 6C010 - Northwest area of Poplar Creek Subwatershed 5A020 - Southeast area of Tess Corners Creek Subwatershed 4C010 - Northern area of Calhoun Creek Subwatershed 7D010 & Various - Northern area of Mill Creek Subwatershed Industrial Commercial Industrial Extractive Agricultural Agricultural Commercial Residential Highway Agricultural Extractive Metals Metals Phosphorous Sediment Sediment Phosphorous Metals Metals Phosphorous Sediment Sediment The industrial analysis, described in Section 6, further evaluated the pollutant loadings from industries within New Berlin. Based on the analysis, the industries with the greatest potential for contributing significant storm water pollutant loadings are summarized in Table 7-8. Extractive industries are included in the listing based on the study area analysis. AB 7-8
108 Table 7-8: Summary of Industries Considered Potential Significant Contributors of Storm Water Pollutants Industrial Category Fabricated Metal Products Activity Areas of Concern < Metal Preparation < Parts Cleaning < Surface Treatment < Galvanizing < Heavy Equipment Use and Storage < Equipment Maintenance < Storage of Uncoated Structural Steel < Painting < Storing Galvanized Steel directly on the Ground < Vehicle/Equipment Traffic < Cleaning Equipment and Vehicles < Storage Areas < Equipment Usage < Above Ground Storage Tanks Transportation Equipment < Outdoor Material Loading / Unloading < Outdoor Material and Equipment Storage Land Transportation < Vehicle and Equipment Maintenance < Outdoor Vehicle and Equipment Storage and Parking < Vehicle and Equipment Washing Areas < Painting Areas < Liquid Storage < Cold Weather Activities < Improper Connections to Storm Sewer Electronic, Electrical, Photographic and Optical < Outdoor Loading / Unloading < Outdoor Materials Storage Printing and Publishing Mineral Mining and Processing (extractive) < Plate Preparation < Printing < Stencil Preparation for Screen Printing < Site Preparation < Mineral Extraction < Mineral Processing < Clean Up < Material Handling: transfer, storage, and disposal < Photo Processing < Equipment and Vehicle Maintenance < Reclamation Activities Source: USEPA Final National Pollutant Discharge Elimination System Storm Water Multi Sector General Permit for industrial Activities, Notice: Federal Register, September 29, 1995 AB 7-9
109 Section 8 Storm Water Management Options 8.1 Introduction Development of an effective and efficient Storm Water Management Master Plan for the City of New Berlin requires consideration of practices related to flood control and water quality protection which mitigate the storm water drainage problem areas and improve the water quality. General storm water management alternative approaches include: Structural and non-structural measures Multi-purpose regional and site specific strategies Opportunities to integrate features that provide both water quantity and water quality benefits The storm water management approaches utilize storm water management measures which may include: Wet detention basins/ponds - designed to reduce peak runoff flows and provide sedimentation. Wet ponds have a permanent pool, usually with a minimum depth of three to five feet, and an outlet structure. The permanent pool prevents re-suspension of accumulated sediments and provides conditions that enhance biochemical degradation and removal of pollutants. When properly designed, constructed, and maintained, wet detention ponds can retain a large portion of the in flowing pollutants. Wet ponds can be designed to provide either onsite detention or regional detention. Regional detention facilities provide benefits for large areas, thereby reducing the need for numerous onsite controls. A typical wet detention pond/basin is shown on Figure 8-1. Dry detention basins - designed primarily for flood control. Dry basins impound water only during and immediately after runoff-producing storm events. Because the basins are designed to drain completely following storms, only minor sedimentation occurs, providing minimal water quality benefit. A typical dry detention basin is shown on Figure 8-2. Extended detention basins - detain a portion of the storm water runoff for up to 24 hours or more after a storm by limiting the capacity of the outlet structure, thereby reducing peak runoff flows. Extended detention allows sedimentation to occur. The basins generally do not have a permanent pool and can by dry between storm events. Infiltration systems - reduce storm water runoff volumes and rates and provide pollutant load reductions by allowing storm water to infiltrate into the soil. Some pollutants are removed from the percolating water by adhering to soil particles. Microorganisms that are naturally present in the soil biochemically break down and AB 8-1
110 Section 8 Storm Water Management Options remove some of the attached pollutants, and also feed on some of the dissolved pollutants. Types of infiltration systems include seepage pits and beds, trenches, porous pavement, and channels and vegetated swales with permeable beds. Pretreatment systems, such as grit chambers or detention ponds, are often used to prevent clogging of the infiltration bed. In some locations, the use of infiltration systems may require the installation of monitoring wells to ensure that contamination of groundwater does not occur. Filtration systems - provide pollutant load reductions by filtering storm water runoff through media, typically sand or peat. The filter systems typically include a sedimentation area to retain the largest particles and a filter chamber that filters and removes soluble constituents. Filtration systems are typically constructed underground which minimizes land use requirements. Grassed swales - reduce storm water runoff volume by allowing infiltration into the soil, and reduce storm water pollutant loads by filtering through vegetation. Vegetation traps sediments and utilizes nutrients, while microorganisms in the soil biochemically remove dissolved pollutants. The sediments trapped by vegetation are not as easily re-suspended during subsequent storm water runoff events as sediments accumulated in storm sewers, which are readily flushed out during later storms. Constructed or retrofit wetlands - stabilize storm water runoff and flood flows and remove sediment and nutrients from surface water runoff. The wetland configuration slows runoff volume and provides storage opportunity. The wetland vegetation traps sediment and utilizes nutrients to reduce pollutant loadings. Engineered storm water drainage facilities - efficiently and effectively convey storm water runoff to receiving waters. Engineered facilities include storm sewers, culverts, constructed channels, catch basins, and manholes. Where flooding or drainage problems occur, these facilities can sometimes be upgraded to provide additional capacity to resolve the problems. Streambank erosion controls - prevent channel degradation, reduce sediment transport and deposition, maintain channel capacity, and enhance water quality. Both structural (i.e., riprap) and vegetative controls may be used. Vegetative bank stabilization measures can enhance aquatic habitats and provide a natural appearance to the channel. Buffer easements - vegetated zones adjacent to waterways or other environmentally sensitive features that serve to filter out pollutants in overland flow. The easements can also help stabilize streambanks, provide wildlife habitat, and offer stream shading. Best Management Practices (BMPs) or source controls - include good housekeeping practices, preventive maintenance measure, spill prevention and response procedures, sediment and erosion controls. AB 8-2
111 Typical Wet Detention Pond Runoff 1 4 Wetland Vegetation Uptake 0.75 inches of Runoff Bleed - Down Storage Normal Water Level Overflow Grate Outlet Weir Orifice 4 1 Permanent Pool 1 6 Littoral Zone 1 2 Algae Uptake Solids Settling Adsorption Outlet Pipe Discharge Notes: 1. Runoff is directed to the pond and detained for flood control and treatment by algae and vegetative uptake, solids settling, and adsorption. 2. The first 0.75 inches of runoff is typically detained above a permanent pool (with no more than half discharged in the first 24 hours) for water quality treatment. Figure 8-1
112 Typical Dry Detention Basin Runoff Outlet Structure Runoff Existing Grade 1 4 Grassed 4 1 Existing Grade Infiltration 1to 3 ft Infiltration Seasonal High Water Table Notes: 1. Runoff is directed to the pond and detained for 6 to 24 hours before discharge to downstream. 2. The first 0.5 to 1.0 inches of runoff is typically detained for treatment and attenuation. 3. Infiltration and evapotranspiration provide for recovery of storage (6 to 24 hours for treatment volume). 4. Sideslopes should be no steeper than 4 horizontal to 1 vertical. Figure 8-2
113 Section 8 Storm Water Management Options Inlet filters - typically consist of a frame with a screen filter or other filtration or absorbent media placed into a storm sewer inlet or catch basin. Storm water draining to the inlet passes through the filter, which traps sediment, floatable substances, and other pollutants, such as metals, associated with sediments. Pavement cleaning - with mechanical or vacuum sweepers, removes sediments and associated pollutants from streets and parking lots. The effectiveness of sweeping can be improved by sweeping more frequently or by using improved sweeping techniques or equipment. Catch basin cleaning - is an effective measure to remove accumulated deposits from catch basins and manholes. Frequent cleaning of the catch basins facilitates the trapping of additional sediments and prevents the scouring and re-suspension of accumulated sediments during subsequent storm events. Public information and education programs - can increase the public=s knowledge and understanding of storm water management, change people=s attitudes and actions, and generate support for the implementation of the plan. Examples of public education programs include informational materials, posters, public announcements, press releases, presentations, workshops, video presentations on cable television, direct mailings, and personal contacts. Water quality monitoring - may include the sampling and analysis of storm water or receiving waters, dry weather testing for non-storm water discharges, bottom sediment testing, biological assessments, and inspection of potential pollution sources and management measures. These monitoring programs may be designed to clarify existing water quality conditions, identify newly developing problems, monitor the implementation of the plan, and evaluate the effectiveness of the controls. Urban land development guidelines - assist municipalities, residents, and developers in minimizing the adverse environmental impacts of urban development, while providing for safe and efficient urban services. These guidelines help prevent the creation of new storm water problems or the exacerbation of existing storm water problems. These guidelines may include: Establishing site grading requirements and zoning restrictions Requiring buffer zones or green spaces along streams Building setbacks distances from streams Defining allowable peak rates and volumes of discharge Protecting wetlands and other sensitive areas Providing water quality improvement AB 8-5
114 Section 8 Storm Water Management Options Implement operations and maintenance activities 8.2 Storm Water Drainage and Flood Control Options Options related to storm water drainage and flood control are typically either detention/storage measures or hydraulic system improvement measures. Detention/storage measures include wet and dry detention ponds and extended detention basins where storm water runoff is collected and detained in a storage area and released slowly during and after the storm event. Detention/storage measures reduce peak runoff flows which reduce the required capacity of the downstream hydraulic system. Hydraulic system improvements focus on system modifications to improve conveyance capacity such as channel widening, channel clearing and culvert improvements. An effective storm water management plan requires the selection of the most appropriate option to address each identified drainage or flooding problem. Storm water problem areas were identified based on field investigation, review of citizen complaint records, and computer modeling. This study focuses on storm water problem areas within the primary storm water management system. Basement back up due to overloading of the sanitary sewer, and localized flooding, sideyard or backyard flooding in areas not part of the primary drainage system, are not evaluated as part of this plan and are not considered in the major flooding areas identified Storm Water Drainage and Flooding Option Criteria Design criteria for storm water flood control solutions are established based on the storm water management goals and objectives identified in Section 2 of this report. These criteria include: New facilities will provide protection against structure flooding and road overtopping in the 100-year recurrence interval storm event. Channels, bridges and culverts in the major storm system should be designed to accommodate runoff from the 100-year recurrence interval storm event. Storm sewers and roadside ditches in the minor storm system should be designed to accommodate runoff from a 10-year recurrence interval storm event. Emergency spillways for detention basins should be established to safely convey flow during a 100-year recurrence interval storm event Storm Water Flooding Options Eight primary system storm water flooding problem areas were identified in Section 7 based on: Review of citizen complaint records: citizen complaint logs from the March and August 1998 storm event, as well as other storms, were reviewed and mapped AB 8-6
115 Section 8 Storm Water Management Options Potential for damage: flooding areas which threaten homes or other structures History of the severity of the flooding problem: based on the knowledge of the City of New Berlin Staff The flooding areas and storm water management options considered for each primary storm water flooding area are summarized in Table 8-1 and are discussed in the following paragraphs. Problem UNDERWOOD1: Underwood Creek at Meadow Lane Description: Along Meadow Lane between 128th and 124th Street, the South Branch of Underwood Creek is enclosed in a rectangular storm sewer that is 9 feet wide by 4 feet high initially, and ultimately is 14 feet wide at 124th Street. There are numerous reports of house, yard and street flooding associated with this enclosed channel. The causes of these problems include the following: < Analysis of the culvert entrance using the computer model indicates the storm sewer is undersized for the 100-year storm flow. This deficiency results in overtopping of the storm sewer entrance and backwater upstream toward Elm Grove Road. < Citizens have reported that debris accumulates at the storm sewer entrance during major storm events. Debris can further reduce the culvert entrance capacity and worsen the backwater and overflow problem. < The outlet of the storm sewer in Greenfield Golf Course is restricted by growth of trees and shrubs in the channel overbanks and accumulated sediment. < Reported yard and street flooding between 124th and 128th Streets is due to restricted surface inlet capacity and lack of a sufficient positive drainage path toward and across 124th Street. This problem is made worse by poor channel maintenance and the presence of fences, sheds, and other obstructions in the channel upstream of the inlet. < There is no well defined flow path over 124th Street to carry excess flows when the storm sewer is full. Options: Assuming that buyouts and floodproofing are not acceptable in this area, there are two basic options to solve this flooding problem: reduce the flow of the storm sewer entrance with upstream detention storage or increase the conveyance capacity of the box. Storage will be considered in conjunction with problem UNDERWOOD2a. Like all storage retrofits, it is an extremely expensive solution but would provide significant, reliable flood relief. The capacity shortfall could be addressed partly by improving the entrance to the storm sewer on the AB 8-7
116 Table 8-1: Summary of Flooding Problem Options Problem Number Problem Description Alternative Solution Level of Protection Estimated 100 Year 25 Year 10 Year Construction Cost UNDERWOOD 1 UNDERWOOD 2a UNDERWOOD 2b ROOT 1 ROOT 2 ROOT 3 ROOT 4 DEER 1 Along Meadow Lane between 128th and 124th St., the South Branch of Underwood Creek is enclosed in a storm sewer. Overflow of box culvert entrance at 124th St. and Meadow Lane floods basements and backyards. There are numerous reports of house, yard, and street flooding associated with this enclosed channel. Overbank flooding of yards and homes along the South Branch of Underwood Creek beginning about 500 feet upstream of Arcadian Drive. Flooding southwest of the intersection of Elm Grove and Meadow Lane. Yard, street, and basement flooding in the Gatewood Park neighborhood. One residence experiences flooding along Park Ave near Elm Grove Rd. Yard flooding and erosion in backyards on north side of Park Ave. 15 Homes are within the floodplain in the area bounded by Cleveland Ave., National Ave., 24th St., and 132nd St. Road flooding on Lagoon Rd. north of Cleveland Ave. Washout of private bridge at 128th St. and Cleveland Ave. House flooding upstream of Grange Ave. near Francis Ave. Yard flooding and erosion near Honey Lane and Elm Grove Road. Flooding of 1 residence and several yards east of the intersection at Elm Grove and Honey Lane. 6 residences experience structural flooding along 168th Street in the Buena Park neighborhood south of Greenfield Ave. The flooding is caused by inadequate drainage. Sump pumps discharge to the drainage ditch and lawn clippings and yard waste contribute to culvert blockage. A. Reduce flow with upstream detention storage/increase conveyance capacity of entrance. Upstream storage provided by UNDERWOOD 2a solution. $50,000 - $100,000* X B. Construct added storm sewer capacity. X Not Calculated** A. Floodplain Lowering between Sunny Slope Road and Arcadian Drive. X $1,480,000 B. Storage Facility north of Greenfield Avenue in the City of Brookfield. (significant land acquisition cost may be required) X $790,000 A. Additional 60-inch storm sewer to serve Gatewood Park. X $400,000 A. Installation of new culvert at Graham St. and channel expansion between Graham St. and Elm Grove Rd. X $101,000 A. Online detention storage at four locations and floodplain lowering. B. Buyout 15 residences within floodplain. X $2,500,000 X $2,940,000 A. Replace culverts at St. Mary's Dr. and lower floodplain south of Grange Ave. X $350,000 A. Re-grade roadside ditches and railroad ditches. A. Construct new storm sewer/pump station X $30,000 X Not Calculated** B. Reconstruct ditches with some segments of storm sewer from Fullerton to Roosevelt. Redirect sump pumps to discharge to lawns. Maintain clean culverts and ditches X $180,000 C. Floodplain storage / pump station in Buena Park X Not Calculated** Notes: * requires implementation of UNDERWOOD 2 solution. ** Options containing multi-million dollar solutions were not calculated. Cost estimates do not include environmental impacts (I.e. contaminated soil), legal, financing, or land acquisition costs. AB tbl8-1.xlsalternative 1/22/2010
117 Section 8 Storm Water Management Options north side of Meadow Lane near 128th Street. Proposed improvements would include a sloped trash rack that is less susceptible to debris clogging. Also, a program of improved maintenance would be beneficial. Initially the interior of the storm sewer should be inspected to determine the extent of accumulated sediment within the storm sewer and immediately downstream in West Allis. Then the cost of restoring the full capacity of the storm sewer could be determined. The entrance improvements and removal of obstructions would cost $50,000 to $100,000 depending on the amount of debris that has made its way deep into the storm sewer. There would be additional operation and maintenance costs to clean the entrance after storms. It would also be possible to construct additional storm sewer capacity. However, this would be very expensive and difficult to permit because it would increase flows downstream. Problem UNDERWOOD2a: Underwood Creek near Elm Grove Road Description: This problem involves overbank flooding of yards and homes along a reach of the South Branch of Underwood Creek beginning about 500 feet upstream of Arcadian Drive. The primary cause of the problem is that the properties are in or very close to the 100-year floodplain in this area. Limited capacity of the Arcadian Drive and Elm Grove Road culverts also contributes to this problem. Options: The available options to solve this problem include upstream storage, conveyance improvements, or floodproofing. Conveyance improvements in this area will increase the flow downstream at this location. Increased flows would likely increase the flooding potential in the area of Meadow Lane and 128th Street. Two storage solutions were investigated. The first involves channel widening and floodplain lowering between Sunny Slope Road and 300 feet upstream of Arcadian Drive. This in-channel storage solution would provide approximately 50 acre feet of storage and would lower water levels by approximately 1.5 feet at Elm Grove Road. The estimated cost of constructing this channel storage is $1,480,000. A more effective storage approach would be to construct an offline storage basin to control flows. The only available location where there is existing open land to construct a basin is north of Greenfield Avenue in the City of Brookfield. A basin covering approximately 5 acres could be constructed to hold 30 acre-feet of storage. When completed, this basin would reduce flows in the South Branch of Underwood Creek by approximately 100 cubic feet per second (cfs). This reduction would solve the flooding problems at Elm Grove Road and Meadow Lane and could be used to address drainage problems in the Gatewood AB 8-8
118 Section 8 Storm Water Management Options Park neighborhood. The basin would cost approximately $650,000 to build plus the cost of acquiring the site which is estimated at $600,000 for the purpose of comparison in this plan. In addition, $140,000 in storm sewer improvements would be needed to divert flows into the basin. Problem UNDERWOOD2b: Gatewood Park Description: There are problems with yard, street, and basement flooding in this neighborhood located southwest of the intersection of Greenfield and Sunny Slope Roads. The neighborhood is drained by roadside ditches that flow north to a main drainage way along Greenfield Road. The problems are caused by a combination of factors. The neighborhood area is quite flat. Thus, there is widespread flooding when the ditches overflow. The lack of topographical relief also reduces the capacity of the ditches. However, roadside ditches are minor storm water drainage system components and the problem in Gatewood Park is an inadequate primary system. The system outlet at Sunny Slope Road is inadequate and there is insufficient capacity in the conveyance system to provide for runoff from Highland Cemetery west of the area. Options: There are limited options available to solve the problems in Gatewood Park. There are no storage site available and the alternative to storage is a high capacity storm sewer system. Retrofitting the area with storm sewers would cost $1.0 to $2.0 million depending on whether a partial of full system is constructed. The level of service could be improved by increasing the capacity for conveying flow across Sunny Slope Road. The current outlet is a 60-inch storm sewer which serves Gatewood Park, Greenfield Avenue, and a 128-acre area north of Greenfield Avenue in Brookfield. This storm sewer provides approximately 80 cfs capacity while the 100-year flow from Gatewood Park and Greenfield Avenue is 196 cfs and the flow from Brookfield is 101 cfs. An additional 60-inch outlet and storm sewer serving Gatewood Park would cost about $400,000 to construct. This project would increase flows in the South Branch of Underwood Creek downstream of Sunny Slope Road. Therefore, it should be constructed in conjunction with one of the storage projects recommended for problem UNDERWOOD2a or appropriate easements should be obtained to compensated for the downstream flow increases. Problem area ROOT1: 130th Block of Park Avenue Description: One residence experiences flooding along Park Avenue due to inadequately sized downstream culvert at Graham Street. Also, inadequate drainage ditch capacity exists between Elm Grove Road and Honey Lane south to the golf course. AB 8-9
119 Section 8 Storm Water Management Options Options: The capacity of the Graham Street culvert will be increased by installing 36 inch culvert to eliminate backwater effects. To mitigate potential increases in flow, 2,000 feet of channel between Graham Street and Elm Grove Road will be expanded. The expansion of the channel provides 5.4 acre-feet of storage to offset the increased flow at Graham Street. The estimated cost of this option is $101,000. Problem ROOT2: 132nd Street to Lagoon Road along Cleveland Avenue Description: Approximately 15 homes are within the floodplain in the area bounded by Cleveland Avenue, National Avenue, 124th Street, and 132nd Street. The inlet and outlet configuration of the culverts are not parallel to the stream at the eastern Lagoon Road culverts and Cleveland Avenue. Road flooding occurs on Lagoon Road north of Cleveland Avenue. A Private bridge at 128th Street and Cleveland Avenue has been washed out. Options: The first option is construction of online detention storage at four locations. The first will be in a low-lying area at the southwest corner of Cleveland Avenue and 131st Street extended. The other locations are the southeast corner of 128th Street and Cleveland Avenue, south of National Avenue approximately at 130th Street extended, and floodplain lowering along a 100-foot buffer on the east side of the stream southwest of 124th Street and Cleveland Avenue. These sites provide a total of 20 acre feet of storage. The estimated cost of the proposed storage facilities is $2,500,000. A second option requires the buyout of the fifteen residences in the floodplain between Lagoon Road and 130th Street along Cleveland Avenue. The estimated cost of these buyouts is $2,940,000. Problem ROOT3: LaSalle Drive and Grange Avenue Description: A structure located adjacent to a tributary of the Upper Root River near Grange Avenue experiences flooding. The problem is caused by inadequate culvert capacity downstream at St. Mary s Drive. Options: The twin 3-foot by 11-foot concrete box culverts at St. Mary s Drive are more than half filled with accumulated sediment. The resulting reduced capacity is the cause of this problem. Removing the sediment is a short term solution. However, the problem would likely recur due to the geometry of the existing culverts. These culverts are too wide for the channel in which they are located. Thus, sediment tends to accumulate in the under-used part of the overall width. The permanent solution will be to replace these culverts with taller, AB 8-10
120 Section 8 Storm Water Management Options narrower pipes and raise the road to accommodate them. The culverts need to be equivalent to three 60-inch diameter culverts. The estimated construction cost of the culverts is $120,000. This construction cost does not include road improvements necessary to accommodate the culverts. To mitigate potential flow increases caused by the added conveyance capacity, the floodplain will be lowered south of Grange Avenue extending south to near Upper Kelly Lake. The total estimated cost for this option is $350,000. Problem ROOT4: Honey Lane Description: Yard flooding and erosion are experienced by several residences along a tributary to the Upper Root River and also drainage problems along the railroad tracks north of Honey Lane near Elm Grove Road. The problem is caused by inadequate culverts and channel capacity. Options: Currently, patches of low-lying areas along the tracks accumulate water resulting in the flooding of yards of neighboring properties. The ditches along the southern boundaries of the Union Pacific Railroad require spot re-grading from Woodshire Drive to 124th Street. Ditch re-grading is also proposed north from Ferguson Road and along the west side of Old Oak Lane to the south side of Park Avenue extending to Sunny Slope Road. Additional re-grading should extend north of Old Oak Lane to the north side of Honey Lane and then to Sunny Slope Road. The total length of ditch regrading is 3,000 feet. The estimated cost of this option is $30,000. Problem DEER1: Buena Park Description: Options: Six residences experience structural flooding along 168th Street in the Buena Park Neighborhood south of Greenfield Avenue. Several additional residences experience yard and basement flooding. The problem stems from backup from inadequate culverts, ditch capacity, and lot grading. The general area slope is very flat. In addition, most homes have sump pump discharge into the ditch. Lawn clippings and yard waste contribute to culvert blockage. The Buena Park neighborhood originally developed with insufficient lot grading to accommodate an open channel ditch conveyance system. Many homes have low water entry elevations at or below the top of the roadside ditch. The ditch slope is very flat and cannot be increased. When ditch capacity is met, the runoff potentially floods the homes. Raising homes one to two feet is not a practical solution. Floodproofing homes is also difficult to implement or fund. AB 8-11
121 Section 8 Storm Water Management Options The storm water discharge location for the neighborhood is into the floodplain of Deer Creek at Buena Park. Rainfall events greater than minor storms can be restricted from release into the park and create a backwater effect upstream. Increasing culvert capacity is not a remedial solution in a backwater effected area. Installing a new storm sewer system with associated pump station is not cost effective with pump station. Construction of large floodplain detention in Buena Park is also not cost effective. The most practical solution is to maximize the existing system. Reconstruction of the ditches, including some storm sewer sections, from Fullerton to Roosevelt will help to discharge the water in the drainage ditch. Additionally, all sump pumps should be discharged to the lawn. Home owners should create as much positive drainage away from the house as possible. Ditches should be clear of yard waste and debris. Crushed driveway culverts should be replaced. Buyout of homes in the Deer Creek floodplain may be considered in the future Culvert Capacity Improvements Analysis of the primary and secondary culverts indicates that 32 primary system culverts and 83 secondary culverts have deficient capacity. Culverts identified as deficient in the primary and secondary storm water management systems are listed in Table 7-2 and 7-3, respectively. Some of the culvert deficiencies would be resolved through implementation of the recommended storm water improvements Drainage Ditch Improvements Thirty-two drainage ditch problem areas were identified in Section 7 and listed on Table 7-5. The improvements require maintenance operations for restabilization, clearing of sediment, or collection of debris. Future problems will be identified and resolved through the implementation of the operations and maintenance program Further Study of Minor System Problems Thirteen minor system problems were identified in Section 7. It may not be cost effective to solve minor system problems based on the current level of damages. However, further study of specific areas may be warranted based on staff recommendations at a later date (such as the Parkwood Lane storm sewer capacity). 8.3 Storm Water Quality Options Options related to water quality improvement generally consist of treatment measures or source control measures. Treatment control measures are designed to treat storm water runoff prior to discharge to a receiving stream. Non-structural AB 8-12
122 Section 8 Storm Water Management Options measures generally involve a change in procedure and are designed to reduce the amount of pollutants in the storm water runoff from an area Source Control Options for Storm Water Quality Improvement Source controls considered effective for specific areas in New Berlin are presented on Table 8-2. Options recommended for consideration in the final recommended plan are described below: Industrial Best Management Practices Subchapter 2 of the Wisconsin Administrative Code NR216 regulates industrial storm water dischargers. Industries which are regulated by NR216 are required to identify sources of potential storm water pollution at their facilities and implement best management practices to reduce or eliminate pollutants from the identified sources. The permit issued to industries generally requires the facility to implement the following general types of best management practices: Good housekeeping: practices intended to maintain areas in a clean and orderly manner Preventive maintenance: practice to maintain equipment and systems Spill prevention and response: practices which reduce the potential for a spill to occur and minimize the effect of a spill Sediment and erosion control - practice to reduce sedimentation and erosion Pollutant reductions from the implementation of the industrial storm water regulations are estimated to range from 15 to 20 percent. Individual industries are responsible for the costs related to industrial storm water permit compliance. Based on the industrial analysis specific best management practices are recommended for various industry groups. The suggested industrial best management practices recommended for specific industrial groups are presented in Appendix F. Pavement sweeping New Berlin currently sweeps all of the streets on an annual basis. The effectiveness of a sweeping program pollutant reduction is directly related to the frequency of sweeping between storm events. The frequency of early spring street sweeping is critical because studies have indicated that pollutant AB 8-13
123 Table 8-2: Comparison of Source Control Alternatives Alternative Winter Loading Pollutant Removal Effectiveness Cost Sediment Nutrients Metals Capital Maintenance Comments Recommended for Further Consideration Industrial Best Management Practices o o - o o o Required for most industries for compliance with NR216 Yes Pavement Sweeping + o - + o o Frequency and timing determine effectiveness. Effectiveness is reduced on roadways without curbing. Snow/Ice Management + o o o o - Snow storage locations and deicing techniques Yes Yes Landscaping Practices - o Fertilizer and pesticide management Yes Catch Basin Cleaning o o o o + + Frequency and timing determine effectiveness Yes Erosion Control Ordinance Storm Water Management Ordinance Public Education and Information o o New Berlin has an erosion control ordinance - increase enforcement o + o o - - Draft ordinance includes provisions for water quality improvements for developing lands. o o o o + o Can use existing materials developed by WDNR and the UW-Extension Will help in reduction from residential areas Yes Yes Yes Agricultural Practices o o Includes vegetated Filter strips and barnyard runoff controls Notes: + indicates HIGH Pollutant Removal Effectiveness/ LOW Cost o indicates MODERATE Pollutant Removal Effectiveness/MODERATE Cost - indicates LOW Pollutant Removal Effectiveness/ HIGH Cost Yes AB
124 Section 8 Storm Water Management Options loadings from spring snowmelt can account for one- to two-thirds of the annual pollutant loadings from urban areas. Pavement sweeping options incorporate: #Curbed highways and arterials #Rural cross section roadways (no curbs) #Commercial/Industrial parking lots A comparison of the effectiveness and cost of street sweeping schedules is presented in Table 8-3. The effectiveness of street sweeping on non-curbed streets will be reduced. Table 8-3: Comparison of Street Sweeping Schedules Frequency of Sweeping Estimated Pollutant Reduction (%) Monthly 10 % Seasonal (weekly - April & May, bi-weekly - June through September; monthly October, November & March) 25 % Bi-Weekly 30% Catch basin cleaning Catch basins are designed to collect and temporarily store sediment and debris. Regular cleaning, to remove the collected materials, improves the pollutant removal effectiveness of the catch basins. New Berlin has catch basins within areas of the storm sewer system. Storm sewered areas are limited within the city. A catch basin cleaning schedule of twice per year, once in spring and fall of each year was evaluated. The estimated pollutant reduction for semi-annual catch basin cleaning is 17 percent for sediment and 25 percent for metals. Alternatively catch basins could be inspected quarterly and cleaned when about 40 percent full. Installation of catch basins in developing areas or areas undergoing redevelopment will improve water quality from the drainage area and should be considered. Existing catch basins should be replaced/retrofitted as needed and during construction activities. Landscape Practices Park and institutional land uses contribute about 19 percent of the study area total phosphorous loading. The major source of the phosphorous is landscaping AB 8-14
125 Section 8 Storm Water Management Options practices. Landscaping practices which will reduce the pollutant loading in this area include: converting high maintenance lawn areas into low impact areas planted with ground cover, trees, shrubs, or perennials; test soils and adjust fertilizer applications accordingly; only water landscaped areas in early morning hours; increase average turf height to three inches to improve turf health and reduce weed growth; and consideration of low toxicity weed control. Implementation of these landscaping practices may result in approximately a 10 percent reduction in phosphorous loadings. Snow and Ice Management Parking lots and roadways are plowed to remove snow fall as needed during the winter months. In order to provide a reduction in pollutant loadings from the snow melt, a vegetated filter area should be provided between snow storage areas and receiving streams or storm sewer inlets. Additional snow and ice management practices include: tailoring the application rate of de-icers to the use of the area; training handlers of road salt to improve the efficiency of deicer application and reduce losses; equip trucks with ground-speed sensors; promptly clean-up spills after loading operations; monitor the deicer market for the development of new products and price reduction of existing products; and sweeping accumulated salt and grit from paved areas as soon as practical after the surface clears of snow and ice. Implementation of snow and ice management practices can result in pollutant reductions up to 15 percent of the total annual loading. Erosion Control Ordinance The City of New Berlin currently has an erosion control ordinance which provides adequate authority to control sediment from land disturbing activities. In order to AB 8-15
126 Section 8 Storm Water Management Options improve compliance with the ordinance a vigorous site inspection program should be implemented by the City. The inspections should be conducted by qualified staff to check for proper implementation of erosion control measures during construction. Inspections should be conducted during or after storm events to observed the effectiveness of the measures implemented. Post construction inspections should also be conducted to check for signs of site erosion, as well as to evaluate the downstream impacts of the project. Storm Water Management Ordinance The City of New Berlin draft storm water ordinance which includes provisions for implementation of storm water quality improvements for developing land. New Berlin should adopt and enforce this ordinance to meet the water quality goals described in Section 3 of this Plan. Agricultural Practices Agricultural Best Management Practices including conservation tillage, streambank erosion control, vegetated drainage ways, and barnyard runoff controls should be encouraged in all agricultural areas of New Berlin. Additionally, a shoreland management ordinance which requires maintenance of buffer strips along all perennial and intermittent streams within the City of New Berlin should be established. The pollutant removal effectiveness of buffer strips ranges from 40 to 70 percent. The ordinance should require that the agricultural buffer strips be maintained even if the land is otherwise developed. A model draft ordinance from Ozaukee County Land Conservation Department is in Appendix G. Public Information and Education A public education and information program established to target the general public, city staff, and industries will assist New Berlin in its efforts to implement a storm water management program. An information and education program will increase the public s knowledge and understanding of storm water management, change people s attitudes and actions, and generate support for the implementation of this plan. An education program for the general public should include: storm water management goals, lawn care and landscaping, pet waste handling, and other best management practices. An education and training program for City staff could be developed. Highway maintenance crews, Park and Recreation employees, and construction inspection personnel would all receive training and education about erosion, plant life, soil, AB 8-16
127 Section 8 Storm Water Management Options and storm water. An industrial education program should focus on compliance with the NR216 industrial storm water regulations and improved selection and implementation of best management practices. A public education program may include informational materials, posters, public announcements and press releases, presentations, workshops, video presentations on cable television, direct mailings, and personal contacts. Information for education programs is available from the University of Wisconsin Extension office, Waukesha County Land Conservation Department, and New Berlin School District. The New Berlin School District is currently helping administer a $16,000 matching grant from the Wisconsin Environmental Education Board to educate the public. Additional storm waterrelated curriculum could be developed. Waukesha County Land Conservation Department also has relevant publications and there is public education and equipment available (with training) for water testing at no cost through Retzer Nature Center Treatment Options for Water Quality Improvement Storm water treatment options considered for New Berlin are compared in Table 8-4. Treatment options recommended for consideration in the final recommended plan are described below. Wet detention basin/pond Water quality detention ponds include a forebay and adequate sizing to provide the required conditions for pollutant reduction. Pollutant removal effectiveness by wet detention ponds is estimated to be 90 percent for sediment, 50 percent for phosphorous, and 70 percent for lead. One location where a wet detention basin may be practical is summarized in Table 8-5. The water quality detention basin will reduce pollutants from the drainage area incorporating about 840 acres and will reduce the overall pollutant loading from the City of New Berlin. AB 8-17
128 Table 8-4: Comparison of Stormwater Treatment Alternatives Pollutant Removal Effectiveness Cost Comments Recommended Alternative Winter Loading Sediment Nutrients Metals Capital Maintenance for Further Consideration Wet Detention Pond o o Can be combined with flood control alternatives Yes Extended Detention Basin o o Can be combined with flood control alternatives Yes Constructed/ Retrofit Wetlands Standard Catch Basins - o + o - o Utilize prior converted wetland areas, may be an effective way to create additional habitat and remove pollutants from stormwater, can have flood control benefits o o - o o o Potential for redeveloping areas, replace existing basins as needed Yes Yes In-Line Treatment Systems o + o + - o Vortechnics TM, Stormceptor Tm, Other Yes Inlet Filters o o - o o - Limited flows can be treated, requires routine maintenance, may be effective for industrial yards or parking lots Filter Systems + + o + - o Limited flows can be treated, may be effective for industrial yards or parking lot areas Yes Yes Infiltration Systems Porous Pavement Streambank Stabilization o o Requires sandy soils, potential groundwater contamination o o - o - o Practical for very small areas only Winter maintenance activities may damage pavement, potential use in parking areas not used during winter months o o Vegetative protection, rip rap, channel clearing and cleaning, deposit removal Yes No Yes Grassed Swales o Maintain existing swales Yes Notes: + indicates HIGH Pollutant Removal Effectiveness/ LOW Cost, o indicates MODERATE Pollutant Removal Effectiveness/MODERATE Cost - indicates LOW Pollutant Removal Effectiveness/ HIGH Cost AB
129 Section 8 Storm Water Management Options Table 8-5: Summary of Water Quality Detention Pond Options Area/ Location Existing Annual Pollutant Reduction in detention pond/basin designation Loadings from Drainage Area (Percent of Total Loading) Total Study Area Pollutant Load Basin 2E071 (basin recommended by others as part of the Lake Management Plan for Upper and Lower Kelly Lakes) West of Upper Kelly Lake Sediment tons (2%) Phosphorous lbs. (3%) Lead lbs. (4%) Sediment - 2% Phosphorous - 1.5% Lead - 3% Typical maintenance for a wet detention basin includes routine mowing, debris and litter removal, and erosion control inspection. Non-routine maintenance includes sediment removal and structural repairs. Constructed/Retrofit Wetlands The wetland inventory described in Section 4 of this report identified numerous wetland areas throughout the New Berlin area. Wetlands classified as priorconverted have a very high potential for restoration of wetland features which could result in valuable water quality and flow improvements. Restoration of prior converted wetlands is often very simple. Wetland storm water management areas are identified in Table 8-6. AB 8-18
130 Section 8 Storm Water Management Options Table 8-6: Summary of Retrofit Wetland Options Wetland Designation/ Location Wetland Area Available (acres) Wetland Volume Required for Retrofit (acre-ft) Targeted Drainage Area (acres) Existing Annual Pollutant Loading from Targeted Drainage Area Pollutant Removal in Total Annual Load 33-1 / Basin North of Interstate Highway 43, west of Calhoun acres of highway land use Sediment - 31 tons (0.6%) Phosphorous lbs. (1%) Lead lbs. (6 %) Sediment - 28 tons (0.5%) Phosphorous- 95 lbs. (0.7%) Lead lbs. (4%) 27-3 / Basin 4C020 North of Interstate Highway 43, west of Moorland Rd acres of highway land use Sediment - 18 tons (0.3%) Phosphorous - 84 lbs. (0.6%) Lead lbs. (3%) Sediment - 17 tons (0.3%) Phosphorous- 58 lbs.(2%) Lead lbs. (2.5%) 26-1 / Basin 4C030 South of Interstate Highway 43, east of Moorland Rd acres of highway land Sediment- 36 tons (0.7%) Phosphorous lbs. (1%) Lead lbs. (6 %) Sediment - 33 tons (0.6%) Phosphorous- 114 (0.9%) Lead lbs.(4.8%) use 14-2 / Basin 3A060 South of National Ave., east of Moorland acres of commercial land use Sediment -12 tons (0.2%) Phosphorous -24 lbs. (0.1%) Lead - 60 lbs. (0.9%) Sediment- 11 tons (0.2%) Phosphorous- 17 lbs (0.1%) Lead - 45 lbs. (0.7 %) Rd / Basin 5A020 North of College Ave., west of Sunny Slope acres of agricultural and Sediment- 47 tons (0.8%) Phosphorous -171 lbs. (1%) Lead - 34 lbs. (0.5 %) Sediment- 42 tons (0.8%) Phosphorous-120 lbs (0.9%) Lead - 26 lbs. (0.4%) Rd., & east of Small residential Rd. land use AB 8-19
131 Prior converted wetland areas should be evaluated for flood control and water quality improvement as new development in considered. The prior converted wetland areas which may be effective for storm water management are discussed in Section 4. The pollutant removal effectiveness for wetland management practices ranges from 80 to 99 percent of sediment loadings, from 50 to 99 percent of phosphorous loadings, and from 60 to 95 percent of lead loadings. Standard Catch Basins Standard catch basins collect sediment and pollutants in a sump prior to discharge of the storm water runoff to the storm sewer. Pollutants collected in the catch basins must be cleaned out to prevent flows from washing collected pollutants into the storm sewer. Catch basins are currently located in storm sewered areas. In order to continue the current level of pollutant reduction existing catch basins should be replaced, as necessary, with new catch basins rather than direct storm sewer inlets. Additionally, standard catch basins should be provided where new development plans include an urban type cross section with storm sewer. Additional catch basin installation will improve water quality from the drainage area. The estimated pollutant reduction per catch basin is 20 percent of the sediment loading from the drainage area. In-Line Treatment System An in-line treatment type system such as Vortechs TM, StormFilter TM, or Stormceptor TM will treat storm water entering the basin and discharge the water to the existing storm sewer system. The in-line systems are underground chambers where storm water collects and is treated. Typical maintenance includes regular clean-out of the collected sediment with vacuum trucks. Construction and maintenance costs vary depending on the size of the system. Possible locations for an in-line collection system include the industrial park. However, based on the drainage numerous systems would be required to effectively reduce the pollutants discharging from this area. Therefore, the in-line drainage system is not recommended for consideration at this time. However, an in-line treatment system should be considered in areas of future development. The pollutant removal effectiveness of the in-line treatment systems ranges from 70 to 90 percent of sediment, and 40 to 50 percent of the phosphorous load. The pollutant removal rate will vary with the type and sizing of system selected for installation. Estimated costs vary with the size of the unit, generally ranging from, $45,000 to $80,000 per unit. Vegetated Drainage Ditches Vegetated drainage swales are located throughout the City of New Berlin. The drainage ditches reduce storm water velocity and provide opportunity for pollutants to filter through vegetation. The regular maintenance program for the AB 8-20
132 Section 8 Storm Water Management Options drainage ditches, described in Section 9.6, will provide continued effectiveness for the removal of pollutants from drainage areas Discussion of Storm Water Quality Options The above sections describe options which will assist New Berlin in improvement of water quality. The water quality objective, as identified in Section 3 of this report, is to provide water quality suitable to support the designated potential recreational and biological uses of the streams within New Berlin. The water quality option effectiveness and cost are summarized in Table 8-7. The options recommended for incorporation into the storm water management plan for the City of New Berlin are presented in Section Streambank Stabilization Options Streambank stabilization measures include vegetative protection, rip rap protection, channel clearing and cleaning, and deposit removal. The streambank inventory identified about 13.6 miles of streambank which were classified as fair or poor. Of these reaches, 13.6 miles were identified for stabilization measures. The streambank reaches and actions needed are described in Table 8-8. The options recommended for incorporation into the storm water management plan for the City of New Berlin are presented in Section Regional Storage Options Regional detention options mitigate the cumulative impacts of the existing and future development in an area. Regional detention is often proposed because it can be more effective at controlling flood peaks than construction of individual storage ponds at numerous sites. Regional detention facilities may also be more cost-effective than individual basins due to the economy of scale associated with building one large pond and an associated inlet and outlet structures. Regional detention has impediments to implementation that do not exist with detention at individual sites. Common problems associated with implementation of regional detention include: Acquisition of a feasible site - There are many constraints on the site selected for regional detention: it must be located along the stream in the developing watershed, it should be downstream of the majority of the development and it must be large enough to satisfy the storage requirement. Development of the site - The site topography must support detention pond operation by having sufficient channel frontage for a gravity inlet and outlet. The site must be reasonably low and flat so that excavation cost is not excessive. Workable sites AB 8-21
133
134
135 Table 8-8: Recommended Actions for Stream Reaches with the Most Significant Streambank Stability Concerns Subwatershed and Stream Reach Designation Reach Length (miles) Location Overall Stream Rating Streambank Stability Concern Recommended Actions Upper Root River - A Designation 0.1 Tributary to Root River from point 0.2 mile east of New Berlin Hills Golf Course property line northeast 0.1 mile Poor Poor landform slope cutting; fair mass wasting, debris jam potential, and vegetative bank protection Protect, vegetate, and stabilize banks, remove potential jam materials Upper Root River - C Designation Upper Root River-A Designation Tributary to Root River from pond north 0.1 mile to point extending south of Dakota St. and east of 134th St. Tributary to Root River from point 0.1 mile west of New Berlin Hills Golf Course property line east to New Berlin Hills Golf Course property line Poor Fair Poor landform slope and vegetative bank protection; fair mass wasting, debris jam potential, obstructions, cutting, and deposition Fair landform slope, debris jam potential, vegetative bank protection, obstructions, cutting, and deposition Protect, vegetate, and stabilize banks, remove potential jam materials, clean out sedimentation. Protect, vegetate, and stabilize banks, remove potential jam materials and flow obstructions, clean out sedimentation. Tess Corners Creek - A Designation 0.1 Tributary to Root River from College Ave. north 0.1 mile Fair Remove potential jam materials and flow Poor debris jam potential, vegetative bank obstructions, vegetate or protect banks, protection, and obstructions; fair cutting repair cut areas. Upper Root River - B Designation 0.1 Tributary to Root River from point 0.4 mile east of Sunny Slope Rd. southeast 0.1 mile Fair Poor landform slope; fair cutting and deposition Repair cut areas, protect banks. Upper Root River - A Designation 0.1 Tributary to Root River from point 0.3 mile east of New Berlin Hills Golf Course property line north 0.1 mile Fair Poor landform slope; fair mass wasting, debris jam potential, and vegetative bank protection Stabilize slopes, remove potential jam materials, vegetate or protect banks. Poplar Creek 0.8 From Cleveland Ave. south to corner of Calhoun Rd. and Victor Rd. Fair Poor obstructions; poor/fair debris jam potential and vegetative bank protection; fair channel capacity, cutting, and deposition Romove flow obstructions and potential jam materials, vegetate and protect banks, repair cut areas. Upper Root River - A Designation 0.1 Tributary to Root River from point 0.1 mile east of New Berlin Hills Golf Course property line east 0.1 mile Fair Poor mass wasting; fair landform slope and debris jam potential Stabilize slopes, remove potential jam materials. Tess Corners Creek - A Designation 0.1 Tributary to Root River between Grange Ave. and College Ave. Fair Fair vegetative bank protection, cutting, and deposition Vegetate and protect banks, repari cut areas. AB 8-8.xls page 1 of 6 1/22/2010
136 Table 8-8: Recommended Actions for Stream Reaches with the Most Significant Streambank Stability Concerns Subwatershed and Stream Reach Designation Reach Length (miles) Location Overall Stream Rating Streambank Stability Concern Recommended Actions Calhoun Creek - B Designation 0.2 Tributary to Calhoun Creek from point 0.2 mile south of Beloit Rd. southwest 0.2 mile to pond in Calhoun Park Fair Fair debris jam potential, obstructions, cutting, and deposition Remove potential jam materials and flow obstructions, repair cut areas. Underwood Creek - A Designation 1.0 Tributary to Underwood Creek from corner of Meadow Ln. and Sunny Slope Rd. east to storm sewer under Meadow Ln. Fair Poor/fair cutting; fair landform slope, debris jam potential, vegetative bank protection, and deposition Repair cut areas, protect banks. Upper Root River - D Designation 0.1 Tributary to Root River from point extending southwest of Manitoba Ave. north 0.1 mile Fair Fair landform slope, mass wasting, vegetative bank protection, and cutting Stabilize upper slopes, vegetate and repain banks, repair cut areas. Upper Root River - G Designation 0.1 Tributary to Root River from point extending northeast of White Ct. southeast 0.1 mile to corner of Howard Ave. and 128th St. Fair Fair debris jam potential, vegetative bank protection, and cutting Remove potential jam materials, vegetate and protect banks, repair cut areas. Upper Root River - C Designation 0.2 Tributary to Root River form point extending south of Dakota St. and east of 134th St. northeast to 133rd St. Fair Poor vegetative bank protection; poor/fair landform slope and cutting; fair mass wasting Vegetate and protect banks, repari cut areas, stabilize upper slopes. Poplar Creek - F Designation 0.6 Tributary to Poplar Creek from Cleveland Ave. northwest to junction with Poplar Creek Fair Poor/fair debris jam potential; fair landform slope, vegetative bank protection, obstructions, and cutting Remove potential jam materials and flow obstructions, vegetate and protect banks, repair cut areas. Deer Creek 0.2 From point south of 162nd St. east 0.6 mile to point between Glendale Dr. and Cleveland Ave. Fair Fair landform slope, mass wasting. cutting, and deposition Stabilize upper slopes, repair cut areas. URR-A Designation 0.3 Tributary to Root River from point 0.2 mile west of 124th St. in New Berlin Hills Golf Course east 0.3 mile Fair Fair landform slope, debris jam potential, obstructions, and deposition Remove potential jam material and flow obstructions. AB 8-8.xls page 2 of 6 1/22/2010
137 Table 8-8: Recommended Actions for Stream Reaches with the Most Significant Streambank Stability Concerns Subwatershed and Stream Reach Designation Reach Length (miles) Location Overall Stream Rating Streambank Stability Concern Recommended Actions Deer Creek Designation 0.1 From Cleveland Ave. south 0.1 mile Fair Poor landform slope; fair debris jam potential and obstructions Remove potential jam materials and flow obstructions. URR-A Designation 0.2 Tributary to Root River from Meadowlark Dr. east to point 0.1 mile west of New Berlin Hills Golf Course Fair Fair debris jam potential, vegetative bank protection, cutting, and deposition Remove potential jam materials, vegetate and protect banks, repair cut areas. URR-D Designation 0.5 Tributary to Root River from point extending west of Ohio Dr. east to Highpointe Dr. Fair Fair obstructions, cutting, and deposition Remove flow obstructions, repair cut areas. Poplar Creek Designation 1.3 From junction with tributary UF-E southeast 1.3 miles Fair Fair debris jam potential, vegetative bank protection, cutting, and deposition Remove potential jam materials, vegetate and protect banks, repair cut areas. CC-B Designation 0.5 Tributary to Calhoun Creek from I-43 south to Westridge Dr. Fair Fair debris jam potential and vegetative bank protection Remove potential jam materials, vegetate and protect banks. Deer Creek Designation 0.6 From National Ave. northwest 0.6 mile Fair Poor obstructions; fair landform slope, debris jam potential, cutting, and deposition Remove flow obstructions and potential jam materials, repair cut areas. Deer Creek Designation 0.2 From junction with tributary DC-C north 0.2 mile Fair Poor obstructions; fair landform slope and cutting Remove flow obstructions, repair cut areas. CC-B Designation 0.7 Tributary to Calhoun Creek from I-43 northwest 0.7 mile Fair Fair debris jam potential, vegetative bank protection, obstructions, and deposition Remove potential jam materials and flow obstructions, vegetate and protect banks. AB 8-8.xls page 3 of 6 1/22/2010
138 Table 8-8: Recommended Actions for Stream Reaches with the Most Significant Streambank Stability Concerns Subwatershed and Stream Reach Designation Reach Length (miles) Location Overall Stream Rating Streambank Stability Concern Recommended Actions CC-C Designation 0.3 Tributary to Calhoun Creek from I-43 north to point extending east of Dale Dr. Fair Fair landform slope and debris jam potential Remove potential jam materials. UF-A Designation 1.4 Tributary to Poplar Creek from Cleveland Ave. north 1.4 miles Fair Poor vegetative bank protection; fair landform slope, debris jam potential, obstructions, cutting, and deposition Vegetate and protect bank, remove potentia jam materials and flow obstructions, repair cut areas. Poplar Creek Designation 0.1 From Calhoun Rd. west 0.1 mile Fair Fair landform slope and cutting Repair cut areas. CC-B Designation 0.1 Tributary to Calhoun Creek from Beloit Rd. northeast 0.1 mile Fair Fair debris jam potential and vegetative bank protection Remove potential jam materials, vegetate and protect banks. CC-H Designation 0.4 Tributary to Calhoun Creek from Linnie Lac southwest 0.4 mile to point extending north of College Ave. Fair Fair vegetative bank protection and obstructions Vegetate and protect banks, remove flow obstructions. URR-B Designation 0.3 Tributary to Root River from point extending north of Tammy Ln. east 0.3 mile to point 0.1 mile east of Sunny Slope Rd. Fair Fair vegetative bank protection and depostion Vegetate and protect banks. Poplar Creek Designation 0.7 From junction with tributary UF-L northeast 0.7 mile Fair Poor debris jam potential; fair obstructions Remove potential jam materials and flow and cutting obstructions, repair cut areas. URR-D Designation 0.1 Tributary to Root River from beginning near Long Acre Dr. east 0.1 mile Fair Fair deposition AB 8-8.xls page 4 of 6 1/22/2010
139 Table 8-8: Recommended Actions for Stream Reaches with the Most Significant Streambank Stability Concerns Subwatershed and Stream Reach Designation Reach Length (miles) Location Overall Stream Rating Streambank Stability Concern Recommended Actions URR-E Designation 0.2 Tributary to Root River from 132nd St. east 0.2 mile Fair Fair landform slope, vegetative bank protection, and cutting Vegetate and protect banks, repair cut areas. CC-A Designation 1.0 Tributary to Calhoun Creek from junction with CC-B and CC-C north 1.0 mile Fair Fair landform slope, debris jam potential, and vegetative bank protection Remove potential jam materials, vegetate and protect banks. CC-C Designation 0.2 Tributary to Calhoun Creek from Bener Rd. southwest 0.2 mile Fair Fair landorm slope CC-G Designation 0.1 Tributary to Calhoun Creek from junction with CC-H northwest to I-43 Fair Fair vegetative bank protection Vegetate and protect banks. UF-F Designation 0.2 Tributary to Poplar Creek from Willow Rd. northwest to New Berlin West High School Fair Fair debris jam potential and vegetative bank protection Remove potential jam materials, vegetate and protect banks. UF-H Designation 0.2 Tributary to Poplar Creek from junction with UF-L east 0.2 mile Fair Fair vegetative bank protection Vegetate and protect banks. URR-F Designation 0.2 Tributary to Root River from Cleveland Rd. north 0.2 mile to beginning of concrete lining on northern wall of creek Fair Fair vegetative bank protection Vegetate and protect banks. URR-F Designation 0.1 Tributary to Root River from Cleveland Rd. southwest to 128th St. Fair Fair vegetative bank protection Vegetate and protect banks. AB 8-8.xls page 5 of 6 1/22/2010
140 Table 8-8: Recommended Actions for Stream Reaches with the Most Significant Streambank Stability Concerns Subwatershed and Stream Reach Designation Reach Length (miles) Location Overall Stream Rating Streambank Stability Concern Recommended Actions Deer Creek Designation 0.1 From point 0.1 mile north of Glendale Rd. north 0.1 mile Fair Fair landform slope, cutting, and deposition Repair cut areas. URR-D Designation 0.1 Tributary to Root River from point extending between National Ave. and Cleveland Ave. north 0.1 mile to point extending west of Montana Ave Fair Fair landform slope, vegetative bank protection, obstructions, and cutting Vegetate and protect banks, remove flow obstructions, repair cut areas. AB 8-8.xls page 6 of 6 1/22/2010
141 Section 8 Storm Water Management Options usually contain wetlands and floodplains; thus, there will be regulatory requirements and constraints. Facility construction - Usually, the facility will be constructed using funds collected from developers. However, it will be necessary for the City to acquire the site and begin initial construction using general funds. Also, it will be necessary to oversize upstream conveyance facilities to assure that flows from new developments can reach the regional storage facility. Design criteria for regional storage areas are established based on the storm water management goals and objectives identified in Section 2 of this report. The regional detention ponds are designed to restrict the 100-year 24-hour peak discharge to the 100-year pre-development flow rate. Sufficient storage capacity will be provided to contain flow in excess of the pre-development 10-year flow. Four sites located in the Poplar Creek and Tess Corners Creek subwatersheds were evaluated as potential regional detention facility locations. Site RD-1 is located in the Tess Corners Creek subwatershed and sites RD-2, RD-3 and RD-4 are located in the Poplar Creek subwatershed. These detention sites would help prevent future flooding problems due to development and may mitagate flooding problems that already exist. Site RD-1 is located just north of College Avenue on the northeast side of Tess Corners Creek. This site will hold 240 acre-feet of water which will reduce the existing landuse 100-year peak flow by 100 cfs and reduce the future conditions peak flow by as much as 300 cfs. The detention facility would have a design depth of about 7 feet and cover an area of 38 to 40 acres. Site RD-2 is located just east of Calhoun Road, on the east side of Poplar Creek and south of Coffee Road. This site would be designed to hold 51 acre-feet of water which will reduce the future conditions 100-year peak flow by as much as 80 cfs. The detention facility would have a design depth of about 4.4 feet and cover an area of 20 acres. Site RD-3 is located on the west side of Poplar Creek, just south of Coffee Road. This site would be designed to hold 200 acre-feet of water which will reduce the future conditions 100-year peak flow by as much as 260 cfs. The detention facility would have a design depth of about 7.7 feet and cover an area of 45 acres. Site RD-4 is located on the east side of Calhoun Road, just north of Coffee Road. This site would be designed to hold 236 acre-feet of water which will reduce the future conditions 100-year peak flow by as much as 240 cfs. The detention facility would have a design depth of about 5.9 feet and cover an area of 67 acres. The conceptual design of each detention facility is based on the following: AB 8-22
142 Section 8 Storm Water Management Options <Each detention site will be filled and drained by gravity to reduce operation and maintenance costs. <The inlet will be controlled by a broad crested weir and the outlet will be controlled by an appropriately sized reinforced concrete pipe. <The sides of the storage sites will have a maximum 3:1 (horizontal:vertical) slope and could utilize terracing to provide areas for trees and shrubs. <When dry, the sites may be used for parks, athletic fields or other recreational purposes. <A portion of the bottom area could be excavated to include a small, permanent pond to enhance the aesthetics and increase recreational options. Additional specific information concerning each site, including conceptual design data, is presented in Tables 8-9 and The reduction in flow after implementation of the regional detention sites is presented in Table Table 8-9: Regional Storage Site Drainage Area Characteristics Site Identification Site Location Drainage Area (acres) Percent Impervious (%) Existing Future Land Use Land Use RD-1 Northeast side of Tess Corners Creek, north of College Avenue RD-2 East of Calhoun Road, south of Coffee Road RD-3 West side of Poplar Creek, south of Coffee Road RD-4 East of Calhoun Road, north of Coffee Road Table 8-10: Regional Storage Site Conceptual Design Parameters Site ID Surface Area of Site (acres) Max. Depth (feet) Volume (acre-feet) Invert Elevation (feet) Inlet Outlet Inflow Weir Crest (feet) Outlet Diameter (inches) Maximum Outflow (cfs) Cost RD NA 820 NA 2@24 70 $2,651,000 RD NA NA $1,712,130 RD $8,430,030 RD $41,810 AB 8-23
143 Section 8 Storm Water Management Options Table 8-11a: Reduction in Flow Resulting from Regional Detention Location 24-hour Storm Peak Flow (cfs) Present Future 100-year Peak Storm Flow for Future Land Use with Regional Detention (cfs) Node Street Name 10-year 100-year 10-year 100-year RD-2 RD-3 RD-4 PA23632 D/S Coffee Road PA21034 U/S Calhoun Road P03490 D/S Arcadian Lane Table 8-11b: Reduction in Stage Resulting from Regional Detention Location 24-hour Storm Peak Stage (feet) Present Future 100-year Peak Storm Stage for Future Land Use with Regional Detention (feet) Node Street Name 10-year 100-year 10-year 100-year RD-2 RD-3 RD-4 PA23632 D/S Coffee Road PA21034 U/S Calhoun Road P03490 D/S Arcadian Lane Additional regional detention sites were recommended in the Stormwater Management Plan for the Deer Creek Watershed prepared by Bonestroo Rosene Anderlik & Associated in 1993 and in the Westridge Stormwater Management Plan prepared by Ruekert/Mielke in The sites recommended in these plans were not re-evaluated or analyzed as part of the preparation of this plan. Information related to the sites recommended is presented in Section 9. AB 8-24
144 Section 9 Recommended Storm Water Management Plan 9.1 Option Selection Section 8 of this Storm Water Management Master Plan presents several options to improve the storm water drainage and storm water quality for the City of New Berlin. The options considered and described present a range of effectiveness, as well as a range of cost. The recommended storm water management plan includes the options which are selected for implementation. The recommended storm water management plan consists of three major elements; storm water drainage and flood control, water quality improvement, and urban land development. A variety of structural and non-structural measures have been selected for implementation which will effectively and efficiently meet the goals and objectives of this plan, reduce flooding and drainage problems, and improve the quality of storm water runoff. The plan requires an effective operation and maintenance plan and a drainage concern response strategy. The selected storm water management plan is also based on the adoption and enforcement of a comprehensive storm water ordinance. Lack of the enforcement of the storm water ordinance or lack of implementation of the operation and maintenance plan will greatly reduce the effectiveness of the recommended plan and its ability to meet the stated and accepted goals and objectives presented in Section 2. The recommended plan is described in the following sections of this report and is shown on Plate 2 in Appendix A. 9.2 Storm Water Drainage and Flood Control Plan Primary Flooding Problems The storm water drainage and flood control options evaluated include detention/storage measures or hydraulic system improvements which mitigate storm water drainage and flooding problems. The selected storm water drainage and flood control plan will provide a balance between protection against structural flooding in the 100-year storm event and public expenditure of funds. The recommended flood control projects are presented in Table 9-1. The recommended flood control projects, including detention basin and channel improvement locations, are shown on Figures 9-1 through 9-7. AB 9-1
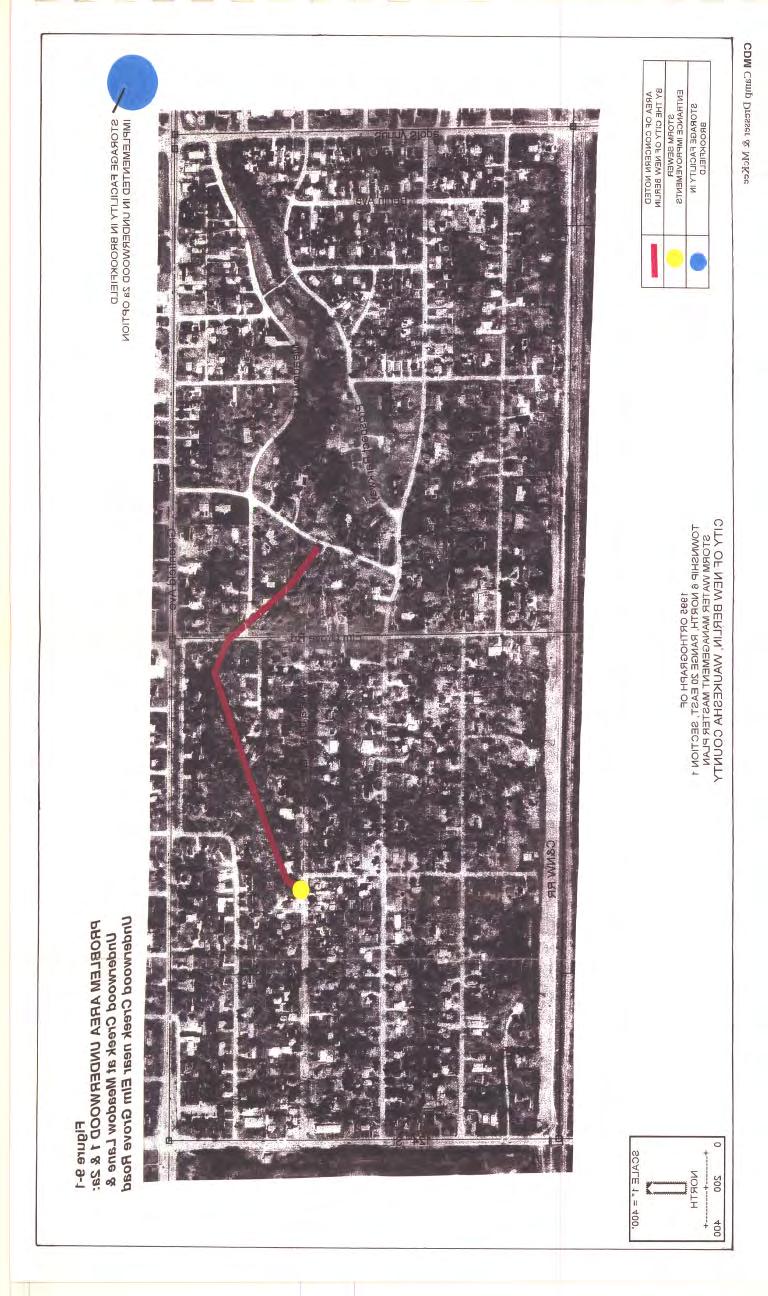
145
146
147
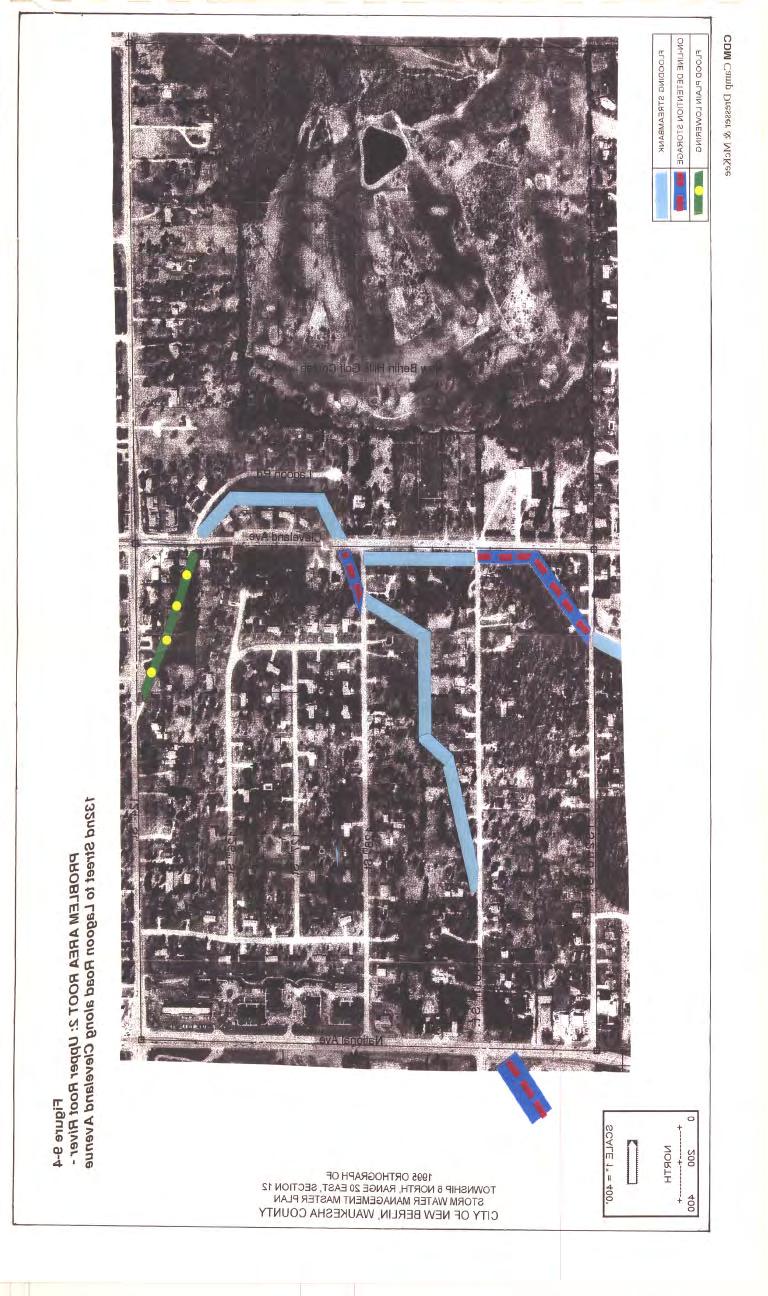
148
149
150
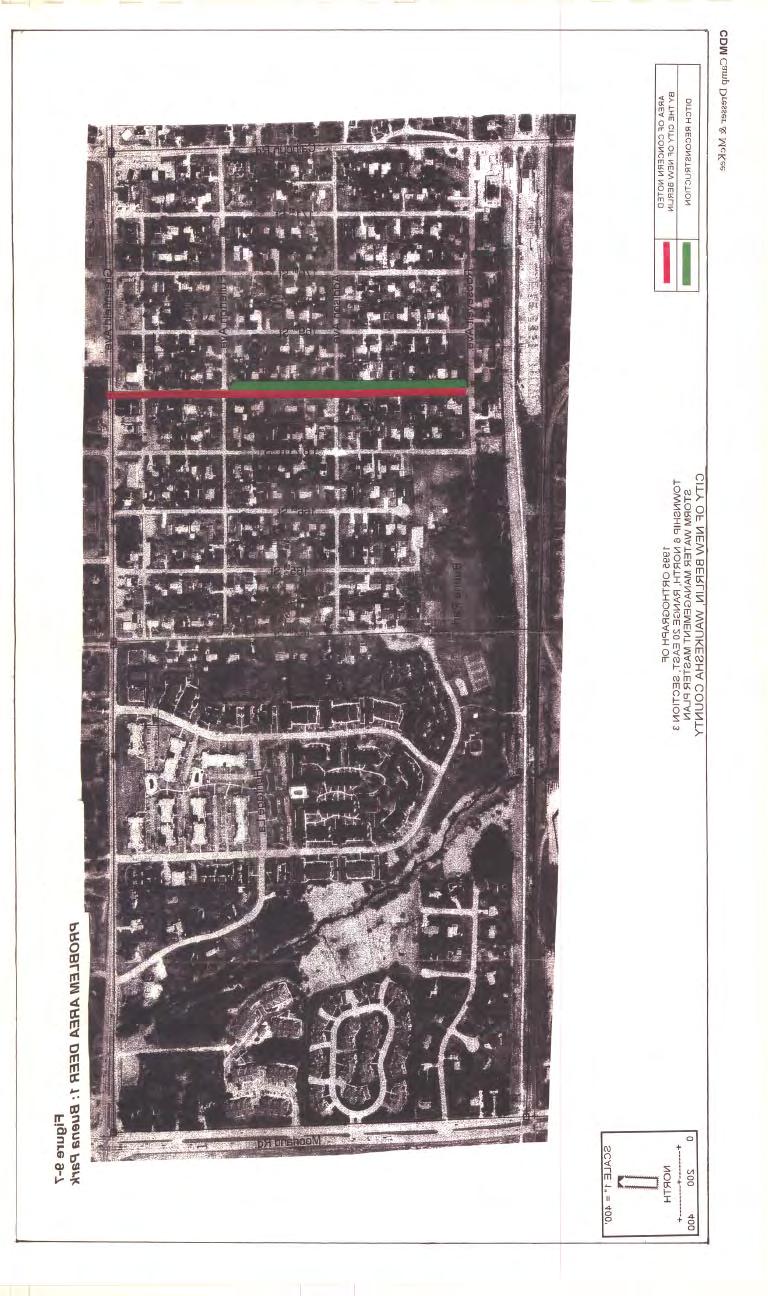
151
152 Section 9 Recommended Storm Water Management Plan The selected alternatives generally meet Objective No. 2 by providing storm water drainage and flood control facilities which prevent flood damages to property, prevent health and safety hazards, and prevent drainage -related nuisance and inconvenience at the most effective cost. The selected alternatives will provide a level of protection against the 100-year storm in most of the problem areas identified. Table 9-1: Selected Drainage and Flood Control Plan Problem Number Problem Summary Selected Alternative Level of Protection UNDERWOOD 1 (see Figure 9-1) Along Meadow Lane between 128th and 124th Sts. The South Branch of Underwood Creek is enclosed in a storm sewer. Overflow of the box culvert entrance at 124th St. and Meadow Land floods basements and backyards. There are numerous reports of house yard and street flooding associated with this enclosed channel. Reduce flow with upstream storage recommended as part of UNDERWOOD 2a, increase conveyance capacity of the storm sewer entrance, including a sloped trash rack which is less susceptible to debris clogging. 100 year UNDERWOOD 2a (see Figure 9-1) Overbank flooding of yards and homes along the South Branch of Underwood Creek beginning about 500 feet upstream of Arcadian Drive. Flooding southwest of the intersection of Elm Grove and Meadow Lanes. 30 acre-foot storage facility located north of Greenfield Avenue in the City of Brookfield. Also provides necessary storage for Problem UNDERWOOD year UNDERWOOD 2B (see Figure 9-2) Yard, street, and basement flooding in the Gatewood Park neighborhood. Additional 60-inch storm sewer to serve Gatewood Park area. Lower floodplain south of Grange Avenue. 25 year 1 ROOT 1 (see Figure 9-3) One residence experiences flooding along Park Avenue near Elm Grove Road. Yard flooding and erosion in backyards on the north side of Park Avenue. Installation of new culvert at Graham St. and channel expansion between Graham St. and Elm Grove Road. 25 year 1 ROOT 2 (see Figure 9-4) 15 homes are within the floodplain in the area bounded by Cleveland avenue, national avenue, 124th Street, and 132nd Street. Road flooding on Lagoon Road north of Cleveland Avenue. Washout of private bridge at 128th Street and Cleveland Ave. Online detention storage at four locations in the area and floodplain lowering. 100 year ROOT 3 (see Figure 9-5) House flooding upstream of Grange Avenue near Francis Avenue. Replace culverts at St. Mary=s Drive and lower floodplain south of Grange Avenue. 100 year ROOT 4 (see Figure 9-6) Yard flooding and erosion near Honey Lane and Elm Grove Road. Flooding of one residence and several yards east of the intersection at Elm Grove and Honey Lane. Regrade roadside and railroad ditches in the area. 10 year 1 DEER 1 Six residence experience structural flooding along 168th St. in the Buena Park Reconstruct ditches with some segments of storm sewer from Fullerton 10 year 1 AB 9-2
153 Section 9 Recommended Storm Water Management Plan Problem Number (see Figure 9-7) Problem Summary Selected Alternative Level of neighborhood south of Greenfield Avenue. The flooding is caused by inadequate drainage. Sump pumps discharge to the drainage ditch and lawn clipping and yard waste contribute to culvert blockage. to Roosevelt. Also redirect sump pumps to lawn areas rather than direct discharge to the drainage ditches. Clean debris from ditches and culverts Notes: 1 an alternative to achieve 100-year level of protection was not considered economically feasible. Protection Culvert Replacement Program In order to reduce localized flooding problems, culverts which are considered undersized are selected for replacement. The culvert replacement program includes 32 primary culverts which either cause road overtopping in excess of 6-inches in the 100-year storm; cause overtopping of a main arterial in the 100-year storm; or which do not provide sufficient capacity for the 100-year storm. The culvert replacement program also includes 83 secondary culverts which do not have sufficient capacity for the 10-year recurrence interval storm event. The culverts in the primary and secondary storm water management system that are designated for replacement are listed in Table 7-2 and 7-3, respectively Drainage Ditch Improvements In order to improve the efficiency of the drainage ditch system, the drainage ditch problem areas identified in Section 7.4, listed in Table 7-4, should be repaired. Repair of the ditch areas will include erosion protection, restabilization, clearing of sedimentation, and collection of accumulated debris. 9.3 Storm Water Quality Improvement Plan The storm water quality alternatives evaluated include pollution source control measures and pollution treatment measures. A combination of treatment and source control measures are selected to meet the objectives and criteria presented in Section 2. The selected source control and treatment control measures are presented in Table 9-2. Table 9-2: Selected Water Quality Control Measures Source Control Measure Description Estimated Reduction of Total Annual Load Comments Source Control Measures Develop in Accordance with The change from existing to future land use, based on the zoning map. sediment 12% phosphorous 6% As new areas are developed the land use will transform from agricultural to AB 9-3
154 Section 9 Recommended Storm Water Management Plan Table 9-2: Selected Water Quality Control Measures Source Control Measure Description Estimated Reduction of Total Annual Load Comments the Zoning Map lead -34% urban land uses. Sediment and phosphorous loading will be reduced. However, due to the more urban land use, the metals loading is expected to increase. Adopt and enforce storm water ordinance The draft storm water ordinance requires new development to provide storm water quality improvement. sediment 9% phosphorous 5% lead 14% The storage and water quality requirements will be essential in eliminating new flooding or water quality problems caused be urban development. Industrial Best Management Practices Industries regulated by NR216 are required to implement best management practices. Additionally industries which are potential significant pollutant contributors should implement applicable suggested best management practices. sediment 4% phosphorous 0.3% lead 3% To ensure we achieve the estimated pollutant reduction, routine monitoring/reporting may be necessary. Roadway Pavement Sweeping Arterials and Industrial Park Area: Seasonal sweeping program (weekly from April through May, bi-weekly June through August, monthly from September through November and during March) sediment 1% phosphorous 0.5% lead 3% -- Ice Management Practices implement improved salt distribution methods, train personnel involved with salt distribution variable Ice management should involve a policy decision on the part of the common council regarding the frequency, level, extent of deicing. Catch Basin Cleaning / Retrofit Clean catch basins twice per year / install catch basins in new development or redeveloping areas which will be serviced by storm sewer. sediment 0.04 tons/acre drained lead 0.05 lbs./ acre drained -- Landscape Implement environmentally friendly landscape practices in institutional sediment 0.4% phosphorous 2% Examples of environmentally friendly practices include increased turf AB 9-4
155 Section 9 Recommended Storm Water Management Plan Table 9-2: Selected Water Quality Control Measures Source Control Measure Description Estimated Reduction of Total Annual Load Comments Practices yards, park areas, school yards, city building yards, and vegetated median strips. lead 2% height, reduced week control, replacement of turf with low maintenance ground cover or perennials, and reduced fertilized application. Snow Storage Practices Locate snow storage areas in a well vegetated area at least 200 feet from a drainage way or storm sewer inlet variable Implementation of this practice provides the snow melt an opportunity to filter though the vegetated area which will remove a portion of the pollutant loading. Erosion Control Ordinance Increase the construction site inspection program, and train inspectors on erosion control techniques. Variable -- Agricultural Practices Encourage use of Agricultural BMPs such as conservation tillage and adopt a shoreline management ordinance. sediment 6.5% phosphorous 7% lead 0.1% County may be primarily responsible for implementation of agricultural practices. Streambank Stabilization Stabilize key streambanks as identified in Section 7 variable streambank stabilization measures may include: vegetation, erosion protection, and debris removal is designated areas. Public Education and Information Program Provide information to the general public and industries on the Storm Water Management Plan variable Topics may include: Lawn care, pet waste handling, other best management practices, as well as the NR216 requirements. May utilize newsletters, newspaper articles, school programs, cable TV and use of preprinted materials and videos. Treatment Measures Water Quality Detention Basin Construct a water quality detention basin west of Kelly Lake sediment 2% phosphorous 1.5% lead 3% -- Retrofit Wetland Retrofit three prior converted wetlands into storm water treatment wetlands sediment 2% phosphorous 3% AB 9-5
156 Section 9 Recommended Storm Water Management Plan Table 9-2: Selected Water Quality Control Measures Source Control Measure Description Estimated Reduction of Total Annual Load Comments for highway runoff. Locations: north of I-43 west of Calhoun, north of I-43 west of Moorland, south of I-43 east of Moorland lead 15% Retrofit Wetland Retrofit one prior converted wetland within Basin 5A020 south of National Avenue east of Moorland sediment 1% phosphorous 1% lead 0.5% Will collect runoff from agricultural and residential land use areas. Retrofit Wetland Retrofit one prior converted wetland within Basin 3A060 north of College west of Sunny Slope east of Small sediment 0.2% phosphorous 0.1% lead 0.9% Will collect runoff from commercial land use area. The recommended options will result in the following approximate reductions in the existing total annual pollutant loadings from the study area: sediment 37 percent, phosphorous 26 percent, and lead 7 percent. Additional pollutant reductions will be provided for storm water management controls with variable pollutant reduction levels such as public information and education and increased erosion control inspections. The selected plan will result in a significant reduction in pollutant loadings to the Root, Upper Fox, and Menomonee Rivers and Muskego - Wind Lakes. However, the reduction criteria presented in the Non-point Source Control Plan for the Priority Watersheds will not be met. The recommended level of pollutant reduction in the Non-point Source Control Plans is 50 to 75 percent for sediment, 30 to 70 percent for nutrients, and 40 to 53 percent for toxics, such as lead. The pollutant reduction goal is very difficult to achieve. 9.4 Regional Storage Opportunities The regional storage options evaluated should be considered to mitigate the cumulative impacts of the existing and future development is an area. Impediments to implementation of regional storage include acquisition of land and the costs of construction and maintenance. Four regional detention areas, located in the Tess Corners Creek and Poplar Creek subwatersheds, were evaluated as part of this plan. Three of the sites are considered practical for implementation based on cost and effectiveness in flow reduction. The fourth site, (RD-2) served a relatively small drainage area and the site contained significant large wetland areas. It was determined that site RD-2 would not be an effective regional detention site and would be very costly to develop. The practical sites are listed below: AB 9-6
157 Section 9 Recommended Storm Water Management Plan RD-1, 40 acre site in the Tess Corners Creek watershed near Sunny Slope and College. RD-3, 200 acre site near Coffee Road and Calhoun Road. RD-4, 236 acre site located South of the Industrial Park South of Cleveland Avenue along Calhoun Road. Additional information related to the regional detention sites is presented in Table 9-3. Implementation of these regional storage areas should be evaluated on a case-by-case basis as development is anticipated to occur in the drainage areas. Each of these sites contains some wetland and floodplain areas which may affect their feasibility and development cost. The impact of these and other regulatory issues including endangered species and archaeological resources has not been investigated. Regional storage areas recommended in the Stormwater Management Plan for the Deer Creek Watershed (Bonestroo Rosene Anderlik & Associates, 1993) and in the Westridge Stormwater Management Plan (Ruekert/Mielke 1995) should also be considered for implementation. Information related to the regional storage sites recommended in these storm water management plans is presented in Table 9-3. The location of the ponds is shown on the maps presented in Appendix J. The related storm water management plan should be referred to for more detailed information. AB 9-7
158 Section 9 Recommended Storm Water Management Plan Table 9-3: Regional Detention Areas Site Identification Location Approximate Drainage Area (acres) Volume (acre-feet) Capital Cost Annual Operations and Maintenance Cost RD-1 Northeast side of Tess Corners Creek, west of Sunny Slope Rd. 1, $2,651,000 1 RD-3 West side of Poplar Creek, south of Coffee Rd. 2, $8,430,030 1 RD-4 East of Calhoun Rd., north of Coffee Rd. 2, $13,504,870 1 Regional ponds recommended in the Stormwater Management Plan for the Deer Creek Subwatershed prepared by Bonestroo Rosene Anderlick & Associates 2 NP-1 NW & NE1/4 of Section 3 not available 1,64.3 $971,000 not available CP-1 NW1/4 of Section 11 not available 0.3 not available not available CP-2 NW1/4 of Section 11 not available 11.9 not available not available CP-3 NE1/4 of Section 10 not available 24.1 not available not available CP-4 SW1/4 of Section 3 not available 9.9 $244,000 not available CP-5 SW1/4 of Section 3 not available 10.3 $171,000 not available CP-6 SW1/4 of Section 3 not available 45.8 $180,000 not available CP-7 SE1/4 of Section 3 not available 50.5 not available not available CR-2 not available not available $10,000 not available CR-3 not available not available $26,000 not available SCP-1 SW1/4 of Section 11 not available 0.4 $74,000 not available SCP-2 SW1/4 of Section 11 not available 2.2 $24,000 not available SCP-3 SW1/4 of Section 11 not available 1.2 $37,000 not available AB 9-
159 Section 9 Recommended Storm Water Management Plan Table 9-3: Regional Detention Areas Site Identification SCP-4 Location Approximate Drainage Area (acres) Volume (acre-feet) Capital Cost Annual Operations and Maintenance Cost SW1/4 of Section 11 not available 5.3 $144,000 not available SCP-5 SW1/4 of Section 11 not available 4.8 not available not available SCP-6 SW1/4 of Section 11 not available 34.9 $466,000 not available SCP-7 SE1/4 of Section 10 not available 5.4 $32,000 not available SCP-8 SE1/4 of Section 10 not available 8.8 $50,000 not available CR-1 SE1/4 of Section 10 not available 25.1 $10,000 not available SP-1 SW1/4 of Section 23 not available 11.2 $4,000 not available SP-2 N1/2 of Section 23 & S1/2 of Section 14 not available 90.9 $516,000 not available SP-3 SW1/4 of Section 14 not available 10.3 $41,000 not available SP-4 SE1/4 of Section 14 not available 13 $54,000 not available SP-5 SW1/4 of Section 14 not available 4.4 $535,000 not available CR-4 Section 11,14,&23 not available 7.5 $26,000 not available Regional ponds recommended in the Westridge Stormwater Management Plan prepared by Ruekert/Mielke 2 G3 NE1/4 of Section 34 not available 18.5 not available not available H1/2 SW1/4 of Section not available not available H1/4 NW1/4 of Section not available not available NW1/4 of Section not available not available AB 9-
160 Section 9 Recommended Storm Water Management Plan Table 9-3: Regional Detention Areas Site Identification Location Approximate Drainage Area (acres) Volume (acre-feet) Capital Cost Annual Operations and Maintenance Cost H1/5 H1/6 NE1/4 of Section not available not available H2/1 SE1/4 of Section not available not available H2/3 SW1/4 of Section 26 not available 3.00 not available not available H3/2 NE1/4 of Section 27 not available 7.08 not available not available H3/3 SW1/4 of Section 27 not available not available not available H3/4 NE1/4 of Section 27 not available 3.10 not available not available Notes: 1 - These costs are for planning purposes only and do not include land acquisition, construction site erosion control, unknown environmental constraints, legal fees, or utility relocation costs which may be associated with the plan. 2- The recommendations presented in reports prepared by others were analyzed as part of this plan. The costs listed in this table have not been updated. The plans should be referred to far additional information. AB 9-
161 9.5 Urban Land Development Guidelines Section 9 Recommended Storm Water Management Plan The stream corridor is a measure of the health of a watershed. Highly urbanized areas impact the stream with major changes in the way storm water runoff functions. Peak discharge becomes higher and faster and low flow becomes lower and more erosive. Bridges and culverts create backwater effects and leave sedimentation blockage at the upstream side. Water quality and habitat are extensively degraded. Figure 9-8 shows the effect of urbanization. Guidelines for development are necessary to reclaim or prevent stream impacts. Imperviousness is directly related to both quantity and quality of storm water runoff. A very low percent increase in roads, parking lots, and rooftops has been shown to effect streams - even as low as 10 to 20%. The challenge is to effectively plan the gradual development process at the local level. New Berlin is located at the high points of five watersheds. The smallest network of the watershed begins at the high point. The headwater streams at this local level have a regional impact. The following guidelines are described to mitigate the impacts of urban growth expected in the City of New Berlin and protect the headwater streams. Establishing site grading requirements and zoning restrictions Requiring buffer zones or green spaces along streams Establishing building setbacks distances from streams Defining allowable peak rates and volumes of discharge Protecting wetlands and other sensitive areas Providing water quality improvement Implement operations and maintenance activities All of the guidelines are essential to minimize the creation of new flooding problems or further degradation of water quality because of new development. Under separate cover, a land development guideline manual has been developed to serve as a companion document to the storm water ordinance, as well as this plan. The manual is tailored to each subwatershed. The document is intended to be a tool a developer and the City will use as the City of New Berlin develops. 9.6 Cost Estimate for the Recommended Plan The total capital cost for the recommended Plan is estimated to be $4,681,000. A summary of the estimated costs for the selected plan elements is presented in Table 9-4. The costs associated with the storm water management ordinance compliance will be paid by developers, not by the City of New Berlin or the WDNR. Also, the costs associated with industrial BMP=s will be incurred by industry. AB 9-1
162
163 Section 9 Recommended Storm Water Management Plan Table 9-4: Recommended Plan and Estimated Costs Plan Component City of New Berlin Developers or Other Total Capital Annual O& M Capital Annual O& M Capital Annual O& M Drainage / Flood Control Plan UNDERWOOD 1: increased conveyance capacity at storm sewer entrance $50, ,000 $8, $50,000-$100,000 $8,000 UNDERWOOD 2a: 30 acre-foot storage facility North of Greenfield in the City of Brookfield. UNDERWOOD 2b: Additional 60-inch storm sewer to serve Gatewood Park area ROOT 1: Installation of new culvert at Graham St. and channel expansion between Graham and Elm Grove Road. $790,000 $10, $790,000 $10,000 $400,000 $1,000 $400,000 $1,000 $101,000 $1, $101,000 $1,000 ROOT 2: Online detention storage at four locations $2,500,000 $10, $2,500,000 $10,000 ROOT 3: Replace culverts at St. Marys Drive and lower floodplain south of Grange Ave. $350,000 $1, $350,000 $1,000 ROOT 4: Regrade roadside and railroad ditches $30, $30, DEER 1: Reconstruct ditches with segments of storm sewer from Fullerton to Roosevelt and redirect sump pump discharge to lawn areas. $180,000 $2,000 Cost to home owners for redirection of sump pumps -- $180,000 $2,000 Minor System Flooding Problems To Be Determined To Be Determined -- AB 9-13
164 Section 9 Recommended Storm Water Management Plan Table 9-4: Recommended Plan and Estimated Costs Plan Component City of New Berlin Developers or Other Total Capital Annual O& M Capital Annual O& M Capital Annual O& M Culvert Replacement and Ditch Repair Program (no water quality benefits) Replace/repair culverts -- $50,000/yr $50,000/yr Repair Ditch -- $25,000/yr $25,000/yr Water Quality Improvement Plan Implement Zoning Plan Implement and enforce storm water ordinance / erosion control ordinance / shoreland ordinance -- $10,000/yr $10,000/yr Industrial Best Management Practices and Extractive Land Use BMP s cost will vary by industry/ cost paid by industry cost will vary by industry/ cost paid by industry Roadway Pavement Sweeping -- $125,000/yr $125,000/yr Ice Management Practices Variable Variable Catch Basin Cleaning $5,000 per new catch basin installed $70/yr./catch basin cleaned (assumed 200 basins cleaned/yr. for cost $5,000 per new catch basin installed $70/yr./catch basin cleaned (assumed 200 basins cleaned/yr. for cost estimate) AB 9-14
165 Section 9 Recommended Storm Water Management Plan Table 9-4: Recommended Plan and Estimated Costs Plan Component City of New Berlin Developers or Other Total Capital Annual O& M Capital Annual O& M Capital Annual O& M estimate) Landscape Practices Variable Variable Snow Storage Practices Variable Variable Agricultural Practices Variable Variable Streambank Stabilization -- $250,000/yr $250,000/yr Public Education and Information Program Variable Variable Wet Detention Pond (Upper Kelly Lake) to be determined to be determined to be determined to be determined Retrofit prior converted wetlands along I-43 (4.5 acre-feet) $75,000 $10,000 possible cost share opportunity with WDOT -- $75,000 $10,000 Retrofit prior converted wetland in basin 5A020 south of Grange Avenue, west of Sunny Slope Road (11 acre-feet) Retrofit prior convert wetland in basin 3A060 east of Moorland Road, south of National Avenue (1 acre-foot) $165,000 $10, $165,000 $10,000 $15,000 $10, $15,000 $10,000 Regulatory/Ordinance Program Compliance with the new ordinance* costs will be incurred by AB 9-15
166 Section 9 Recommended Storm Water Management Plan Table 9-4: Recommended Plan and Estimated Costs Plan Component City of New Berlin Developers or Other Total Capital Annual O& M Capital Annual O& M Capital Annual O& M developers Drainage/ Flood Control Plan $4,426,000 $108,000/yr $4,426,000 $108,000/yr Culvert Replacement with Ditch Repair Program -- $200,000/yr $200,000/yr Water Quality Improvement Plan $255,000* $429,000/yr $255,000 $429,000/yr Regulatory / Ordinance Plan TOTAL $4,681,000 $537,000/yr $4,681,000 $537,000/yr Notes: These costs are for planning purposes only and do not include land acquisition, construction site erosion control unknown environmental constraints, legal fees, or utility relocation costs which may be associated with the plan. The cost of regional facilities is not included. * the cost for new catch basins not included in the capital cost. AB 9-16
167 9.7 Operations and Maintenance Program Section 9 Recommended Storm Water Management Plan The operations and maintenance (O&M) plan will provide the City with a means of addressing both the short and long term maintenance needs of its open channels, culverts, and detention facilities. Specifically, the program will identify needed maintenance activities and procedures, establish a schedule for maintaining individual system components, and define program management needs including costs and staffing. The prioritization of O&M activities for this project are divided into three levels of service based upon corrective, preventative, and aesthetic maintenance. The O&M activities are in Appendix H. A brief description of the O&M for each of these types of prioritization s is provided below: Corrective Maintenance Corrective Maintenance is performed on an emergency or as-needed basis when the integrity of a storm water drainage system is compromised. The focus of this type of maintenance is to protect the public health by repairing damages which threaten existing infrastructure or damage species and habitat. Corrective maintenance program for the City=s open channels, culverts, and detention facilities is provided in Appendix H Preventative Maintenance Preventative maintenance is performed on a routine basis in order to ensure the proper operation of the Storm water drainage system. The intent of this type of maintenance is to continually retain the flow carrying capability of the Storm water drainage system. Preventative maintenance program for the City=s open channels, culverts, and detention facilities is provided in Appendix H Aesthetic Maintenance Aesthetic maintenance is performed on a routine basis to enhance the appearance and appeal of the storm water drainage system. The goal of this type of maintenance is to provide the public with storm water facilities and components that enhance the community atmosphere. Aesthetic maintenance program for the City=s open channels, culverts, and detention facilities is provided in Appendix H Monitoring and Training Program The adoption of a monitoring program is vital for insuring that the existing Storm water drainage system operates efficiently. As part of the monitoring program, a series of inspection forms can be used to identify areas within the drainage system to be monitored during each site visit. The benefit of utilizing such forms allows the City to compile a historical record of the Storm water drainage system, ensure a consistent means of gathering needed information, provide verification that the inspection was done routinely and proficiently, and identify areas where maintenance activities are needed and establish a schedule for their completion. A copy of inspection forms for stream evaluation, drainage swale inventory, storm water management ponds, storm water culverts, storm water open channels, storm water AB 9-17
168 Section 9 Recommended Storm Water Management Plan drainage swales, and storm water infiltration facilities forms are provided in Appendix H. The frequency for performing the inspections is between 1-2 times per year and after the occurrence of major storm events. A program could be set up by section as the City is conveniently located primarily within one township and range. One full time staff inspector is necessary to monitor approximately 1400 culverts (non-driveway), 34 miles of streams, and an extensive open channel ditch system. To reduce the potential for improper inspection and maintenance, an inspector training and certification program should be implemented along with the monitoring program. By initializing such programs, the City benefits in two ways. First, by sending inspectors through the program, they become aware of the components, functions, and safety issues concerning each type of storm water drainage system. Second, by educating the inspectors about what to look for, they are able to identify potential problems before they escalate into more serious issues Drainage Concern Response Strategy Resident complaints and concerns about drainage or pollution problems are important. A drainage investigation form has been developed to assist in establishing a reasonable response strategy. The first section is documented by clerical staff as the problem is called in. The second section is completed by the inspection staff which compiles the inventory needed to make decisions. The drainage problem type can be a prioritization mechanism for the maintenance action. The drainage investigation form is located in Appendix I Regulatory and Permit Issues The WDNR provides regulatory review and permit approval on streams and creeks deemed navigable. Prior to any maintenance activity on navigable streams, proper regulatory approvals must be obtained. The WDNR has committed to identifying all navigable streams within the City of New Berlin by the end of (Greg Breese - WDNR; ) This will assist the corrective and preventative maintenance activities by knowing when regulatory permits are necessary Overall Maintenance Costs For wet and dry detention ponds, the estimate of the annual maintenance costs (estimated at 3 times the surface area of the pond) range between $600-$1000 per maintained acre which includes the pond and surrounding buffer. Several ways to reduce costs include the management of the buffer zone as a meadow rather than a lawn, provide (if possible) on-site disposal, and provide a maintained access way to the facility at a minimum width of 10 feet. A review of several wet pond dredging operations estimated a range in cost between $6.25 to $22.40 per cubic yard and an average dredging cost of $14 per cubic yard. This cost is based upon factors including size, accessibility, proximity to disposal site, and the method used to remove and transport the sediment. Costs associated for AB 9-18
169 Section 9 Recommended Storm Water Management Plan smaller ponds (<100,000 cf) range between $5 and $10 per cubic yard. If hauling or landfilling is required the costs climb even higher by $5 to $10 per cubic yard and $15 to $20 per cubic yard respectively. For dry detention ponds, the removal cost for cleaning will be lower than that of wet ponds. Actual costs for dry detention ponds range between $5 and $10 per cubic yard (1987 dollars). This is due to the elimination of dewatering, drag-line, and hydraulic dredging techniques needed for wet pond clean up. If hauling or landfilling is needed, the same unit costs apply as those found from wet detention ponds. For open channels, the following costs are associated with operations and maintenance. Labor rates were estimated at $17 per hour; equipment costs at $200 per day; overhead and administrative costs at 3x raw labor; streambank repair and erosion control at $75 per linear foot; and plant replacement at $15 per plant. For detention basins, the following costs as above for open channels with the addition of slope repair which was estimated at a lump sum of between $1,000 and $3,000 per year. 9.8 Storm Water Management Ordinance The storm water management goals and objectives outlined in Section 2 require preventative actions be taken during land development activities. New development of land has a significant impact on storm water runoff and on storm water quality. A regulatory tool that can minimize that impact is a storm water ordinance. The intent of an ordinance would be to maintain, as nearly as possible, the pre-developed runoff characteristics, and to reduce storm water pollution. The ordinance would prevent new flooding and reduce stream erosion, siltation, and sedimentation. The WDNR has prepared a model storm water ordinance for voluntary local adoption. The Waukesha County Board adopted a revision of the model ordinance on March 24, The Waukesha County Stormwater Management Ordinance was developed by a Stormwater Advisory Committee and applies to unincorporated land in Waukesha County - not the City of New Berlin. Revisions to the current WDNR model storm water management ordinance are recommended and have been compared to the Waukesha County ordinance. Muskego, Menomonee Falls, and Germantown all have a similar over-detention water quantity policy. The recommended ordinance revisions include the following: The administering authority shall be the City of New Berlin Engineer. The applicability criteria shall apply to all land development activities greater then one acre. Other acceptable hydrologic and hydraulic design methods may include US EPA SWMM, US Army Corps HEC-1, or other approved methods. The maintenance of the storm water practices shall be the responsibility of the City of New Berlin. AB 9-19
170 Section 9 Recommended Storm Water Management Plan The 100-year, 24 hour peak rate of runoff after the proposed activities may not exceed the peak rate of runoff which would have resulted from the 10-year, 24 hour event occurring over the site with the land in pre-settlement state, with the presettlement state curve number being not greater than 77 for hydrologic soil group D, not greater than 70 for hydrologic soil group C, not greater than 55 for hydrologic soil group B, and not greater than 30 for hydrologic soil group A. Where on site detention is required for runoff control, the detention facilities shall safely contain and/or safely pass the runoff of a 100-year storm event of any duration through a v-notch weir control structure as practicable. An active storage volume equal to the runoff volume under developed condition from the 1-year, 24 hour event shall be created unless other storm water treatment practices are used. The active storage volume shall be discharged over the first 24 hours of the storm event or greater and that discharge control structure shall be submerged. Design and specification shall be based on established and accepted procedures, and/or must conform to the standards set forth by the City Engineer. Any deviation from accepted procedures must be approved. AB 9-20
171 Section 10 Plan Implementation This Storm Water Management Plan prepared for the City of New Berlin is designed to practically achieve the objectives and criteria presented in Section 2. Implementation of the plan will require a long term commitment by the City of New Berlin, matched with a high level of cooperation with the WDNR, developers, businesses, industries, schools, and private property owners. Implementation of this plan should be coordinated with the WDNR=s Non-point Source Control Plan for the Menomonee River Priority Watershed Project, the Non-point Source Control Plan for the Upper Fox River Watershed Project, the Non-point Source Control Plan for the Root River, the Non-point Source Control Plan for the Muskego - Wind Lakes Watershed Project Prioritization and Implementation of Plan Components The plan consists of three major elements: storm water drainage and flood control, storm water quality improvement, and urban land development guidelines. The elements include non-structural, structural, and annual maintenance components. In general the greatest cost of the recommended plan is associated with the structural components. Although all of the structural components are considered necessary in development of an effective storm water management plan, it is not practical to expect implementation of all of the structural components at once. In order to assist in effective implementation of the plan, the structural plan components have been prioritized in the implementation schedule and are dependent on future approvals and funding. Federal, State, and local regulatory approvals are required on most projects, in general. The streambank stabilization program is essential to reduce sediment loading directly into the streams due to erosion. This project should be annually funded. The culvert replacement program is considered an annual maintenance program which should be included in the annual schedules and budgets. The recommended implementation schedule for the storm water management plan is based on water quality improvement, drainage /flooding improvement, and cost effectiveness. The recommended general implementation schedule is presented in Table AB 10-1
172 Section 10 Plan Implementation Table 10-1: Implementation Schedule Plan Component Short Range Medium Range Long Range Water Quality Improvement Plan Implement Zoning Plan as shown Industrial Best Management Practices Roadway Pavement Sweeping Ice Management Practices Catch Basin Cleaning Landscape Practices Snow Storage Practices Erosion Control Ordinance Enforcement Extractive Land Use Areas Agricultural Practices Adopt Shoreland Management Ordinance Τ Τ Τ Τ Τ Τ Τ Τ Τ Τ Τ Public Education and Information Program Τ Τ Τ Wet Detention Pond: Upper Kelly Lake Constructed Prior Converted Wetlands Τ Τ Streambank Stabilization Τ Τ Τ Regulatory/Ordinance Program Adoption and Compliance with the Storm Water Ordinance Τ Drainage/Flood Control Plan Underwood 1 Underwood 2 Τ Τ AB 10-2
173 Section 10 Plan Implementation Plan Component Short Range Medium Range Long Range Root 1 Τ Root 2 Τ Root 3 Τ Root 4 Deer 1 - Buena Park Τ Τ Regional Detention Τ Τ Culvert Replacement Program (no water quality benefits) Replace/repair culverts Τ Τ Τ Ditch Improvement Program (no water quality benefits) Repair ditch segments Τ Τ Τ Short Range is based on obtaining policy by the city council as soon as possible and including required financial and staff resources in the next city budget. Medium Range - financial and staff resources should be included in the annual city budget in the next 3 to 5 years. Long Range - financial and staff resources should be included in the annual city budget in the next 5 to 10 years or at the direction of the elected officials/ 10.2 Authorities and Partnerships for Plan Implementation City of New Berlin The City of New Berlin is ultimately responsible for the implementation of this storm water management plan within the City. New Berlin has the authority needed to implement plan components as outlined in Section 9. Support from all levels of the City=s administration is necessary for the success of this plan. New Berlin implementation responsibilities include administration of the plan as well as operation and maintenance of the plan components. New Berlin is also responsible for several of the plan components such as pavement sweeping, catch basin cleaning, AB 10-3
174 Section 10 Plan Implementation adoption of a storm water ordinance and enforcement of the Erosion Control Ordinance. Currently New Berlin has not been notified by the WDNR to obtain a storm water discharge permit. However, it is likely that the City will be required to obtain a Municipal Storm Water Discharge Permit sometime in the future. Information presented in this storm water management plan will provide information for completion of the application. Implementation of this plan will assist New Berlin in compliance with the conditions of the storm water permit Wisconsin Department of Natural Resources The WDNR has broad authority for water quality control, natural resource protection, and water and wetlands regulation. WDNR=s authority includes the establishment of water quality criteria and effluent limits, the administration of the Wisconsin Pollutant Discharge Elimination System (WPDES) permitting program, and the conduct of water quality research studies. Natural resource protection responsibilities include the management of fish, wildlife, and habitat resources. The Department also prepared the Root River, Upper Fox River, and Menomonee River Priority Watershed Projects reports and administers the non-point source priority watershed planning program, which assisted in funding of this study. WDNR can also provide technical assistance on the design and application of best management practices. They also have the authority to authorize regulatory approvals on plan components requiring permits. Responsibilities of the WDNR in implementation of this plan are summarized in Table Developers Developers are responsible for compliance with the City ordinances as well as planning development in accordance with the urban land development guidelines. Compliance with the ordinance will require use of appropriate erosion control techniques for sites greater than 1 acre and storm water detention to maintain runoff flows at the pre-settlement condition and improve runoff water quality. Responsibilities of developers in implementation of this plan are summarized in Table Wisconsin Department of Transportation The Wisconsin Department of Transportation (WDOT) is responsible for addressing water quantity and quality issues whenever they maintain or upgrade a roadway within their jurisdiction. By working with New Berlin in this storm water management effort, opportunities have been identified for WDOT and New Berlin to partner in implementation of selected plan elements, including the storm water facilities located at Interstate Highway 43 in Calhoun Creek subwatershed. Open communication of future WDOT projects will facilitate the identification of additional joint projects which will be mutually beneficial. Partnership opportunities for WDOT to assist in implementation of this plan are summarized in Table AB 10-4
175 Section 10 Plan Implementation University of Wisconsin - Extension The University of Wisconsin - Extension can assist New Berlin in providing information and education programs, and by providing technical advice and guidance on storm water related issues. The Extension also may assist New Berlin facilitate public meetings, and develop newsletters, bulletins, and research information. Responsibilities of the University of Wisconsin Extension in implementation of this Plan are summarized in Table Private Property Owners Industrial, commercial, and residential landowners are responsible for management activities within their boundaries. Private property owners can assist in implementation of this plan by utilizing best management practices and implementing appropriate components of this plan. Responsibilities of private property owners in implementation of this plan are summarized in Table Waukesha County Technical College The Waukesha County Technical College (WCTC) should partner with the communities in their storm water management efforts. Opportunities for the WCTC to provide education regarding storm water management programs should be explored. AB 10-5
176 Section 10 Plan Implementation Table 10-2: Storm Water Management Plan Implementation Responsibilities Component City of New Berlin WDNR Developers WDOT Private Property Owners Others Water Quality Improvement Plan Implement Zoning Plan Τ [ Industrial Best Management Practices [ [ Τ(1) Roadway Pavement Sweeping Ice Management Practices Catch Basin Cleaning Τ Τ Τ Landscape Practices Τ Τ [ Τ [ (2) Snow Storage Practices Erosion Control Ordinance Enforcement Τ Τ [ [ (2) [ (2) Extractive Land Use Areas Τ Agricultural Practices Τ Τ [ (2)(3) Adopt Shoreland Management Ordinance Τ Τ Public Education and Information Program Τ [ (3)(4) Wet Detention Pond: Upper Kelly Lake Τ [ Τ AB 10-6
177 Section 10 Plan Implementation Component City of New Berlin WDNR Developers WDOT Private Property Owners Others Constructed wetland Τ [ [ Τ Streambank Stabilization [ [ [ [ (3) Regulatory/Ordinance Program Adoption and Compliance with Storm Water Ordinance Τ Τ Drainage/Flood Control Plan Underwood 1 Underwood 2a & b Root 1 Root 2 Root 3 Root 4 Τ Τ Τ Τ Τ Τ [ [ Deer 1 - Buena Park Τ Τ Minor System Flooding Problem Repairs Τ [ Culvert Replacement Program (no water quality benefits) Replace/repair culverts Τ Ditch Improvement Program (no water quality benefits) AB 10-7
178 Section 10 Plan Implementation Component City of New Berlin WDNR Developers WDOT Private Property Owners Others Repair ditch segments Τ Τ indicates primary responsibility; [ indicates secondary responsibility. (1) indicates industrial property operators; (2) UW - Extension; (3) Waukesha County Land Conservation Department (4) New Berlin School District AB 10-8
179 10.3 Funding the Recommended Plan Section 10 Plan Implementation Funding sources for the implementation of the Storm Water Management Plan can come from a combination of sources. Potential funding options may include: Property Taxes -City: funds are accumulated through property taxes and are used for a variety of services throughout the City and are used to pay debt service on financial instruments, such as bonds to pay for larger structural components. Competition for funding of other municipal services may cause significant variation in the amount of funds available for implementation of the Plan. Cost-Share Grants - WDNR: available to help offset the local cost of implementing the recommended plan under the Wisconsin Nonpoint Source Priority Watershed Program. Not all components of the storm water management plan are eligible for the grant funds. The state may fund through a direct grant up to 100 percent of the design for water quality elements and up to 70 percent of the installation of urban controls such as wet detention ponds. WDNR typically funds up to 70 percent of the design cost and 50 percent of the construction costs for wet detention ponds. Accelerated street sweeping programs may also be eligible for cost sharing. Grant funds are made available through the bi-annual State of Wisconsin budget process and therefore are impacted by state priorities. Under the State Non-point Source Priority Watershed Program, cost-share grants for eligible controls must be entered into and implemented within eight years after formal approval of the Priority Watershed Plan. The Root River Watershed Plan was approved by the Wisconsin Natural Resources Board in The Menomonee River Priority Watershed Plan was approved by the Wisconsin Natural Resources Board on April 23, The Upper Fox River Watershed and Muskego - Wind Lakes Watershed Plans approved by WDNR in Therefore, to qualify for cost sharing, eligible practices must be implemented by 2002 within the Upper Fox watershed and the Muskego - Wind Lakes watershed. Sales Tax - Special Tax District: development of a local sales tax, if authorized by the voting public. The revenue generated is used for improvements within the taxed district. The revenue generated can be used for capital improvements and/or operation and maintenance. Bonds: general obligation, revenue, or special assessment bonds are normally used by municipalities to fund large capital improvement programs. Repayment of the bond is typically through the general municipality fund. Bonds allow large-scale capital improvement programs to be initiated when the facilities are needed rather than delaying the program until funding is available. These funds cannot be used for operations and maintenance costs. Storm Water Utility: accumulated by a user charge system. The utility charge system is based on the premise that property owners are responsible for their storm AB 10-9 SPINB/TEMP xxx
180 Section 10 Plan Implementation water runoff. Fees are assessed to property owners based on the estimated amount of storm water discharged from the facility. Pay-As-You Go Sinking Fund: adjunct to the revenue bond financing. The fund accumulates revenues until sufficient funding is available for a selected project. The project funds are then removed from the fund and the fund restarts accumulation for the next selected project. This method is generally associated with capital improvements where it is not advantageous to incur long-term debt. Fees/Licenses/Permits: generally the revenue generated is used to cover the costs of permit review or inspections required. These funds are used for administrative and staff cost. Penalties/Fines: limited funds. The best use of the funding generated by penalties and fees may be utilization in correction of the violation. Sources of funding considered feasible for the implementation of this plan are summarized in Table Table 10-3: Funding Options for Implementation of the Storm Water Management Plan Funding Option Administration of Plan Design of Components Construction of Components Operation & Maintenance Property Tax - City Funds Τ Τ Τ Τ Cost-Share Grants - WDNR Τ Τ Sales Tax - Special Tax District Τ Τ Τ Bonds Τ Τ Τ Storm water Utility Τ Τ Τ Τ Pay-as-you-go Sinking Fund Τ Τ Fees/ Licenses/Permits Penalties/Fines Τ Τ Only three of the funding methods have the ability to fund implementation of all components of the recommended plan; property tax, sales tax, and storm water utility. Numerous combinations of funding sources can be used to fund plan AB 10-10
181 Section 10 Plan Implementation implementation. However, successful plan implementation requires an equitable, long term funding method Plan Re-Evaluation and Updating The storm water management plan should be periodically re-evaluated based on changes within the watersheds or within the New Berlin. Plan components should be revised as necessary to reflect development or redevelopment changes and storm water management requirements. AB 10-11
182 Appendix A Plate 1 Storm Water Resources Map Plate 2 Recommended Plan Map
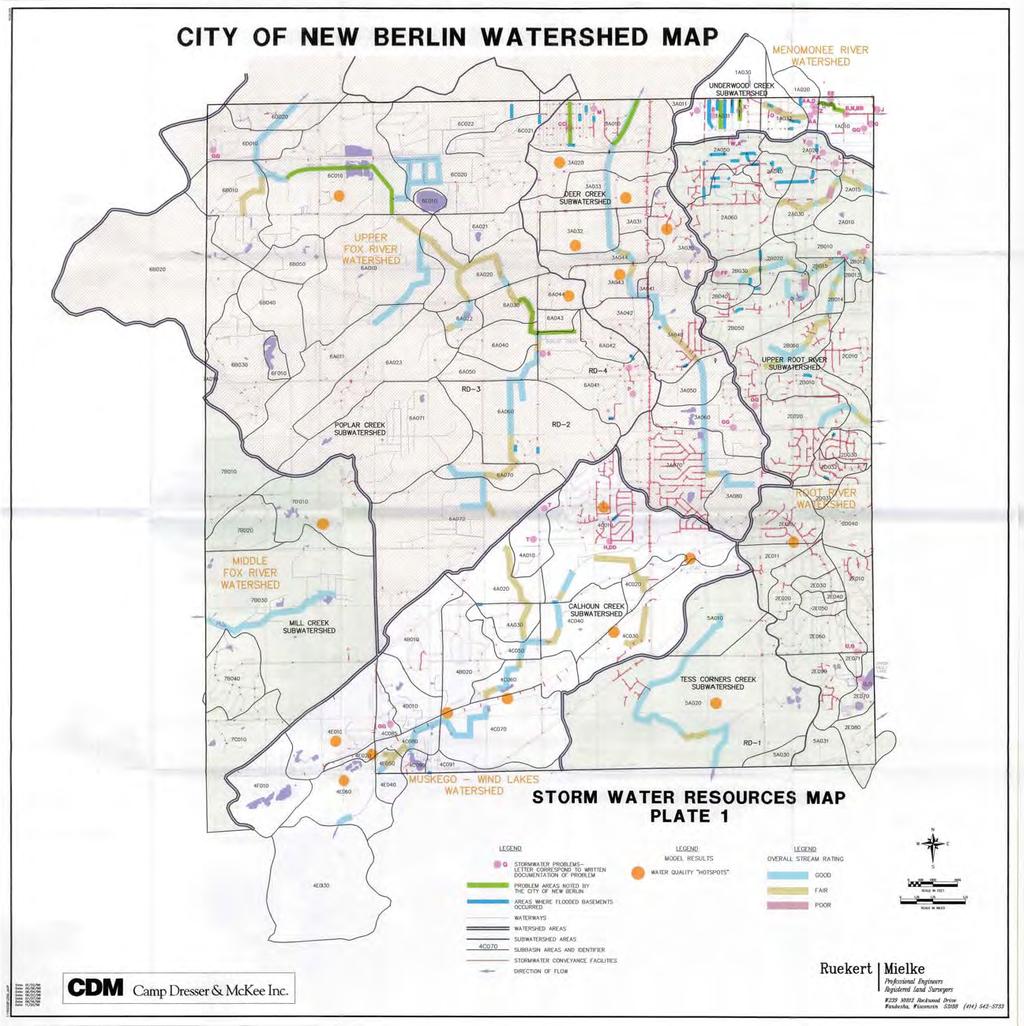
183
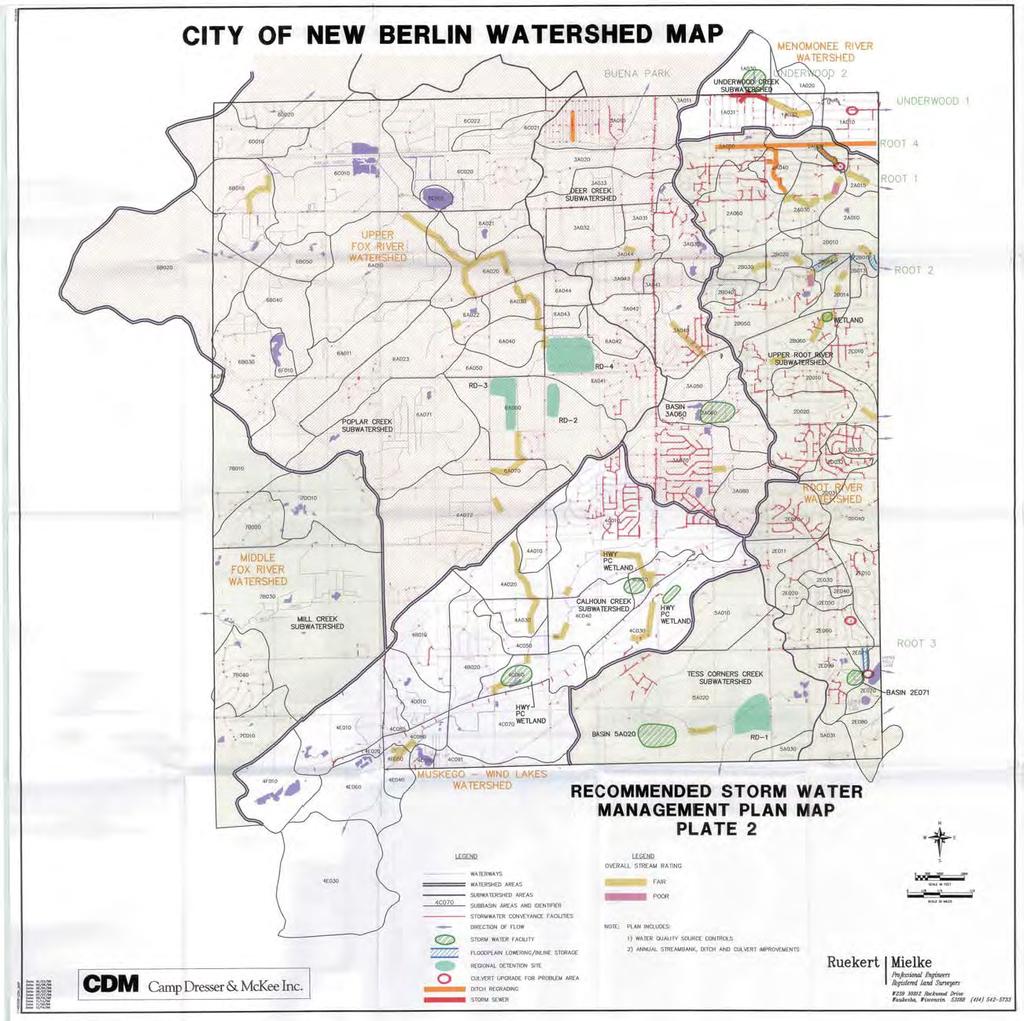
184
3.11 Floodplains Existing Conditions
 Other stormwater control practices may be needed to mitigate water quality impacts. In addition to detention facilities, other practices such as vegetated basins/buffers, infiltration basins, and bioswales
STREUVER FIDELCO CAPPELLI, LLC YONKERS DOWNTOWN DEVELOPMENT PHASE 1. DRAFT ENVIRONMENTAL IMPACT STATEMENT For: PALISADES POINT
 STREUVER FIDELCO CAPPELLI, LLC YONKERS DOWNTOWN DEVELOPMENT PHASE 1 DRAFT ENVIRONMENTAL IMPACT STATEMENT For: PALISADES POINT Prepared by: PAULUS, SOKOLOWSKI & SARTOR STORMWATER MANAGEMENT 1. Methodology
Continuing Education Associated with Maintaining CPESC and CESSWI Certification
 Continuing Education Associated with Maintaining CPESC and CESSWI Certification Module 2: Stormwater Management Principles for Earth Disturbing Activities Sponsors: ODOTs Local Technical Assistance Program
Section 4: Model Development and Application
 Section 4: Model Development and Application The hydrologic model for the Wissahickon Act 167 study was built using GIS layers of land use, hydrologic soil groups, terrain and orthophotography. Within
Chapter 2: Description of Planning Area
 2020 Facilities Plan Facilities Plan Report Chapter 2: Description of Planning Area 2.1 Introduction This chapter describes Milwaukee Metropolitan Sewerage District s (MMSD) planning area and existing
Stone Outlet Sediment Trap
 3.12 Sediment Control Description: A stone outlet sediment trap is a small detention area formed by placing a stone embankment with an integral stone filter outlet across a drainage swale for the purpose
LOCATED IN INDIAN RIVER COUNTY PREPARED FOR S.J.R.W.M.D. AND F.W.C.D. DECEMBER, 2003 Updated 2007 Updated May 2014 PREPARED BY
 FELLSMERE WATER CONTROL DISTRICT EAST MASTER DRAINAGE PLAN AND STORMWATER HYDROLOGIC ANALYSIS OF THE GRAVITY DRAINAGE SYSTEM LOCATED BETWEEN THE EAST BOUNDARY, LATERAL U, THE MAIN CANAL, AND DITCH 24 LOCATED
WELCOME Lake Wabukayne OPEN HOUSE
 WELCOME Lake Wabukayne Sediment Removal Project OPEN HOUSE We are here to: Update you, the community, on recent developments and activities at Lake Wabukayne Present the preferred alternative and receive
Page G Crow Wing County Multi-Hazard Mitigation Plan, 2017
 Table G - 10. s Identified by the () (From Crow Wing County Master Chart) 1 5 All- Hazards All- Hazards Work to ensure that all Crow Wing County residents are aware of and sign-up for the County s Emergency
UGRC 144 Science and Technology in Our Lives/Geohazards
 UGRC 144 Science and Technology in Our Lives/Geohazards Flood and Flood Hazards Dr. Patrick Asamoah Sakyi Department of Earth Science, UG, Legon College of Education School of Continuing and Distance Education
Timeframe. Crow Wing County, Baxter, Brainerd, Breezy Point, Crosby, Crosslake, Cuyuna, Deerwood, Emily, Fifty
 Table G - 13. s Identified for by the () (From Crow Wing County Master Chart) 1 5 9 All- Hazards All- Hazards Winter Work to ensure that all Crow Wing County residents are aware of and sign-up for the
INFLOW DESIGN FLOOD CONTROL SYSTEM PLAN 40 C.F.R. PART PLANT YATES ASH POND 2 (AP-2) GEORGIA POWER COMPANY
 GEORGIA POWER COMPANY") INFLOW DESIGN FLOOD CONTROL SYSTEM PLAN 40 C.F.R. PART 257.82 PLANT YATES ASH POND 2 (AP-2) GEORGIA POWER COMPANY EPA s Disposal of Coal Combustion Residuals from Electric Utilities Final Rule (40 C.F.R.
INFLOW DESIGN FLOOD CONTROL SYSTEM PLAN 40 C.F.R. PART 257.82 PLANT YATES ASH POND 2 (AP-2) GEORGIA POWER COMPANY EPA s Disposal of Coal Combustion Residuals from Electric Utilities Final Rule (40 C.F.R.
Crows Landing Naval Base Easement
 1 of 15 West Stanislaus Resource Conservation District Crows Landing Naval Base Easement Annual Reserve Monitoring Report Jamie McFarlin 11/112012 2 of 15 West Stanislaus Resource Conservation District
Stormwater Guidelines and Case Studies. CAHILL ASSOCIATES Environmental Consultants West Chester, PA (610)
") Stormwater Guidelines and Case Studies CAHILL ASSOCIATES Environmental Consultants West Chester, PA (610) 696-4150 www.thcahill.com Goals and Challenges for Manual State Stormwater Policy More Widespread
Stormwater Guidelines and Case Studies CAHILL ASSOCIATES Environmental Consultants West Chester, PA (610) 696-4150 www.thcahill.com Goals and Challenges for Manual State Stormwater Policy More Widespread
Stormwater Capacity Analysis for Westover Branch Watershed
 Stormwater Capacity Analysis for Westover Branch Watershed Pimmit Run Little Pimmit Run, Mainstem Stohman's Run Gulf Branch Pimmit Run Tributary Little Pimmit Run, W. Branch Little Pimmit Run, E. Branch
Black Gore Creek 2013 Sediment Source Monitoring and TMDL Sediment Budget
 Black Gore Creek 2013 Sediment Source Monitoring and TMDL Sediment Budget Prepared for: Prepared By: - I. Introduction The Black Gore Creek Total Maximum Daily Load (TMDL) was developed in collaboration
Local Flood Hazards. Click here for Real-time River Information
 Local Flood Hazards Floods of the White River and Killbuck Creek are caused by runoff from general, and/or intense rainfall. Other areas of flooding concern are from the Boland Ditch and Pittsford Ditch.
Hydrology and Hydraulics Design Report. Background Summary
 To: National Park Services Montezuma Castle National Monument Richard Goepfrich, Facility Manager From: Multicultural Technical Engineers Date: Tuesday - February 13, 2018 Subject: 30% Hydrology and Hydraulics
Appendix C Fluvial Flood Hazards
 Appendix C Fluvial Flood Hazards Sea Level Rise Vulnerability Assessment and Adaptation Project March 2019 Contents Contents... i Figures... i Tables... i Definitions, Acronyms, & Abbreviations... ii
BRANDON LAKES AVENUE PRE AND POST CONDITIONS DRAINAGE REPORT
 BRANDON LAKES AVENUE PRE AND POST CONDITIONS DRAINAGE REPORT Hillsborough County Public Works County Center, 22nd Floor 601 E. Kennedy Blvd. Tampa, FL 33602 BRANDON LAKES AVENUE DRAINAGE IMPROVEMENTS Capital
Sediment Trap. At multiple locations within the project site where sediment control is needed.
 Sediment Trap SE-3 Objectives EC Erosion Control SE Sediment Control TR Tracking Control WE Wind Erosion Control Non-Stormwater NS Management Control Waste Management and WM Materials Pollution Control
Why Geomorphology for Fish Passage
 Channel Morphology - Stream Crossing Interactions An Overview Michael Love Michael Love & Associates mlove@h2odesigns.com (707) 476-8938 Why Geomorphology for Fish Passage 1. Understand the Scale of the
Pequabuck River Flooding Study and Flood Mitigation Plan The City of Bristol and Towns of Plainville and Plymouth, CT
 Pequabuck River Flooding Study and Flood Mitigation Plan The City of Bristol and Towns of Plainville and Plymouth, CT Raymond Rogozinski and Maged Aboelata The City of Bristol and Towns of Plainville and
Technical Memorandum. City of Salem, Stormwater Management Design Standards. Project No:
 Technical Memorandum 6500 SW Macadam Avenue, Suite 200 Portland, Oregon, 97239 Tel: 503-244-7005 Fax: 503-244-9095 Prepared for: Project Title: City of Salem, Oregon City of Salem, Stormwater Management
City of Manitou Springs
 March 2018 City of Manitou Springs Implementing Land Use tools to reduce and mitigate natural hazard risk Context & History Past Present Historic homes Older infrastructure Hillside development Creekside
Specifications Whitcomb Elementary School Demolition January 15, 2016
 SECTION 31 2500 - EROSION CONTROL PART 1 - GENERAL 1.1 RELATED DOCUMENTS: A. The provisions of the Contract Documents apply to the work of this Section. B. The Virginia Erosion and Sediment Control Handbook,
PW 001 SNOW REMOVAL AND SANDING FOR ROADWAYS AND SIDEWALKS October 6, 2014 (#223-14) Original October 19, 2015; October 15, 2018 Public Works
 Original October 19, 2015; October 15, 2018 Public Works") Policy Statement: The Village of Kitscoty will provide snow and ice control on municipal streets and sidewalks according to determined priorities. Purpose: To provide direction and information to employees
Policy Statement: The Village of Kitscoty will provide snow and ice control on municipal streets and sidewalks according to determined priorities. Purpose: To provide direction and information to employees
Appendix E Guidance for Shallow Flooding Analyses and Mapping
 Appendix E Guidance for Shallow Flooding Analyses and Mapping E.1 Introduction Different types of shallow flooding commonly occur throughout the United States. Types of flows that result in shallow flooding
City of Thornton Attn: Tim Semones Development Engineeering 9500 Civic Center Dr. Thornton, CO 80229
 Development Engineering Land Surveying Construction Administration District Services October 20, 2017 City of Thornton Attn: Tim Semones Development Engineeering 9500 Civic Center Dr. Thornton, CO 80229
CHAPTER GEOLOGICALLY HAZARDOUS AREAS Applicability Regulations.
 CHAPTER 19.07 GEOLOGICALLY HAZARDOUS AREAS 19.07.010 Applicability. Geologically hazardous areas may pose a threat to the health and safety of citizens when incompatible development is sited in areas of
CITY OF NEW LONDON WINTER ROAD & SIDEWALK MAINTENANCE POLICY
 CITY OF NEW LONDON WINTER ROAD & SIDEWALK MAINTENANCE POLICY GENERAL The purpose of this policy is to set up acceptable procedures and policies for the winter maintenance of public areas in the City of
TPDES: Soil, Erosion and Sedimentation Methods
 SAWS TPDES: Soil, Erosion and Sedimentation Methods Philip Handley Supervisor-Resource Protection & Compliance August 25, 2014 TPDES: Soil, Erosion and Sedimentation Methods Soil Common term: Dirt Common
Appendix K.2: Sediment Management Excerpt from South Orange County Hydromodification Management Plan
 Appendix K.2: Sediment Management Excerpt from South Orange County Hydromodification Management Plan 4 Sediment Supply Management Requirements Permit Order R9-2013-0001 as amended by Order No. R9-2015-0001Section
SPRINGVILLE CITY, UTAH PRESSURE IRRIGATION SYSTEM DRAFT. MASTER PLAN & CAPITAL FACILITIES PLAN For the WEST FIELDS. February 11, 2014.
 SPRINGVILLE CITY, UTAH PRESSURE IRRIGATION SYSTEM MASTER PLAN & CAPITAL FACILITIES PLAN For the WEST FIELDS February 11, 2014 Prepared by: J-U-B ENGINEERS, INC. 240 West Center Street, Suite 200 Orem,
STORMWATER REPORT FRITO LAY SUBDIVISION NO. 3
 STORMWATER REPORT FRITO LAY SUBDIVISION NO. 3 May 2018 STORMWATER REPORT I. Subdivision Data a. The parcel is adjacent to the existing Frito Lay property in Topeka; and the subject plat application encompasses
SPRINGVILLE CITY, UTAH
 SPRINGVILLE CITY, UTAH PRESSURE IRRIGATION SYSTEM MASTER PLAN & CAPITAL FACILITIES PLAN For the WEST FIELDS February 11, 2014 Adopted May 20, 2014 Prepared by: J-U-B ENGINEERS, INC. 240 West Center Street,
The last three sections of the main body of this report consist of:
 Threatened and Endangered Species Geological Hazards Floodplains Cultural Resources Hazardous Materials A Cost Analysis section that provides comparative conceptual-level costs follows the Environmental
Materials. Use materials meeting the following.
 208.01 Section 208. SOIL EROSION AND SEDIMENTATION CONTROL 208.01 Description. Install and maintain erosion and sedimentation controls to minimize soil erosion and to control sedimentation from affecting
CASE STUDIES. Introduction
 Introduction The City of Winston-Salem faces the challenge of maintaining public infrastructure (e.g., water and sewer lines, storm drains, roads, culverts and bridges) while minimizing the potential impacts
Template for Sediment and Erosion Control Plan General Instructions. Section Instructions
 Template for Sediment and Erosion Control Plan General Instructions Introduction: Soil erosion and sediment deposition from farmlands can contribute to degraded surface water quality. Sediment delivery
THE NEED FOR AN ADDITIONAL SPILLWAY AT THE SANFORD DAM BOILING SPRING LAKES, NC. Presentation for The Brunswick County Commissioners April 20, 2015
 THE NEED FOR AN ADDITIONAL SPILLWAY AT THE SANFORD DAM BOILING SPRING LAKES, NC Presentation for The Brunswick County Commissioners April 20, 2015 The Sanford Dam Earth Dam constructed in 1961 Drainage
Sediment Trap. A temporary runoff containment area, which promotes sedimentation prior to discharge of the runoff through a stabilized spillway.
 Sediment Trap SC-15 Source: Caltrans Construction Site Best Management Practices Manual, 2003. Description A temporary runoff containment area, which promotes sedimentation prior to discharge of the runoff
VILLAGE COUNCIL STORMWATER REPORT JULY 23, 2016 STORM EVENT
 VILLAGE COUNCIL STORMWATER REPORT JULY 23, 2016 STORM EVENT STORM RAINFALL AND RADAR IMAGERY Total rainfall 4.99 inches 2.74 inches between 5:40 and 7:10, then a lull until 9:30 2.04 inches between 9:30
Suitable Applications Sediment traps should be considered for use:
 Categories EC Erosion Control SE Sediment Control TC Tracking Control WE Wind Erosion Control Non-Stormwater NS Management Control Waste Management and WM Materials Pollution Control Legend: Primary Objective
Rock & Aggregate Drop Inlet Protection
 Rock & Aggregate Drop Inlet Protection SEDIMENT CONTROL TECHNIQUE Type 1 System Sheet Flow Sandy Soils Type 2 System [1] Concentrated Flow Clayey Soils Type 3 System Supplementary Trap Dispersive Soils
Background on the March 13-14, 2007 Flooding in Browns Valley (Traverse County), Minnesota
, Minnesota") Background on the March 13-14, 2007 Flooding in Browns Valley (Traverse County), Minnesota Report to the Minnesota Governor s Office Prepared by: Minnesota Department of Natural Resources Waters Division
Background on the March 13-14, 2007 Flooding in Browns Valley (Traverse County), Minnesota Report to the Minnesota Governor s Office Prepared by: Minnesota Department of Natural Resources Waters Division
TABLE OF CONTENTS LIST OF TABLES. Page
 TABLE OF CONTENTS Page 11.0 EFFECTS OF THE ENVIRONMENT ON THE PROJECT... 11-1 11.1 Weather Conditions... 11-1 11.2 Flooding... 11-2 11.3 Forest Fires... 11-2 11.4 Permafrost and Subsidence Risk... 11-3
Standards for Soil Erosion and Sediment Control in New Jersey May 2012
 STANDARD FOR SEDIMENT BASIN Definition A barrier, dam, excavated pit, or dugout constructed across a waterway or at other suitable locations to intercept and retain sediment. Basins created by construction
HISTORY OF CONSTRUCTION FOR EXISTING CCR SURFACE IMPOUNDMENT PLANT GASTON ASH POND 40 CFR (c)(1)(i) (xii)
(1)(i) (xii)") HISTORY OF CONSTRUCTION FOR EXISTING CCR SURFACE IMPOUNDMENT PLANT GASTON ASH POND 40 CFR 257.73(c)(1)(i) (xii) (i) Site Name and Ownership Information: Site Name: E.C. Gaston Steam Plant Site Location:
HISTORY OF CONSTRUCTION FOR EXISTING CCR SURFACE IMPOUNDMENT PLANT GASTON ASH POND 40 CFR 257.73(c)(1)(i) (xii) (i) Site Name and Ownership Information: Site Name: E.C. Gaston Steam Plant Site Location:
Snow and Ice Control POLICY NO. P-01/2015. CITY OF AIRDRIE Snow and Ice Control Policy
 Page 1 CITY OF AIRDRIE Snow and Ice Control Effective Date: Approved By: Approved On: March 17, 2015 City Council March 16, 2015 Revision Date: Resolution #: ------ PURPOSE: The City of Airdrie is responsible
COUNCIL POLICY MANUAL
 COUNCIL POLICY MANUAL SECTION: PUBLIC WORKS SUBJECT: SNOW & ICE CONTROL POLICY 2012/2013 GOAL: Pages: 1 of 10 Approval Date: Dec. 3, 2012 Res. # 1001/2012 To annually identify the winter maintenance costs
Information for File # MMJ; Trunk Highway (TH) 7 / Louisiana Ave. Interchange Project
 7 / Louisiana Ave. Interchange Project") Information for File # 2013-00531-MMJ; Trunk Highway (TH) 7 / Louisiana Ave. Interchange Project Applicant: City of St. Louis Park Corps Contact: Melissa Jenny Address: U.S. Army Corps of Engineers Attn:
Information for File # 2013-00531-MMJ; Trunk Highway (TH) 7 / Louisiana Ave. Interchange Project Applicant: City of St. Louis Park Corps Contact: Melissa Jenny Address: U.S. Army Corps of Engineers Attn:
Stream Geomorphology. Leslie A. Morrissey UVM July 25, 2012
 Stream Geomorphology Leslie A. Morrissey UVM July 25, 2012 What Functions do Healthy Streams Provide? Flood mitigation Water supply Water quality Sediment storage and transport Habitat Recreation Transportation
ARTICLE 5 (PART 2) DETENTION VOLUME EXAMPLE PROBLEMS
 DETENTION VOLUME EXAMPLE PROBLEMS") ARTICLE 5 (PART 2) DETENTION VOLUME EXAMPLE PROBLEMS Example 5.7 Simple (Detention Nomograph) Example 5.8 Offsite and Unrestricted Areas (HEC-HMS) Example 5.9 Ponds in Series w/ Tailwater (HEC-HMS) Example
ARTICLE 5 (PART 2) DETENTION VOLUME EXAMPLE PROBLEMS Example 5.7 Simple (Detention Nomograph) Example 5.8 Offsite and Unrestricted Areas (HEC-HMS) Example 5.9 Ponds in Series w/ Tailwater (HEC-HMS) Example
ENGINEERING HYDROLOGY
 ENGINEERING HYDROLOGY Prof. Rajesh Bhagat Asst. Professor Civil Engineering Department Yeshwantrao Chavan College Of Engineering Nagpur B. E. (Civil Engg.) M. Tech. (Enviro. Engg.) GCOE, Amravati VNIT,
CITY OF CAPE CORAL STORMWATER MASTER PLAN PHASE II - PART 1 BASINS 4, 10, & 14 SUB-BASIN DRAINAGE IMPROVEMENTS HYDRAULIC ANALYSIS SUMMARY
 CITY OF CAPE CORAL STORMWATER MASTER PLAN PHASE II - PART 1 BASINS 4, 10, & 14 SUB-BASIN DRAINAGE IMPROVEMENTS HYDRAULIC ANALYSIS SUMMARY Cape Coral, FL Prepared for: The City of Cape Coral Public Works
CITY OF PORTLAND, TEXAS SERVICE PLAN FOR ANNEXATION AREA
 CITY OF PORTLAND, TEXAS SERVICE PLAN FOR ANNEXATION AREA Location and Acreage Approximately 1,863 acres of land in San Patricio County, located in the ETJ northwest of the existing City Limits. Metes and
Watershed Analysis Using Remote Sensing and GPS
 25 th Annual Louisiana Remote Sensing and GIS Workshop Baton Rouge, 2009 Watershed Analysis Using Remote Sensing and GPS Warren L. Kron, Jr. Quang Tran Baton Rouge City-Parish Planning Commission José
How Do Human Impacts and Geomorphological Responses Vary with Spatial Scale in the Streams and Rivers of the Illinois Basin?
 How Do Human Impacts and Geomorphological Responses Vary with Spatial Scale in the Streams and Rivers of the Illinois Basin? Bruce Rhoads Department of Geography University of Illinois at Urbana-Champaign
Table G - 6. Mitigation Actions Identified for Implementation by the City of Kent ( ) (From Wilkin County Master Mitigation Action Chart)
 (From Wilkin County Master Mitigation Action Chart)") Table G - 6. Actions Identified by the () (From Master Action Chart) Multi-Hazard Plan, 2017 Action Comments 5 All-Hazards Local Planning & Regulations Update the Operations Plan on an annual basis. Work
Table G - 6. Actions Identified by the () (From Master Action Chart) Multi-Hazard Plan, 2017 Action Comments 5 All-Hazards Local Planning & Regulations Update the Operations Plan on an annual basis. Work
Illinois State Water Survey Division
 Illinois State Water Survey Division SURFACE WATER SECTION SWS Miscellaneous Publication 108 SEDIMENT YIELD AND ACCUMULATION IN THE LOWER CACHE RIVER by Misganaw Demissie Champaign, Illinois June 1989
 Red River Flooding June 2015 Caddo and Bossier Parishes Presented by: Flood Technical Committee Where the Rain Falls Matters I-30 versus I-20 I-20 Backwater and Tributary Floods (Localized) 2016 Flood
CITY OF BEAVER DAM SNOW & ICE REMOVAL POLICY
 CITY OF BEAVER DAM SNOW & ICE REMOVAL POLICY Revised January, 2016 Approved by Operations Committee: February 1, 2016 This snow and ice removal policy guides Public Works personnel with deicing, plowing,
3.12 Geology and Topography Affected Environment
 3 Affected Environment and Environmental Consequences 3.12 Geology and Topography 3.12.1 Affected Environment 3.12.1.1 Earthquakes Sterling Highway MP 45 60 Project Draft SEIS The Kenai Peninsula is predisposed
Village of Glenview: Community-wide Flood Risk Reduction Program (FRRP)
") Village of Glenview: Community-wide Flood Risk Reduction Program (FRRP) Sarah Pasquesi, P.E. Project Engineer AECOM sarah.pasquesi@aecom.com Shane Schneider, P.E. Village Engineer Village of Glenview shanes@glenview.il.us
Village of Glenview: Community-wide Flood Risk Reduction Program (FRRP) Sarah Pasquesi, P.E. Project Engineer AECOM sarah.pasquesi@aecom.com Shane Schneider, P.E. Village Engineer Village of Glenview shanes@glenview.il.us
How Can DOT Operations and Maintenance Prepare for Extreme Weather Events?
 How Can DOT Operations and Maintenance Prepare for Extreme Weather Events? Gregory C. Johnson, P.E. Chief Operations Officer Michigan Department of Transportation November 17, 2012 Michigan s Climate Four
PENNSYLVANIA DEPARTMENT OF TRANSPORTATION ENGINEERING DISTRICT 3-0
 PENNSYLVANIA DEPARTMENT OF TRANSPORTATION ENGINEERING DISTRICT 3-0 LYCOMING COUNTY S.R.15, SECTION C41 FINAL HYDROLOGIC AND HYDRAULIC REPORT STEAM VALLEY RUN STREAM RELOCATION DATE: June, 2006 REVISED:
King City URA 6D Concept Plan
 King City URA 6D Concept Plan King City s Evolution Among the fastest growing cities 2000 Census 1,949 2010 Census 3,111 60% increase 2016 Census estimate 3,817 23% increase Average annual rate 4.3% Surpassing
Woodford County Erosion Prevention Plan and Permit. Application #
 Woodford County Erosion Prevention Plan and Permit Application # Date Instructions: Applicant will complete Parts A and B, and attach a proposed site diagram. This diagram must be completed in accordance
Dunn County Snow Removal Policy
 Dunn County Snow Removal Policy OVERVIEW With the advent of another winter season in the northern plains comes the possibility of snow, freezing rain and slippery roadways, and area resident s concern
TREASURE COAST REGIONAL PLANNING COUNCIL M E M O R A N D U M. To: Council Members AGENDA ITEM 4B10
 TREASURE COAST REGIONAL PLANNING COUNCIL M E M O R A N D U M To: Council Members AGENDA ITEM 4B10 From: Date: Subject: Staff December 14, 2018 Council Meeting Local Government Comprehensive Plan Review
September 6, City of Thornton 9500 Civic Center Drive Thornton, CO (303) RE: Maverik Thornton, CO - Drainage Report
 RE: Maverik Thornton, CO - Drainage Report") September 6, 2016 City of Thornton 9500 Civic Center Drive Thornton, CO 80229 (303) 538-7295 RE: Maverik Thornton, CO - Drainage Report As per your request, we are submitting to you the drainage report
September 6, 2016 City of Thornton 9500 Civic Center Drive Thornton, CO 80229 (303) 538-7295 RE: Maverik Thornton, CO - Drainage Report As per your request, we are submitting to you the drainage report
Proposed Scope of Work Village of Farmingdale Downtown Farmingdale BOA Step 2 BOA Nomination Study / Draft Generic Environmental Impact Statement
 Proposed Scope of Work Village of Farmingdale Downtown Farmingdale BOA Step 2 BOA Nomination Study / Draft Generic Environmental Impact Statement The scope of work that follows incorporates and covers
CCR Rule Annual Inspection Report (cont.) 2
 2") The inspection findings consisted of maintenance items and items that were not observed to be signs or potential signs of significant structural weakness. No deficiencies or disrupting conditions that
The inspection findings consisted of maintenance items and items that were not observed to be signs or potential signs of significant structural weakness. No deficiencies or disrupting conditions that
STORMWATER MANAGEMENT ASSESSMENT TECHNICAL MEMORANDUM DRAFT FINAL FOSTER DRIVE AREA SANITARY SERVICING AND STORMWATER MANAGEMENT CLASS EA
 The City of Committed to Total Service Excellence STORMWATER MANAGEMENT ASSESSMENT TECHNICAL MEMORANDUM DRAFT FINAL FOSTER DRIVE AREA SANITARY SERVICING AND STORMWATER MANAGEMENT CLASS EA April 2015 Revised
[1] Performance of the sediment trap depends on the type of outlet structure and the settling pond surface area.
![[1] Performance of the sediment trap depends on the type of outlet structure and the settling pond surface area.](/thumbs/76/74245181.jpg "[1] Performance of the sediment trap depends on the type of outlet structure and the settling pond surface area.") Sediment Trench SEDIMENT CONTROL TECHNIQUE Type 1 System Sheet Flow Sandy Soils Type 2 System [1] Concentrated Flow Clayey Soils Type 3 System [1] Supplementary Trap Dispersive Soils [1] Performance of
Sediment Trench SEDIMENT CONTROL TECHNIQUE Type 1 System Sheet Flow Sandy Soils Type 2 System [1] Concentrated Flow Clayey Soils Type 3 System [1] Supplementary Trap Dispersive Soils [1] Performance of
9/12/2014 O V E RV I E W
 K E E P I N G T H E N E W M I S S I O N R E AC H C L E A N T R A S H & F L O ATA B L E S B M P S T U D Y Russell Persyn, P.E., Ph.D. (SARA) Cris Parker, P.E., CFM (HDR) September 4, 2014 O V E RV I E W»
Template for Sediment and Erosion Control Plan General Instructions
 Template for Sediment and Erosion Control Plan General Instructions Introduction: Soil erosion and sediment deposition from farmlands can contribute to degraded surface water quality. Sediment delivery
MARYLAND S LAND USE/LAND COVER MAP AND ASSOCIATED ANALYSIS
 MARYLAND S LAND USE/LAND COVER MAP AND ASSOCIATED ANALYSIS Maryland Department of Planning Daniel Baldwin Stephanie Martins November 19, 2012 http://www.planning.maryland.gov/ PURPOSE The primary purpose
1 INTRODUCTION AND MAJOR FINDINGS... 1
 Memorandum To: Lindsey Clark, Stillwater Valley Watershed Council Coordinator From: Chad Raisland, Pioneer Technical Services, Inc. and Karin Boyd, Applied Geomorphology, Inc. CC: Tanya Lester, Stillwater
Randall W. Parkinson, Ph.D., P.G. Institute of Water and Environment Florida International University
 An Update on Adaptation Action Activities Undertaken Since Completion of the City of Satellite Beach (FL) Vulnerability Assessment to Rising Seas (2010) Randall W. Parkinson, Ph.D., P.G. Institute of Water
SNOW REMOVAL GUIDE. City Of Orange Township. Public Works Snow Removal Hotline: (973) My Orange Hotline: (973)
 My Orange Hotline: (973)") Mayor Dwayne D. Warren, Esq. And The Orange Municipal Council MOVING ORANGE FORWARD City Of Orange Township SNOW REMOVAL GUIDE Public Works Snow Removal Hotline: (973) 266-4030 My Orange Hotline: (973)
Mayor Dwayne D. Warren, Esq. And The Orange Municipal Council MOVING ORANGE FORWARD City Of Orange Township SNOW REMOVAL GUIDE Public Works Snow Removal Hotline: (973) 266-4030 My Orange Hotline: (973)
Town of Bowden Province of Alberta Policy Document ( ) SNOW REMOVAL POLICY
 SNOW REMOVAL POLICY") Town of Bowden Box 338, 2101 20 th Ave Bowden, Alberta, T0M 0K0 Town of Bowden Province of Alberta Policy Document (2019-01) SNOW REMOVAL POLICY 1 INTRODUCTION The purpose of this policy is to establish
Town of Bowden Box 338, 2101 20 th Ave Bowden, Alberta, T0M 0K0 Town of Bowden Province of Alberta Policy Document (2019-01) SNOW REMOVAL POLICY 1 INTRODUCTION The purpose of this policy is to establish
October 26, Ms. Aimee Zack Canadian Pacific 120 S. Sixth Street Suite 900 Minneapolis, Minnesota 55402
 October 26, 2017 Ms. Aimee Zack Canadian Pacific 120 S. Sixth Street Suite 900 Minneapolis, Minnesota 55402 Re: Soo Line Dump Site 2017 Annual Soil Cover Inspection Dear Aimee: The purpose of this letter
Drainage Analysis. Appendix F
 Drainage Analysis Appendix F Golden View Drive Elizabeth Street LMORE CREEK Ricky Road Rabbit Creek Road LITTLE RABBIT CREEK East 156th Avenue MOA Project #10-026 Golden View Drive Intersection
HISTORY OF CONSTRUCTION FOR EXISTING CCR SURFACE IMPOUNDMENT PLANT GADSDEN ASH POND 40 CFR (c)(1)(i)-(xii)
(1)(i)-(xii)") HISTORY OF CONSTRUCTION FOR EXISTING CCR SURFACE IMPOUNDMENT PLANT GADSDEN ASH POND 40 CFR 257.73(c)(1)(i)-(xii) (i) Site Name and Ownership Information: Site Name: Site Location: Site Address: Gadsden
HISTORY OF CONSTRUCTION FOR EXISTING CCR SURFACE IMPOUNDMENT PLANT GADSDEN ASH POND 40 CFR 257.73(c)(1)(i)-(xii) (i) Site Name and Ownership Information: Site Name: Site Location: Site Address: Gadsden
Assessment. Assessment
 2001 SPRINGBROOK CREEK RESTORATION - THREE YEAR POST-CONSTRUCTION REVIEW - Presented by Bruce Henderson and Andy Harris 2005 River Restoration Northwest Symposium Skamania Lodge, Washington www.hendersonlandservices.com
FOR PROJECTS INITIATED AFTER NOVEMBER 1, 2008 ITEM 716 EMBANKMENT EARTH OUTLET SEDIMENT TRAP
 AFTER NOVEMBER 1, 2008 ITEM 716 EMBANKMENT EARTH OUTLET SEDIMENT TRAP 716.1 Description. This work shall consist of furnishing, installing, maintaining, and removing temporary erosion protection and sediment
ATTACHMENT D SNOW REMOVAL AND DE-ICING PROCEDURES
 Interstate Reliability Project 345-kV Transmission Lines Development & Management Plan Volume 2 ATTACHMENT D SNOW REMOVAL AND DE-ICING PROCEDURES INTERSTATE RELIABILITY PROJECT The Interstate Reliability
City of Saginaw Right of Way Division Snow and Ice Removal Policy January 18, 2016
 Snow and Ice Removal Policy January 18, 2016 It is the policy of the to provide snowplowing and ice removal services in order to: Provide safe traveling conditions for motorists and pedestrians Assist
3/3/2013. The hydro cycle water returns from the sea. All "toilet to tap." Introduction to Environmental Geology, 5e
 Introduction to Environmental Geology, 5e Running Water: summary in haiku form Edward A. Keller Chapter 9 Rivers and Flooding Lecture Presentation prepared by X. Mara Chen, Salisbury University The hydro
Distinct landscape features with important biologic, hydrologic, geomorphic, and biogeochemical functions.
 1 Distinct landscape features with important biologic, hydrologic, geomorphic, and biogeochemical functions. Have distinguishing characteristics that include low slopes, well drained soils, intermittent
MAPPING THE RAINFALL EVENT FOR STORMWATER QUALITY CONTROL
 Report No. K-TRAN: KU-03-1 FINAL REPORT MAPPING THE RAINFALL EVENT FOR STORMWATER QUALITY CONTROL C. Bryan Young The University of Kansas Lawrence, Kansas JULY 2006 K-TRAN A COOPERATIVE TRANSPORTATION
Ground Water Protection Council 2017 Annual Forum Boston, Massachusetts. Ben Binder (303)
") Ground Water Protection Council 2017 Annual Forum Boston, Massachusetts Protecting Groundwater Sources from Flood Borne Contamination Ben Binder (303) 860-0600 Digital Design Group, Inc. The Problem Houston
Ground Water Protection Council 2017 Annual Forum Boston, Massachusetts Protecting Groundwater Sources from Flood Borne Contamination Ben Binder (303) 860-0600 Digital Design Group, Inc. The Problem Houston
SERVICING BRIEF & STORMWATER MANAGEMENT REPORT Colonial Road Sarsfield (Ottawa), Ontario. Report No June 15, 2017
, Ontario. Report No June 15, 2017") SERVICING BRIEF & STORMWATER MANAGEMENT REPORT 2980 Colonial Road Sarsfield (Ottawa), Ontario Report No. 16033 June 15, 2017 D. B. G R A Y E N G I N E E R I N G I N C. Stormwater Management - Grading &
SERVICING BRIEF & STORMWATER MANAGEMENT REPORT 2980 Colonial Road Sarsfield (Ottawa), Ontario Report No. 16033 June 15, 2017 D. B. G R A Y E N G I N E E R I N G I N C. Stormwater Management - Grading &
Land Use and Zoning Page 1 of 10 LAND USE AND ZONING
 LAND USE AND ZONING Land Use and Zoning Page 1 of 10 BACKGROUND The Clifton-Fruitvale planning area is about 3,962 acres (6.2 sq. miles) with a population of 14,000 residents. The density of the area is
Working with Natural Stream Systems
 Working with Natural Stream Systems Graydon Dutcher Delaware County Soil & Water Conservation District Stream Corridor Management Program Tropical Storm Sandy October 29,2012 What is a Watershed?
COASTAL HAZARDS. Alan Lulloff, Water Management Engineer Wisconsin Department of Natural Resources. Local Contact: John Spangberg (715)
") COASTAL HAZARDS Alan Lulloff, Water Management Engineer Wisconsin Department of Natural Resources Local Contact: John Spangberg (715)685-2923 The Northwest Ordinance of 1787 and the river Mississippi and
COASTAL HAZARDS Alan Lulloff, Water Management Engineer Wisconsin Department of Natural Resources Local Contact: John Spangberg (715)685-2923 The Northwest Ordinance of 1787 and the river Mississippi and
Application #: TEXT
 TOWN OF FORT MYERS BEACH 2008 PROPOSED COMPREHENSIVE PLAN AMENDMENTS Application #: 2008-13-TEXT Description: Modify the Coastal Management and Future Land Use Elements to reflect the state s new definition
Chapter 7 Mudflow Analysis
 Chapter 7 Mudflow Analysis 7.0 Introduction This chapter provides information on the potential and magnitude of mud floods and mudflows that may develop in Aspen due to rainfall events, snowmelt, or rain