Trade Integration in Latin America: A Network Perspective
|
|
|
- Olivia Walker
- 6 years ago
- Views:
Transcription
 and are published to elicit comments and to encourage debate.")
1 WP/17/148 Trade Integration in Latin America: A Network Perspective by Kimberly Beaton, Aliona Cebotari, Xiaodan Ding and Andras Komaromi IMF Working Papers describe research in progress by the author(s) and are published to elicit comments and to encourage debate. The views expressed in IMF Working Papers are those of the author(s) and do not necessarily represent the views of the IMF, its Executive Board, or IMF management.
2 2017 International Monetary Fund WP/17/148 IMF Working Paper Western Hemisphere Department Trade Integration in Latin America: A Network Perspective 1 Prepared by Kimberly Beaton, Aliona Cebotari, Xiaodan Ding and Andras Komaromi Authorized for distribution by Valerie Cerra June 2017 IMF Working Papers describe research in progress by the author(s) and are published to elicit comments and to encourage debate. The views expressed in IMF Working Papers are those of the author(s) and do not necessarily represent the views of the IMF, its Executive Board, or IMF management. Abstract The paper applies a network analysis framework to analyze the regional and global integration of Latin American and Caribbean (LAC) countries. We compare network-based measures of trade integration to conventional measures, decomposing integration along several dimensions to better understand the sources of trade connectivity and their impact on growth. The paper finds that LAC countries are relatively well integrated in terms of links to diversified markets, but the strength of those links is weak. Comparing trade integration to predictions from gravity models, we find many LAC countries have significant scope to improve connectivity and increase their roles in regional and world trade networks. JEL Classification Numbers: F14, F15, F17, F62, L14, O54, O57, D85 Keywords: trade, integration, networks, Latin America and the Caribbean Authors Addresses: kbeaton@imf.org, acebotari@imf.org, xding@imf.org, and akomaromi@imf.org. 1 The authors would like to thank Valerie Cerra for helpful comments and suggestions. This paper was originally prepared as a background study for the Cluster Report on Trade Integration in Latin America and the Caribbean (IMF 2017).
3 I. INTRODUCTION Faltering growth after the global financial crisis has left many countries in search of new drivers of economic growth. Weaknesses in both domestic demand and trade have been exacerbated by limited space for countercyclical policies in some countries, a waning pace of trade liberalization and a decline in the growth of global value chains (WEO, 2016). Like other regions, Latin America and the Caribbean (LAC) has struggled to overcome the economic fallout from the crisis, especially as it was followed by the end of the commodity super-cycle that fueled growth across most of the region before the crisis. As higher trade could still help increase economic efficiency, productivity and overall activity, this paper considers the extent to which LAC is integrated into global markets to determine the potential for further integration as a pillar of the region s growth strategy. 2 Traditional measures of economic integration, such as trade openness, do not capture the complexity of interactions between trade partners and make it more difficult to parse various dimensions of connectivity. 3 We therefore turn to the rapidly developing literature on networks (e.g. Barabási (2016) and Newman (2003)) to disentangle the sources of integration, explore their network and growth effects, and understand how central the region is in the growing world trade networks (WTN). Network theory has been extensively employed in physics, biology, computer science and social networks, with researchers in some of these fields undertaking initial studies of the topological features and evolution of the WTN. 4 The application of network analysis indicators to the study the extent of global economic integration is now increasingly being applied to economics, including for understanding trade integration at both regional and global levels. 5 These alternative measures of trade integration have yet to be considered in-depth for LAC. 6 This paper assesses LAC s integration into the WTN. First, we reassess the extent of LAC s integration based on traditional measures of trade integration. We then consider alternative measures of LAC s trade integration based on network integration measures, including how this integration evolved over time, whether LAC s under-trading is primarily a result of the paucity of trade links or weak trade flows, and how central or important LAC countries are to the WTN. 2 Beaton, Cebotari and Komaromi (2017) for example assess the extent to which trade affects economic growth. 3 These measures suggest, for example, that LAC is less integrated into the WTN than other regions and that most economies in the region under-trade relative to fundamentals based on results from gravity models (IMF (2015)). 4 See, for example, Serrano and Boguña (2003), Garlaschelli and Loffredo (2005), Serrano et al. (2010). 5 For example, Kali and Reyes (2007), Fagiolo, Reyes, and Schiavo (2008), Iapadre and Tironi (2009), De Benedictis and Tajoli (2011), De Benedictis et al. (2013). 6 Reyes, Schiavo and Fagiolo (2007), for example, compare the dynamic integration of LAC and East Asian countries within the trade network up to They found the LAC region lagging behind in terms of the number and intensity of trade connections, largely reflecting a loss in centrality for Venezuela and stagnation in integration of large countries other than Brazil. World Bank (2015) looks at the connectivity of LAC s economies in the world trade and financial networks, largely from the perspective of the dynamics of the world s North-South integration, also contrasting it to the East Asian region. 3
4 We also compare LAC s integration in the WTN against fundamentals-based benchmark networks. We estimate two models of trade network formation (binary and weighted), in both cases drawing on the gravity model, and compare the actual degree of integration to the predictions of these models. The paper finds that, while LAC appears weakly connected into the WTN by traditional measures like trade openness, it is relatively well connected in terms of the number of trading partners, with the trading links of most countries in line or above what can be predicted based on country size or gravity models. Nevertheless, a number of countries remain under-connected due to the concentration of their exports to a few destinations (e.g. Mexico exports are primarily destined to the United States), preventing the region from reaching a critical threshold of connectivity that would allow it to play a more central role in the WTN. LAC s integration in terms of the intensity of the trade flows is somewhat weaker. While the average size of the nominal trade flows is boosted by the strength of Mexico s integration in the U.S. supply chains, many countries in the region have weaker nominal flows than could be predicted based on fundamentals. In relative terms, however, such under-trading is more pronounced in smaller countries in the region, while in larger countries, especially Brazil, undertrading appears relatively small when the deviation of actual trade from the predictions of the gravity models is measured relative to the overall size of their trade flows. The strength of LAC s trade links is particularly weak within the region, reflecting the extraregional concentration of its trade due in part to the large share of commodities in the exports of many LAC countries. 7 The largest countries in the region (Mexico, Brazil) are not central to the LAC network, and play the role of only local hubs to their immediate neighbors or trade agreement partners. This leaves significant scope for larger countries to position themselves for a more central role in the regional subnetwork and boost regional integration. The remainder of this paper is organized as follows. Section II discusses data and methodological issues, section III presents trade integration measures based both on traditional and network centrality measures, section IV compares LAC s connectivity in the WTNs to that predicted by simulated models, and section V concludes. II. DATA AND METHODOLOGY To assess the extent of LAC s integration into the WTN, we construct both a binary and weighted version of the WTN. Data is obtained from the IMF s Directions of Trade Statistics (DOTS) database, which reports annual data on bilateral exports over the 1948 to 2015 period. 8 7 See Ding and Hadzi-Vaskov (2017) for an analysis of the composition of trade in the region and its determinants. 8 The DOTS database contains annual, quarterly, and monthly trade data for approximately 184 countries as of 2015, although the number of countries varies by year. Monthly and quarterly series are available starting 1960 and annual series are available starting It presents current figure on the value of merchandise exports and imports (continued ) 4
5 In both networks, the countries are the nodes or vertices, which are connected through edges or links. Since the trade links run from one node to another, both networks are directed networks, as opposed to undirected ones where the link runs in both directions. The binary (or unweighted) network is based on an export-import matrix reflecting the existence (1) or not (0) of a trade link between two countries. The second is a weighted network, where entries reflect the size of trade flows from exporters (rows) to importers (columns). For each of these networks, we construct a few key measures of integration from the network literature, which are defined in more detail in Annex I: Degree is the number of total trade links (partners), often measured relative to the total number of possible links in the binary network. Since the trade network is directed, each node/country has an in-degree and an out-degree, reflecting the number of import and export partners, respectively; Strength is the intensity of a trade connection in a weighted network, i.e. the sum of all (import and export) bilateral trade flows of a country in the network, frequently scaled by the sum of all trade flows in the network. As with degree, in-strength and out-strength refer to the intensity of the country s import and export links, respectively; Eigenvector centrality measures a country s connectivity to many or important links, with weighted and unweighted counterparts; in- and out-eigencentrality measure connectivity to central importers and exporters, respectively; Closeness centrality: the average geodesic distance to other nodes in the network; 9 and Betweenness centrality: the number of shortest paths connecting all nodes (countries) in the network to all other nodes that pass through the node of interest; high-betweenness is akin to being a network broker. The available bilateral trade data includes only data on trade in goods, therefore both traditional and network indicators may notably underestimate the integration of countries with a heavy reliance on services, such as the Caribbean countries whose exports are concentrated in tourism services. III. HOW INTEGRATED IS LAC IN THE WORLD TRADE NETWORK? A. Traditional Measures of Integration By traditional measures, LAC appears weakly integrated into the WTN. Despite accounting for about 8 percent of global economic activity in 2015, the region accounted for only about 5.1 percent of global exports of goods and services. In 2015, LAC s trade (exports and imports) disaggregated according to a country s primary trading partners. Imports is reported on the basis of Cost, Insurance and Freight (CIF), while exports are reported on a Free on Board (FOB) basis. 9 The shortest path through the network from one node to the other. 5


6 represented only 44 percent of regional GDP, well below that of other emerging market economies in all regions of the world (Figure 1). While the region liberalized trade and benefited from increased trade openness in the late 1980s and early 1990s, its openness has remained relatively stable since the beginning of the 2000s. The large economies of South America drive LAC s low average trade openness. There are significant cross-country differences in the region s openness to trade, with openness ranging from 25 to 125 percent of GDP. The large economies of South America are the least open to trade, especially Brazil and Argentina, where trade accounts for only 27½ percent and 24 percent of GDP respectively. Central American and Caribbean economies are much more open to trade, reflecting the relatively small size of these economies and related limited domestic production, which increases their reliance on imported goods and services. Mexico is also relatively more open compared to South America, despite its large size, due to its proximity to the United States and the low barriers to its trade with the United States after the North American Free Trade Agreement (NAFTA) came into force in Figure 1. Trade and Trade Openness in Latin America and the Caribbean World Trade Network: Regional View Distribution of Trade Openness Indicators, World Note: The size of each node is proportional to each region s trade flow; the width of each link reflects trade values and the color is same as the exporting region. 100% Evolution of Trade Openness by Region Trade Openness (in percent of GDP) 90% 80% 70% 60% 50% 40% 30% LAC Emerging and Developing Asia 20% Emerging and Developing Europe Sub-Saharan Africa 10% Middle East and North Africa 0% Source: IMF World Economic Outlook Trade Openness in LAC Countries Trade Openness in Latin America and the Caribbean (in percent of GDP) ARG BRA VEN COL PER ECU URY CHL BOL PRY SUR GUY BLZ CRI SLV GTM HND NIC PAN BRB HTI TTO JAM DOM MEX South America Central America Caribbean Source: IMF World Economic Outlook 6

7 B. Overview of the Trade Network Network analysis provides a useful visualization of the WTN (Figure 2). Both the geographical and the centrality representations of the WTN suggest that the LAC region is integrated but not very central to the world network when the size of trade flows is taken into account. 10 Under the centrality representation where countries that receive most of the top flows are the ones pulled closer to the center of the network the United States, China and major European economies are clearly the most central to the WTN. The clustering of the WTN broadly around regional boundaries is also evident. LAC clusters closer to the United States, as trade has traditionally been concentrated with this northern neighbor. More recently China has also gained prominence as an important export market for LAC s commodity exporters as the cost of trade has declined and commodity exports to Asia have increased. In other regions, North Africa is closely integrated into European networks, while the Middle East, Africa and Asia are closely interlinked. The Caribbean region remains on the periphery of the WTN but, given the small size of many of these economies, prospects to occupy a more central role in the global network are likely limited. Figure 2. Latin America and the Caribbean Trade Network Geographic View Note: The charts show top 5 export flows for each country in 2015, in the world and LAC trade networks respectively. Node position is determined by geographic location, with size of the node proportional to the size of captured trade flows and size of edge proportional to the size of the bilateral trade flow. 10 In both charts in Figure 2, the countries that receive most of the top 5-10 trade flows are generally the larger ones economically or in terms of trade, and hence the most integrated in the weighted trade network as we will see later. 7

8 Centrality View Note: The charts show top 10 export flows for each country in 2015, in the world and LAC trade networks respectively. Node position is determined by number of links each node is attached to, with country that has more links placed towards the center. Size of the node is proportional to the size of trade and color of the link is the same as export originating country. C. Integration on the Extensive Margin (Degree) LAC is well integrated within WTN based on the number of its trading partners (i.e. market diversification, or degree). LAC is somewhat more diversified than the world average in terms trading partners, trading with about 70 percent of all countries as of 2015, lagging only North America, Europe and MENA (Figure 3). This suggests that at least some of the fixed costs of penetrating new markets have already been incurred by many of the region s exporters. Although the average number of trading partners in LAC is higher than that of Asia, this reflects a more unimodal distribution of trade links across countries compared to a strongly bimodal distribution in Asia: Five large countries in LAC are highly integrated into the WTN, with very well-diversified trade links (Brazil, Colombia, Argentina, Peru, and Chile). These countries, which account for about 60 percent of the region s GDP, have trade links that, on average, cover about 91 percent of all potential global trading partners. This is above or close to the 75th percentile of the global distribution of countries degree (Figure 3c). By contrast, the top 13 most integrated countries in Asia (of which 8 are emerging markets) have trade relationships with 96 percent of potential partners a higher connectivity than the top LAC countries. However, the regional average for Asia is lowered significantly by the weak 8


9 connectivity of its small remote islands and less developed countries, which give its degree density a bimodal distribution. 11 The remaining countries in LAC have a more limited number of trade connections. The degree distribution in Figure 3b suggests that most countries in the region have trade links with around 60 percent of the potential global trade partners, although as we will see later this lower connectivity is well explained by traditional gravity variables, including the size of the economy. Mexico, which accounts for about a quarter of LAC s GDP, is among the least integrated countries in an unweighted network because of its strong trade with the United States. Mexico has trade links with only half of its potential partners. Like Mexico, Panama, Belize, Guyana and Suriname are linked with only half of the countries. Larger economies tend to have more trading partners, and hence occupy a more central role in the WTN (Figure 3d). The correlation between the number of trade links and the (log) size of the economy is high, at 0.8. Even accounting for the size of the economy, Mexico, Panama and Venezuela stand out in the region as having lower diversification than one would expect for their size. 12 In subsequent sections, we will test formally the importance of country size as a determinant for trade integration. The Caribbean region has the weakest market diversification in terms of trade in goods, with less than half of all possible trade links realized. This reflects both the small size of their economies, a very strong trade integration within the Caribbean region itself and weaker links with the rest of the world, as well as the fact that data covers only trade in goods at a time when services account for the largest share of their GDPs. 13 Figure 3. Degree Centrality of LAC, 2015 a. Degree Distribution by Region* b. Degree Density 11 Figure 3 treats the smaller Caribbean islands separately from the rest of the LAC region, to discern potentially different connectivity features. Like the smaller Asian economies, they are also less connected on average than the rest of the LAC region. 12 For Panama, to a large extent this likely reflects the concentration of Panama s trade in services whereas the bilateral trade data from DOTS used to assess the patterns of trading partners includes only trade in goods. 13 There is no comprehensive bilateral trade in services data. 9
, median, lower quartile and minimum of individual country trade ratios Integration")

. Part of this increase in degree is attributable to the increase in the number of countries reporting bilateral trade data to DOTS.")
10 Figure 3. Degree Centrality of LAC, 2015 (Concluded) c. Degree in LAC by Country d. Degree and Size of Economy * The box plot shows the maximum, upper quartile (median of the upper half of a data set), median, lower quartile and minimum of individual country trade ratios Integration along the extensive margin has been fast across all regions, but particularly in LAC. The region has grown the fastest in terms of its trade links, increasing its number of reported partners by about 70 percent on average over the last 20 years. As in the rest of the world, the bulk of this growth in the number of trade partners has happened between late 1980s and late 1990s, as evident in the significant shift in the degree distribution during this period (Figure 4a). Part of this increase in degree is attributable to the increase in the number of countries reporting bilateral trade data to DOTS. However, this period also corresponds to the region s efforts to liberalize trade. Within LAC, the evolution of degree has not been uniform. The largest countries have moved fast toward close to full integration - similar to many emerging Asian countries but this type of integration on the extensive margin stagnated for Mexico in the 1970s (Figure 4b). Figure 4. Evolution of Degree Centrality* a. Regional Means Over Time b. Evolution for Selected Countries 2 Degree: Regional Comparison TOTAL DEGREE Africa Asia CAR Europe LA MENA NorthAm *Regional averages measured as simple averages for reporting countries, with data more complete after The large decline in degree around reflects the disintegration of the soviet bloc, with newly formed countries bringing down the regional averages due to still low integration in the global trade networks. 10


11 D. Integration on the Intensive Margin (Strength) Weak trade integration largely reflects weak trade flows rather than an inability to penetrate diversified markets. Under the basic measure of integration in a weighted network namely, strength or sum of nominal trade flows at country level LAC lags behind the most integrated regions (North America, Asia, and Europe) (Figure 5). The relatively small size of its economies explains their low strength centrality, but the latter is also due to the weak trade flows relative to the economy in some large countries (especially in the case of Brazil, Argentina, Colombia and Venezuela, Figure 6). Figure 5. Strength of Trade Links Figure 6. Strength and Size of Economy (2015) Despite the low average strength of LAC s trade integration, Mexican trade flows stand out both in the region and in the world. Mexico ranks 13th in the world in terms of its strength score in the WTN (after the U.S., Canada, China, Hong Kong, and largest European countries), in large part reflecting the size of its economy, (Figure 7). Bilateral export flows from Mexico to the United States are the third largest in the world in 2015, following the export flows from China and Canada to the United States, while exports from Brazil to China ranked 75th in the world (Figure 8). Figure 7. Strength by Country (2015) Figure 8. Top 15 Trade Flows in the WTN (2015) Note: Strength score measures the nominal trade flow scaled by number of all countries in the world less one. Note: The left nodes are the exporters and the right nodes the importers. 11
12 E. Other Centrality Measures While the network concepts of degree and strength measure direct connectivity within the WTN, other centrality measures reflect additional aspects of relevance in the network. Eigenvector, betweenness or closeness centrality which measure, respectively, the importance of network nodes in terms of connectivity to important players, brokering between players, and closeness to connected players may be relevant in the case of trade networks as measures of integration in global value chains, of the importance of countries as amplifiers of external shocks given their position in the network, or of the vulnerability of countries to spillovers from such shocks. For instance, eigencentrality is positively correlated with measures related to country participation in global value chains, such as the foreign value added in its gross exports (Figure 9) 14. Centrality measures are strongly correlated with degree and strength (Figure 10). Most of the measures (closeness, eigencentrality) have a strong linear correlation among themselves and with degree centrality, driven by the high density of the WTN compared to other social or technological networks. In particular, the average density of the WTN was 0.56 in 2015, suggesting more than half of the potential connections have been realized. Betweenness, on the other hand, has an exponential relationship with the remaining measures, suggesting a country needs to accumulate a certain threshold of bilateral connections before becoming a network broker or hub. Figure 10 reports the correlations in the unweighted networks, whereas the correlations of the weighted measures with strength centrality is similarly strong in the weighted networks, but not reported here. 14 The upstream component of a country s total GVC participation the indirect value added, or the value of exported goods that are used as imported inputs by other countries to produce their exports shows only a weak correlated with eigencentrality. 12
 Note: The off-diagonal scatters show the bi-variate correlations between the measures, while the diagonal charts")

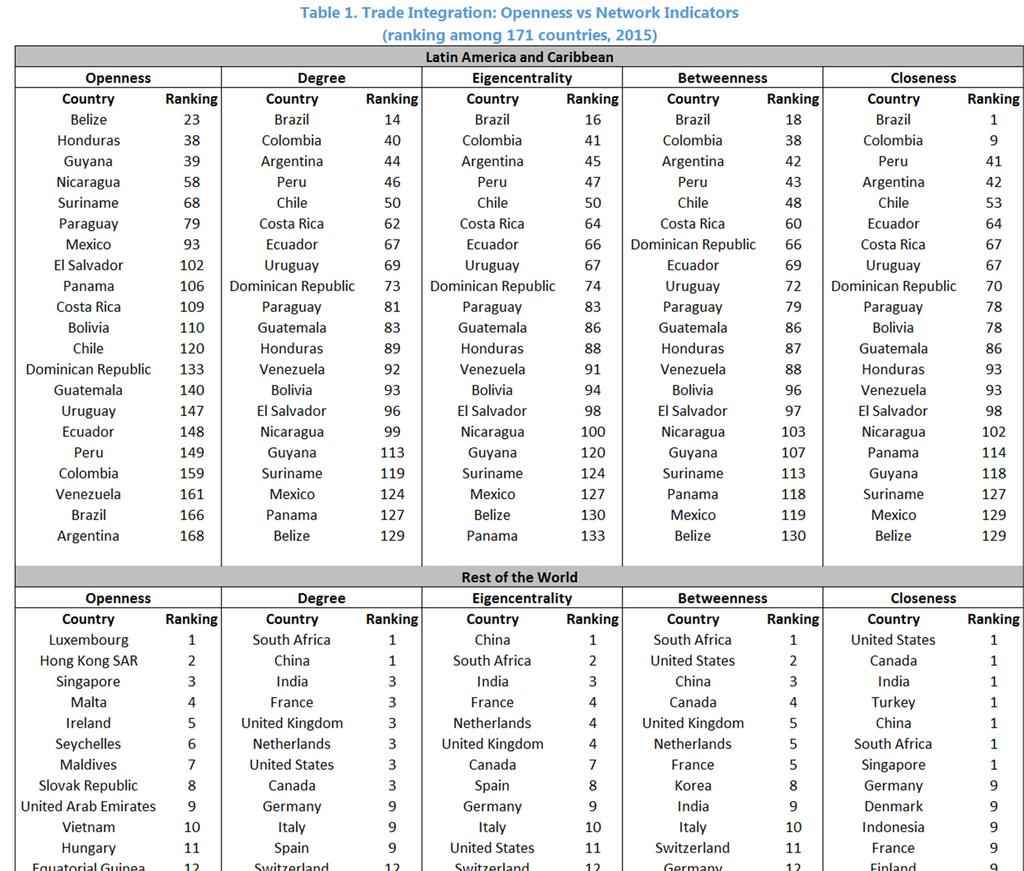
13 Figure 10. Distribution and Correlation of Main Trade Network Measures (Unweighted network, 2015) Note: The off-diagonal scatters show the bi-variate correlations between the measures, while the diagonal charts show the distribution of each measures. The high correlation of network measures drives the consistent relative rankings of regions under these measures. In unweighted networks, where the size of the flows is not taken into account, regional integration into the WTN is similar to that of degree. Based on simple averages, the North American region is by far the most connected, followed by Europe in second place, Middle East and Latin America as close thirds and finally followed by Asia, Africa and the Caribbean region. The regional rankings of betweenness centrality break this pattern, with the high connectivity of many Asian countries pulling the region ahead of Latin America in terms of this broker-centrality measure (Figure 11). Because of the high correlation of the 13

14 measures in the WTN, the paper will focus primarily on degree and strength in discussing integration. Looking at trade integration from the viewpoint of the number of trade channels has provided a different perspective than traditional indicators of trade openness, which rely on the volume of trade. Table 1 includes the rankings of countries in the LAC region and the top 20 countries in the world for trade openness and for the network connectivity indicators discussed above. The largest countries in the LAC region and in the world are often the ones with the lowest trade openness, but they are among the most integrated in terms of the number of trade links. For example, US, China, Brazil, Argentina and Colombia, are in the bottom decile of the world distribution of trade openness as measured by trade-to-gdp ratio, but the first three are in the top decile for almost all other measures of centrality in the WTN. Argentina and Colombia follow close in the third decile. In the LAC region, the five most integrated countries across all indicators are Brazil, Argentina, Colombia, Peru and Chile, as already noted above. The next five spots in the rankings are taken interchangeably by Costa Rica, Ecuador, Uruguay, the Dominican Republic and Paraguay (6 percent of the region s GDP). The embedded chart (Figure 12) confirms that the information provided by trade openness is quite orthogonal to the information provided by the number of country s trade links, for example, although a clear negative relation exists for the LAC region: the countries with the lowest trade- GDP ratios are on average the ones that have the largest number of trade connections, and vice versa. F. Integration Within Latin America Viewed independently from the rest of the world, the LAC trade network is the densest regional network (Figure 13a). It has almost perfect connectivity among countries, with 97 percent of the export and import links realized, in part because it has the smallest number of countries (North America excluded). The large countries, which are most integrated in the WTN, have only marginally higher degree in the LAC networks (Figure 13b). One exception is Brazil, which has established a higher share of potential trade links in the world than in the region, although the difference is marginal. Smaller countries in the region are much better integrated within the regional network, and several are overtaking the largest countries as the most integrated (Costa Rica, Dominican Republic, Trinidad and Tobago). 14
15 15

.")


16 Figure 13. Degree Centrality in Regional Subnetworks a. Degree Density by Region b. LAC Degree in World Network vs LAC Subnetwork The larger countries in LAC do not play important regional roles as hubs. As in the case of degree centrality, the largest countries in LAC maintain their centrality in the regional networks under the other network measures (such as eigenvector, betweenness and closeness centrality). However, Brazil s eigencentrality score is higher in the WTN than in the regional one given its weak regional connectivity to important players (Figure 14). In the region, Brazil is mostly a regional hub for Mercosur countries, as we discuss below and has weaker trade with large countries like Mexico, while in the WTN it is strongly connected with the two largest nodes (United States and China). In terms of betweenness centrality, which reflects a country s role as network broker or hub, the centrality of Brazil and Argentina in the regional networks is also only marginally higher than in the world network despite the relative dominance of their economies in terms of size, again pointing to a weak regional role. While Mexico plays a more central role in regional networks than in world networks due to its hub role for Central American countries, it remains among the least connected countries in the regional (binary) network (Figure 15). Unlike larger countries, smaller countries again take on a more central role 16

17 in the regional networks, especially in the case of betweenness centrality, due to their stronger connectivity within the region rather than the world. The lack of strong regional hubs is apparent in the regional network chart in Figure 16, where no country is clearly centered in the network and there is apparent clustering along regional or trade agreement lines. Figure 16. Latin America and the Caribbean Trade Network Note: The charts show top 10 export flows for each country in 2015, in the world and LAC trade networks respectively. Node position is determined by number of links each node is attached to, with country that has more links placed towards the center. Size of the node is proportional to the size of trade and color of the link is the same as export originating country. LAC trade is more concentrated outside the region compared to the rest of the world (Figure 17). With only about a 15 percent of total exports destined to regional markets, LAC lags developed economies in Asia and Europe, where regional destinations account for well over 50 percent of exports. This is in part the product of the high concentration of the region s trade in commodities given its natural resource endowments and the strong trade links between Mexico and the United States, which explains the high trade integration of the region with United States and China. Among LAC countries, Bolivia, Paraguay and Uruguay stand out as more regionally integrated given their concentration of exports to Brazil as part of the Mercosur free trade agreement. Central America is another region that shows a higher degree of intra-regional integration. Moreover, the regional concentration of trade is less pronounced than concentration of outside trade: while the Brazilian market is clearly important for some economies, its role as a hub is more pronounced for its immediate neighbors and Mercosur partners (Argentina, Paraguay, Uruguay, and Bolivia as an associate member). It still features as one of the top three export markets in several countries in the region (Chile, Colombia, Peru, Venezuela), but in a much less important role. At the same time, Mexico takes over the hub role more clearly for the Central American countries. 17


; (ii) the Andean Community, established in 1969, and currently covering Bolivia, Colombia, Ecuador")
 NAFTA, a 1994 free trade agreement between Mexico, the United States and Canada; and (vi) the Pacific Alliance, established in 2012 by")
18 In addition to the region s generally outward trade orientation, lack of a clear regional hub may also reflect the fragmentation of the region s trade agreements, which form the basis for the six regional trade blocs, each with relatively limited regional coverage, and diverse preferences and rules of origins. 15 Moreover, limited trade and absence of a trade agreement between the region s largest economies, Mexico and Brazil, is further limiting the scope of intra-regional trade. 16 Figure 17. Latin America Inter-and Intra-Regional Trade 15 The six regional blocs include: (i) the Central American Common Market, established in 1960, with its members becoming part of a 2004 trade agreement between Central America, Dominican Republic and the US (DR- CAFTA); (ii) the Andean Community, established in 1969, and currently covering Bolivia, Colombia, Ecuador and Peru; (iii) CARICOM, established in 1973 and covering all countries in the Caribbean except the Dominican Republic; (iv) Mercosur, established in 1991 and currently covering Argentina, Brazil, Paraguay and Uruguay; (v) NAFTA, a 1994 free trade agreement between Mexico, the United States and Canada; and (vi) the Pacific Alliance, established in 2012 by Chile, Colombia, Mexico and Peru, For more detail on the LAC trade agreements see IADB (2017). 16 Discussions for closer trade integration have been underway since 2015, but no specific agreement has been announced as of early
, reflecting the role of the United States as a clear hub for LAC trade; a second cluster is formed by Europe and North")
19 The trade patterns above are also reflected in the clustering properties of the WTN. Within the WTN, five distinct trade communities or clusters can be identified (Figure 18a). One cluster is formed by North and Latin America (including Cuba, Jamaica), reflecting the role of the United States as a clear hub for LAC trade; a second cluster is formed by Europe and North Africa; and yet another by Middle East, Asia and Sub-Saharan Africa due to their close connectivity to China. Caribbean countries largely those in the Eastern Caribbean Currency Union (St. Lucia, Grenada, Dominica, St. Kitts and St. Vincent), Barbados and Trinidad and Tobago, all members of the Caribbean Community (CARICOM) trading bloc form a separate cluster quite distant in terms of strength of trade links from the rest of the world, given close trading in terms of goods. Two remote islands in Asia that are weakly connected to the rest of the world (Samoa and Tonga) form a separate group altogether. This breakdown into trading communities can be more intuitively seen in another representation of the WTN that focuses only on the top two import partners for each country and places countries with more top links towards the center of the chart (Figure 18b). Figure 18a. World Trade Network: Trade Communities (2015) Note: Calculated using the walktrap community detection algorithm with two steps. The figure excludes the fifth community formed by Tonga and Samoa due to its remoteness from the rest of the nodes in the network. The position of the nodes within the cluster does not reflect its centrality in the 19

.")
20 Figure 18b. World Trade Network: Top Links and Clustering (2015) Note: The network is based on directed-force algorithm. For each country, only the export flows toward the top two trading partners are considered. The size of the circle associated to each country is proportional to the number of inflows; different colors correspond to different geographical regions. Within the LAC region, the trade patterns discussed above are also consistent with the clustering of regional trade around trade agreements and neighboring countries (Figure 19). Four clusters can be identified within the LAC trade network: (i) the Mercosur cluster (including associate member Bolivia); (ii) Mexico and a few Central American and Caribbean countries (Dominican Republic, Panama, Suriname and Guyana), with Mexico serving as the hub; (iii) smaller Central America and Caribbean countries; and (iv) members of the Andean Community and Pacific Alliance (other than Bolivia). There is no clear trading hub comparable to China in Asia or Germany in Europe where these countries form the center of a regional value chain: importing (intermediate goods) from within the region and exporting to large markets (IMF 2015). The region has also yet to reap the advantages of Mexico s strong relationship with the U.S. market to develop Mexico into a regional hub, other than for some Central American countries. 20
21 G. Network Integration and its Growth Effects Increasing connectivity within the trade network may have benefits beyond those implied by trade openness alone. In related work, we find evidence that a more central position in the trade network is associated with stronger growth outcomes, even after controlling for traditional measures of integration such as trade openness (Beaton, Cebotari and Komaromi (2017)). 17 Degree centrality (increasing the number of total trade partners, especially on the export side) and eigencentrality (connectivity to connected importers and exporters) matter for higher economic growth, likely reflecting additional gains from technology and knowledge diffusion through connectivity, on top of strength of the trade links alone (Figure 20). We also find that connectivity to the most connected importers in the world trade network (i.e. the top 3 countries with highest in-eigencentrality measures) could boost growth beyond traditional volume-based measures, although a concentration of trade with most connected exporters does not appear to confer such benefits. Trade connectivity with regional partners (in this case measured by the shares of intraregional exports to total exports) is also associated with larger growth effects than connectivity outside the own region, suggesting considerable scope for LAC countries to boost growth through stronger intraregional trade. Figure 20. Trade Connectivity and Economic Growth (impact on 5-year average real per capita growth rate from moving from the 25 to the 75 percentile of trade statistic; in percentage points) Number of trading partners (Total degree)*** Number of countries export to (Out Degree) * Number of countries import from (In Degree) Centrality in the world trade network (Eigencentrality) *** Centrality among exporters in the world trade network (Out eigencentrality) Centrality among importers in the world trade network (In eigencentrality) Source: Beaton, Cebotari and Komaromi (2017) Note: Based on system GMM estimates of the impact of trade on growth. Each trade variable is included in a distinct growth regression with the exception of in and out degree and in and out eigencentrality, which are included simultaneously in two distinct growth regressions. ***p<0.01, **p<0.05, *p<0.1. IV. INTEGRATION IN ACTUAL VERSUS BENCHMARK TRADE NETWORKS In this section, we compare the connectivity of the actual trade networks with that predicted by benchmark networks. As benchmarks, we simulate two models of trade network formation: one for the binary network (where the export-import matrix has ones if there is a bilateral trade link and zero otherwise) and one for the weighted network (where the export-import matrix reflects the actual nominal flows). Gravity models are traditionally used to estimate weighted models, but we apply gravity variables to also simulate a binary network formation. 17 Kali and Reyes (2007) find similar results. 21

22 A. Binary (Unweighted) Networks: Actual vs. Benchmark Methodology To simulate a benchmark binary trade network, we estimate a LOGIT model where the outcome variable ( is 1 if there is an export link from country i to j, and the explanatory variables are the traditional gravity variables, such as size of the economies and trade costs: LOGIT ln ln ln 1 where trade costs are proxied by the (log) distance between countries i and j, and by dummies for contiguity, common language, colonial relationship, common colonizer post 1945, being landlocked and for existence of regional trade agreement in force. 18 To transform the model-estimated probabilities of country i exporting to country j into a binary variable of the existence or not of a trade link, we set a cut-off probability above which we would predict that an export link is formed and below which no link is formed. This cut-off probability is chosen to ensure that the density of the simulated world network is the same as the density of the actual world network for each year. 19 Thus, the probability cut-off averages about 46 percent in the 1980s, increasing gradually to 52 percent by Results Results of the gravity model estimated with the binary trade network suggest that all gravity variables are highly significant in affecting the likelihood of countries trading with each other (Table 2). As we have seen earlier in the simple scatter of degree and country size, the incentives to form bilateral trade links are closely related to the size of the economy. Larger countries tend to trade with more destinations, and trade links with larger trading partners are more likely: an increase in the own or partner s GDP by 1 percent increases the odds ratio of having a trade link by percent. As expected, distance or being landlocked reduced the probability of establishing a trading relation, while common language and a former colonial relation positively affect the odds of having trade 18 GDP data are from the IMF s World Economic Outlook (WEO) database, while geographic and demographic variables (such as distance, language and colonial relationship) are from the CEPII database. 19 This approach is similar to Serrano et al (2010) and Dueñas and Fagiolo (2011), who use a hidden-variable model in conjunction with the gravity model to determine thresholds for matching the actual density of the trade networks. 22
23 links. The coefficients and their significance are robust to whether the estimation is done with or without fixed time effects. How well does this benchmark model predict the topology of the actual WTN and LAC s integration within the WTN? Using the estimated logit-gravity model, we construct the predicted binary trade network, calculate the usual network statistics for the predicted network, and then compare the predicted network indicators to indicators in the actual WTN. The predicted data matches relatively well the cross-country and time-series structure of the actual data. The evolution of degree or number of trading partners is well explained by the dynamic elements of the gravity model (economic growth) and the overall density of the world networks. Figure 21 presents the results for the LAC and Asia regions of this comparison. For both regions, the gravity model predictions closely match the actual evolution of trade relationships, although for Asia trade integration (on average) has consistently albeit marginally exceeded the predictions of our estimated gravity model. Figure 21. Network Centrality: Actual vs Predicted (Timeline) Since the models by construction matches the degree of the entire network, we focus on how well it replicates individual country connectivity. Figure 22 compares predicted to actual degree (with the remaining measures broadly similar due to their high correlation). Mexico, Venezuela and Panama stand out as being significantly less diversified than predicted from the logit-gravity model, whereas many smaller countries are better connected relative to predictions (especially Belize, Suriname, Nicaragua and Paraguay). The high integration of the five countries with the largest degree centrality in the region can be fully explained with the logit-gravity model. 23
 Compared to the predictions of the logit-gravity model for degree, the estimates of the other network measures are less accurate in replicating the")
24 Figure 22. Degree Connectivity: Actual vs Predicted (2015) Compared to the predictions of the logit-gravity model for degree, the estimates of the other network measures are less accurate in replicating the topology of the WTN (Figure 23). In the case of eigencentrality, for example, the results suggest that both LAC and Asia are less integrated as measured by out-eigencentrality compared to predictions from the model. In contrast to LAC, however, Asian economies were able to narrow their underperformance over time, particularly since the early 2000s (notably marked by China s accession to the World Trade Organization in 2001). Asia s catch up over the past ten years may also be attributed to its relatively stronger integration into global value chains. 24
25 Figure 23. Network Eigencentrality: Actual vs Predicted (Timeline) B. Weighted Networks: Actual vs. Predicted After comparing the binary WTN to its benchmark, we turn to the simulated benchmark for the weighted WTN. To simulate a weighted network, we use the trade flow predictions from nonlinear specification of the gravity model, estimated with Poisson pseudo-maximum likelihood (PPML): exp ln ln ln 2 where the variables are the same as in regression (1) above, but now represents the nominal exports from country i to j. 20 The regression coefficients from the PPML estimation in Table 3 are highly significant and of the expected sign, with the exception of the colonial relationship (which has a negative 20 The PPML specifications has a number of advantages over OLS estimates, including (i) the possibility of keeping the zero observations, since the estimation is on the level of exports and not on the logs; (ii) the error variance of bigger countries is bigger, so higher observed trade flows are also assumed to be more uncertain and a smaller weight is put on minimizing the residuals of big countries when estimating the coefficients; and (iii) if the error term in the original non-linear model is heteroskedastic, then the error term in the log-linearized model will be correlated with the explanatory variables, and OLS will be inconsistent. 25
26 correlation with export flows). On the basis of the predicted trade flows, we construct the weighted adjacency matrix and calculate the weighted network measures (including strength and weighted eigencentrality). Comparing the benchmark network measures to the actual data suggests that most LAC countries are more weakly integrated into the WTN than predicted by the gravity model (Figures 24, 25). To better gauge the significance of the deviations of strength centrality from its predicted levels given that the model errors appear to be proportional to country size we scale the strength gap by its predicted value. 21 Adjusting trade flow deviations by the size of the flow makes it more clear that trade underperformance in the large countries is in fact relatively small (for example, only around 6 percent in the case of Brazil), while smaller countries like Panama and Belize show much larger underperformance in percentage terms (Figure 25). Only a few countries in the region show higher-than-predicted strength (Paraguay, Bolivia, Mexico, Chile and Nicaragua). Relative to the size of the trade flows, Paraguay and Bolivia appear to over-trade the most, while Mexico over-trades at broadly similar levels as Chile. The qualitative results for other weighted network measures are in line with the ones for strength, and are not reported here. Table 3. Gravity Regression results: PPML Explained variable: exports Coef. Ln GDP Exporter 0.818*** Ln GDP Partner 0.839*** Ln Weighted Distance *** Contiguity 0.599*** Common language 0.463*** Colonial relationship *** Common colonizer 0.888*** Landlocked *** Regional trade agreement 0.209*** Pseudo R Observations 902,150 * p < 0.05, ** p < 0.01, *** p < Figure 24. LAC Trade: Relative to Predictions from Gravity Equation (percent deviation of actual exports from predicted, all trading partners) PRY BOL MEX CHL NIC ECU SUR GUY BRA VEN CRI PER ARG SLV HND COL GTM URY DOM BLZ PAN Caribbean* *The Caribbean region excludes the Dominican Republic, which is shown separetly on the chart. 21 This is equivalent to scaling bilateral export gap by predicted exports, when strength is not scaled by total flows in the network to begin with. 26
 The weak regional role of large LAC countries becomes apparent again when we compare actual strength with the predictions of the benchmark for the")
27 Figure 25. Strength Connectivity: Actual vs Predicted (2015) The weak regional role of large LAC countries becomes apparent again when we compare actual strength with the predictions of the benchmark for the LAC regional subnetwork. Figure 26 shows the percent strength gaps calculated for the regional subnetwork, i.e. it compares the sum of actual exports to LAC countries to the sum of predicted exports to LAC countries. As was the case for the world network, most countries in LAC appear to under-trade regionally as well. Both Chile and Mexico, who have been over-trading in the context of the world network, are estimated to under-trade with regional partners. This reflects the clear extra-regional integration of both countries, and in the case of Mexico its connectivity to the U.S. On the other hand, El Salvador and Costa Rica under-trade globally but have strong regional ties. Bolivia, Paraguay and Nicaragua are estimated to overtrade both in the work and regional networks. Figure 26. LAC Intra-regional Trade: Relative to Predictions from Gravity Equation (percent deviation of actual exports from predicted, LAC trading partners) BOL PRY NIC SLV CRI BRA MEX GUY HND DOM CHL GTM ECU ARG COL PER URY VEN BLZ SUR PAN Caribbean* *The Caribbean region excludes the Dominican Republic, which is shown separetly on the chart. 27
28 It is worth noting that the underperformance in the LAC weighted strength relative to the model is a relatively recent phenomenon, with the actual data matching the benchmark predictions very closely until 2010 (Figure 27). In other words, the volume of trade flows has not kept up with the predictions implied by the evolution of the LAC and partner economies and/or has not reaped the full benefits of the trade agreements. In contrast, Asia has consistently overperformed against the predicted trade flows. Figure 27. Evolution of Strength Connectivity: Actual vs. Predicted V. CONCLUSIONS This paper has looked at LAC s trade integration from the perspective of connectivity within world and regional trade networks, drawing on the network analysis literature. In addition to connectivity indicators, it compares trade integration of LAC countries to the predictions of simulated binary and weighted trade networks, generated on the basis of gravity models, to determine whether the region is indeed under-trading relative to its peers. The focus on network indicators helped provide additional insights into the nature of LAC s trade integration, relative to traditional measures such as trade openness. They have helped show that relatively closed countries in the region by traditional trade integration measures like openness are also among the most integrated in terms of the number of trade links and play a central role in trade networks based on trade relations alone. On average, LAC is relatively well connected in terms of market diversification, although there is room for further integration. The connectivity of most countries in the region is in line or above what can be projected based on the size of their economies or gravity-based models, but many countries are still underconnected either due to the concentration of their exports geographically (Mexico) or in terms of composition (Venezuela). This, along with the region s relatively weak participation in global value chains, prevents it from reaching a critical threshold of connectivity that would allow it to play a more central role in the WTN. 28
29 LAC s integration in terms of the intensity of the trade flows is somewhat weaker, including relative to the predictions of the gravity model. The strength of the trade links has generally been commensurate with the evolution of the regional economies, but appear to have slowed below these levels over the past few years. Mexico s integration in the United States supply chain have boosted the strength of its connectivity into the WTN, but other larger countries have lagged behind, reducing the overall centrality of the region in the world network. While undertrading by the largest countries drives the weaker integration in trade networks because of the sheer size of the flows, in relative terms their under-trading is limited: the percent deviation of actual trade from that predicted by the gravity model is much more evident in smaller countries rather than in larger ones like Brazil. The density of the LAC trade subnetwork is high due to the small number of countries in the region, but the strength of these connections is weak. This reflects the extra-regional concentration of their trade, with the United States playing the role of the region s trade hub. The largest countries in the region (Mexico, Brazil) are not central to the LAC network, and play the role of only local hubs to their immediate neighbors or trade agreement partners. There is significant scope for larger countries to position themselves for a more central role in the regional subnetwork, but the factors that could facilitate such integration are left for future research. 29
30 VI. REFERENCES Barabási, Albert-László, Network Science, 2016, Cambridge University Press. Beaton, K., Cebotari, A., and Komaromi, A., 2017, Revisiting the Link between Trade, Growth, and Inequality: Lessons for Latin America and the Caribbean, International Monetary Fund, Working Paper WP/17/46 De Benedictis, L., and Tajoli, L., 2011, The World Trade Network. De Benedictis, L., Nenci, S., Santoni, G., Tajoli, L., and Vicarelli, C., 2013, Network Analysis of World Trade using the BACI-CEPII dataset. De La Torre, A., Didier, T., Ize, A., Lederman, D., Schmukler, S., 2015, Latin America and The Rising South: Changing World, Changing Priorities, the World Bank, at Dueñas, M., and Fagiolo, G., Modeling the International Trade Network: A Gravity Approach, Ding, X. and M. Hadzi-Vaskov, 2017, "Composition of Trade in Latin America and the Caribbean," International Monetary Fund Working Paper 17/42. Fagiolo, G., Reyes, J., and Schiavo, S., 2008, On the topological properties of the world trade web: A weighted network analysis, Physica A: Statistical Mechanics and its Applications, 387(15): Garlaschelli, D., and Loffredo, M., 2005, Structure and evolution of the world trade network, Physica A: Statistical Mechanics and its Applications, 355(1): , Iapadre L., Tironi F. (2009), Measuring Trade Regionalisation: The Case of Asia, UNU-CRIS Working Papers, W-2009/9, United Nations University Comparative Regional Integration Studies, Bruges. Inter-American Development Bank (IADB), 2017, Routes to Growth in a New Trade World. International Monetary Fund, 2015, Trade Integration in Latin America and the Caribbean: Hype, Hope, and Reality, Regional Economic Outlook: Western Hemisphere, October (Washington: International Monetary Fund). International Monetary Fund, 2016, Global Trade: What's behind the Slowdown?, World Economic Outlook, Chapter 2, October (Washington, International Monetary Fund). 30
31 International Monetary Fund, 2017, Cluster Report: Trade Integration in Latin America and the Caribbean, IMF Country Report No. 17/66 (Washington). Kali, R. and J. Reyes, 2007, The Architecture of Globalization: A Network Approach to International Economic Integration, Journal of International Business Studies, Vol. 38(4): Newman, M. E. J., 2010, Networks: An Introduction, Oxford University Press. Reyes, J., Schiavo, S., Fagiolo, G., 2007, Using Complex Network Analysis to Assess the Evolution of International Economic Integration: The Cases of East Asia and Latin America. Serrano, A., Boguña, M., 2003, Topology of the World Trade Web, Physical Review. Serrano, A., Garlaschelli, D., Boguñá, M., Loffredo, M., 2010, The World Trade Web: Structure, Evolution and Modeling. 31
 that are connected together.")
32 Annex I. An Overview of Network Measures This annex provides definitions and formulas for various network analysis measures, drawn from Newman (2010). A network is a structure that made up of a set of objects (called nodes or vertices) that are connected together. A node or vertex is the fundamental unit of which network are formed, and the connections between the nodes are called edges or links. A weighted or valued network can be represented by giving the edge values equal to the weights of the corresponding connections, and a directed graph is a network in which each edge has a direction, pointing from one vertex to another. Annex Table 1. Network Measures Measure Definition Formula Degree The degree of a node is the number of connections it has to other nodes, often expressed as a fraction of total possible connections it can have. where 1 if there is a connection between j and i. A(0.33) F(0.33) The figure herein illustrates the degree centrality of the nodes in a hypothetical network. 1/ C(0.50) D(0.33) E(0.50) B(0.33) G(0.33) Strength Eigenvector Centrality The sum of weights attached to ties belonging to a node (e.g. value of total trade). Eigenvector centrality gives each vertex a score proportional to the sum of the scores of its neighbors. This is based on the concept that connections to high-scoring nodes contribute more to the score of the node in question than equal connections to low-scoring nodes. Inward eigencentrality considered only vertices that points out to vertex v and outward eigencentrality considers those that vertex v points to. where 1 if there is a connection between j and i and denotes the weight of such connection (in our cases it is the value of the trade flows). 1 1 where is the relative centrality A(0.74) F(0.74) score of vertex v. For a given graph G=(V,E) with V number of vertices, C(1.00) D(0.85) E(1.00) A, is the adjacency matrix, i.e., =1 if vertex v is linked to vertex t, and, =0 otherwise. B(0.74) G(0.74) M(v) is a set of neighbors of v and λ is a constant. 32
TRADE INTEGRATION IN LATIN AMERICA: A NETWORK
 March 2017 TRADE INTEGRATION IN LATIN AMERICA: A NETWORK PERSPECTIVE Approved By Valerie Cerra Prepared By Kimberly Beaton, Aliona Cebotari, Andras Komaromi, and Xiaodan Ding CONTENTS TRADE INTEGRATION
PTV South America City Map 2016 (Standardmap)
") PTV South America City Map 2016 (Standardmap) Map version name (Core) Map version name (Logistic) Release date (Logistics) Map version name (Logistics) (new) PTV_South_America_City_Map_2016 Data provider(s)
PTV South America City Map 2016 (Standardmap) Map version name (Core) Map version name (Logistic) Release date (Logistics) Map version name (Logistics) (new) PTV_South_America_City_Map_2016 Data provider(s)
PTV South America City Map 2018 (Standardmap)
") (Standardmap) Map version name (Core) Map version name (Logistic) Release date (Logistics) Map version name (Logistics) (new) PTV_South_America_City_Map_2018 Data provider(s) Technology Region Predecessor
(Standardmap) Map version name (Core) Map version name (Logistic) Release date (Logistics) Map version name (Logistics) (new) PTV_South_America_City_Map_2018 Data provider(s) Technology Region Predecessor
PTV South America City Map 2017 (Standardmap)
") PTV South America City Map 2017 (Standardmap) Map version name (Core) Map version name (Logistic) Release date (Logistics) Map version name (Logistics) (new) PTV_South_America_City_Map_2017 Data provider(s)
PTV South America City Map 2017 (Standardmap) Map version name (Core) Map version name (Logistic) Release date (Logistics) Map version name (Logistics) (new) PTV_South_America_City_Map_2017 Data provider(s)
About the Authors Geography and Tourism: The Attraction of Place p. 1 The Elements of Geography p. 2 Themes of Geography p. 4 Location: The Where of
 Preface p. ix About the Authors p. xi Geography and Tourism: The Attraction of Place p. 1 The Elements of Geography p. 2 Themes of Geography p. 4 Location: The Where of Geography p. 4 Place and Space:
Connectivity in the LAC region
 Cristián Varas, Speedchecker Ltd. Agustín Formoso, Lacnic Labs Connectivity in the LAC region A study made by LACNIC Labs and Speedchecker Ltd. Outline The challenge of measuring regions not well covered
Why has globalisation brought such large increases in exports to some countries and not to others?
 by Stephen Redding and Anthony Venables Why has globalisation brought such large increases in exports to some countries and not to others? Stephen Redding and Anthony Venables look at the way internal
UN-GGIM:Americas Regional Report
 UN-GGIM:Americas Regional Report 2016-2017 Seventh Session of UN-GGIM 2-4 August 2017, United Nations Headquarters, New York. Rolando Ocampo President of UN-GGIM: Americas Content Activities, Areas of
How Well Are Recessions and Recoveries Forecast? Prakash Loungani, Herman Stekler and Natalia Tamirisa
 How Well Are Recessions and Recoveries Forecast? Prakash Loungani, Herman Stekler and Natalia Tamirisa 1 Outline Focus of the study Data Dispersion and forecast errors during turning points Testing efficiency
Simulation of Gross Domestic Product in International Trade Networks: Linear Gravity Transportation Model
 Simulation of Gross Domestic Product in International Trade Networks: Linear Gravity Transportation Model Tsuyoshi Deguchi, Hideki Takayasu, and Misako Takayasu Abstract In this study, we introduce a model
Informational Graphics
 Informational Graphics Informational Graphics - (also called infographics, information design, and news graphics) Informational Graphics are visual displays that can be anything from a pleasing arrangement
Chapter 10 Simulation of Gross Domestic Product in International Trade Networks: Linear Gravity Transportation Model
 Chapter 10 Simulation of Gross Domestic Product in International Trade Networks: Linear Gravity Transportation Model Tsuyoshi Deguchi, Hideki Takayasu, and Misako Takayasu Abstract In this study, we introduce
Methodology used in preparing the estimates and projections of the urban and rural population and the economically active population
 CEPAL América Latina y el Caribe. Observatorio demográfico Nº 2 Población económicamente activa Methodology used in preparing the estimates and projections of the urban and rural population and the economically
arxiv: v1 [q-fin.gn] 15 Sep 2007
![arxiv: v1 [q-fin.gn] 15 Sep 2007](/thumbs/89/100341198.jpg "arxiv: v1 [q-fin.gn] 15 Sep 2007") Evolution of community structure in the world trade web Irena Tzekina, Karan Danthi, Daniel N. Rockmore arxiv:0709.2630v1 [q-fin.gn] 15 Sep 2007 Abstract Department of Mathematics, Dartmouth College, Hanover,
Evolution of community structure in the world trade web Irena Tzekina, Karan Danthi, Daniel N. Rockmore arxiv:0709.2630v1 [q-fin.gn] 15 Sep 2007 Abstract Department of Mathematics, Dartmouth College, Hanover,
Global Data Catalog initiative Christophe Charpentier ArcGIS Content Product Manager
 Global Data Catalog initiative Christophe Charpentier ArcGIS Content Product Manager ccharpentier@esri.com We are in a global economy Global Economy Business and Operations are now global Strategic need
ARTNeT Interactive Gravity Modeling Tool
 Evidence-Based Trade Policymaking Capacity Building Programme ARTNeT Interactive Gravity Modeling Tool Witada Anukoonwattaka (PhD) UNESCAP 26 July 2011 Outline Background on gravity model of trade and
Important Developments in International Coke Markets
 Important Developments in International Coke Markets Andrew Jones Resource-Net South Africa China Coke Market Congress Xuzhou, Jiangsu September 2018 Introduction to Presentation Resource-Net produces
GDP growth and inflation forecasting performance of Asian Development Outlook
 and inflation forecasting performance of Asian Development Outlook Asian Development Outlook (ADO) has been the flagship publication of the Asian Development Bank (ADB) since 1989. Issued twice a year
Alfonso Gonzalez The University of Calgary. Latin America's Population and Development in the 1970s
 Alfonso Gonzalez The University of Calgary Latin America's Population and Development in the 1970s Latin America, like other underdeveloped regions, has been endeavoring to improve its level of living
The evolution of world trade from 1995 to 2014: A network approach
 The evolution of world trade from 1995 to 2014: A network approach Seminario de Matemáticas Aplicadas Quantil, abril 6 de 2017 Freddy Cepeda fcepedlo@banrep.gov.co Fredy Gamboa fgamboes@banrep.gov.co Carlos
DISTILLED SPIRITS - EXPORTS BY VALUE DECEMBER 2017
 DISTILLED SPIRITS - EXPORTS BY VALUE DECEMBER 2017 U.S. COMMERCIAL EXPORTS OF DISTILLED SPIRITS - DECEMBER 2017 (U.S. DOLLARS) Da-Value-17-12 SUMMARY BY CLASS CLASS DECEMBER DECEMBER DOLLAR YTD YTD DOLLAR
Regional Integration in Central Asia
 Dr. Sebastian Krapohl Assistant Professor of International Relations Regional Integration in Central Asia In Search for an Explanation of Failing Regionalism The Empirical Puzzle The five Central Asian
The Growth of China and India in World Trade:
 Public Disclosure Authorized Public Disclosure Authorized Public Disclosure Authorized Public Disclosure Authorized Policy Research Working Paper 4320 The Growth of China and India in World Trade: Opportunity
Chapter 9: Looking Beyond Poverty: The Development Continuum
 Chapter 9: Looking Beyond Poverty: The Development Continuum Using measures such as Gross Domestic Product (GDP), Gross National Income (GNI), and more recently the Human Development Index (HDI), various
Reconciling conflicting evidence on the origins of comparative development: A finite mixture model approach
 Reconciling conflicting evidence on the origins of comparative development: A finite mixture model approach Thomas K.J. Grantham Research Institute on Climate Change and the Environment, London School
Study Guide Unit 6 Economics and Development
 Name Period Study Guide Unit 6 Economics and Development When you are asked to sketch maps, please put a key so that you can remember what the colors mean! Chapter 9: Development How does the author introduce
Human Capital, Technology Diffusion and Total Factor Productivity Growth in Regions
 Seminar in International Economics 17 September 2018 Human Capital, Technology Diffusion and Total Factor Productivity Growth in Regions Anja Kukuvec Vienna University of Economics and Business (WU) This
Export Led Growth in the Caribbean: Evidence from a panel cointegration assessment
 Export Led Growth in the Caribbean: Evidence from a panel cointegration assessment 1 AUTHORS: ROGER HOSEIN, JEETENDRA KHADAN AND NIRVANA SATNARINE-SINGH CONFERENCE ON THE ECONOMY 2016 OCTOBER 13 TH 14
Melting Ice Caps: Implications for Asia-North America Linkages and the Panama Canal
 Melting Ice Caps: Implications for Asia-North America Linkages and the Panama Canal Joseph Francois, Amanda Leister and Hugo Rojas-Romagosa 2015 MASS, St. John s Francois, Leister & Rojas-Romagosa (2015)
Total trade of G20 as a share of world trade Subtotal as a share of total trade of G20
 Table A1 Comparison between sample countries and G20 countries, 2008 (in billions of dollars) Countries that are both in the sample and in the G-20 Other members of the sample or the G-20 Sample group
U.S. Sugar Monthly Import and Re-Exports
 U.S. Sugar Monthly Import and Re-Exports Fiscal Year (FY) 2018 Report July 2018 The July WASDE report shows FY 2018 WTO raw sugar tariff-rate quota (TRQ) shortfall projected at 99,208 short tons raw value
Selected Answers for Core Connections Algebra
 Selected Answers for Core Connections Algebra Lesson 9.1.1 9-6. a: (w +14) 2 = 144 ; w = 2 or 26 b: (x + 2.5) 2 = 2.25; x = 1 or 4 c: (k! 8) 2 = 81 ; k = 1 or 17 d: (z! 500) 2 = 189225 ; z = 65 or 935
Cambridge International Examinations Cambridge Ordinary Level
 Cambridge International Examinations Cambridge Ordinary Level *0607581492* GEOGRAPHY 2217/13 Paper 1 October/November 2018 1 hour 45 minutes Candidates answer on the Question Paper. Additional Materials:
Cross-Border Infrastructure Connectivity: Needs, Facts and Challenges
 Cross-Border Infrastructure Connectivity: Needs, Facts and Challenges Matthias Helble Research Economist Asian Development Bank Institute Financing Quality Infrastructure 19-20 December, 2016 Contents
An Accuracy Assessment of the Global Employment Trends Unemployment Rate Forecasts
 ILO Research department Working paper No. 1 An Accuracy Assessment of the Global Employment Trends Unemployment Rate Forecasts Evangelia Bourmpoula and Christina Wieser January 2014 Research Department
Gravity Analysis of Regional Economic Interdependence: In case of Japan
 Prepared for the 21 st INFORUM World Conference 26-31 August 2013, Listvyanka, Russia Gravity Analysis of Regional Economic Interdependence: In case of Japan Toshiaki Hasegawa Chuo University Tokyo, JAPAN
Cotton Economics Research Institute CERI Outlook Report
 2006 Global Cotton Outlook Cotton Economics Research Institute CERI Outlook Report 06-02 www.ceri.ttu.edu/policy CERI (Policy Modeling Group) Samarendu Mohanty, Associate Professor Suwen Pan, Research
Proposed AKS for 6 th Grade Social Studies
 Proposed AKS for 6 th Grade Social Studies A. Map and Globe Skills 1. use cardinal directions 2. use intermediate directions 3. use a letter/number grid system to determine location 4. compare and contrast
Essential Policy Intelligence
 1 : For Better In than Out? Canada and the Trans-Pacific Partnership By Dan Ciuriak, Ali Dadkhah, and Jingliang Xiao Overall Impact of the TPP The TPP s trade impacts will likely be quite modest. We calculate
The Central Bank of Iceland forecasting record
 Forecasting errors are inevitable. Some stem from errors in the models used for forecasting, others are due to inaccurate information on the economic variables on which the models are based measurement
!" #$$% & ' ' () ) * ) )) ' + ( ) + ) +( ), - ). & " '" ) / ) ' ' (' + 0 ) ' " ' ) () ( ( ' ) ' 1)
 ) * ) )) ' + ( ) + ) +( ), - ). & ' ) / ) ' ' (' + 0 ) ' ' ) () ( ( ' ) ' 1)") !" #$$% & ' ' () ) * ) )) ' + ( ) + ) +( ), - ). & " '" ) () -)( / ) ' ' (' + 0 ) ' " ' ) () ( ( ' ) ' 1) )) ) 2') 3 45$" 467" 8" 4 %" 96$ & ' 4 )" 3)" ::" ( & ) ;: < ( ) ) =)+ ( " " " $8> " ') +? @ ::
!" #$$% & ' ' () ) * ) )) ' + ( ) + ) +( ), - ). & " '" ) () -)( / ) ' ' (' + 0 ) ' " ' ) () ( ( ' ) ' 1) )) ) 2') 3 45$" 467" 8" 4 %" 96$ & ' 4 )" 3)" ::" ( & ) ;: < ( ) ) =)+ ( " " " $8> " ') +? @ ::
Javier Corrales Professor of Political Science Amherst College, Amherst, MA September 2013
 Javier Corrales Professor of Political Science Amherst College, Amherst, MA jcorrales@amherst.edu September 2013 Sections I. Progress thus far II. Homophobia across and within III. Conventional independent
Testing Contagion in Multivariate Financial Time Series
 Testing Contagion in Multivariate Financial Time Series Indian Statistical Institute Mar 14th, 2014 Joint work with Zheng Tan and Kausik Chaudhuri Outlines Outlines 1 Introduction 2 Model Description 3
Urban Expansion. Urban Expansion: a global phenomenon with local causes? Stephen Sheppard Williams College
 Urban Expansion: a global phenomenon with local causes? Stephen Sheppard Williams College Presentation for World Bank, April 30, 2007 Presentations and papers available at http://www.williams.edu/economics/urbangrowth/homepage.htm
Introduction to time-use surveys
 Regional seminar on time-use surveys Introduction to time-use surveys Kingstown, Saint Vincent and the Grenadines 10-11 December 2014 Iliana Vaca Lucía Scuro Division of Gender Affairs WHAT IS TIME? Measured
ECONOMIC COMMISSION FOR LATIN AMERICA AND THE CARIBBEAN
 ECONOMIC COMMISSION FOR LATIN AMERICA AND THE CARIBBEAN ECONOMIC RELATIONS BETWEEN LATIN AMERICA AND ASIA-PACIFIC Recent trends and future challenges José Carlos S. Mattos* Working Paper No. 14 ** January
GINA Children. II Global Index for humanitarian Needs Assessment (GINA 2004) Sheet N V V VI VIII IX X XI XII XII HDR2003 HDR 2003 UNDP
 Sheet N V V VI VIII IX X XI XII XII HDR2003 HDR 2003 UNDP") Human UNICEF Index Index Natural 2003 GDP per Total as % of Total Rate HDI HPI Disasters Conflicts capita Population population 5 1 Congo, Democratic Republic of the 2,80000 3 3 1 3 3 3 3 3 3 3 2 Burundi
Human UNICEF Index Index Natural 2003 GDP per Total as % of Total Rate HDI HPI Disasters Conflicts capita Population population 5 1 Congo, Democratic Republic of the 2,80000 3 3 1 3 3 3 3 3 3 3 2 Burundi
Summary and Implications for Policy
 Summary and Implications for Policy 1 Introduction This is the report on a background study for the National Spatial Strategy (NSS) regarding the Irish Rural Structure. The main objective of the study
PAN AMERICAN INSTITUTE OF GEOGRAPHY AND HISTORY Specialized Organization of the OAS
 PAN AMERICAN INSTITUTE OF GEOGRAPHY AND HISTORY Specialized Organization of the OAS 10 th UNRCC Americas United Nations, New York, 20 August 2013 PAIGH, SIRGAS, PC-IDEA and GeoSUR 2013-2015 Joint Action
Prentice Hall World Studies: Latin America 2005 Correlated to: Missouri Social Studies Grade Level Expectations (Grade 7)
") Principles of Constitutional Democracy 1. Knowledge of the principles expressed in documents shaping constitutional democracy in the United States A. (1) Principles expressed in documents shaping constitutional
Principles of Constitutional Democracy 1. Knowledge of the principles expressed in documents shaping constitutional democracy in the United States A. (1) Principles expressed in documents shaping constitutional
GACE Middle Grades Social Science Assessment Test at a Glance
 GACE Middle Grades Social Science Assessment Test at a Glance Updated June 2017 See the GACE Middle Grades Social Science Assessment Study Companion for practice questions and preparation resources. Assessment
Trade and Direct Investment across the Taiwan Strait
 Trade and Direct Investment across the Taiwan Strait - An Empirical Analysis of Taiwan and China s Accession into the WTO Ji Chou Chung-Hua Institution for Economic Research Shiu-Tung Wang National Taiwan
A Spatial Econometric Approach to Model the Growth of Tourism Flows to China Cities
 April 15, 2010 AAG 2010 Conference, Washington DC A Spatial Econometric Approach to Model the Growth of Tourism Flows to China Cities Yang Yang University of Florida Kevin. K.F. Wong The Hong Kong Polytechnic
YANNICK LANG Visiting Student
 THE STUDENT ECONOMIC REVIEWVOL. XXVIII EXPLAINING BILATERAL TRADE FLOWS IN IRELAND USING A GRAVITY MODEL: EMPIRICAL EVIDENCE FROM 2001-2011 YANNICK LANG Visiting Student The concept of equilibrium was
Workshop for empirical trade analysis. December 2015 Bangkok, Thailand
 Workshop for empirical trade analysis December 2015 Bangkok, Thailand Cosimo Beverelli (WTO) Rainer Lanz (WTO) Content a. What is the gravity equation? b. Naïve gravity estimation c. Theoretical foundations
Landlocked or Policy Locked?
 Landlocked or Policy Locked? How Services Trade Protection Deepens Economic Isolation Ingo Borchert joint work with Batshur Gootiiz, Arti Grover and Aaditya Mattoo Development Research Group The World
ACCESSIBILITY TO SERVICES IN REGIONS AND CITIES: MEASURES AND POLICIES NOTE FOR THE WPTI WORKSHOP, 18 JUNE 2013
 ACCESSIBILITY TO SERVICES IN REGIONS AND CITIES: MEASURES AND POLICIES NOTE FOR THE WPTI WORKSHOP, 18 JUNE 2013 1. Significant differences in the access to basic and advanced services, such as transport,
International Investment Positions and Exchange Rate Dynamics: A Dynamic Panel Analysis
 International Investment Positions and Exchange Rate Dynamics: A Dynamic Panel Analysis Michael Binder 1 Christian J. Offermanns 2 1 Frankfurt and Center for Financial Studies 2 Frankfurt Motivation Empirical
Please note that all IEA data are subject to the following Terms and Conditions found on the IEA s website:
 2 - COAL INFORMATION: OVERVIEW (218 edition) The following analysis is an overview from the publication Coal Information 218. Please note that we strongly advise users to read definitions, detailed methodology
Developing a global, peoplebased definition of cities and settlements
 Developing a global, peoplebased definition of cities and settlements By Lewis Dijkstra, Lewis.Dijkstra@ec.europa.eu Head of the Economic Analysis Sector DG for Regional and Urban Policy, Regional & Urban
The Impact of Historical and Regional Networks on Trade Volumes within the Western Hemisphere: A Gravity Analysis across Sectors
 The Impact of Historical and Regional Networks on Trade Volumes within the Western Hemisphere: A Gravity Analysis across Sectors H. Mikael Sandberg* Food and Resource Economics Department University of
The study of Geography and the use of geographic tools help us view the world in new ways.
 S How does Geography help us understand our world? What factors shape the Earth s different environments? 7.1.9 7.2.9 BIG IDEAS COMPETENCIES Text pages or The study of Geography and the use of geographic
ECONOMICS THE GRAVITY OF RESOURCES AND THE TYRANNY OF DISTANCE. Peter E Robertson Business School University of Western Australia.
 ECONOMICS THE GRAVITY OF RESOURCES AND THE TYRANNY OF DISTANCE by Peter E Robertson Business School University of Western Australia and Marie-Claire Robitaille The University of Nottingham Ningbo China
GDP forecast errors Satish Ranchhod
 GDP forecast errors Satish Ranchhod Editor s note This paper looks more closely at our forecasts of growth in Gross Domestic Product (GDP). It considers two different measures of GDP, production and expenditure,
Global Value Chain Participation and Current Account Imbalances
 Global Value Chain Participation and Current Account Imbalances Johannes Brumm University of Zurich Georgios Georgiadis European Central Bank Johannes Gräb European Central Bank Fabian Trottner Princeton
World Geography Fall 2013 Semester Review Project
 Reporting Category RC 1: History, Government and Citizenship Standard WG.1 History. The student understands how geography and processes of spatial exchange (diffusion) influenced events in the past and
Policies towards SDI development and implementation in the Americas
 Policies towards SDI development and implementation in the Americas Valéria Oliveira Henrique de Araújo Executive Secretary of CP-IDEA Brazilian Institute of Geography and Statistics - IBGE Geospatial
North and Central Asia: Overview and Recent Trends. Tiziana Bonapace Head Subregional Office for North and Central Asia, ESCAP
 North and Central Asia: Overview and Recent Trends Tiziana Bonapace Head Subregional Office for North and Central Asia, ESCAP North and Central Asia: An Idiosyncratic Setting High economic volatility After
Growth Trends and Characteristics of OECD Rural Regions
 Please cite this paper as: Garcilazo, E. (2013), Growth Trends and Characteristics of OECD Rural Regions, OECD Regional Development Working Papers, 2013/10, OECD Publishing, Paris. http://dx.doi.org/10.1787/5k4522x3qk9q-en
ENHANCING THE SHARE OF LLDCs IN. (Priority 3 of APoA) Dr Mia Mikic Chief, Trade Policy and Analysis Section Trade and Investment Division
 Dr Mia Mikic Chief, Trade Policy and Analysis Section Trade and Investment Division") ESCAP/OHRLLS/ECE/Government of Lao PDR Final Regional Review of the AlmatyProgrammeof of Action 5 7 March 2013, Vientiane, Lao PDR ENHANCING THE SHARE OF LLDCs IN GLOBAL TRADE FLOWS AND TRADE FACILITATION
ESCAP/OHRLLS/ECE/Government of Lao PDR Final Regional Review of the AlmatyProgrammeof of Action 5 7 March 2013, Vientiane, Lao PDR ENHANCING THE SHARE OF LLDCs IN GLOBAL TRADE FLOWS AND TRADE FACILITATION
INTERNATIONAL HYDROGRAPHIC ORGANIZATION MESO AMERICAN & CARIBBEAN SEA HYDROGRAPHIC COMMISSION
 INTERNATIONAL HYDROGRAPHIC ORGANIZATION MESO AMERICAN & CARIBBEAN SEA HYDROGRAPHIC COMMISSION CAPACITY BUILDING PLAN Programme document for the period 2010-2012 1. INTRODUCTION 1.1. Rationale It is estimated
Major Trade Trends in East Asia
 Public Disclosure Authorized Wip30'j POLICY RESEARCH WORKING PAPER 3 084 Public Disclosure Authorized Major Trade Trends in East Asia What are their Implications for Regional Cooperation and Growth? Public
Monetary shocks at high-frequency and their changing FX transmission around the globe
 Introduction Data Baseline Results UMP Time Varying Robustness Conclusions Monetary shocks at high-frequency and their changing FX transmission around the globe Massimo Ferrari Jonathan Kearns Andreas
Networks of Foreign Value Added in Exports
 Networks of Foreign Value Added in Exports J. Amador 1 S. Cabral 2 R. Mastrandrea 3 F. Ruzzenenti 4 1 Banco de Portugal & Nova SBE 2 Banco de Portugal 3 IMT School for Advanced Studies 4 University of
REVIEW OF MARITIMETRANSPORT, 2002
 UNCTAD/RMT/2002 UNITED NATIONS CONFERENCE ON TRADE AND DEVELOPMENT Geneva REVIEW OF MARITIMETRANSPORT, 2002 Chapter VI I Review of regional developments: Latin America UNITED NATIONS New York and Geneva,
University of Hawai`i at Mānoa Department of Economics Working Paper Series
 University of Hawai`i at Mānoa Department of Economics Working Paper Series Saunders Hall 542, 2424 Maile Way, Honolulu, HI 96822 Phone: (808) 956-8496 www.economics.hawaii.edu Working Paper No. 17-1 International
trade liberalisation 1. Introduction CREATE TRADE FOR SOUTH AFRICA?
 trade liberalisation 111 DO FREE TRADE AGREEMENTS CREATE TRADE FOR SOUTH AFRICA? B y M e r l e H o l d e n a n d L a n d o n M c M i l l a n U n i v e r s i t y o f K w a Z u l u - N a t a l D u r b a
FORECAST ERRORS IN PRICES AND WAGES: THE EXPERIENCE WITH THREE PROGRAMME COUNTRIES
 Escola de Economia e Gestão Universidade do Minho e NIPE fjveiga@eeg.uminho.pt FORECAST ERRORS IN PRICES AND WAGES: THE EXPERIENCE WITH THREE PROGRAMME COUNTRIES ABSTRACT This paper evaluates the accuracy
The future of SDIs. Ian Masser
 The future of SDIs Ian Masser Presentation Considers two questions relating to the future development of SDIs throughout the world Where have we got to now? Where should we go from here? Identifies four
5 Medium-Term Forecasts
 CHAPTER 5 Medium-Term Forecasts You ve got to be very careful if you don t know where you re going, because you might not get there. Attributed to Yogi Berra, American baseball player and amateur philosopher
Does Corruption Persist In Sub-Saharan Africa?
 Int Adv Econ Res (2009) 15:336 350 DOI 10.1007/s11294-009-9210-2 ORIGINAL PAPER Does Corruption Persist In Sub-Saharan Africa? Nicole Bissessar Published online: 12 June 2009 # International Atlantic Economic
NATIONAL RESEARCH UNIVERSITY HIGHER SCHOOL OF ECONOMICS POLITICAL GEOGRAPHY
 NATIONAL RESEARCH UNIVERSITY HIGHER SCHOOL OF ECONOMICS POLITICAL GEOGRAPHY Course syllabus HSE and UoL Parallel-degree Programme International Relations Lecturer and Class Teacher: Dr. Andrei Skriba Course
Resolution adopted by the General Assembly. [on the report of the Second Committee (A/67/440/Add.2)]
![Resolution adopted by the General Assembly. [on the report of the Second Committee (A/67/440/Add.2)]](/thumbs/94/121301610.jpg "Resolution adopted by the General Assembly. [on the report of the Second Committee (A/67/440/Add.2)]") United Nations General Assembly Distr.: General 3 April 2013 Sixty-seventh session Agenda item 23 (b) Resolution adopted by the General Assembly [on the report of the Second Committee (A/67/440/Add.2)]
United Nations General Assembly Distr.: General 3 April 2013 Sixty-seventh session Agenda item 23 (b) Resolution adopted by the General Assembly [on the report of the Second Committee (A/67/440/Add.2)]
Sixth Grade Social Studies. QPA Schedule
 2017 2018 Sixth Grade Social Studies Unit 1: Concepts Used in Global Studies 5 Weeks Unit 2: History & Geography of Europe 5 Weeks Unit 3: Europe Today 6 Weeks Unit 4: History & Geography of Latin America
Verifor information note December Recent international trade patterns in timber products for the Verifor case study countries
 Verifor information note December 2007 Recent international trade patterns in timber products for the Verifor case study countries Neil Bird Introduction A major driver behind the development of national
5 th Grade Social Studies Goals for the First Trimester Miss Gaull
 5 th Grade Social Studies Goals for the First Trimester Overview: American People, American Land The American People Government by the People Free Enterprise Lands and Regions Resources and the Environment
NOWCASTING REPORT. Updated: April 15, 2016
 NOWCASTING REPORT Updated: April 15, 2016 GDP growth prospects remain moderate for the rst half of the year: the nowcasts stand at 0.8% for 2016:Q1 and 1.2% for 2016:Q2. News from this week's data releases
Supplemental Information
 Supplemental Information Rewards for Ratification: Payoffs for Participating in the International Human Rights Regime? Richard Nielsen Assistant Professor, Department of Political Science Massachusetts
South and South-West Asia LLDCs
 International support measures to South and South-West Asia LLDCs Nagesh Kumar Director, ESCAP South and South West Asia Office And ESCAP Chief Economist ESCAP/OHRLLS/ECE/Government / / of Lao PDR Final
Comprehensive Asian Development Plan: A Proposed framework
 Comprehensive Asian Development Plan: A Proposed framework Ruth Banomyong Director, Centre for Logistics Research Thammasat University The presenter would like to acknowledge work done by the Economic
EuroGeoSurveys & ASGMI The Geological Surveys of Europe and IberoAmerica
 EuroGeoSurveys & ASGMI The Geological Surveys of Europe and IberoAmerica Geological Surveys, what role? Legal mandate for data & information: Research Collection Management Interpretation/transformation
International Development
 International Development Discipline/Multi-discipline or trans-disciplinary field Tahmina Rashid Associate Professor, International Studies What is Development? a. Development as a state or condition-static
An Evaluation of the World Economic Outlook Forecasts ALLAN TIMMERMANN
 IMF Staff Papers Vol. 54, No. 1 & 2007 International Monetary Fund An Evaluation of the World Economic Outlook Forecasts ALLAN TIMMERMANN This paper conducts a series of statistical tests to evaluate the
THE HUMAN DEVELOPMENT INDEX AND SMALL STATES WITH A FOCUS ON MAURITIUS
 THE HUMAN DEVELOPMENT INDEX AND SMALL STATES WITH A FOCUS ON MAURITIUS Prepared by Lino Briguglio University of Malta Delivered at the University of Mauritius 21 September 2018 Layout of the Presentation
International Student Enrollment Fall 2018 By CIP Code, Country of Citizenship, and Education Level Harpur College of Arts and Sciences
 International Student Enrollment Fall 2018 By CIP Code, Country of Citizenship, and Education Level Harpur College of Arts and Sciences CIP Code Description Citizenship Graduate Undergrad Total 00.0000
Latin American cycles: Has anything changed after the Great Recession? *
 Latin American cycles: Has anything changed after the Great Recession? * Máximo Camacho + Universidad de Murcia/BBVA Research mcamacho@um.es Gonzalo Palmieri Universidad de Murcia gd.palmierileon@um.es
More information from:
 Report Information More information from: https://www.wiseguyreports.com/reports/3501422-global-temporary-power-market-size-study-by-power Global Temporary Power Market Size study, by Power Rating (Less
Climate variability and international migration: an empirical analysis
 Climate variability and international migration: an empirical analysis NICOLA D. CONIGLIO, Corresponding author University of Bari Aldo Moro, Department of Economics, Largo Abbazia Santa Scolastica 53,
Productivity Differences Within and Between Countries
 Productivity Differences Within and Between Countries Melissa Dell MIT OECD Lagging Regions Meeting, June 2010 Dell (MIT) Productivity Differences OECD Lagging Regions 1 / 21 Motivation Introduction and
THE NON-LINEAR SPECIFICATION OF THE GRAVITY MODEL: AN EMPIRICAL APPLICATION ON INTERNATIONAL TRADE
 THE NON-LINEAR SPECIFICATION OF THE GRAVITY MODEL: AN EMPIRICAL APPLICATION ON INTERNATIONAL TRADE CELESTINO SUÁREZ-BURGUET, INMACULADA MARTÍNEZ-ZARZOSO AND LAURA MÁRQUEZ-RAMOS DEPARTAMENTO DE ECONOMÍA