TOPOGRAPHIC and TOURISTIC CARTOGRAPHY of NATIONAL PARKS and RESERVES
|
|
|
- Neil Morton
- 6 years ago
- Views:
Transcription

1 9th ICA Mountain Cartography Workshop, April 2014 Hi Banff Alpine Centre, Banff National Park, Alberta - CANADA TOPOGRAPHIC and TOURISTIC CARTOGRAPHY of NATIONAL PARKS and RESERVES INSTITUTO GEOGRÁFICO NACIONAL REPÚBLICA ARGENTINA
2 RESUME THIS PRESENTATION WILL SHOW YOU THE METHODOLOGY THAT INSTITUTO GEOGRÁFICO NACIONAL (IGN) IS BEGINNING TO EMPLOY THIS YEAR FOR THE PRODUCTION OF TOPOGRAHIC AND TOURISTIC MAPS OF NATIONAL PARKS AND RESERVES. THE MAP WAS POSSIBLE THANKS TO THE PARTICIPATION OF THE NATIONAL PARKS ADMINISTRATION (APN). THEY ADDED GEOGRAPHICAL INFORMATION REGARDING TOURISTIC ACTIVITIES AND SOME NICE PICTURES THE BACK OF THE MAP HAS A LANDSAT 8 SATELLITE IMAGE AND SOME INFORMATION PROVIDED BY THE APN THE RESULT IS A PROTOTYPE OF A TOPOGRAPHIC AND TOURISTIC MAP OF LOS ALERCES NATIONAL PARK AND RESERVE AT 1:100,000 SCALE
3 OBJECTIVES To develop the methodology for the production of the topographic and touristic official maps of all national parks and reserves located in mountain regions To design these maps with the participation of the National Parks Administration, who will provide us with different information about touristic activities in different formats included in both sides of the map. To make the map in an appropriate size, easy for transportation and printed in water-proof folding paper To offer tourists updated information to easily find their way through the park

4 NATIONAL PARKS ADMINISTRATION IS THE NATIONAL ORGANISM RESPONSIBLE FOR THE PROTECTION OF THE NATURAL AREAS THAT ARE UNDER ITS CONTROL IT IS RESPONSIBLE FOR 34 PROTECTED AREAS, 20 OF THEM LOCATED IN MOUNTAIN REGIONS THE SMALLEST HAS AN AREA OF 10 HECTARES AND THE BIGGEST HAS AN AREA OF 727,000 HECTARES

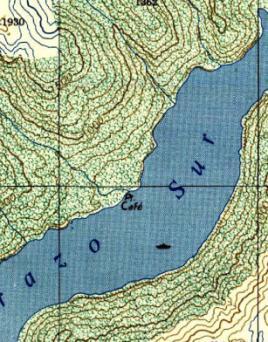
5 CHOSEN PARK LOS ALERCES NATIONAL PARK AND RESERVE AS OUR FIRST PROTOTYPE REASONS: IT IS ONE OF THE MOST BEAUTIFUL PARKS VISITED BY TOURISTS FROM MANY COUNTRIES THIS PARK WAS REPRESENTED FOR LAST TIME IN 1977 BY THE IGM. WE UNDERSTAND IT IS INMEDIATELLY NECESARY TO GENERATE A NEW UPDATED AND BETTER QUALITY VERSION THERE ARE OLD CARTOGRAPHY AVAILABLE


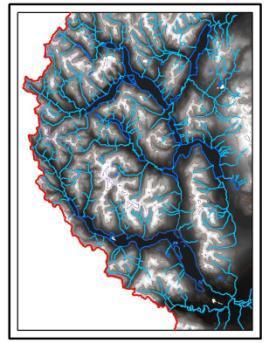
6 LOCATION Chubut in Argentina The Park in Chubut Los Alerces NP THE PARK IS LOCATED IN THE: PATAGONIA REGION CHUBUT PROVINCE (at the NW) in West-East direction in North-South direction


7 PARK HISTORY AND SOME DETAILS IT WAS CREATED ON MAY 11, 1937 IT COVERS AN AREA OF HAS. IT IS THE FOURTH IN SIZE COMPARED TO THE OTHER PARKS THE MAIN OBJECTIVE IS TO SPECIALLY PROTECT THE ANCIENT LARCH SPECIMEN OF THE NATURA ANDINIAN PATAGONIA IN ITS LANDSCAPES THERE ARE SOME VIRGIN FORESTS, LAKES, FALLS, RIVERS, MOUNTAIN CHAINS AND HIGH MOUNTAIN GLACIERS

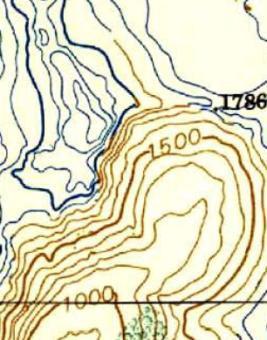
8 PREVIOUS CARTOGRAPHY I SPECIAL FORMAT: A map of the park s area Made by the IGM: PARQUE Y RESERVA NACIONAL LOS ALERCES Edition year: 1977 Scale: 1: Contour interval: 150 meters It has a group of touristic cartographic signs specially designed for this map

9 STANDARD CARTOGRAPHY Longitude: 30, Latitude: 20 5 maps at 1: scale Made by the IGM: PREVIOUS CARTOGRAPHY II , Cerro Chato, , Lago Rivadavia, , Paso Navarro, , Villa Futalaufquen, , Complejo Hidroeléctrico Futaleufú, 1982 Contour interval: 50 y 100 meters


10 PREVIOUS CARTOGRAPHY III INTERNATIONAL BOUNDARY CARTOGRAPHY 6 topographic maps at 1: scale Made by: International Boundaries National Commission CONALI Edition Year: 1995 This is not public information Only a few National Organisms can use it IGN had to respect the boundary line that this Commission defined Section VII-10 Section VII-9 Section VII-8 SectionVII-7 Section VII-6 Sección VII-5 Contour interval 50 meters
11 SCALE DEFINITION THE PARK SIZE Measures of the park are: Longitude direction: Latitude direction: 50 km 69 km The park area at 1: scale: Width: 50 cm High: 69 cm Plus the small border: Width: 56 cm High: 76 cm The map size: Folded map size: 60 x 80 cm 12 x 20 cm
12 INFORMATION USED FROM NEW TECHNOLOGIES DIGITAL ELEVATION MODEL: Argentine DEM of 45 meters pixel size SATELLITE IMAGE: LandSat 8, merged between: Multispectral, 30 meters (Feb 19, 2014) Panchromatic, 15 meters GIS APN: Different shapes regarding touristic information and forest areas
13 DEFINITION OF REFERENCE AND PROJECTION SYSTEMS TO USE PROJECTION SYSTEM: Gauss Kruger, 1st strip Transversal Mercator, Meridian tangency: 72 º W REFERENCE SYSTEM: POSGAR 07 (Argentine Geodetic Positioning, 2007) ELIPSOID: WGS 84 ALTIMETRIC DATUM: Referred to the medium see level as hypsometric horizon, adopted in 1924 for the tide instrument located in Mar del Plata City
14 PREVIOUS CARTOGRAPHY GEO REFERENCIATION (HOMOGENIZATION) Transformation of Different Projection and Reference Systems MAP OF THE PARK (made by the IGM in 1977) Unknown data Referenced by similar terrain details STANDARD CARTOGRAPHY AT 1: SCALE (made in 1981/2) These have been made in the same parameters that we chose for the new map BOUNDARY CARTOGRAPHY (made by CONALI IN 1995) For this case, the 6 maps are en two different reference systems The parallel of 43 is that separated both systems With the known parameters it was possible to adjust these maps in the selected system

15 SATTELITE IMAGES THE SATTELITE IMAGES WERE USED FOR THE CAPTURE OF: Lakes Rivers Streams Roads Snow Areas FOR MORE DETAILS: We also used the Imagery package provided by ESRI Company through ArcGis 10 software for the capture of more details when it was necessary: The Buildings Position Some Parts of Thin Trails into the Forest The Secondary Streets in Little Villages And a Few More Things.
16 DIGITAL ELEVATION MODEL ORIGINAL DATA: The original DEM is from the SRTM (Shuttle Radar Topography Mission) with 30 meters cell size. FROM THAT THE IGN CREATED OTHER DEM: Resolution: 45 meters DEM SUB - PRODUCTS: CONTOUR LINES SHADOW RELIEF MODEL FOREST AND SNOW AREAS (*) (*) With polygons previously vectorized from the satellite image The contour lines generated from this model has a contour interval of 100 meters
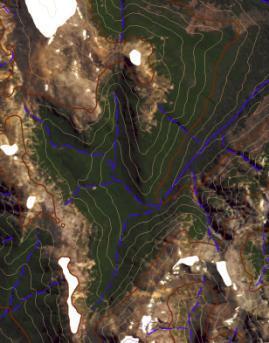
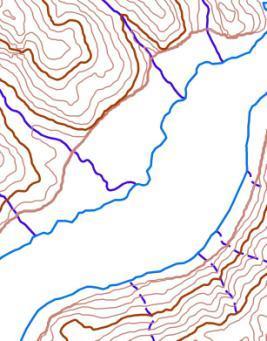
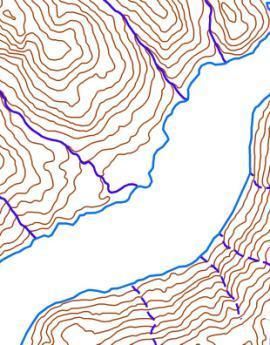
17 COMPARISON: Contour lines with the satellite image In general: good results A few mistakes specially in: big slopes flat areas All mistakes were corrected by handly vectorization from the old cartography

18 GIS APN The most important geographical elements that we represented in this map have to do with touristic information All this data was provided by the APN Examples: Park ranger offices Geographical names Trails into the forests Forest areas Names of farms
19 PLACEMENT OF GEOGRAPHICAL NAMES The criteria was to place all geographical names the way they were in our old cartography. Except when they don t coincide with the information from APN. In these cases we respect their information SOME CHANGES: Regarding the names of the peaks and their height, in this opportunity these sizes were incremented so the users could read them better than in our official cartography

20 CARTOGRAPHY SIGNS In general, most of the cartography signs are the same as our orthodoxies signs for the rest of the cartography Regarding touristic signs, we took the design of the special format map of Los Alerces National Park and Reserve made in This signs were printed only in black. After vectorize it, we took other aesthetic signs and filled them with different colors


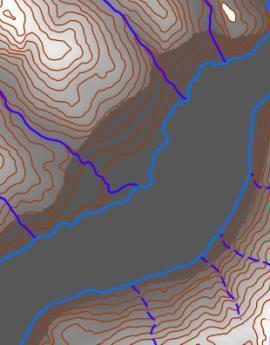
21 SHADOW The DEM was processed to generate the hill shading Parallel to this we created 2 new color ramps in ArcMap One of them for the shadow and the other for the ilumination These ramps are algorithmic ramps They are divided in 5 sectors Some of them are in white colour
22 GREY RAMP COLOUR The grey ramp colour represents the shadow: The dark grey colour (medium grey: 50% black) starts on the left. Along the four first sectors, it turns into white. The last sector (fifth) is completely white After that, we applied a 10% contrast and 40% of transparency
 with three sectors in white color Then, along the")

23 YELLOW RAMP COLOUR The yellow ramp colour represents the illumination: The ramp begins (from left to right) with three sectors in white color Then, along the last two sectors, it starts in white and in lineal form and it is converted into a medium yellow color After that, we applied 50 % contrast and 88 % of transparency


24 GREY RAMP COLOUR II Above the last two layers, we added another one, also in grey color, but with different values of contrast and Transparency The objective with this is to highlight the darkest areas in a small touch of dark grey The contrast applied is 30 % and its transparency is 80 %


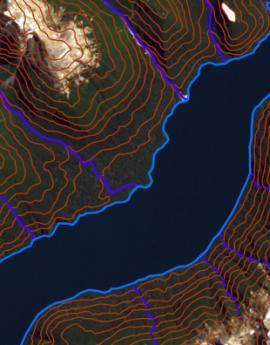
25 SNOW AREAS A new raster image was generated from the shadow model for the cartographic representation of the snow areas Then it was processed, we applied another custom light blue ramp colour And finally a contrast of 15 % and a transparency of 70 % It is necessary to place a mask in white color below this
26 FOREST AREAS These areas were represented the same way as the snow areas but in green colour For the case of forest areas we took a determination: There are five representative kinds of different forests We decided to highlight the most representative of them all: larches areas After that, we selected two tones of green, one of them for the larches and the other, in a clear green, for the rest of the forest The forest areas ramp colour is composed in lineal form It starts on the left with a very light blue and finishes in a dark green color Start: Cyan 14 %, magenta 4 % and yellow 9 % Finish: Cyan 87 %, magenta 40 % and yellow 87 % The Larches areas ramp colour is composite in lineal form It starts on the left with a medium green and it finishes in white colour The darker green: cyan 87 %, magenta 60 % and yellow 80 %


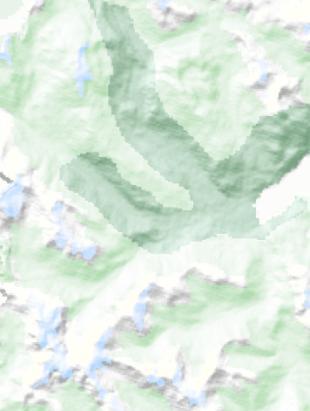
27 FOREST AREAS Forest areas Larches areas
28 PROCESSING IN PHOTOSHOP To finish the raster file, it is necessary to applied some filters in a design software In Photoshop we have to apply two kinds of filters: 1. Surface blur Ratio: 2 Umbral: Gaussian blur Ratio: 0.5
29 MARGINALIA INFORMATION As the Chilean territory wasn t represented, there is an area out of the map, where users can find all complementary information to be able to understand all aspects of the map. It includes: Tittle of the map (name of the park) What kind of map it is The logos of the participant organisms Geographical situation of the park References about cartographic signs Abbreviations Initials Data used Date of edition Out of the work area, there are coordinate values, main contour lines values and the places names where the routes conduct out of the map
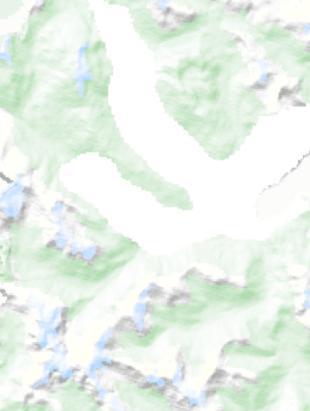
30 SHEET FOLDED AND BACK INFORMATION The final product, is presented by a folded form Its final size is 12 x 20 cm On the other map side, there is very interesting information: 1. A satellite image of the park area, at 1: scale 2. Information regarding: 1. Geographic Aspects 2. Generalities 3. Useful Data 4. Touristic Services 5. Recreation Activities 6. Some of its History 7. Valuable Species 8. Regulation and habits for your safety 9. Institutional information and contacts


31 FINISHED MAP The map on the front Back information
32 DISTRIBUTION 2500 maps will be printed at the IGN printer press to begin with of them will be given to the APN so it could distribute them as it better considers. The rest will remain in the IGN distributed among what it will be sent to the public from the sales department and a few of them to give as gifts in fairs, congresses and exhibitions.

33 PLEASE The map that I have presented today is not the final version, it is only a prototype, we still have some aspects to work on. I would really appreciate it if you can take a look at the map and give me some feedback. This is very important for us because it would be our first product revised by the Commission on Mountain Cartography
34 CONCLUTIONS We were able to make our first topographic and touristic map with the colaboration of the APN and with modern representation techniques We believe our product will have great acceptance and tourists will definitelly use it when the time comes to plan their visit to the park. A lot of work awaits us and we need to study each case in particular because each park is unique, not only because of its ecosystem but also because of its size and available information
35 THANK YOU VERY MUCH! Carlos Osvaldo NELSON Instituto Geográfico Nacional República Argentina
 estrandh@uoregon.edu Introduction The general topic of this paper describes a unique cartographic project depicting a mountain landscape for the Friends of Opal Creek (F.O.C.), a non-profit organization.
General Overview and Facts about the Irobland
 Using Geoinformation Science to Reveal the Impact of the Eritrea-Ethiopia Boundary Commission s Decision on Irobland and People By Alema Tesfaye, Washington DC, USA Part I General Overview and Facts about
Positional Accuracy of the Google Earth Imagery In The Gaza Strip
 Positional Accuracy of the Google Earth Imagery In The Gaza Strip Maher A. El-Hallaq Associate Professor of Surveying Civil Engineering Department The Islamic University of Gaza, Palestine mhallaq@iugaza.edu.ps
Welcome to NR502 GIS Applications in Natural Resources. You can take this course for 1 or 2 credits. There is also an option for 3 credits.
 Welcome to NR502 GIS Applications in Natural Resources. You can take this course for 1 or 2 credits. There is also an option for 3 credits. The 1st credit consists of a series of readings, demonstration,
Digital Topographic Map 1 : DTK1000
 Digital Topographic Map 1 : 1 DTK Documentation as of: 14.8.217 Federal Agency for Cartography and Geodesy DTK page 1 Digital Topographic Map 1 : 1 DTK Contents DTK Page 1 Index of data sets 3 2 Description
Lab 1: Importing Data, Rectification, Datums, Projections, and Output (Mapping)
") Lab 1: Importing Data, Rectification, Datums, Projections, and Output (Mapping) Topics covered in this lab: i. Importing spatial data to TAS ii. Rectification iii. Conversion from latitude/longitude to
Lab 1: Importing Data, Rectification, Datums, Projections, and Output (Mapping) Topics covered in this lab: i. Importing spatial data to TAS ii. Rectification iii. Conversion from latitude/longitude to
2. GETTING STARTED WITH GIS
 2. GETTING STARTED WITH GIS What are geographic information systems and what are they used for? ArcGIS: ArcMap, ArcCatalog and ArcToolbox Vector data vs. raster data vs. attribute tables Polygons, polylines,
NR402 GIS Applications in Natural Resources
 NR402 GIS Applications in Natural Resources Lesson 1 Introduction to GIS Eva Strand, University of Idaho Map of the Pacific Northwest from http://www.or.blm.gov/gis/ Welcome to NR402 GIS Applications in
Integrating LiDAR data into the workflow of cartographic representation.
 Integrating LiDAR data into the workflow of cartographic representation. Cartographic Workflow I. 1 2 3 4 5 Surveying Vector (Nat. GDB) GPS, Laser Range Finder Yes/ No Scanning old maps LiDARflights Capture
Pierce Cedar Creek Institute GIS Development Final Report. Grand Valley State University
 Pierce Cedar Creek Institute GIS Development Final Report Grand Valley State University Major Goals of Project The two primary goals of the project were to provide Matt VanPortfliet, GVSU student, the
Chapter 1 Overview of Maps
 Chapter 1 Overview of Maps In this chapter you will learn about: Key points when working with maps General types of maps Incident specific maps Map legend and symbols Map sources A map is a navigational
THE REVISION OF 1:50000 TOPOGRAPHIC MAP OF ONITSHA METROPOLIS, ANAMBRA STATE, NIGERIA USING NIGERIASAT-1 IMAGERY
 I.J.E.M.S., VOL.5 (4) 2014: 235-240 ISSN 2229-600X THE REVISION OF 1:50000 TOPOGRAPHIC MAP OF ONITSHA METROPOLIS, ANAMBRA STATE, NIGERIA USING NIGERIASAT-1 IMAGERY 1* Ejikeme, J.O. 1 Igbokwe, J.I. 1 Igbokwe,
Investigation of the Effect of Transportation Network on Urban Growth by Using Satellite Images and Geographic Information Systems
 Presented at the FIG Congress 2018, May 6-11, 2018 in Istanbul, Turkey Investigation of the Effect of Transportation Network on Urban Growth by Using Satellite Images and Geographic Information Systems
Different types of maps and how to read them.
 Different types of maps and how to read them. A map is a picture or representation of the Earth's surface, showing how things are related to each other by distance, direction, and size. Maps have been
Chapter 3 Models of the Earth. 3.1 Finding Locations on the Earth. 3.1 Objectives
 Chapter 3 Models of the Earth 3.1 Finding Locations on the Earth 3.1 Objectives Explain latitude and longitude. How can latitude and longitude be used to find locations on Earth? How can a magnetic compass
Lab #3 Map Projections.
 Lab #3 Map Projections http://visual.merriam-webster.com/images/earth/geography/cartography/map-projections.jpg Map Projections Projection: a systematic arrangement of parallels and meridians on a plane
AN EVALUATION ON THE DATA QUALITY OF SRTM DEM AT THE ALPINE AND PLATEAU AREA, NORTH-WESTERN OF CHINA
 AN EVALUATION ON THE DATA QUALITY OF SRTM DEM AT THE ALPINE AND PLATEAU AREA, NORTH-WESTERN OF CHINA Y. Liu School of Earth and Environmental Sciences, Lanzhou University, Lanzhou, 730000 -liuy@lzu.edu.cn
INTEGRATION OF HIGH RESOLUTION QUICKBIRD IMAGES TO GOOGLEEARTH
 INTEGRATION OF HIGH RESOLUTION QUICKBIRD IMAGES TO GOOGLEEARTH M. Alkan a, *, U.G. Sefercik a, M. Oruç a a ZKU, Engineering Faculty, 67100 Zonguldak, Turkey - (mehmetalkan44@yahoo.com) Interactive Sessions,
CHAPTER EXIT CHAPTER. Models of Earth. 3.1 Modeling the Planet. 3.2 Mapmaking and Technology. 3.3 Topographic Maps CHAPTER OUTLINE
 EXIT CHAPTER.1 Modeling the Planet.2 Mapmaking and Technology. Topographic Maps CHAPTER OUTLINE CHAPTER.1 Modeling the Planet A flat of Earth is a convenient tool, but it can distort the shape, distance,
Mapping Earth. How are Earth s surface features measured and modeled?
 Name Mapping Earth How are Earth s surface features measured and modeled? Before You Read Before you read the chapter, think about what you know about maps Record your thoughts in the first column Pair
Geographic Information Systems class # 1 February 19, Coordinate reference systems in GIS: geodetic coordinates
 Geographic Information Systems class # 1 February 19, 2013 Coordinate reference systems in GIS: geodetic coordinates Manuel Campagnolo ISA Manuel Campagnolo (ISA) GIS/SIG 2012 2013 February 19, 2013 1
SPOT DEM Product Description
 SPOT DEM Product Description Version 1.1 - May 1 st, 2004 This edition supersedes previous versions Acronyms DIMAP DTED DXF HRS JPEG, JPG DEM SRTM SVG Tiff - GeoTiff XML Digital Image MAP encapsulation
Designing GIS Databases to Support Mapping and Map Production Charlie Frye, ESRI Redlands Aileen Buckley, ESRI Redlands
 Designing GIS Databases to Support Mapping and Map Production Charlie Frye, ESRI Redlands Aileen Buckley, ESRI Redlands 1 Designing GIS Databases to Support Mapping and Map Production Charlie Frye, ESRI
The Looming Threat of Rising Sea Levels to the Florida Keys
 The Looming Threat of Rising Sea Levels to the Florida Keys 1. Introduction Sea levels are rising, and possibly faster than we thought before. In a recent report in 2017 by the National Oceanic and Atmospheric
GIS and Remote Sensing
 Spring School Land use and the vulnerability of socio-ecosystems to climate change: remote sensing and modelling techniques GIS and Remote Sensing Katerina Tzavella Project Researcher PhD candidate Technology
GIS Workshop Data Collection Techniques
 GIS Workshop Data Collection Techniques NOFNEC Conference 2016 Presented by: Matawa First Nations Management Jennifer Duncan and Charlene Wagenaar, Geomatics Technicians, Four Rivers Department QA #: FRG
Digital Elevation Models (DEM) / DTM
 / DTM") Digital Elevation Models (DEM) / DTM Uses in remote sensing: queries and analysis, 3D visualisation, classification input Fogo Island, Cape Verde Republic ASTER DEM / image Banks Peninsula, Christchurch,
Digital Elevation Models (DEM) / DTM Uses in remote sensing: queries and analysis, 3D visualisation, classification input Fogo Island, Cape Verde Republic ASTER DEM / image Banks Peninsula, Christchurch,
Introduction-Overview. Why use a GIS? What can a GIS do? Spatial (coordinate) data model Relational (tabular) data model
 data model Relational (tabular) data model") Introduction-Overview Why use a GIS? What can a GIS do? How does a GIS work? GIS definitions Spatial (coordinate) data model Relational (tabular) data model intro_gis.ppt 1 Why use a GIS? An extension
Introduction-Overview Why use a GIS? What can a GIS do? How does a GIS work? GIS definitions Spatial (coordinate) data model Relational (tabular) data model intro_gis.ppt 1 Why use a GIS? An extension
DATA APPLIANCE FOR ARCGIS
 DATA APPLIANCE FOR ARCGIS Data Appliance for ArcGIS Provides Access to Multi-Scale Basemaps Down to Medium Scale Levels Worldwide And Large Scale for Most of the World The Data Appliance includes Several
Geographer s Toolkit. Geography of Canada
 Geographer s Toolkit Geography of Canada www.craigmarlatt.com/school Geographer s Toolkit 1. Parts of a Map Map Symbols Mapping Your Location 2. Types of Maps 3. Political Map of Canada 4. Drainage Map
Use of ArcGIS Applications for Analysis and Representation of the Terrains: The Case Study of Alakır River Sub-basin
 Use of ArcGIS Applications for Analysis and Representation of the Terrains: The Case Study of Alakır River Sub-basin Ahmet BENLİAY, Tahsin YILMAZ and H. Ekin OKTAY 1 Introduction 3D visualizations have
TECHNICAL DOCUMENT R 2 OF THE SPANISH BRAILLE COMMISSION GENERAL CRITERIA FOR PREPARING ADAPTED MAPS FOR VISUALLY IMPAIRED PERSONS
 TECHNICAL DOCUMENT R 2 OF THE SPANISH BRAILLE COMMISSION GENERAL CRITERIA FOR PREPARING ADAPTED MAPS FOR VISUALLY IMPAIRED PERSONS Updated on December 2013 (Version 1) First edition in English, March 2015
B. Topographic maps are also called. contour maps
 Topographic Maps Introduction A. Topographic maps are essential tools in geologic and engineering studies because they show the configuration of Earth's surface in remarkable detail and permit one to measure
GeoSUR SRTM 30-m / TPS
 GeoSUR SRTM 30-m / TPS Wm Matthew Cushing (USGS) 16 May 2013 U.S. Department of the Interior U.S. Geological Survey SRTM Mission Shuttle Radar Topography Mission (SRTM) Space Shuttle Endeavour during the
Lesson 5: Map Scale and Projections
 Organizing Data and Information Lesson 5: Map Scale and Projections Map Scales Projections Information can be organized as lists, numbers, tables, text, pictures, maps, or indexes. Clusters of information
Lecture 9: Reference Maps & Aerial Photography
 Lecture 9: Reference Maps & Aerial Photography I. Overview of Reference and Topographic Maps There are two basic types of maps? Reference Maps - General purpose maps & Thematic Maps - maps made for a specific
An Introduction to Geographic Information System
 An Introduction to Geographic Information System PROF. Dr. Yuji MURAYAMA Khun Kyaw Aung Hein 1 July 21,2010 GIS: A Formal Definition A system for capturing, storing, checking, Integrating, manipulating,
The Elements of GIS. Organizing Data and Information. The GIS Database. MAP and ATRIBUTE INFORMATION
 GIS s Roots in Cartography Getting Started With GIS Chapter 2 Dursun Z. Seker MAP and ATRIBUTE INFORMATION Data (numbers and text) store as files refer to them collectively as a database gather inform.
2013 Cartographic Country Report Uruguay **
 ADVANCE UNEDITED VERSION UNITED NATIONS _ STATISTICS DIVISION E/CONF.103/IP.5 Tenth United Nations Regional Cartographic Conference for the Americas New York, 19-23, August 2013 Item 6(b) of the provisional
GIS Lecture 5: Spatial Data
 GIS Lecture 5: Spatial Data GIS 1 Outline Vector Data Formats Raster Data Formats Map Projections Coordinate Systems US Census geographic files US Census data files GIS Data Sources GIS 2 Vector Data Formats
Spanish national plan for land observation: new collaborative production system in Europe
 ADVANCE UNEDITED VERSION UNITED NATIONS E/CONF.103/5/Add.1 Economic and Social Affairs 9 July 2013 Tenth United Nations Regional Cartographic Conference for the Americas New York, 19-23, August 2013 Item
PROANA A USEFUL SOFTWARE FOR TERRAIN ANALYSIS AND GEOENVIRONMENTAL APPLICATIONS STUDY CASE ON THE GEODYNAMIC EVOLUTION OF ARGOLIS PENINSULA, GREECE.
 PROANA A USEFUL SOFTWARE FOR TERRAIN ANALYSIS AND GEOENVIRONMENTAL APPLICATIONS STUDY CASE ON THE GEODYNAMIC EVOLUTION OF ARGOLIS PENINSULA, GREECE. Spyridoula Vassilopoulou * Institute of Cartography
Chapter 02 Maps. Multiple Choice Questions
 Chapter 02 Maps Multiple Choice Questions 1. Every projection has some degree of distortion because A. a curved surface cannot be represented on a flat surface without distortion. B. parallels and meridians
Illustrator: Vector base Each line/point store some sort of information Mapping Representation of the world
 Illustrator: Vector base Each line/point store some sort of information Mapping Representation of the world Photoshop Raster base Images can be overlaid Pixel vector data model: [data models] A representation
THE EVOLUTION OF MATHEMATICAL BASES OF POLISH TOPOGRAPHIC MAPS DURING THE RECENT 80 YEARS
 Michal Stankiewicz is a lecturer in map redaction, topography and topographic cartography in Department of Geodesy and Cartography, Warsaw University of Technology. In 1979 he obtained the degree of Doctor
BOUNDARIES, FIELD WORK AND GIS MANAGEMENT
 BOUNDARIES, FIELD WORK AND GIS MANAGEMENT Marc Torres Saura Institut Cartogràfic de Catalunya ABSTRACT The generalized use of digital maps and Geographic Information Systems has highlighted the need to
Outcrop suitability analysis of blueschists within the Dry Lakes region of the Condrey Mountain Window, North-central Klamaths, Northern California
 Outcrop suitability analysis of blueschists within the Dry Lakes region of the Condrey Mountain Window, North-central Klamaths, Northern California (1) Introduction: This project proposes to assess the
Popular Mechanics, 1954
 Introduction to GIS Popular Mechanics, 1954 1986 $2,599 1 MB of RAM 2017, $750, 128 GB memory, 2 GB of RAM Computing power has increased exponentially over the past 30 years, Allowing the existence of
Geographic Information Systems. Introduction to Data and Data Sources
 Geographic Information Systems Introduction to Data and Data Sources Presented by John Showler, NJDA-SSCC NJ SCD GIS Training Session December 10, 209 The Objectives of this session are 3-fold: 1. Introduce
Hydrology and Floodplain Analysis, Chapter 10
 Hydrology and Floodplain Analysis, Chapter 10 Hydrology and Floodplain Analysis, Chapter 10.1 Introduction to GIS GIS Geographical Information System Spatial Data Data linked with geographical location
SPOT DEM Precision Product description
 SPOT DEM Precision Product description Version1.0 - April 1st, 2006 This edition supersedes previous versions Acronyms DIMAP DTED DXF HRS JPEG, JPG Mb DTM DEM SRTM SVG TIFF - GeoTIFF XML Digital Image
EMERGENCY PLANNING IN NORTHERN ALGERIA BASED ON REMOTE SENSING DATA IN RESPECT TO TSUNAMI HAZARD PREPAREDNESS
 EMERGENCY PLANNING IN NORTHERN ALGERIA BASED ON REMOTE SENSING DATA IN RESPECT TO TSUNAMI HAZARD PREPAREDNESS Barbara Theilen-Willige Technical University of Berlin, Institute of Applied Geosciences Department
MAP STUDY: INTERPRETATION OF SURVEY MAPS
 MAP STUDY: INTERPRETATION OF SURVEY MAPS Types and Elements of Maps Maps are drawn to represent the Earth on a piece of paper. Maps are used widely to represent the Earth. Maps use signs and symbols in
DATA SOURCES AND INPUT IN GIS. By Prof. A. Balasubramanian Centre for Advanced Studies in Earth Science, University of Mysore, Mysore
 DATA SOURCES AND INPUT IN GIS By Prof. A. Balasubramanian Centre for Advanced Studies in Earth Science, University of Mysore, Mysore 1 1. GIS stands for 'Geographic Information System'. It is a computer-based
MAR-E1004 Basics of GIS: Georeferencing Jaakko Madetoja Slides adopted from Paula Ahonen-Rainio
 MAR-E1004 Basics of GIS: Georeferencing Jaakko Madetoja Slides adopted from Paula Ahonen-Rainio Learning goals In this session you will learn To describe the basics of different types of referencing systems
Local Government Basemaps using ArcGIS
 Local Government Basemaps using ArcGIS Steve Grisé Scott Oppmann Tuesday, July 14, 10:15-11:30am SDCC 30B Topics Basemaps for Local Government Essential Application-Driven New Ideas Design Strategies Discussion
Lab 1: Importing Data, Rectification, Datums, Projections, and Coordinate Systems
 Lab 1: Importing Data, Rectification, Datums, Projections, and Coordinate Systems Topics covered in this lab: i. Importing spatial data to TAS ii. Rectification iii. Conversion from latitude/longitude
Determining the Location of the Simav Fault
 Lindsey German May 3, 2012 Determining the Location of the Simav Fault 1. Introduction and Problem Formulation: The issue I will be focusing on involves interpreting the location of the Simav fault in
STUDYING THE EFFECT OF DISTORTION IN BASIC MAP ELEMENTS FOR THE DEGREE OF SPATIAL ACCURACY OF GAZA STRIP MAPS
 STUDYING THE EFFECT OF DISTORTION IN BASIC MAP ELEMENTS FOR THE DEGREE OF SPATIAL ACCURACY OF GAZA STRIP MAPS Maher A. El-Hallaq Assistant professor, Civil Engineering Department, IUG,, mhallaq@iugaza.edu.ps
GeoWEPP Tutorial Appendix
 GeoWEPP Tutorial Appendix Chris S. Renschler University at Buffalo - The State University of New York Department of Geography, 116 Wilkeson Quad Buffalo, New York 14261, USA Prepared for use at the WEPP/GeoWEPP
Making Maps With GIS. Making Maps With GIS
 Making Maps With GIS Getting Started with GIS Chapter 7 Making Maps With GIS 7.1 The Parts of a Map 7.2 Choosing a Map Type 7.3 Designing the Map 1 What is a map? Map is the communication tool for the
Lauren Jacob May 6, Tectonics of the Northern Menderes Massif: The Simav Detachment and its relationship to three granite plutons
 Lauren Jacob May 6, 2010 Tectonics of the Northern Menderes Massif: The Simav Detachment and its relationship to three granite plutons I. Introduction: Purpose: While reading through the literature regarding
The Retreat of the Grinnell Glacier: 1990-Present
 Falk, Hepler, Lopez 1 Megan Falk, Alex Hepler, Michelle Lopez GSP 270/ Graham Group Project/ Final Draft December 8, 2014 Word count: 1,148 Introduction The Retreat of the Grinnell Glacier: 1990-Present
Introducing GIS analysis
 1 Introducing GIS analysis GIS analysis lets you see patterns and relationships in your geographic data. The results of your analysis will give you insight into a place, help you focus your actions, or
Development of statewide 30 meter winter sage grouse habitat models for Utah
 Development of statewide 30 meter winter sage grouse habitat models for Utah Ben Crabb, Remote Sensing and Geographic Information System Laboratory, Department of Wildland Resources, Utah State University
MAPPING POTENTIAL LAND DEGRADATION IN BHUTAN
 MAPPING POTENTIAL LAND DEGRADATION IN BHUTAN Moe Myint, Geoinformatics Consultant Rue du Midi-8, CH-1196, Gland, Switzerland moemyint@bluewin.ch Pema Thinley, GIS Analyst Renewable Natural Resources Research
Topographic Maps and Landforms Geology Lab
 Topographic Maps and Landforms Geology Lab Ray Rector: Instructor Today s Lab Activities 1) Discussion of Last Week s Lab 2) Lecture on Topo Maps and Elevation Contours 3) Construct Topographic Maps and
Projecting a Gully on Wilson Ranch Meadow, Eldorado National Forest By David Russell and Angelina Lasko Humboldt State University
 Projecting a Gully on Wilson Ranch Meadow, Eldorado National Forest By David Russell and Angelina Lasko Humboldt State University Introduction The purpose of this project is to create a digital elevation
Map Reading: Grades 4 & 5
 Map Reading: Grades 4 & 5 Grades: 4,5 Team Size: 1-2 competitors Duration: 25 minutes Supervisors: Sriram Garapati, Rebecca Neill-Totsuka Summary Description Students will solve a mystery using different
10/13/2011. Introduction. Introduction to GPS and GIS Workshop. Schedule. What We Will Cover
 Introduction Introduction to GPS and GIS Workshop Institute for Social and Environmental Research Nepal October 13 October 15, 2011 Alex Zvoleff azvoleff@mail.sdsu.edu http://rohan.sdsu.edu/~zvoleff Instructor:
AP Human Geography Chapter 1: Thinking Geographically Key Issue 1: How do Geographers describe where things are?
 AP Human Geography Chapter 1: Thinking Geographically Key Issue 1: How do Geographers describe where things are? Studying Human Geography Physical Geography Physical geography deals with Earth s natural
Dr. ABOLGHASEM AKBARI Faculty of Civil Engineering & Earth Resources, University Malaysia Pahang (UMP)
") Workshop on : Dr. ABOLGHASEM AKBARI Faculty of Civil Engineering & Earth Resources, University Malaysia Pahang (UMP) 14-15 April 2016 Venue: Tehran, Iran GIS definitions GIS: A simplified view of the real
Workshop on : Dr. ABOLGHASEM AKBARI Faculty of Civil Engineering & Earth Resources, University Malaysia Pahang (UMP) 14-15 April 2016 Venue: Tehran, Iran GIS definitions GIS: A simplified view of the real
Geographical Information System GIS
 Geographical Information System GIS LOOM.02.331 anto.aasa@ut.ee Scale GIS and spatial planning National Regional Local Strategic (National Dev. Plan) National Goals and development policy Tactical (Regional
Military Geographic Institute
 Spatial Information Management and Workflow at IGM GDB ( Latitud Sur Project - 1:25.000 Cartographic Production) 90 YEARS SUPORTING THE NATIONAL DEVELOPMENT Major Julio Neira Gutierrez (MSc) Head of Geodetic
Summary Description Municipality of Anchorage. Anchorage Coastal Resource Atlas Project
 Summary Description Municipality of Anchorage Anchorage Coastal Resource Atlas Project By: Thede Tobish, MOA Planner; and Charlie Barnwell, MOA GIS Manager Introduction Local governments often struggle
Implementation of CLIMAP and GIS for Mapping the Climatic Dataset of Northern Iraq
 Implementation of CLIMAP and GIS for Mapping the Climatic Dataset of Northern Iraq Sabah Hussein Ali University of Mosul/Remote sensing Center KEYWORDS: CLIMAP, GIS, DEM, Climatic, IRAQ ABSTRACT The main
POLAR I.C.E. (Interactive Climate Education) REMOTE SENSING: USING RADAR TO LOOK THROUGH ICE
 REMOTE SENSING: USING RADAR TO LOOK THROUGH ICE") POLAR I.C.E. (Interactive Climate Education) REMOTE SENSING: USING RADAR TO LOOK THROUGH ICE BUILD A 3D MODEL OF THE LANDSCAPE THAT LIES UNDER THE ICE! INTRODUCTION: It is hard to believe that melting
POLAR I.C.E. (Interactive Climate Education) REMOTE SENSING: USING RADAR TO LOOK THROUGH ICE BUILD A 3D MODEL OF THE LANDSCAPE THAT LIES UNDER THE ICE! INTRODUCTION: It is hard to believe that melting
Digital Elevation Models (DEM) / DTM
 / DTM") Digital Elevation Models (DEM) / DTM Uses in remote sensing: queries and analysis, 3D visualisation, layers in classification Fogo Island, Cape Verde Republic ASTER DEM / image Banks Peninsula, Christchurch,
Digital Elevation Models (DEM) / DTM Uses in remote sensing: queries and analysis, 3D visualisation, layers in classification Fogo Island, Cape Verde Republic ASTER DEM / image Banks Peninsula, Christchurch,
The Montague Doppler Radar, An Overview
 ISSUE PAPER SERIES The Montague Doppler Radar, An Overview June 2018 NEW YORK STATE TUG HILL COMMISSION DULLES STATE OFFICE BUILDING 317 WASHINGTON STREET WATERTOWN, NY 13601 (315) 785-2380 WWW.TUGHILL.ORG
Geo-spatial Analysis for Prediction of River Floods
 Geo-spatial Analysis for Prediction of River Floods Abstract. Due to the serious climate change, severe weather conditions constantly change the environment s phenomena. Floods turned out to be one of
This week s topics. Week 6. FE 257. GIS and Forest Engineering Applications. Week 6
 FE 257. GIS and Forest Engineering Applications Week 6 Week 6 Last week Chapter 8 Combining and splitting landscape features and merging GIS databases Chapter 11 Overlay processes Questions? Next week
MRD-160 METADATA DETAIL PAGE
 MRD-160 METADATA DETAIL PAGE The following represents the Basic description of an information holding. To obtain more information about this holding, see the section named Contacts. GENERAL INFORMATION
ENV208/ENV508 Applied GIS. Week 2: Making maps, data visualisation, and GIS output
 ENV208/ENV508 Applied GIS Week 2: Making maps, data visualisation, and GIS output Overview GIS Output Map Making Types of Maps Key Elements GIS Output Formats Table Graph Statistics Maps Map Making Maps
GIS IN ECOLOGY: ANALYZING RASTER DATA
 GIS IN ECOLOGY: ANALYZING RASTER DATA Contents Introduction... 2 Raster Tools and Functionality... 2 Data Sources... 3 Tasks... 4 Getting Started... 4 Creating Raster Data... 5 Statistics... 8 Surface
GIS Geographic Information System
 GIS Geographic Information System Andrea Petroselli Tuscia University, Italy petro@unitus.it SUMMARY Part 1: Part 2: Part 3: Part 4: What is a GIS? Why do we need a GIS? Which are the possibilities of
Unit 1, Lesson 2. What is geographic inquiry?
 What is geographic inquiry? Unit 1, Lesson 2 Understanding the way in which social scientists investigate problems will help you conduct your own investigations about problems or issues facing your community
ABSTRACT The first chapter Chapter two Chapter three Chapter four
 ABSTRACT The researches regarding this doctoral dissertation have been focused on the use of modern techniques and technologies of topography for the inventory and record keeping of land reclamation. The
Using Ice Thickness and Bed Topography to Pick Field Sites Near Swiss Camp, Greenland
 Lauren Andrews 6 May 2010 GEO 386G: GIS final project Using Ice Thickness and Bed Topography to Pick Field Sites Near Swiss Camp, Greenland Problem Formulation My primary goal for this project is to map
In this exercise we will learn how to use the analysis tools in ArcGIS with vector and raster data to further examine potential building sites.
 GIS Level 2 In the Introduction to GIS workshop we filtered data and visually examined it to determine where to potentially build a new mixed use facility. In order to get a low interest loan, the building
Overview. GIS Data Output Methods
 Overview GIS Output Formats ENV208/ENV508 Applied GIS Week 2: Making maps, data visualisation, and GIS output GIS Output Map Making Types of Maps Key Elements Table Graph Statistics Maps Map Making Maps
Data Quality and Uncertainty. Accuracy, Precision, Data quality and Errors
 Data Quality and Uncertainty The power of GIS analysis is based on the assembly of layers of data, but as data layers increase, errors multiply (and quality decreases). Garbage in, garbage out. High quality
CHILEAN GEO-SPATIAL NATIONAL DATA INFRASTRUCTURE (INDE) Pablo Gran Rodrigo Barriga Alfredo Gonzalez María L. Advis Juan C. Montero Leonardo Oyarzun
 Pablo Gran Rodrigo Barriga Alfredo Gonzalez María L. Advis Juan C. Montero Leonardo Oyarzun") CHILEAN GEO-SPATIAL NATIONAL INFRASTRUCTURE (INDE) Pablo Gran Rodrigo Barriga Alfredo Gonzalez María L. Advis Juan C. Montero Leonardo Oyarzun ABSTRACT The present paper summarizes a joint effort undertaken
CHILEAN GEO-SPATIAL NATIONAL INFRASTRUCTURE (INDE) Pablo Gran Rodrigo Barriga Alfredo Gonzalez María L. Advis Juan C. Montero Leonardo Oyarzun ABSTRACT The present paper summarizes a joint effort undertaken
5 Themes of Geography Review Video Notes What is Geography?
 Name PG # 5 Themes of Geography Review Video Notes What is Geography? The study of, their, and their Main Idea or Topic Continents Notes about Main Idea or Topic There are 7 Continents or in the world:
Pipeline Routing Using Geospatial Information System Analysis
 Pipeline Routing Using Geospatial Information System Analysis Mahmoud Reza 1 Delavar and Fereydoon 2 Naghibi 1-Assistance Professor, Dept. of Surveying and Geomatic Eng., Eng. Faculty, University of Tehran,
Name Class Date. For each pair of terms, explain how the meanings of the terms differ.
 Skills Worksheet Chapter Review USING KEY TERMS For each pair of terms, explain how the meanings of the terms differ. 1. true north and magnetic north 2. latitude and longitude 3. equator and prime meridian
Wayne E. Sirmon GEO 301 World Regional Geography
 Wayne E. Sirmon GEO 301 Geography 301 Geography 301 MAP: A graphic representation of a portion of the earth s surface dawn to scale, as seen from above. Types of Maps Climate maps give general information
Geo 327G Semester Project. Landslide Suitability Assessment of Olympic National Park, WA. Fall Shane Lewis
 Geo 327G Semester Project Landslide Suitability Assessment of Olympic National Park, WA Fall 2011 Shane Lewis 1 I. Problem Landslides cause millions of dollars of damage nationally every year, and are
About places and/or important events Landmarks Maps How the land is, hills or flat or mountain range Connected to maps World Different countries
 What do you think you know about geography? About places and/or important events Landmarks Maps How the land is, hills or flat or mountain range Connected to maps World Different countries What do you
FlexiCadastre User Conference 2013 GIS Data Verification & Challenges
 FlexiCadastre User Conference 2013 GIS Data Verification & Challenges May 7, 2013 Amanda Blackmore GIS Specialist OVERVIEW GIS Definitions & Terminology Spatial Data Common Issues or Concerns Data Verification
Date: UNI. world. *Dedicated to
 Name: Date: UNI IT THREE 2D and 3D model s of the natural world *Dedicated to Name: Date: ABSTRACT T AND RATIONALE A topographic map is a type of map that depicts the detail and quantitative representation