Reminder that we update the website: with new information, project updates, etc.
|
|
|
- Eugene Wilkinson
- 6 years ago
- Views:
Transcription
1 1

2 Reminder that we update the website: with new information, project updates, etc. regularly. Any suggestions are welcome on how to make the website more user friendly. 2
3 3

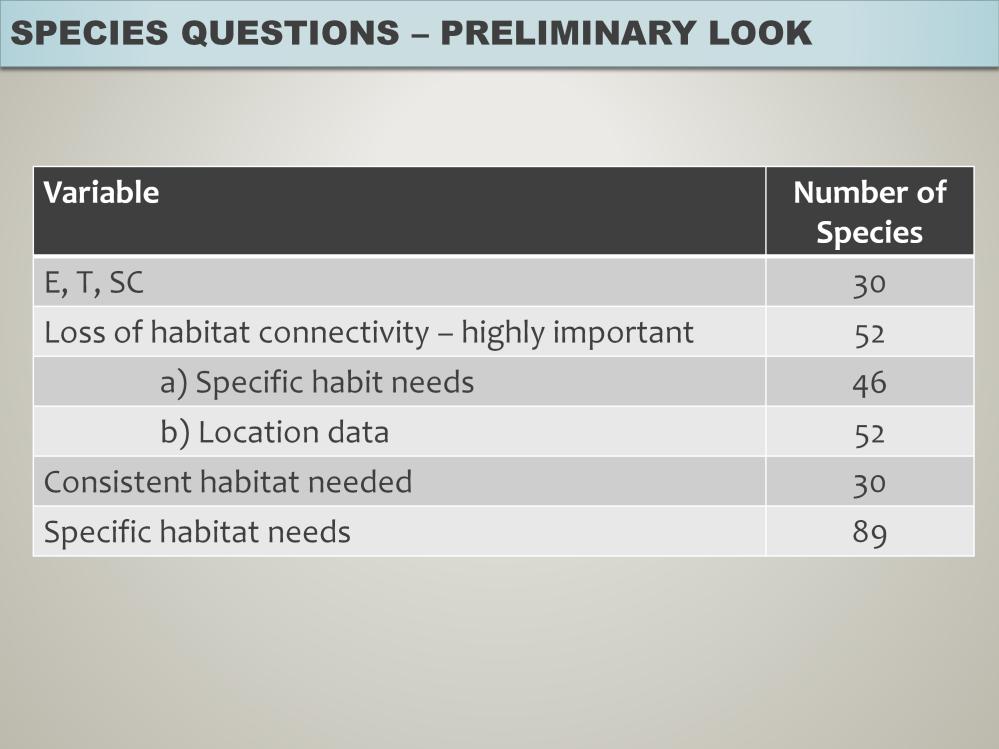
4 See the draft list of terrestrial species (terrestrial_spc_list_draft.pdf) on the website under Working Group/Core Teams/Mapping. There are still remaining questions about whether some of the species on the list should be on it. We are assembling a species subteam as part of the mapping core team that can work to get more input and make recommendations so we can finalize the list. 4

5 Rodentia and Soricomorpha were also included with the Low mobility small fauna guild. 5
6 6

7 More details are asked and collected re: locational data such as locational accuracy, dates, # of locations, extent, etc. The list of questions asked has been posted on the website under the Mapping team. Again, the species subteam will hopefully help flesh these data out and put them in a summary format that can be used by the working group and eventually in our methodology report. 7

8 Folks at the meeting mentioned that there are likely more sources of telemetry data out there. This is part of the reason for forming a species subteam, to help seek out additional sources of data. 8

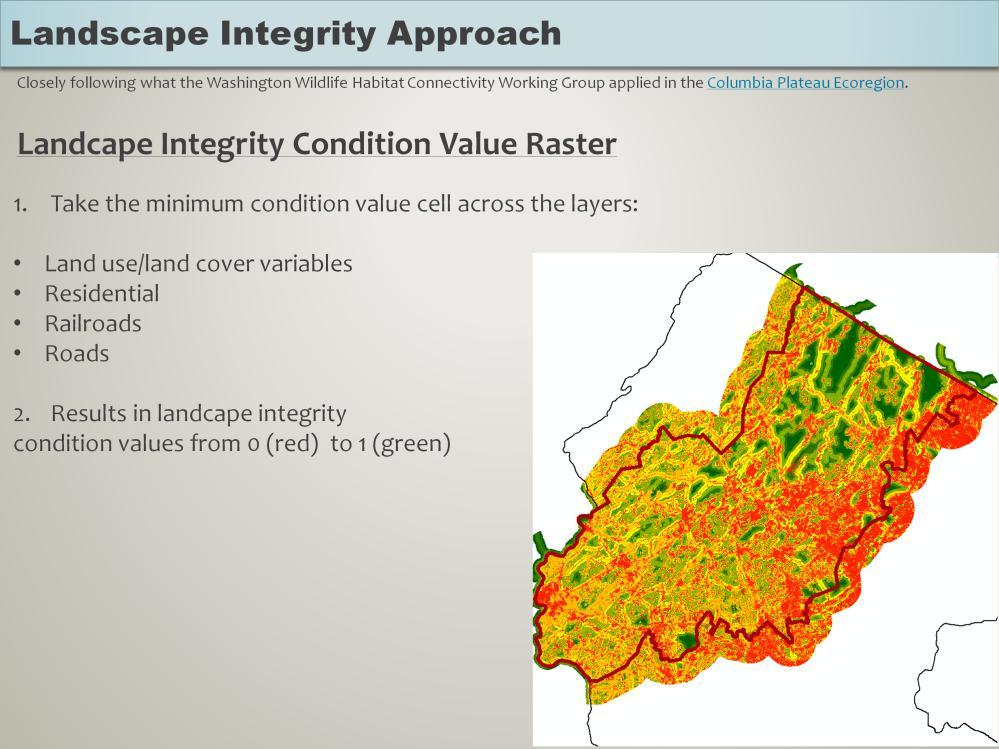
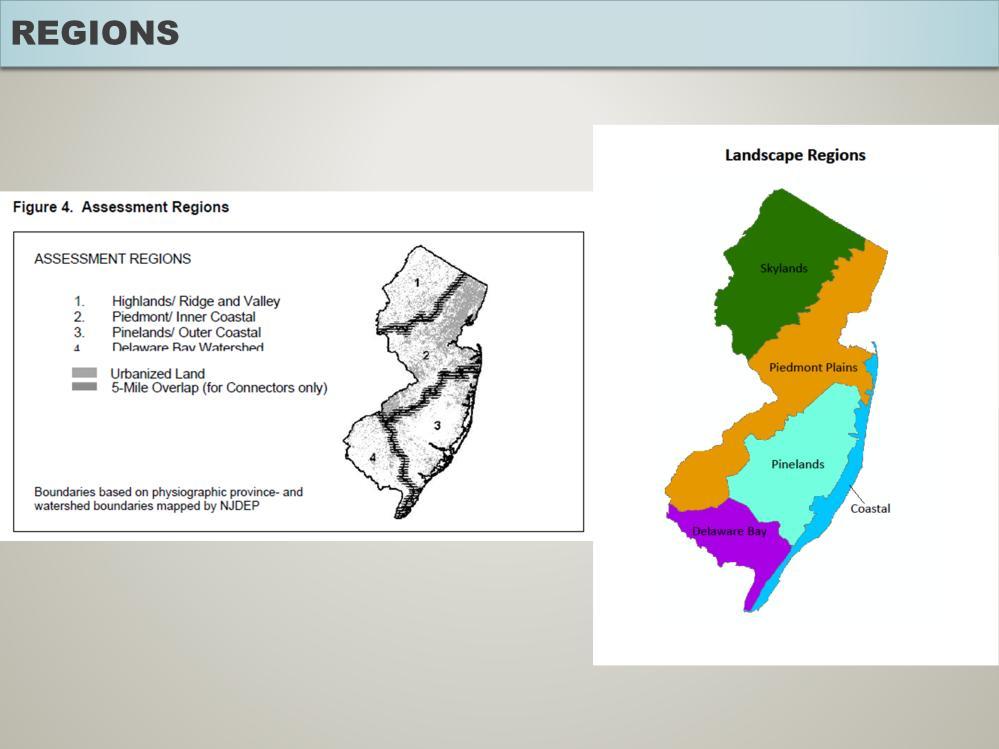
9 I just used the Highlands Region because it s a small regioner area than statewide within which to try the tools, and I work in an office with Highlands species experts, so easy access to feedback. However, we will need to consider whether or not to break down the analysis by region and if so, how will we define the regions? 9

10 A 30m cell size was not a problem for the core delineation tools. The corridor modeling toolset is a bit more intensive and took approximately 20 minutes to build corridors for 8 cores, but there are many different options to select from, and this is just based on one experimental run. 10

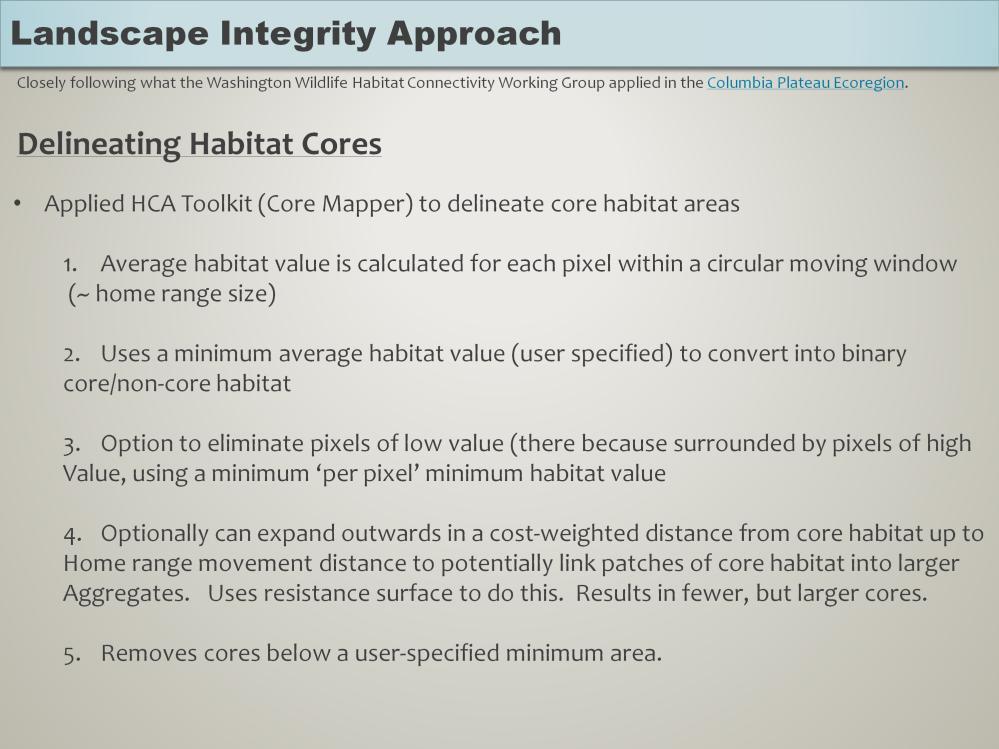
11 The values I used are in the same place as this pdf and called DRAFT_LUCAT_GFMod_w_notes.pdf. The variables and values Washington used can be found in the same folder and is called: ColumbiaPlateauEcoregion_2012 Appendix_C.pdf Washington gave open water a condition value of.9 (the same as forest, wetlands, etc.) in their condition value raster, used to delineate cores, because they didn t want to risk excluding areas as cores that had a body of open water surrounded by habitat with high landscape integrity scores. On the other hand, for their resistance raster, they did give open water a low value (.5) because it can be an impediment to movement for many species. Ag given a value of.3 (same as Washington) Mtg discussion: Pinelands came under a lot of criticism for not including any agriculture in the ecological assessment. This is a valid criticism since there are many months of a year during which fields aren t being used and some types of ag can be good wildlife habitat. Could treat ag differently depending on patch size. In Landscape Project, just small patches of ag get valued by bobcats. Could do something similar where small patches are given larger values than large patches. 11

12 Washington included housing density values as described in the first table. They derived them from the US Census 2000 data. I m not that familiar with census data, but it seems too coarse for our purposes and we also have a great lulc dataset capturing residential. Instead, I valued all residential the same (mixed, high density, medium density, low density, single unit) and then calculated the percentage of residential within a 250m radius circle. Mtg discussion: This way treat all residential the same. Could weight using residential density and/or impervious surface. Consider treating all development this way rather than just residential Could include commercial services and other types of development with the high density residential weight if decide to weight Could try a decay function so a continuous variable rather than discrete As is, 2 categories of residential have higher values than ag. Restoration is possible on ag to a more suitable habitat type, but much less so where there is housing/impervious surface. 250m radius just chosen without much justification. It s reasonable, but could also be too big perhaps so should try a smaller size as well. What buffer do we need to give residential/development. 12

13 I found 2 railroad datasets that seems reasonable complete. The US rails looks good, but there are some breaks in the coverage that likely aren t accurate, so will need to fix if we use them. I called transit rail active and US rails not included in the transit rail coverage as inactive, but surely not true. Mtg discussion: If we are able to find an accurate inactive coverage, that doesn t necessarily mean won t be active again. Might be better to include abandoned railroads as inactive if can find that coverage, if those are less likely to become active again. Will see what DVRPC has. Traffic or no traffic, railroads can act as impediments to movement for many small species like amphibians. Road curbs can as well, but not all curbs are a problem whereas almost all rails are a problem. (There are ways to mitigate and create passage) 13

14 Mtg discussion: Would be better to use road volume many studies have shown that is the main factor influencing impact on wildlife. However, DOT has it for state roads and some county roads, but counties seem to have varying information. Some have data, but it is just related to point where measurement was taken and can t be extrapolated to a section of roadway, which is what we d need. Applied like Washington and it clearly seems like buffers are too big hardly anything left in NJ (see next slide)! Washington valued roads such that core areas would not include even any local roads, although they did allow for low densities of low use local roads. Will need to consider changing buffer sizes and values applied to roadways. We don t have accurate coverages of low use roads. In Pinelands they found that there wasn t a good sand road coverage so couldn t use them. Pinelands measured a subset of roads to estimate width of different types of roads. Maybe won t matter for us if we use a 30m cell size all road centerlines treated as such? Does it make sense to include all large bridges (would need to figure out threshold size) as passageways for terrestrial wildlife? Many do provide dry passage, and it d be nice to have the corridor modeling aim for them in those cases as breaks in roads, but not sure that s accurate. In this iteration I used bridge over water category from lulc, but DOT does have a bridge shapefile. I haven t been able to get metadata from them to know what the attributes mean yet. 14
15 bridge over water should be included with water because streams in the lulc are actually broken by them. 14

16 Refer to second point in previous slide 15

17 Did not include these variables in this iteration. Should we in the future? If we included riparian, should we include ridgelines? Possibly riparian and ridgeline as.95?? 16
18 17
19 18
20 19

21 This is result #1 cores are black outlined in white. This was using threshold size and value inputs very similar to what WA had used. Obviously, those input aren t going to work. 20

22 This is changing some of the input values, so it delineated all of the areas in black as cores and then the final cores meeting the threshold size I set include those with white outlines. So, the input values enter do have a large impact and we ll have to think carefully about what we use. It s possible we ll have different input values for the different movement guilds to account at the very least for the fact that the species on our list have drastically different home range size requirements. 21
23 22

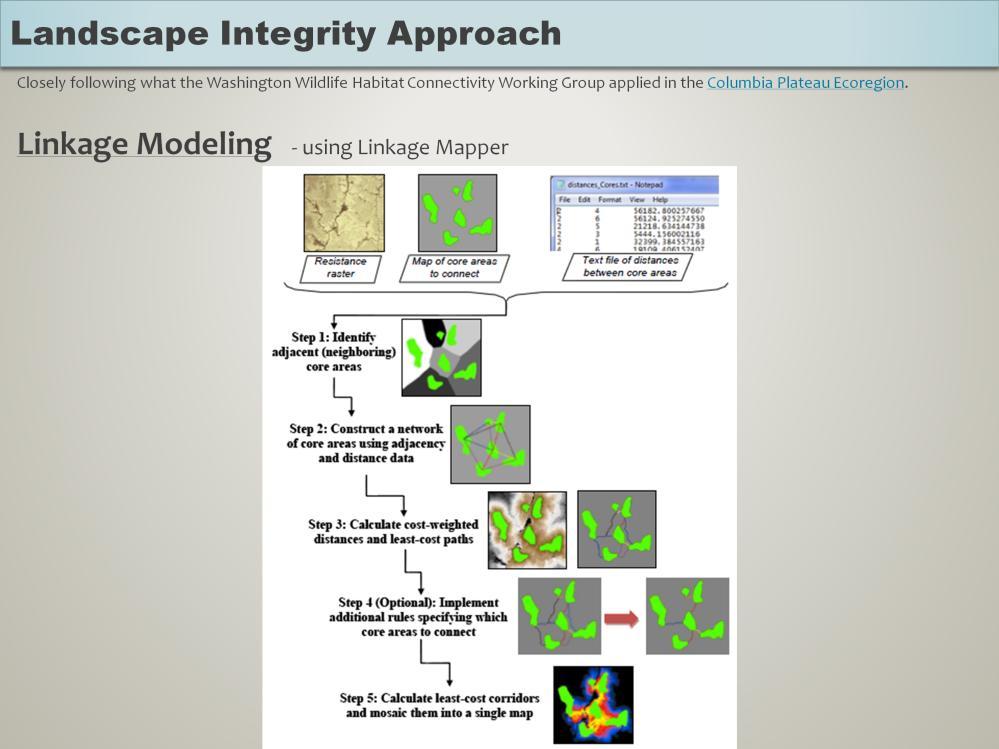
24 This is using the cores resulting from the first run shown on slide 20 and then running the corridor modeling. The darkest corridors represent the areas of least resistance between cores. This is an example of the output showing how in many cases, there will be multiple options provided. Again, there are many different inputs you can provide for the corridor modeling, so we ll have to think carefully about those decisions. 23

25 There are also options to run further analyses once the corridors have been delineated that could be very helpful for us. 24
26 25

27 Please let me know if you are interested on helping out on either/both the species and GIS sub-teams. 26
28 27
WEBINAR AGENDA. Review of connectivity mapping progress to date. Describe draft methodology for delineating and validating core areas
 WEBINAR AGENDA Review of connectivity mapping progress to date Describe draft methodology for delineating and validating core areas Review examples of the methodology implemented in the Highlands Explain
Summary Description Municipality of Anchorage. Anchorage Coastal Resource Atlas Project
 Summary Description Municipality of Anchorage Anchorage Coastal Resource Atlas Project By: Thede Tobish, MOA Planner; and Charlie Barnwell, MOA GIS Manager Introduction Local governments often struggle
2011 Land Use/Land Cover Delineation. Meghan Jenkins, GIS Analyst, GISP Jennifer Kinzer, GIS Coordinator, GISP
 2011 Land Use/Land Cover Delineation Meghan Jenkins, GIS Analyst, GISP Jennifer Kinzer, GIS Coordinator, GISP History O Key Points O Based on Anderson s Land Use and Land Cover Classification System O
Math Lab 8: Electric Fields Integrating Continuous Charge Distributions II Due noon Thu. Feb. 1 in class
 Matter & Motion Winter 2017 18 Name: Math Lab 8: Electric Fields Integrating Continuous Charge Distributions II Due noon Thu. Feb. 1 in class Goals: 1. Learn to use Mathematica to plot functions and to
Getting On the Same Page and Parcel
 Getting On the Same Page and Parcel Local flair is a valued and cherished quality of small Vermont towns and cities. The Agency of Natural Resources works daily with town officials and local committee
Thank you for your interest in the Support Resistance Strength Analyzer!
 This user manual refer to FXCM s Trading Station version of the indicator Support Resistance Strength Analyzer Thank you for your interest in the Support Resistance Strength Analyzer! This unique indicator
HOUSEKEEPING. Notes. Upcoming meetings related to connectivity: FTP site? Zotero
 HOUSEKEEPING Notes Upcoming meetings related to connectivity: FTP site? Zotero NJ Land Conservation Rally March 9, 2013; NJIT in Newark, NJ One-day educational conference about preserving New Jersey s
Introducing GIS analysis
 1 Introducing GIS analysis GIS analysis lets you see patterns and relationships in your geographic data. The results of your analysis will give you insight into a place, help you focus your actions, or
Exercise 2: Working with Vector Data in ArcGIS 9.3
 Exercise 2: Working with Vector Data in ArcGIS 9.3 There are several tools in ArcGIS 9.3 used for GIS operations on vector data. In this exercise we will use: Analysis Tools in ArcToolbox Overlay Analysis
FSUTMS Framework for Integrating Land Use Modeling
 FSUTMS Framework for Integrating Land Use Modeling presented to MTF Data Committee presented by Wade L. White, Whitehouse Group Walter Anderson, Whitehouse Group March 6, 2012 Agenda Background Previous
Louisiana Transportation Engineering Conference. Monday, February 12, 2007
 Louisiana Transportation Engineering Conference Monday, February 12, 2007 Agenda Project Background Goal of EIS Why Use GIS? What is GIS? How used on this Project Other site selection tools I-69 Corridor
2014 UTP Public Meeting July 18, 2013
 2014 UTP Public Meeting July 18, 2013 What is the Unified Transportation Program (UTP)? 3 UTP is Updated Annually by August 31st Spring - Summer 2013 UTP 2014 UTP UTP Development Process 4 UTP Connects
Exercise 2: Working with Vector Data in ArcGIS 9.3
 Exercise 2: Working with Vector Data in ArcGIS 9.3 There are several tools in ArcGIS 9.3 used for GIS operations on vector data. In this exercise we will use: Analysis Tools in ArcToolbox Overlay Analysis
Resilient Landscapes Fund
 Resilient Landscapes Fund Definitions and Map Guide 2017 This document includes definitions of key terms and instructions for developing maps for application to OSI s Resilient Landscapes Fund. INTRODUCTION
Introduction. Project Summary In 2014 multiple local Otsego county agencies, Otsego County Soil and Water
 Introduction Project Summary In 2014 multiple local Otsego county agencies, Otsego County Soil and Water Conservation District (SWCD), the Otsego County Planning Department (OPD), and the Otsego County
Chapter 6. Fundamentals of GIS-Based Data Analysis for Decision Support. Table 6.1. Spatial Data Transformations by Geospatial Data Types
 Chapter 6 Fundamentals of GIS-Based Data Analysis for Decision Support FROM: Points Lines Polygons Fields Table 6.1. Spatial Data Transformations by Geospatial Data Types TO: Points Lines Polygons Fields
Road to GIS, PSE s past, present and future
 Road to GIS, PSE s past, present and future PSE Gas Mapping History 1840 Early 1900 s Gas piping was captured in Field Books which were than converted onto Mylar maps using Pen and Ink. 1955 Washington
Public Transportation Infrastructure Study (PTIS) - 2 nd Technical Advisory Committee Meeting
 - 2 nd Technical Advisory Committee Meeting") Public Transportation Infrastructure Study (PTIS) - 2 nd Technical Advisory Committee Meeting Presentation to: Technical Advisory Committee (TAC) Presented by: and Team July 8th, 2009 Public Transportation
Public Transportation Infrastructure Study (PTIS) - 2 nd Technical Advisory Committee Meeting Presentation to: Technical Advisory Committee (TAC) Presented by: and Team July 8th, 2009 Public Transportation
Minimum Standards for Wetland Delineations
 Minimum Standards for Wetland Delineations Jason Gipson Chief, Utah/Nevada Regulatory Branch Sacramento District Regulatory Program Workshop 16 Mar 2016 US Army Corps of Engineers Delineation Report Minimum
QUADRATICS 3.2 Breaking Symmetry: Factoring
 QUADRATICS 3. Breaking Symmetry: Factoring James Tanton SETTING THE SCENE Recall that we started our story of symmetry with a rectangle of area 36. Then you would say that the picture is wrong and that
Link to USGS Phase 6 Land Use Viewer website:
 Chesapeake Bay Program Phase 6 Land Use Review Frequently Asked Questions (FAQ) Link to USGS Phase 6 Land Use Viewer website: http://chesapeake.usgs.gov/phase6/ Sections: 1. Data Review and Production
User Guide: RADON POTENTIAL DATASET - England and Wales
 User Guide: RADON POTENTIAL DATASET - England and Wales This document provides information for users of the joint HPA-BGS RADON POTENTIAL DATASET for England and Wales. 1. Background to joint Health Protection
KENTUCKY HAZARD MITIGATION PLAN RISK ASSESSMENT
 KENTUCKY HAZARD MITIGATION PLAN RISK ASSESSMENT Presentation Outline Development of the 2013 State Hazard Mitigation Plan Risk Assessment Determining risk assessment scale Census Data Aggregation Levels
GIS in Community & Regional Planning
 GIS in Community & Regional Planning The The role role of of GIS GIS in in Re-writing the the Zoning Bylaw for for the the City City of of Vernon LandInfo Technologies Presentation Overview The GIS Initiative
Paul Bridge Meteorologist Vaisala/UKMO Work Groups/Committees: WMO/TRB/AMS
 Paul Bridge Meteorologist Vaisala/UKMO Work Groups/Committees: WMO/TRB/AMS Introduction (a) Identify and establish, if possible, inventories of transport networks in the ECE region which are vulnerable
BRETT SUMMERS, PROJECT DIRECTOR, LEVEL CROSSING AUTHORITY INTERVIEW WITH JON FAINE MELBOURNE RADIO ABC 774 FRIDAY 2 SEPTEMBER 2016, 9.
 , PROJECT DIRECTOR, LEVEL CROSSING AUTHORITY INTERVIEW WITH JON MELBOURNE RADIO ABC 774 FRIDAY 2 SEPTEMBER 2016, 9.13 You may or may not have been listening yesterday when on the open line, Jan from Caulfield
Data Structures & Database Queries in GIS
 Data Structures & Database Queries in GIS Objective In this lab we will show you how to use ArcGIS for analysis of digital elevation models (DEM s), in relationship to Rocky Mountain bighorn sheep (Ovis
Frequently Asked Questions about MnDOT s Railroad Map Conversion Project
 Frequently Asked Questions about MnDOT s Railroad Map Conversion Project What were the main objectives of the project? What are the results and end products? What can these railroad maps be used for? Who
Preliminary Calculation of Landscape Integrity in West Virginia Based on Distance from Weighted Disturbances
 Preliminary Calculation of Landscape Integrity in West Virginia Based on Distance from Weighted Disturbances Michael Dougherty and Elizabeth Byers Technical Support and Wildlife Diversity Units, Wildlife
INDOT Office of Traffic Safety
 Intro to GIS Spatial Analysis INDOT Office of Traffic Safety Intro to GIS Spatial Analysis INDOT Office of Traffic Safety Kevin Knoke Section 130 Program Manager Highway Engineer II Registered Professional
Location Suitability Analysis
 2010 Fall 406 Final Project Location Suitability Analysis New Burger stores in San Fernando Valley Presenter: Rich Lee I. Introduction In-N-Out Burger is famous in South West America. Established in 1948
Gridded Traffic Density Estimates for Southern
 Gridded Traffic Density Estimates for Southern California, 1995-2014 User Notes authored by Beau, 11/28/2017 METADATA: Each raster file contains Traffic Density data for one year (1995, 2000, 2005, 2010,
 www.ct.gov/opm/cdplan Role of the Locational Guide Map State agencies shall not provide funding for certain growth-related projects unless such projects are located within a priority funding area LGM shall
Analyzing Suitability of Land for Affordable Housing
 Analyzing Suitability of Land for Affordable Housing Vern C. Svatos Jarrod S. Doucette Abstract: This paper explains the use of a geographic information system (GIS) to distinguish areas that might have
1 Impact Evaluation: Randomized Controlled Trial (RCT)
") Introductory Applied Econometrics EEP/IAS 118 Fall 2013 Daley Kutzman Section #12 11-20-13 Warm-Up Consider the two panel data regressions below, where i indexes individuals and t indexes time in months:
Introductory Applied Econometrics EEP/IAS 118 Fall 2013 Daley Kutzman Section #12 11-20-13 Warm-Up Consider the two panel data regressions below, where i indexes individuals and t indexes time in months:
What is proof? Lesson 1
 What is proof? Lesson The topic for this Math Explorer Club is mathematical proof. In this post we will go over what was covered in the first session. The word proof is a normal English word that you might
The data for this lab comes from McDonald Forest. We will be working with spatial data representing the forest boundary, streams, roads, and stands.
 GIS LAB 6 Using the Projection Utility. Converting Data to Oregon s Approved Lambert Projection. Determining Stand Size, Stand Types, Road Length, and Stream Length. This lab will ask you to work with
Tips and Tricks in Real Analysis
 Tips and Tricks in Real Analysis Nate Eldredge August 3, 2008 This is a list of tricks and standard approaches that are often helpful when solving qual-type problems in real analysis. Approximate. There
ARCGIS TRAINING AT KU GIS LABS: INTRODUCTION TO GIS: EXPLORING ARCCATALOG AND ARCGIS TOOLS
 PHASE 1_4 th SESSION ARCGIS TRAINING AT KU GIS LABS: INTRODUCTION TO GIS: EXPLORING ARCCATALOG AND ARCGIS TOOLS 4 th SESSION REPORT: 30 TH JUNE - 2 ND JULY SCHOOL OF ENVIRONMENTAL STUDIES COMPUTER LAB
Spatial Non-Cellular Automata
 ECOSYSTEM MODELS Spatial Non-Cellular Automata Tony Starfield Recorded: March, 2011 In the previous segment, we looked at cellular automata models, but we ended with the idea that not all spatial models
New Land Cover & Land Use Data for the Chesapeake Bay Watershed
 New Land Cover & Land Use Data for the Chesapeake Bay Watershed Why? The Chesapeake Bay Program (CBP) partnership is in the process of improving and refining the Phase 6 suite of models used to inform
BGIS Data Submission Guidelines Sediqa Khatieb Biodiversity Planning Forum May 2013
 BGIS Data Submission Guidelines Sediqa Khatieb Biodiversity Planning Forum May 2013 Statistics - 12 months TEXT File No. of Downloads 1 http://bgis.sanbi.org/ FF_Ecosystem_Guidelines.pdf 82,653 2 http://bgis.sanbi.org/nba/
Office of Geographic Information Systems
 Winter 2007 Department Spotlight SWCD GIS by Dave Holmen, Dakota County Soil and Water Conservation District The Dakota County Soil and Water Conservation District (SWCD) has collaborated with the Dakota
Assessing Michigan s Biological diversity. Michigan Natural Features Inventory MSU Extension
 Assessing Michigan s Biological diversity John Paskus,, Amy Derosier,, Edward Schools, and Helen Enander Michigan Natural Features Inventory MSU Extension Goal Provide scientifically based information
Transport Planning in Large Scale Housing Developments. David Knight
 Transport Planning in Large Scale Housing Developments David Knight Large Scale Housing Developments No longer creating great urban spaces in the UK (Hall 2014) Transport Planning Transport planning processes
Neighborhood Locations and Amenities
 University of Maryland School of Architecture, Planning and Preservation Fall, 2014 Neighborhood Locations and Amenities Authors: Cole Greene Jacob Johnson Maha Tariq Under the Supervision of: Dr. Chao
1) make sure folks know what s available in terms of geospatial data and resources that could contribute to their decision support toolkits;
 make sure folks know what s available in terms of geospatial data and resources that could contribute to their decision support toolkits;") Introduction 1 2001 It was born out of the recognition that several of the regions prominent resource management agencies have similar, if not shared, requirements for GIS data. Some of the underlying
Introduction 1 2001 It was born out of the recognition that several of the regions prominent resource management agencies have similar, if not shared, requirements for GIS data. Some of the underlying
Section 20: Arrow Diagrams on the Integers
 Section 0: Arrow Diagrams on the Integers Most of the material we have discussed so far concerns the idea and representations of functions. A function is a relationship between a set of inputs (the leave
Developed new methodologies for mapping and characterizing suburban sprawl in the Northeastern Forests
 Development of Functional Ecological Indicators of Suburban Sprawl for the Northeastern Forest Landscape Principal Investigator: Austin Troy UVM, Rubenstein School of Environment and Natural Resources
Period Analysis on a Spreadsheet
 Aliases in Depth An alias for a period is another period where the data seemingly fits as well, or nearly so, as the correct period. The most common encounter with aliasing is when you observe a target
The Geodatabase Working with Spatial Analyst. Calculating Elevation and Slope Values for Forested Roads, Streams, and Stands.
 GIS LAB 7 The Geodatabase Working with Spatial Analyst. Calculating Elevation and Slope Values for Forested Roads, Streams, and Stands. This lab will ask you to work with the Spatial Analyst extension.
presents challenges related to utility infrastructure planning. Many of these challenges
 1 Introduction: - a. Purpose According to U.S. Census Bureau the population of stark county was 367,585 in 1990, and in 2000 it was increase to 378,098. Thus County is experiencing a growth that presents
MIT BLOSSOMS INITIATIVE
 MIT BLOSSOMS INITIATIVE The Broken Stick Problem Taught by Professor Richard C. Larson Mitsui Professor of Engineering Systems and of Civil and Environmental Engineering Segment 1 Hi! My name is Dick Larson
Abstract: Contents. Literature review. 2 Methodology.. 2 Applications, results and discussion.. 2 Conclusions 12. Introduction
 Abstract: Landfill is one of the primary methods for municipal solid waste disposal. In order to reduce the environmental damage and to protect the public health and welfare, choosing the site for landfill
The Use of GIS in Habitat Modeling
 Amy Gottfried NRS 509 The Use of GIS in Habitat Modeling In 1981, the U.S. Fish and Wildlife Service established a standard process for modeling wildlife habitats, the Habitat Suitability Index (HSI) and
Semester Project Final Report. Logan River Flood Plain Analysis Using ArcGIS, HEC-GeoRAS, and HEC-RAS
 Semester Project Final Report Logan River Flood Plain Analysis Using ArcGIS, HEC-GeoRAS, and HEC-RAS Kedric Curtis, Josh Hogge, Jordan Jarrett, Jared Justensen May 6, 2016 CEE 6190 GIS for Civil Engineers
Manipulating Radicals
 Lesson 40 Mathematics Assessment Project Formative Assessment Lesson Materials Manipulating Radicals MARS Shell Center University of Nottingham & UC Berkeley Alpha Version Please Note: These materials
An Update on Land Use & Land Cover Mapping in Ireland
 An Update on Land Use & Land Cover Mapping in Ireland Progress Towards a National Programme Kevin Lydon k.lydon@epa.ie Office of Environmental Assessment, Environmental Protection Agency, Johnstown Castle,
Classification of Erosion Susceptibility
 GEO327G: GIS & GPS Applications in Earth Sciences Classification of Erosion Susceptibility Denali National Park, Alaska Zehao Xue 12 3 2015 2 TABLE OF CONTENTS 1 Abstract... 3 2 Introduction... 3 2.1 Universal
Basics of Proofs. 1 The Basics. 2 Proof Strategies. 2.1 Understand What s Going On
 Basics of Proofs The Putnam is a proof based exam and will expect you to write proofs in your solutions Similarly, Math 96 will also require you to write proofs in your homework solutions If you ve seen
In order to follow this exercise you need to have completed exercise 1.
 In order to follow this exercise you need to have completed exercise 1. Contents of Exercise 2: Derive new datasets from inputs and carry out Multicriteria analysis in order to Part 1: Use Spatial Analysis
ARCGIS TRAINING AT KU GIS LABS: INTRODUCTION TO GIS: EXPLORING ARCCATALOG AND ARCGIS TOOLS
 PHASE 1_3 rd SESSION ARCGIS TRAINING AT KU GIS LABS: INTRODUCTION TO GIS: EXPLORING ARCCATALOG AND ARCGIS TOOLS 3 rd SESSION REPORT: 25 TH -27 TH JUNE 2014 SCHOOL OF ENVIRONMENTAL STUDIES COMPUTER LAB
Amphibian Conservation and GIS
 Allen Hamilton Dr. August/Dr. Wang 12/11/13 Amphibian Conservation and GIS Amphibian populations have been on the decline in recent years, partly due to climate change, increase in mortality and loss of
Delineation of Watersheds
 Delineation of Watersheds Adirondack Park, New York by Introduction Problem Watershed boundaries are increasingly being used in land and water management, separating the direction of water flow such that
Descriptive Statistics (And a little bit on rounding and significant digits)
") Descriptive Statistics (And a little bit on rounding and significant digits) Now that we know what our data look like, we d like to be able to describe it numerically. In other words, how can we represent
Descriptive Statistics (And a little bit on rounding and significant digits) Now that we know what our data look like, we d like to be able to describe it numerically. In other words, how can we represent
STARTING WITH CONFIDENCE
 STARTING WITH CONFIDENCE A- Level Maths at Budmouth Name: This booklet has been designed to help you to bridge the gap between GCSE Maths and AS Maths. Good mathematics is not about how many answers you
Tutorial 8 Raster Data Analysis
 Objectives Tutorial 8 Raster Data Analysis This tutorial is designed to introduce you to a basic set of raster-based analyses including: 1. Displaying Digital Elevation Model (DEM) 2. Slope calculations
Land Cover Classification Mapping & its uses for Planning
 Land Cover Classification Mapping & its uses for Planning What is Land Cover Classification Mapping? Examples of an actual product Why use Land Cover Classification Mapping for planning? Possible uses
Some of the underlying goals of the GIS Library are to:
 1 2001 It was born out of the recognition that several of the regions prominent resource management agencies have similar, if not shared, requirements for GIS data. Some of the underlying goals of the
Shootout 2017 Problem Statement
 Shootout 2017 Problem Statement Understanding Wildfires 1 Background In the fall of 2016, a number of wildfires occurred in the southeastern United States. Spanning over 5 states and several weeks, more
Quadratic Equations Part I
 Quadratic Equations Part I Before proceeding with this section we should note that the topic of solving quadratic equations will be covered in two sections. This is done for the benefit of those viewing
Southwest LRT Habitat Analysis. May 2016 Southwest LRT Project Technical Report
 Southwest LRT Habitat Analysis Southwest LRT Project Technical Report This page intentionally blank. Executive Summary This technical report describes the habitat analysis that was performed to support
A Comprehensive Inventory of the Number of Modified Stream Channels in the State of Minnesota. Data, Information and Knowledge Management.
 A Comprehensive Inventory of the Number of Modified Stream Channels in the State of Minnesota Data, Information and Knowledge Management Glenn Skuta Environmental Analysis and Outcomes Division Minnesota
The Refugia Concept: Using Watershed Analysis to Prioritize Salmonid Habitat for Conservation and Restoration
 The Refugia Concept: Using Watershed Analysis to Prioritize Salmonid Habitat for Conservation and Restoration Christopher May Battelle & UW Cumulative Impacts of Urbanization Landscape Alterations Loss
MARYLAND S LAND USE/LAND COVER MAP AND ASSOCIATED ANALYSIS
 MARYLAND S LAND USE/LAND COVER MAP AND ASSOCIATED ANALYSIS Maryland Department of Planning Daniel Baldwin Stephanie Martins November 19, 2012 http://www.planning.maryland.gov/ PURPOSE The primary purpose
Protocol for Prioritizing Conservation Opportunity Areas in Centre County and Clinton County
 Protocol for Prioritizing Conservation Opportunity Areas in Centre County and Clinton County Chesapeake Conservancy has developed this methodology to prioritize conservation opportunity areas in Centre
Squaring and Unsquaring
 PROBLEM STRINGS LESSON 8.1 Squaring and Unsquaring At a Glance (6 6)* ( 6 6)* (1 1)* ( 1 1)* = 64 17 = 64 + 15 = 64 ( + 3) = 49 ( 7) = 5 ( + ) + 1= 8 *optional problems Objectives The goal of this string
Calculus II (Fall 2015) Practice Problems for Exam 1
 Practice Problems for Exam 1") Calculus II (Fall 15) Practice Problems for Exam 1 Note: Section divisions and instructions below are the same as they will be on the exam, so you will have a better idea of what to expect, though I will
Calculus II (Fall 15) Practice Problems for Exam 1 Note: Section divisions and instructions below are the same as they will be on the exam, so you will have a better idea of what to expect, though I will
Iowa Department of Transportation Office of Transportation Data GIS / CAD Integration
 Iowa Department of Transportation Office of Transportation Data GIS / CAD Integration From GIS data to CAD graphics - Iowa DOT's workflow utilizing GeoMedia and MicroStation to develop map products. Mark
[Disclaimer: This is not a complete list of everything you need to know, just some of the topics that gave people difficulty.]
![[Disclaimer: This is not a complete list of everything you need to know, just some of the topics that gave people difficulty.]](/thumbs/82/86615903.jpg "[Disclaimer: This is not a complete list of everything you need to know, just some of the topics that gave people difficulty.]") Math 43 Review Notes [Disclaimer: This is not a complete list of everything you need to know, just some of the topics that gave people difficulty Dot Product If v (v, v, v 3 and w (w, w, w 3, then the
Math 43 Review Notes [Disclaimer: This is not a complete list of everything you need to know, just some of the topics that gave people difficulty Dot Product If v (v, v, v 3 and w (w, w, w 3, then the
Please bring the task to your first physics lesson and hand it to the teacher.
 Pre-enrolment task for 2014 entry Physics Why do I need to complete a pre-enrolment task? This bridging pack serves a number of purposes. It gives you practice in some of the important skills you will
Mastering Geospatial Complexity in Planning Processes Leonard Daws Geospatial Information Analyst September 2015 OZRI 2015
 Mastering Geospatial Complexity in Planning Processes Leonard Daws Geospatial Information Analyst September 2015 OZRI 2015 Introduction Case Study: The GIS journey of the Sunshine Coast Planning Scheme
P vs. NP. Data Structures and Algorithms CSE AU 1
 P vs. NP Data Structures and Algorithms CSE 373-18AU 1 Goals for today Define P, NP, and NP-complete Explain the P vs. NP problem -why it s the biggest open problem in CS. -And what to do when a problem
Section 2.5 Linear Inequalities
 Section 2.5 Linear Inequalities WORDS OF COMPARISON Recently, you worked with applications (word problems) in which you were required to write and solve an equation. Sometimes you needed to translate sentences
MITOCW MIT18_02SCF10Rec_50_300k
 MITOCW MIT18_02SCF10Rec_50_300k CHRISTINE Welcome back to recitation. In this video, I'd like us to work on the following problem. BREINER: So the problem is as follows. For which of the following vector
SCHOOL OF ENGINEERING AND TECHNOLOGY COMPUTER LAB
 PHASE 1_6 TH SESSION ARCGIS TRAINING AT KU GIS LABS: INTRODUCTION TO GIS: EXPLORING ARCCATALOG AND ARCGIS TOOLS 6 TH SESSION REPORT: 3 RD -5 TH SEPTEMBER 2014 SCHOOL OF ENGINEERING AND TECHNOLOGY COMPUTER
Welcome to NetMap Portal Tutorial
 Welcome to NetMap Portal Tutorial Potential Applications What Can you do with the Portal? At least 25 things! 1) Locate the best potential fish habitats. 2) Identify biological hotspots. 3) Map floodplain
DATA DISAGGREGATION BY GEOGRAPHIC
 PROGRAM CYCLE ADS 201 Additional Help DATA DISAGGREGATION BY GEOGRAPHIC LOCATION Introduction This document provides supplemental guidance to ADS 201.3.5.7.G Indicator Disaggregation, and discusses concepts
Boyd's HD Map of Wharton for Garmin by Boyd Ostroff, revised 1/10/2018
 Boyd's HD Map of Wharton for Garmin by Boyd Ostroff, revised 1/10/2018 Here's a subset of the larger Map of the Pines HD formatted for use on your Garmin handheld. Unfortunately Garmin places some strict
Modeling Incident Density with Contours in ArcGIS Pro
 Modeling Incident Density with Contours in ArcGIS Pro By Mike Price, Entrada/San Juan, Inc. What you will need ArcGIS Pro 1.4 license or later ArcGIS Spatial Analyst license ArcGIS Online for organizational
PHASE 1_7 TH SESSION ARCGIS TRAINING AT KU GIS LABS: INTRODUCTION TO GIS: EXPLORING ARCCATALOG AND ARCGIS TOOLS
 PHASE 1_7 TH SESSION ARCGIS TRAINING AT KU GIS LABS: INTRODUCTION TO GIS: EXPLORING ARCCATALOG AND ARCGIS TOOLS 7 TH SESSION REPORT: 10 TH - 12 TH SEPTEMBER 2014 SCHOOL OF ENGINEERING AND TECHNOLOGY COMPUTER
Final Group Project Paper. Where Should I Move: The Big Apple or The Lone Star State
 Final Group Project Paper Where Should I Move: The Big Apple or The Lone Star State By: Nathan Binder, Shannon Scolforo, Kristina Conste, Madison Quinones Main Goal: Determine whether New York or Texas
Designing Sustainable Landscapes: Aquatic Barriers settings variable
 Designing Sustainable Landscapes: Aquatic Barriers settings variable A project of the University of Massachusetts Landscape Ecology Lab Principals: Kevin McGarigal, Professor Brad Compton, Research Associate
Math 440 Project Assignment
 Math 440 Project Assignment 1. Overview The goal of your project assignment is to explore an aspect of topology beyond the topics covered in class. It will be necessary to use the tools and properties
Spatial Analysis using Vector GIS THE GOAL: PREPARATION:
 PLAN 512 GIS FOR PLANNERS Department of Urban and Environmental Planning University of Virginia Fall 2006 Prof. David L. Phillips Spatial Analysis using Vector GIS THE GOAL: This tutorial explores some
irst we need to know that there are many ways to indicate multiplication; for example the product of 5 and 7 can be written in a variety of ways:
 CH 2 VARIABLES INTRODUCTION F irst we need to know that there are many ways to indicate multiplication; for example the product of 5 and 7 can be written in a variety of ways: 5 7 5 7 5(7) (5)7 (5)(7)
The Road to Data in Baltimore
 Creating a parcel level database from high resolution imagery By Austin Troy and Weiqi Zhou University of Vermont, Rubenstein School of Natural Resources State and local planning agencies are increasingly
Figure 8.2a Variation of suburban character, transit access and pedestrian accessibility by TAZ label in the study area
 Figure 8.2a Variation of suburban character, transit access and pedestrian accessibility by TAZ label in the study area Figure 8.2b Variation of suburban character, commercial residential balance and mix
The two foundation ideas or concepts that are of vital importance in GIS work (in my humble opinion) are:
 are:") HOME RANGE ESTIMATION AND HABITAT SELECTION USING G.I.S. During this workshop, you will be introduced to ArcGIS 9 software and some of the analytical tools available to go with this software. This workshop
HOME RANGE ESTIMATION AND HABITAT SELECTION USING G.I.S. During this workshop, you will be introduced to ArcGIS 9 software and some of the analytical tools available to go with this software. This workshop
Model Implementation Details for the Final Project in EEOS 465/
 Model Implementation Details for the Final Project in EEOS 465/627 2009 Last week, we introduced a conceptual model of estimating DOC loadings from landscape to coastal waters as a model template for the