College Of Science Engineering Health: GIS at UWF
|
|
|
- Leslie Garrison
- 6 years ago
- Views:
Transcription
1 College Of Science Engineering Health: GIS at UWF GIS here on campus GeoData Center, Nathan McKinney + student lab assistants GIS Certificate, Dr. Zhiyong Hu, GA s helping with courses GIS Online Director, Coordinator, Outreach Coordinator, 3 GA s, 5 adjuncts GIS Certificate Program 40 students GIS Training Academy Courses for CEU 8 students PSM GIS Masters 1, current, 8 students accepted for spring MOOC Intro to GIS in dev. expecting +/- 500 students Certificate in Geospatial Computing New!
2 College Of Science Engineering Health What is COSEH? Biology, Chemistry, Computer Science, Electrical & Computer Engineering, Environmental Studies, Exercise Science & Community Health, Mathematics & Statistics, Nursing, Physics, Psychology, Allied Health & Life Sciences, and Environmental Diagnostics & Bioremediation. About you: What department are you from? Used GIS?
3 What is GIS? A geographic information system (GIS) is a computer-based tool for mapping and analyzing things that exist and events that happen on earth. GIS technology integrates common database operations such as query and statistical analysis with the unique visualization and geographic analysis benefits offered by maps. ~ ESRI Everything exists or happens at a location Mapping software allows us to organize and model events and things as themed layers Ask questions about relationships through query and spatial analysis Visual outputs, compelling display through maps
4
5 Relevance Discussion COSEH Applications COSEH Student Examples COSEH Jobs Internships Raffle

6 GIS Electric Outages a43e86b1d3118a67&_ga=


7 Mapping Grey Nurse Shark Habitat, Australia ews/arcnews/winter03 04articles/volunteerdivers.html


8 Planetary GIS
9 GIS Applications for COSEH Biology Chemistry Electrical and Computer Engineering Community Health Mathematics and Statistics Nursing Physics Psycology Allied Health and Life Services Research tool ection/wildareas-v2/maps/services Environmental Chemistry - Any analysis with a geographic data element... northwest_gis.htm html?appid=f a43e86b1d31 Electrical utility companies use GIS to understand generation, transmission and distribution, predicting outages 18a67&_ga= and asset damages, complying with regulations and communicating with customers. 343 Manage pandemics, prevent chronic diseases, monitor environmental quality to transform health of a community. Allocate resources, enact policies to help issues, communicate public health issues, manage disasters uwf-students-turn-quality-life-datadetectives/ / Spatial statistics identify community health service needs, streamline facilities, asset management, tracking patients, managing bed use, lower potential for infection examine gravity data, examine aeromagnetic data, collect solar angles and shadow data, examine remotely sensed imagery and the reflectivity of different features in different spectral bands, hurricane movements and the coriolis effect, seismic waves, earthquake depth and magnitude relative to plate boundaries and volcanoes, 3D mapping of the solar system, mapping of lightning data (polarity and amplitude) for a given storm, hydrology (e.g. impact on a stream from decreased pervious surface in a watershed), earth shape (imperfect sphere leading to datum issues) how people perceive and represent spaces around them and how they use perceptual information to guide their movements in those spaces, use GPS to analyze planning and spatial memory abilities understand the links between social service infrastructure and challenges such as aging, homelessness, and poverty. Streamline processes to better serve the community. Some offices even use GIS to help identify potential fraud and abuse of benefits Emergency Management Flood Maps, Evacuation Zones egories/anamarketplace/anaperiodicals/o JIN/Columns/Informatics/Integrating-a- Geographic-Information-System-into- Research.html ap/viewer.html?webmap=cbe088e7c aa0fc34eb99e7f30

10 COSEH Student Examples Natural Hazards The goal was to use 2011 USGS 30M Digital Elevation Models (topography) and the Hydrology Tools found within ESRI s Spatial Analyst Extension to determine drainage flow in a potential crisis situation US Census Data to create a population analysis for the areas in proximity to the drainage areas. These findings will aid local and state officials in hazard planning and response time. Disaster Relief The goal was to map the evacuation zones around the Fukushima Daiichi Nuclear Power Plant and determine the at-risk population within each of those zones. Evacuation & Emergency Management Students were presented with a disaster scenario in which a major storm surge flooded into Tampa Bay, students were responsible for routing the relief workers and refugees to the nearest shelter.
11 COSEH Jobs Health Masters ~$50,000 Bureau of HIV/AIDS Epidemiology, Albany, NY Contribute to formative research, and prepare maps to display project data using ArcGIS Health BS City of Maricopa, Phoenix, AZ Design, develop, establish, implement, and analyze complex real-time disease surveillance systems and electronic data exchange to prepare for and detect disease during mass gatherings Engineering Bachelors HGA Pipeline Services Perform research and Analysis, construct maps, analyze and geographically assess customer requests Engineering Bachelors West Burchell Gather, Create, Manage, and Analyze spatial datasets related to the natural gas industry Biology PhD University of Tampa Spatial Ecologist: Blend traditional biology, biostatistics, and GIS in classroom environment


12 Internships Current Internships: Past Internships Adam Taylor, FDEP Tampa Bay Aquatic Preserves Phil Coppola, Western Washington University Talia Smith, NASA Andrea Miller-Hinz, The Nature Conservancy Jelly Riedel, NASA

13 Dr. Raid Amin Professor, UWF Mathematics and Statistics Research Interests: Cluster Analysis in Environmental and Demographic Studies, Public Health, Statistical Quality Control & Statistical Computing
14 APPLICATIONS IN SPATIAL EPIDEMIOLOGY Dr. Raid W. Amin Department of Mathematics and Statistics
15 OUTLINE SaTScan: A disease surveillance software Cancer Rates in Florida Particulate Matter PM2.5 Quality of Life Index for US Counties Homicide-Suicide in Florida Shark Attacks High School Performance in Florida
16 SaTScan: A disease surveillance software Spatial analysis for this study was done using SaTScan, developed by Dr. Martin Kulldorff (Harvard University). The model maximizes the likelihood function over circles of varying sizes. The circle with the highest maximum log likelihood ratio is least likely to have occurred by chance. The p-value for the cluster is obtained using Monte Carlo replications. Monte Carlo hypothesis testing uses the data set to create random sets of the data, performs the same analysis, and compares the maximum likelihood ratio of the real set with those of the random data sets.
17 For practical reasons the centroids of counties or zip codes are used to position the scanning windows. The size of the windows is varied continuously from zero size to maximum size (that the window never contains more than 50 percent of the total population). Therefore, the window is not fixed in position and size. The outcomes are several (a huge amount) windows spread over the map. Each could contain a cancer case cluster.
18 The standard purely spatial scan statistic imposes a circular window on the map. The window is in turn centered on each of several possible grid points positioned throughout the study region. For each grid point, the radius of the window varies continuously in size from zero to some upper limit specified by the user. In this way, the circular window is flexible both in location and size. In total, the method creates an infinite number of distinct geographical circles with different sets of neighboring data locations within them. Each circle is a possible candidate cluster. The space-time scan statistic may be used for either a single retrospective analysis, using historic data, or for time-periodic prospective surveillance, where the analysis is repeated for example every day, week, month or year. Ref:


19 SaTScan o Purely Spatial Analysis o Space-time Analysis
20 Probability Model: Poisson Model The Poisson likelihood function for each window is calculated by the following formula. Here, N = total number of cancer cases over the whole area and n = number of cancer cases within the window = expected number of cancer cases within the window (under the null hypothesis) n n N n N N n
21 THE NORMAL MODEL The normal model10 is designed for continuous data. For each individual or for each observation, called a case, there is a single continuous attribute that may be either negative or positive. The model can also be used for ordinal data when there are many categories. That is, different cases are allowed to have the same attribute value. Example: For the normal model, the data may consist of the birth weight and residential census tract for all newborns, with an interest in finding clusters with lower birth weight. One individual is then a case. Alternatively, the data may consist of the average birth weight in each census tract. It is then the census tract that is the case, and it is important to use the weighted normal model, since each average will have a different variance due to a different number of births in each tract. It is important to note that while the normal model uses a likelihood function based on the normal distribution, the true distribution of the continuous attribute must not be normal. The statistical inference (p-value) is valid for any continuous distribution. The reason for this is that the randomization is not done by generating simulated data from the normal distribution, but rather, by permuting the space-time locations and the continuous attribute (e.g. birth weight) of the observations. While still being formally valid, the results can be greatly influenced by extreme outliers, so it may be wise to truncate such observations before doing the analysis.
22 A scan statistic for continuous data based on the normal probability Model The circular spatial scan statistic is defined through a large number of overlapping circles. For each circle z, a log likelihood ratio LLR(z) is calculated, and the test statistic is defined as the maximum LLR over all circles. The statistical significance of the most likely cluster is evaluated using Monte Carlo hypothesis testing. Rather than generating random data from the normal distribution, a large set of random data sets are created by randomly permuting the observed values xi and their corresponding locations s. Martin Kulldorff, Lan Huang, and Kevin Konty. Ref:
23 Testing Procedure The window with the maximum likelihood is determined (labeled as most likely cluster). Repeating this procedure for random replications of the dataset by a Monte Carlo simulation leads to the p-value for the test. If the null hypothesis could be rejected (p-value below defined alpha-level) the certain cluster can be stated as significant.
24 Special Issue in Statistics and Public Policy Letter from the Editor (David Banks) Background on the Florida Pediatric Cancer Cluster Studies (Raid Amin) 1. Wombling Analysis of Childhood Tumor Rates in Florida (Matthew Heaton) 2. A Cluster Analysis of Pediatric Cancer Incidence Rates in Florida: (Amin, Hendryx, Shull, Bohnert) 3.Identifying Pediatric Cancer Clusters in Florida Using Log-Linear Models and Generalized Lasso Penalties (Hao Wang and Abel Rodriguez) 4. Childhood Brain Cancer in Florida: A Bayesian Clustering Approach (Andrew Lawson and Chawarat Rotejanaprasert)
25 Cluster Analysis Output: Poisson on Brain Tumors Purely Spatial analysis: Brain Tumors (adjusted for age and sex) scanning for clusters with high rates using the Discrete Poisson model. SUMMARY OF DATA Study period...: 2000/1/1 to 2010/12/31 Number of locations...: 983 Total population...: Total number of cases...: 1194 Annual cases / : 2.5 MOST LIKELY CLUSTER 1.Location IDs included.: Coordinates / radius..: ( N, W) / km Population...: Number of cases...: 409 Expected cases...: Annual cases / : 3.0 Observed / expected...: 1.22 Relative risk...: 1.34 Log likelihood ratio..: P-value...: 0.012

26 Poisson on Brain ( ) Purely Spatial Adjusted for age and sex
27 Age & Sex Adjusted Rates per 100,000 Age and Sex Adjusted Brain Tumor Rates in Florida (out of 100,000) Most Significant Cluster Outside Significant Cluster All of Florida
28 SaTScan Output: Leukemia Purely Spatial analysis (Leukemia) scanning for clusters with high rates using the Discrete Poisson model. SUMMARY OF DATA Study period...: 2000/1/1 to 2010/12/31 Number of locations...: 983 Total population...: Total number of cases...: 1833 Annual cases / : 3.8 MOST LIKELY CLUSTER 1.Location IDs included.: Coordinates / radius..: ( N, W) / km Population...: Number of cases...: 279 Expected cases...: Annual cases / : 4.9 Observed / expected...: 1.30 Relative risk...: 1.35 Log likelihood ratio..: P-value...: 0.029
 Adjusted for")
29 Poisson on Leukemia ( ) Adjusted for age and sex
30 Age & Sex Adjusted Rates per 100,000 Age and Sex Adjusted Leukemia Rates in Florida (out of 100,000) Most Significant Cluster Outside Significant Cluster All of Florida
31 SaTScan Output: Lymphoma Purely Spatial analysis: Lymphoma scanning for clusters with high rates using the Discrete Poisson model. SUMMARY OF DATA Study period...: 2000/1/1 to 2010/12/31 Number of locations...: 983 Total population...: Total number of cases...: 745 Annual cases / : 1.5 MOST LIKELY CLUSTER 1.Location IDs included.: Coordinates / radius..: ( N, W) / km Population...: Number of cases...: 160 Expected cases...: Annual cases / : 2.2 Observed / expected...: 1.41 Relative risk...: 1.52 Log likelihood ratio..: P-value...: 0.024
32 Poisson on Lymphoma ( ) Adjusted for age and sex
33 Age & Sex Adjusted Rates per 100,000 Age and Sex Adjusted Lymphoma Rates in Florida (out of 100,000) Most Significant Cluster Outside Significant Cluster All of Florida
34
35 Table 1. SaTScan TM Output AYA thyroid cancer purely spatial analysis adjusted for age, sex and race. State Primary cluster Secondary cluster AYA Population 5,358,013 1,695,088 58,637 Number of Cases 3,526 1, Annual cases per ,000 Relative risk Log Likelihood ratio P-value <
36 . Increasing overall incidence of thyroid cancer in AYA
 and Lung")
37 RSEI Air (1 st and 2 nd Round Clusters) and Lung Cancer
38 Age-Adjusted FAPTP Brain and Stream Condition Index 2007
39 Particulate Matter PM2.5 for 2010

40 Quality of Life Index for 2010

41 MURDER CLUSTERS: CLUSTER ANALYSIS. RED CLUSTERS IDENTIFY HIGH MURDER RATES. BLUE CLUSTERS INDENTIFY LOW MURDER RATES.

42 Rape Clusters: Red clusters show high rates of rape cases. Blue clusters show low rates.
 and red clusters are HIGH (")
43 Crime Index: Murder, Rape, Assault, Robbery, Drugs. Blue cluster are LOW ( good ) and red clusters are HIGH ( bad )
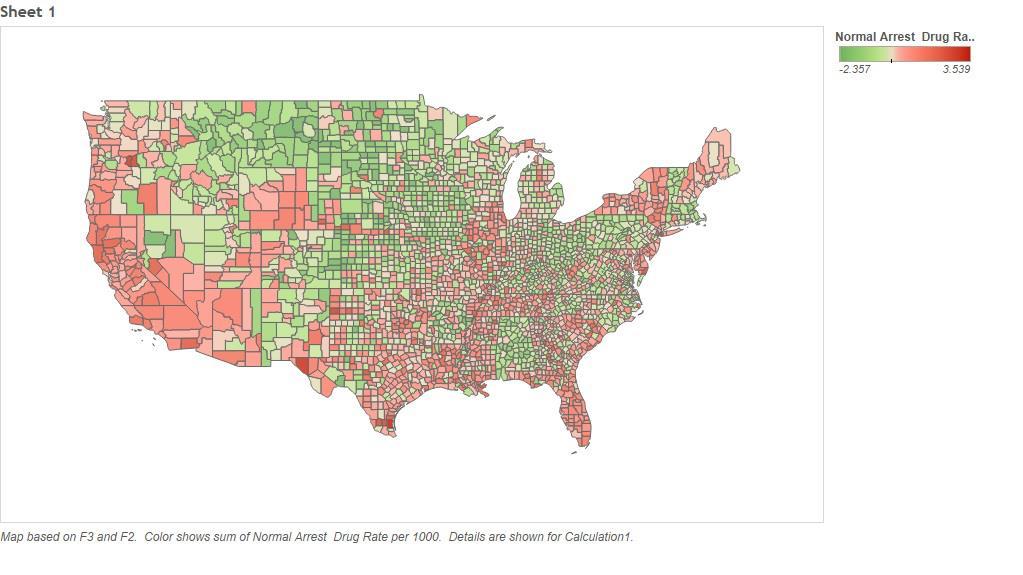
44 Drugs

45 AVERAGE HOMICIDE- SUICIDE RATE PER YEAR (PER 100,000)
46
47

")
48 FACTOR 1: HIGH SAT/ACT SCORES, HIGH STABILITY RATE, LOW FREE AND REDUCED LUNCH RATE, LOW MINORITY RATE (BY MEGAN PODZIAD)


49 13 high schools, in Brevard County, shown in overlap of high rate clusters OVERLAPPING FACTORS 1 AND 2:
50 Thanks for attending. Before you go, It s raffle time!!!
Cluster Analysis using SaTScan
 Cluster Analysis using SaTScan Summary 1. Statistical methods for spatial epidemiology 2. Cluster Detection What is a cluster? Few issues 3. Spatial and spatio-temporal Scan Statistic Methods Probability
An Introduction to SaTScan
 An Introduction to SaTScan Software to measure spatial, temporal or space-time clusters using a spatial scan approach Marilyn O Hara University of Illinois moruiz@illinois.edu Lecture for the Pre-conference
Interactive GIS in Veterinary Epidemiology Technology & Application in a Veterinary Diagnostic Lab
 Interactive GIS in Veterinary Epidemiology Technology & Application in a Veterinary Diagnostic Lab Basics GIS = Geographic Information System A GIS integrates hardware, software and data for capturing,
Cluster Analysis using SaTScan. Patrick DeLuca, M.A. APHEO 2007 Conference, Ottawa October 16 th, 2007
 Cluster Analysis using SaTScan Patrick DeLuca, M.A. APHEO 2007 Conference, Ottawa October 16 th, 2007 Outline Clusters & Cluster Detection Spatial Scan Statistic Case Study 28 September 2007 APHEO Conference
Outline. Practical Point Pattern Analysis. David Harvey s Critiques. Peter Gould s Critiques. Global vs. Local. Problems of PPA in Real World
 Outline Practical Point Pattern Analysis Critiques of Spatial Statistical Methods Point pattern analysis versus cluster detection Cluster detection techniques Extensions to point pattern measures Multiple
A spatial scan statistic for multinomial data
 A spatial scan statistic for multinomial data Inkyung Jung 1,, Martin Kulldorff 2 and Otukei John Richard 3 1 Department of Epidemiology and Biostatistics University of Texas Health Science Center at San
SaTScan TM. User Guide. for version 7.0. By Martin Kulldorff. August
 SaTScan TM User Guide for version 7.0 By Martin Kulldorff August 2006 http://www.satscan.org/ Contents Introduction... 4 The SaTScan Software... 4 Download and Installation... 5 Test Run... 5 Sample Data
Inclusion of Non-Street Addresses in Cancer Cluster Analysis
 Inclusion of Non-Street Addresses in Cancer Cluster Analysis Sue-Min Lai, Zhimin Shen, Darin Banks Kansas Cancer Registry University of Kansas Medical Center KCR (Kansas Cancer Registry) KCR: population-based
SRJC Applied Technology 54A Introduction to GIS
 SRJC Applied Technology 54A Introduction to GIS Overview Lecture of Geographic Information Systems Fall 2004 Santa Rosa Junior College Presented By: Tim Pudoff, GIS Coordinator, County of Sonoma, Information
GIS = Geographic Information Systems;
 What is GIS GIS = Geographic Information Systems; What Information are we talking about? Information about anything that has a place (e.g. locations of features, address of people) on Earth s surface,
USING CLUSTERING SOFTWARE FOR EXPLORING SPATIAL AND TEMPORAL PATTERNS IN NON-COMMUNICABLE DISEASES
 USING CLUSTERING SOFTWARE FOR EXPLORING SPATIAL AND TEMPORAL PATTERNS IN NON-COMMUNICABLE DISEASES Mariana Nagy "Aurel Vlaicu" University of Arad Romania Department of Mathematics and Computer Science
KENTUCKY HAZARD MITIGATION PLAN RISK ASSESSMENT
 KENTUCKY HAZARD MITIGATION PLAN RISK ASSESSMENT Presentation Outline Development of the 2013 State Hazard Mitigation Plan Risk Assessment Determining risk assessment scale Census Data Aggregation Levels
THE 3D SIMULATION INFORMATION SYSTEM FOR ASSESSING THE FLOODING LOST IN KEELUNG RIVER BASIN
 THE 3D SIMULATION INFORMATION SYSTEM FOR ASSESSING THE FLOODING LOST IN KEELUNG RIVER BASIN Kuo-Chung Wen *, Tsung-Hsing Huang ** * Associate Professor, Chinese Culture University, Taipei **Master, Chinese
Purpose Study conducted to determine the needs of the health care workforce related to GIS use, incorporation and training.
 GIS and Health Care: Educational Needs Assessment Cindy Gotz, MPH, CHES Janice Frates, Ph.D. Suzanne Wechsler, Ph.D. Departments of Health Care Administration & Geography California State University Long
ENV208/ENV508 Applied GIS. Week 1: What is GIS?
 ENV208/ENV508 Applied GIS Week 1: What is GIS? 1 WHAT IS GIS? A GIS integrates hardware, software, and data for capturing, managing, analyzing, and displaying all forms of geographically referenced information.
A nonparametric spatial scan statistic for continuous data
 DOI 10.1186/s12942-015-0024-6 METHODOLOGY Open Access A nonparametric spatial scan statistic for continuous data Inkyung Jung * and Ho Jin Cho Abstract Background: Spatial scan statistics are widely used
Analyzing the Geospatial Rates of the Primary Care Physician Labor Supply in the Contiguous United States
 Analyzing the Geospatial Rates of the Primary Care Physician Labor Supply in the Contiguous United States By Russ Frith Advisor: Dr. Raid Amin University of W. Florida Capstone Project in Statistics April,
Spatial Analysis I. Spatial data analysis Spatial analysis and inference
 Spatial Analysis I Spatial data analysis Spatial analysis and inference Roadmap Outline: What is spatial analysis? Spatial Joins Step 1: Analysis of attributes Step 2: Preparing for analyses: working with
FleXScan User Guide. for version 3.1. Kunihiko Takahashi Tetsuji Yokoyama Toshiro Tango. National Institute of Public Health
 FleXScan User Guide for version 3.1 Kunihiko Takahashi Tetsuji Yokoyama Toshiro Tango National Institute of Public Health October 2010 http://www.niph.go.jp/soshiki/gijutsu/index_e.html User Guide version
geographic patterns and processes are captured and represented using computer technologies
 Proposed Certificate in Geographic Information Science Department of Geographical and Sustainability Sciences Submitted: November 9, 2016 Geographic information systems (GIS) capture the complex spatial
Are You Maximizing The Value Of All Your Data?
 Are You Maximizing The Value Of All Your Data? Using The SAS Bridge for ESRI With ArcGIS Business Analyst In A Retail Market Analysis SAS and ESRI: Bringing GIS Mapping and SAS Data Together Presented
Joanne N. Halls, PhD Dept. of Geography & Geology David Kirk Information Technology Services
 Joanne N. Halls, PhD Dept. of Geography & Geology David Kirk Information Technology Services Geographic Information Systems manage and analyze data to solve spatial problems. Real World Abstraction Analysis
Crime Analysis. GIS Solutions for Intelligence-Led Policing
 Crime Analysis GIS Solutions for Intelligence-Led Policing Applying GIS Technology to Crime Analysis Know Your Community Analyze Your Crime Use Your Advantage GIS aids crime analysis by Identifying and
Application of Geospatial Technology in an Emergency Management Academic Program
 Application of Geospatial Technology in an Emergency Management Academic Program Author Edwin Leachman Visiting Assistant Professor Department of Emergency Administration and Management Arkansas Tech University
Techniques for Science Teachers: Using GIS in Science Classrooms.
 Techniques for Science Teachers: Using GIS in Science Classrooms. After ESRI, 2008 GIS A Geographic Information System A collection of computer hardware, software, and geographic data used together for
Preparing for Earthquakes in Dallas-Fort Worth Applying HAZUS to assess shelter accessibility. Crystal Curtis
 Preparing for Earthquakes in Dallas-Fort Worth Applying HAZUS to assess shelter accessibility Crystal Curtis Introduction 20+ earthquakes in the city of Irving October 2014 to March 2015 HAZUS can be used
BROOKINGS May
 Appendix 1. Technical Methodology This study combines detailed data on transit systems, demographics, and employment to determine the accessibility of jobs via transit within and across the country s 100
Introduction to Geographic Information Systems (GIS): Environmental Science Focus
: Environmental Science Focus") Introduction to Geographic Information Systems (GIS): Environmental Science Focus September 9, 2013 We will begin at 9:10 AM. Login info: Username:!cnrguest Password: gocal_bears Instructor: Domain: CAMPUS
Introduction to Geographic Information Systems (GIS): Environmental Science Focus September 9, 2013 We will begin at 9:10 AM. Login info: Username:!cnrguest Password: gocal_bears Instructor: Domain: CAMPUS
Long Island Breast Cancer Study and the GIS-H (Health)
") Long Island Breast Cancer Study and the GIS-H (Health) Edward J. Trapido, Sc.D. Associate Director Epidemiology and Genetics Research Program, DCCPS/NCI COMPREHENSIVE APPROACHES TO CANCER CONTROL September,
Long Island Breast Cancer Study and the GIS-H (Health) Edward J. Trapido, Sc.D. Associate Director Epidemiology and Genetics Research Program, DCCPS/NCI COMPREHENSIVE APPROACHES TO CANCER CONTROL September,
Understanding China Census Data with GIS By Shuming Bao and Susan Haynie China Data Center, University of Michigan
 Understanding China Census Data with GIS By Shuming Bao and Susan Haynie China Data Center, University of Michigan The Census data for China provides comprehensive demographic and business information
Railway suicide clusters: how common are they and what predicts them? Lay San Too Jane Pirkis Allison Milner Lyndal Bugeja Matthew J.
 Railway suicide clusters: how common are they and what predicts them? Lay San Too Jane Pirkis Allison Milner Lyndal Bugeja Matthew J. Spittal Overview Background Aims Significance Methods Results Conclusions
Chapter 6. Fundamentals of GIS-Based Data Analysis for Decision Support. Table 6.1. Spatial Data Transformations by Geospatial Data Types
 Chapter 6 Fundamentals of GIS-Based Data Analysis for Decision Support FROM: Points Lines Polygons Fields Table 6.1. Spatial Data Transformations by Geospatial Data Types TO: Points Lines Polygons Fields
The Use of Geographic Information Systems (GIS) by Local Governments. Giving municipal decision-makers the power to make better decisions
 by Local Governments. Giving municipal decision-makers the power to make better decisions") The Use of Geographic Information Systems (GIS) by Local Governments Giving municipal decision-makers the power to make better decisions Case Study: Examples of GIS Usage by Local Governments in North
The Use of Geographic Information Systems (GIS) by Local Governments Giving municipal decision-makers the power to make better decisions Case Study: Examples of GIS Usage by Local Governments in North
Bayesian Hierarchical Models
 Bayesian Hierarchical Models Gavin Shaddick, Millie Green, Matthew Thomas University of Bath 6 th - 9 th December 2016 1/ 34 APPLICATIONS OF BAYESIAN HIERARCHICAL MODELS 2/ 34 OUTLINE Spatial epidemiology
Introduction to GIS (GEOG 401) Spring 2014, 3 credit hours
 Spring 2014, 3 credit hours") Introduction to GIS (GEOG 401) Spring 2014, 3 credit hours Instructors: Guangxing Wang, Ph.D. Email: gxwang@siu.edu Phone: (618) 453-6017 Office: 4442 Faner Hall Office hours: M& W&F 9:00am-11:00am or
Introduction to GIS (GEOG 401) Spring 2014, 3 credit hours Instructors: Guangxing Wang, Ph.D. Email: gxwang@siu.edu Phone: (618) 453-6017 Office: 4442 Faner Hall Office hours: M& W&F 9:00am-11:00am or
Acknowledgments xiii Preface xv. GIS Tutorial 1 Introducing GIS and health applications 1. What is GIS? 2
 Acknowledgments xiii Preface xv GIS Tutorial 1 Introducing GIS and health applications 1 What is GIS? 2 Spatial data 2 Digital map infrastructure 4 Unique capabilities of GIS 5 Installing ArcView and the
Outline. The Role of the Spatial Sciences in the Modern Research University. Background. USC timeline. Geography & Spatial Science
 4/15/215 The Role of the Spatial Sciences in the Modern Research University John Wilson 1 December 21 Outline Interdisciplinary spatial science Background & timeline Current organizational chart Interdisciplinary
CRP 608 Winter 10 Class presentation February 04, Senior Research Associate Kirwan Institute for the Study of Race and Ethnicity
 CRP 608 Winter 10 Class presentation February 04, 2010 SAMIR GAMBHIR SAMIR GAMBHIR Senior Research Associate Kirwan Institute for the Study of Race and Ethnicity Background Kirwan Institute Our work Using
Conference at a Glance
 Conference at a Glance 8:30 AM MONDAY ROOM 333 ROOM 327/328 ROOM 238 ROOM 296/298 WELCOME and KEYNOTE SPEAKER MICHAEL MILASKA 10 AM BREAK 10:30 AM Web Applications I 12 PM 1:30 PM Intro to R Data Science
Detecting Emerging Space-Time Crime Patterns by Prospective STSS
 Detecting Emerging Space-Time Crime Patterns by Prospective STSS Tao Cheng Monsuru Adepeju {tao.cheng@ucl.ac.uk; monsuru.adepeju.11@ucl.ac.uk} SpaceTimeLab, Department of Civil, Environmental and Geomatic
The Tampa Bay Catastrophic Plan Presentation to CFGIS Users Group FDOT District 5 Urban Offices - Orlando July 30, 2010
 The Tampa Bay Catastrophic Plan Presentation to CFGIS Users Group FDOT District 5 Urban Offices - Orlando July 30, 2010 Brady Smith Senior Planner Tampa Bay Regional Planning Council Introduction Recent
Introducing GIS analysis
 1 Introducing GIS analysis GIS analysis lets you see patterns and relationships in your geographic data. The results of your analysis will give you insight into a place, help you focus your actions, or
Developing a Tactical-Level Geospatial Course for Army Engineers
 Developing a Tactical-Level Geospatial Course for Army Engineers Jared L. Ware Geospatial Information Science Program Department of Geography and Environmental Engineering United States Military Academy
Role of GIS in Tracking and Controlling Spread of Disease
 Role of GIS in Tracking and Controlling Spread of Disease For Dr. Baqer Al-Ramadan By Syed Imran Quadri CRP 514: Introduction to GIS Introduction Problem Statement Objectives Methodology of Study Literature
GIS PORTFOLIO MOHAMED MAGDY MOHAMED HUSSAIN GIS ENGINEER. UWF GIS ONLINE CERTIFICATE GIS Internship (GIS4944)
") 2012 GIS PORTFOLIO MOHAMED MAGDY MOHAMED HUSSAIN GIS ENGINEER UWF GIS ONLINE CERTIFICATE GIS Internship (GIS4944) Portfolio Table of Contents Subject... Page Personal statement/mission/philosophy... 1
2012 GIS PORTFOLIO MOHAMED MAGDY MOHAMED HUSSAIN GIS ENGINEER UWF GIS ONLINE CERTIFICATE GIS Internship (GIS4944) Portfolio Table of Contents Subject... Page Personal statement/mission/philosophy... 1
Flood Hazard Zone Modeling for Regulation Development
 Flood Hazard Zone Modeling for Regulation Development By Greg Lang and Jared Erickson Pierce County GIS June 2003 Abstract The desire to blend current digital information with government permitting procedures,
LandScan Global Population Database
 LandScan Global Population Database The World s Finest Population Distribution Data Uncommon information. Extraordinary places. LandScan Global Population Database East View Cartographic is now offering
WHO lunchtime seminar Mapping child growth failure in Africa between 2000 and Professor Simon I. Hay March 12, 2018
 WHO lunchtime seminar Mapping child growth failure in Africa between 2000 and 2015 Professor Simon I. Hay March 12, 2018 Outline Local Burden of Disease (LBD) at IHME Child growth failure From global to
Cartographic and Geospatial Futures
 Cartographic and Geospatial Futures 1. Web Cartography, WebGIS, & Virtual Globes--New Roles for Maps, GIS, and GIS professionals 2. Map Mashups, the Neo Neo-geography Movement, & Crowd-sourcing Geospatial
b. Why is the area affected by each earthquake circular or nearly circular? Where is the epicenter of each quake located?
 Name: Skill Sheet 29-A Interpreting Geologic Hazard Maps Plate tectonics and the weather are often the cause of geologic hazards such as earthquakes, volcanic eruptions, and flooding. Geologic hazard events
CITY OF RIVERSIDE USING HAZUS TO CREATE A EARTHQUAKE PLANNING GUIDE FOR A UNIFIED FIELD RESPONSE
 CITY OF RIVERSIDE USING HAZUS TO CREATE A EARTHQUAKE PLANNING GUIDE FOR A UNIFIED FIELD RESPONSE Presented by the Phil McCormick City of Riverside Office of Emergency Management HISTORY The City had several
IMPLEMENTING GOVERNMENT-WIDE ENTERPRISE GIS; THE FEDERATED MODEL
 IMPLEMENTING GOVERNMENT-WIDE ENTERPRISE GIS; THE FEDERATED MODEL James E. Mitchell, Ph. D. IT GIS Manager Louisiana Department of Transportation and Development presented at the ESRI International Users
Geography General Course Year 12. Selected Unit 3 syllabus content for the. Externally set task 2019
 Geography General Course Year 12 Selected Unit 3 syllabus content for the Externally set task 2019 This document is an extract from the Geography General Course Year 12 syllabus, featuring all of the content
Core Courses for Students Who Enrolled Prior to Fall 2018
 Biostatistics and Applied Data Analysis Students must take one of the following two sequences: Sequence 1 Biostatistics and Data Analysis I (PHP 2507) This course, the first in a year long, two-course
Twitter s Effectiveness on Blackout Detection during Hurricane Sandy
 Twitter s Effectiveness on Blackout Detection during Hurricane Sandy KJ Lee, Ju-young Shin & Reza Zadeh December, 03. Introduction Hurricane Sandy developed from the Caribbean stroke near Atlantic City,
Advanced Image Analysis in Disaster Response
 Advanced Image Analysis in Disaster Response Creating Geographic Knowledge Thomas Harris ITT The information contained in this document pertains to software products and services that are subject to the
GIS ADMINISTRATOR / WEB DEVELOPER EVANSVILLE-VANDERBURGH COUNTY AREA PLAN COMMISSION
 GIS ADMINISTRATOR / WEB DEVELOPER EVANSVILLE-VANDERBURGH COUNTY AREA PLAN COMMISSION SALARY RANGE INITIATION $43,277 SIX MONTHS $45,367 POSITION GRADE PAT VI The Evansville-Vanderburgh County Area Plan
Climate Risk Visualization for Adaptation Planning and Emergency Response
 Climate Risk Visualization for Adaptation Planning and Emergency Response NCR Flood Fact Finding Workshop Ricardo Saavedra ricardo@vizonomy.com Social Media, Mobile, and Big Data St. Peter s Basilica,
GRADUATE CERTIFICATE PROGRAM
 GRADUATE CERTIFICATE PROGRAM GEOGRAPHIC INFORMATION SCIENCES Department of Geography University of North Carolina Chapel Hill Conghe Song, Director csong @email.unc.edu 919-843-4764 (voice) 919-962-1537
Improvement of the National Hydrography Dataset for US Forest Service Region 3 in Cooperation with the National Forest Service
 Improvement of the National Hydrography Dataset for US Forest Service Region 3 in Cooperation with the National Forest Service Christian L. DeCasas California State University, Northridge November 7 th,
Using Geographic Information Systems for Exposure Assessment
 Using Geographic Information Systems for Exposure Assessment Ravi K. Sharma, PhD Department of Behavioral & Community Health Sciences, Graduate School of Public Health, University of Pittsburgh, Pittsburgh,
This lab exercise will try to answer these questions using spatial statistics in a geographic information system (GIS) context.
 context.") by Introduction Problem Do the patterns of forest fires change over time? Do forest fires occur in clusters, and do the clusters change over time? Is this information useful in fighting forest fires? This
by Introduction Problem Do the patterns of forest fires change over time? Do forest fires occur in clusters, and do the clusters change over time? Is this information useful in fighting forest fires? This
John Laznik 273 Delaplane Ave Newark, DE (302)
") Office Address: John Laznik 273 Delaplane Ave Newark, DE 19711 (302) 831-0479 Center for Applied Demography and Survey Research College of Human Services, Education and Public Policy University of Delaware
Office Address: John Laznik 273 Delaplane Ave Newark, DE 19711 (302) 831-0479 Center for Applied Demography and Survey Research College of Human Services, Education and Public Policy University of Delaware
Tools to Assess Local Health Needs. Richard Leadbeater, Esri NACo 2011 Healthy Counties Forum December 1, 2011
 Tools to Assess Local Health Needs Richard Leadbeater, Esri NACo 2011 Healthy Counties Forum December 1, 2011 Richard Leadbeater currently holds the position of Industry Solutions Manager with Esri. He
Diffusion of GIS in Public Policy Doctoral Program
 Diffusion of GIS in Public Policy Doctoral Program By Fulbert Namwamba PhD Southern University This presentation demonstrate how GIS was introduced in the Public Policy Doctoral Program at Southern University,
Geography 1103: Spatial Thinking
 Geography 1103: Spatial Thinking Lecture: T\TH 8:00-9:15 am (McEniry 401) Lab: Wed 2:00-4:30 pm (McEniry 420) Instructor: Dr. Elizabeth C. Delmelle Email: edelmell@uncc.edu Office: McEniry 419 Phone: 704-687-5932
ArcGIS Online Analytics. Mike Flanagan
 ArcGIS Online Analytics Mike Flanagan MFlanagan@esri.com Agenda Introduction to ArcGIS Online Spatial Analysis ArcGIS Online Spatial Analysis Workflow Demos and Examples Wrap-up Q&A ArcGIS A complete web
Spatio-Temporal Cluster Detection of Point Events by Hierarchical Search of Adjacent Area Unit Combinations
 Spatio-Temporal Cluster Detection of Point Events by Hierarchical Search of Adjacent Area Unit Combinations Ryo Inoue 1, Shiho Kasuya and Takuya Watanabe 1 Tohoku University, Sendai, Japan email corresponding
SCHOOL EMERGENCY MANAGEMENT PLAN FOR NATURAL DISASTERS
 SCHOOL EMERGENCY MANAGEMENT PLAN FOR NATURAL DISASTERS MANAGING EMERGENCIES EFFECTIVELY Keith Thomas, Loss Prevention & Risk Manager LEADERSHIP, ADVOCACY AND SERVICE FOR MANITOBA S PUBLIC SCHOOL BOARDS
Environmental Justice and the Environmental Protection Agency s Superfund Program
 Environmental Justice and the Environmental Protection Agency s Superfund Program Brian Alt Advance GIS 26 April 2011 Introduction In the late 1970 s the Environmental Protection Agency, the United States
Geospatial Data, Services, and Products. National Surveying, mapping and geospatial conference
 Geospatial Data, Services, and Products Federal Programs -- USDA NRCS National Surveying, mapping and geospatial conference March 15, 2016 NRCS Applications using Geosaptial Products & Services Field
CS 350 A Computing Perspective on GIS
 CS 350 A Computing Perspective on GIS What is GIS? Definitions A powerful set of tools for collecting, storing, retrieving at will, transforming and displaying spatial data from the real world (Burrough,
GIS Spatial Statistics for Public Opinion Survey Response Rates
 GIS Spatial Statistics for Public Opinion Survey Response Rates July 22, 2015 Timothy Michalowski Senior Statistical GIS Analyst Abt SRBI - New York, NY t.michalowski@srbi.com www.srbi.com Introduction
CENTRAL TEXAS HILL COUNTRY FLOOD
 CENTRAL TEXAS HILL COUNTRY FLOOD Term project report DECEMBER 7, 2018 UNIVERSITY OF TEXAS AT AUSTIN CE394K: GIS in Water Resources Engineering RIFAAI Mohamed Talha Table of Contents Introduction... 3 Context...
Applications: Introduction Task 1: Introduction to ArcCatalog Task 2: Introduction to ArcMap Challenge Question References
 CHAPTER 1 INTRODUCTION 1.1 GIS? 1.1.1 Components of a GIS 1.1.2 A Brief History of GIS 1.1.3 GIS Software Products Box 1.1 A List of GIS Software Producers and Their Main Products 1.2 GIS Applications
Adapting Hazus for use in Canada:
 Adapting Hazus for use in Canada: A risk assessment methodology for natural hazards Nicky Hastings and Murray Journeay Public Safety Geoscience Program" Risk Assessment Methods Project Incorporate: best
Determine the flooded area based on elevation information and the current water level
 Identifying Data Needs Identifying Data Needs Purpose Before looking for data, the methodology needs to be analyzed to establish what data is needed The most important question that needs to be answered
IH 35 at Blanco River May 2015
 IH 35 at Blanco River May 2015 Presentation Objectives Background of historical damage assessment processes Introduction to Collector App ( Mat Peck) Collector App and Flood Damage Assessment (Katie Steele)
Introducing spatial measurements and statistics
 1 Introducing spatial measurements and statistics Spatial measurements and statistics allow you to quantify patterns and relationships. That makes it easier to compare sets of features and to track changes
Layers (Layers in italics indicate group layers.) MyHazards MyPlan* Floods and Drought Landslides - USGS
 MyHazards MyPlan* Floods and Drought Landslides - USGS") MyHazards and MyPlan WebApps for Nevada Geohazards Over 100 hazard layers related to floods, fires, earthquakes, radon, and other supporting reference layers. Powerful educational and decision-making tools
MyHazards and MyPlan WebApps for Nevada Geohazards Over 100 hazard layers related to floods, fires, earthquakes, radon, and other supporting reference layers. Powerful educational and decision-making tools
Measuring community health outcomes: New approaches for public health services research
 Research Brief March 2015 Measuring community health outcomes: New approaches for public health services research P ublic Health agencies are increasingly asked to do more with less. Tough economic times
Empowering Local Health through GIS
 Empowering Local Health through GIS Mapping data from Washington s Immunization Information System (IIS). Presented to IACW October 16 th, 2013 by: Chris Halsell and Isaiah Berg Agenda IIS Overview Why
Students will be able, using GIS, to locate the largest and most destructive earthquakes;
 Exploring Earthquake Hazards with GIS Laboratory for Introduction to Geophysics, Spring 2007 Prof. Constantin Cranganu Brooklyn College of the City University of New York Learning Objectives: Students
The Attractive Side of Corpus Christi: A Study of the City s Downtown Economic Growth
 The Attractive Side of Corpus Christi: A Study of the City s Downtown Economic Growth GISC PROJECT DR. LUCY HUANG SPRING 2012 DIONNE BRYANT Introduction Background As a GIS Intern working with the City
Graduate Courses Meteorology / Atmospheric Science UNC Charlotte
 Graduate Courses Meteorology / Atmospheric Science UNC Charlotte In order to inform prospective M.S. Earth Science students as to what graduate-level courses are offered across the broad disciplines of
Summary of Available Datasets that are Relevant to Flood Risk Characterization
 Inter-Agency Characterization Workshop February 25-27, 2014 USACE Institute for Water Resources, Alexandria, VA, IWR Classroom Summary of Available Datasets that are Relevant to Characterization National
2018 ESRI Education Summit. San Diego. California. Sunday July 8 th 2018 Harper College, Palatine, Illinois, USA Dr. Tong Cheng (Biology), Dr.
, Dr.") 2018 ESRI Education Summit. San Diego. California. Sunday July 8 th 2018 Harper College, Palatine, Illinois, USA Dr. Tong Cheng (Biology), Dr. James Gramlich (Sociology), Mukila Maitha (Geography), Dr.
2018 ESRI Education Summit. San Diego. California. Sunday July 8 th 2018 Harper College, Palatine, Illinois, USA Dr. Tong Cheng (Biology), Dr. James Gramlich (Sociology), Mukila Maitha (Geography), Dr.
Students will be able, using GIS, to locate the largest and most destructive earthquakes;
 Exploring Earthquake Hazards with GIS Laboratory for Introduction to Geophysics, Spring 2007 Prof. Constantin Cranganu Brooklyn College of the City University of New York Learning Objectives: Students
Social Vulnerability explorer (SV-X)
") 311 Social Vulnerability explorer (SV-X) D. P. Lanter 1 ; S. Durden 2 ; C. Baker 3 ; and C. M. Dunning 4 1 CDM Smith, Two Penn Center Plaza, 1500 JFK Blvd, Philadelphia, PA 19102. E-mail: lanterdp@cdmsmith.com
311 Social Vulnerability explorer (SV-X) D. P. Lanter 1 ; S. Durden 2 ; C. Baker 3 ; and C. M. Dunning 4 1 CDM Smith, Two Penn Center Plaza, 1500 JFK Blvd, Philadelphia, PA 19102. E-mail: lanterdp@cdmsmith.com
LEHMAN COLLEGE OF THE CITY UNIVERSITY OF NEW YORK. 1. Type of Change: Change in Degree Requirements
 Alpha Number: Hegis Code 1214 Program Code: 30600 1. Type of Change: Change in Degree Requirements 2. From: [The curriculum consists of 45 graduate credits and includes core courses, an area of specialization,
Getting to know GIS. Chapter 1. Introducing GIS. Part 1. Learning objectives
 Part Getting to know GIS Chapter Introducing GIS Learning objectives Learn the uses of geographic information systems (GIS) Learn how GIS layers work Differentiate between GIS features and surfaces Obtain
Medical GIS: New Uses of Mapping Technology in Public Health. Peter Hayward, PhD Department of Geography SUNY College at Oneonta
 Medical GIS: New Uses of Mapping Technology in Public Health Peter Hayward, PhD Department of Geography SUNY College at Oneonta Invited research seminar presentation at Bassett Healthcare. Cooperstown,
The econ Planning Suite: CPD Maps and the Con Plan in IDIS for Consortia Grantees Session 1
 The econ Planning Suite: CPD Maps and the Con Plan in IDIS for Consortia Grantees Session 1 1 Training Objectives Use CPD Maps to analyze, assess, and compare levels of need in your community Use IDIS
The Challenge of Geospatial Big Data Analysis
 288 POSTERS The Challenge of Geospatial Big Data Analysis Authors - Teerayut Horanont, University of Tokyo, Japan - Apichon Witayangkurn, University of Tokyo, Japan - Shibasaki Ryosuke, University of Tokyo,
GIS in Weather and Society
 GIS in Weather and Society Olga Wilhelmi Institute for the Study of Society and Environment National Center for Atmospheric Research WAS*IS November 8, 2005 Boulder, Colorado Presentation Outline GIS basic
Applications of GIS in Electrical Power System. Dr. Baqer AL-Ramadan Abdulrahman Al-Sakkaf
 Applications of GIS in Electrical Power System Dr. Baqer AL-Ramadan Abdulrahman Al-Sakkaf OUTLINES: Objective Importance of GIS GIS data development Application of GIS Findings Conclusions and Recommendations
Geospatial application in Kiribati
 Geospatial application in Kiribati ICC-21 ST RESAP (9 TH TO 13 TH OCTOBER, 2017) BANGKOK, THAILAND Outline Kiribati Profile Natural disasters in Kiribati Achievements Challenges/Issues Ways forward 1 Kiribati
Kentucky Collaborates in GeoMAPP Project: The Advantages and Challenges of Archiving in a State with a Centralized GIS
 Kentucky Collaborates in GeoMAPP Project: The Advantages and Challenges of Archiving in a State with a Centralized GIS Geospatial Multistate Archive and Preservation Partnership By Glen McAninch Best Practices
Compact guides GISCO. Geographic information system of the Commission
 Compact guides GISCO Geographic information system of the Commission What is GISCO? GISCO, the Geographic Information System of the COmmission, is a permanent service of Eurostat that fulfils the requirements
GIS FOR PLANNING. Course Overview. Schedule. Instructor. Prerequisites. Urban Planning 792 Thursday s 5:30-8:10pm SARUP 158
 GIS FOR PLANNING Urban Planning 792 Thursday s 5:30-8:10pm SARUP 158 Schedule Class/Lab - SARUP 158 Thursdays 5:30pm - 8:10pm Office Hours - By Appointment Project Ideas - Week 4 Final - 5/10/2018 Instructor