DRAINAGE REPORT. Ministry of Transportation and Infrastructure. Highway 7 Four Laning Silverdale Avenue to Nelson Street 100% Detailed Design
|
|
|
- Silas Cain
- 5 years ago
- Views:
Transcription

1 DRAINAGE REPORT Ministry of Transportation and Infrastructure Highway 7 Four Laning Silverdale Avenue to Nelson Street 100% Detailed Design December 14, 2017 Reviewed by: Amanda Rust, P. Eng. Senior Drainage Engineer Prepared by: Jennifer Paverd, EIT Drainage Engineer
2 MINISTRY OF TRANSPORTATION AND INFRASTRUCTURE DRAINAGE REPORT HIGHWAY 7 FOUR LANING SILVERDALE AVENUE TO NELSON STREET TABLE OF CONTENTS 1 INTRODUCTION EXISTING DRAINAGE AND SITE CHARACTERISTICS Drainage Catchment Area Existing Highway Ditches and Culvert Network Chester Creek Pump Station BACKGROUND STUDIES Environmental Considerations Fraser River Outfall Conditions DESIGN CRITERIA Design References Design Return Period Culvert Design Life Climate HYDROLOGIC AND HYDRAULIC DRAINAGE MODEL Drainage Model Inputs Drainage Scenarios Modelling Results DRAINAGE DESIGN Culvert Design Catch Basins and Spillways Driveway Culverts CONCLUSIONS AND RECOMMENDATIONS CLOSING TABLES Table 4-1: Precipitation Amounts for Design Return Periods... 9 Table 5-1: Curve Numbers and Soil Groups Table 5-2: Comparison of Q100 Design Flow and Culvert Capacity for Options Table 6-1: Comparison of 200-year daily flows with 100-year instantaneous flows i
3 MINISTRY OF TRANSPORTATION AND INFRASTRUCTURE DRAINAGE REPORT HIGHWAY 7 FOUR LANING SILVERDALE AVENUE TO NELSON STREET FIGURES Figure 1-1: Project Location Source: Google Maps... 1 REFERENCES Golder Associates. (2017). Hydraulic Impact Assessment Technical Memorandum. Binnie. (2013). Highway 7 Silverdale to Chester Creek Drainage Review Draft Memorandum. Hirod Gill, District of Mission. (2012). Summary of available Chester Creek Pump Station Information Memorandum. ENKON. (2013). 50% Detailed Design Environmental Impact Assessment and Preliminary Compensation Requirements. Golder Associates. (2017). Highway 7 widening Project: Silverdale Avenue to Nelson Street, Mission, BC Environmental Impact Assessment. ISL Engineering and Land Services. 100% Preliminary Design Report. District of Mission. (2012). Fraser River Flood Preparedness and Responses Plan. Transportation Association of Canada. (2001). Guide to Bridge Hydraulics Second Edition. Urban Systems. (2008)/ Silverdale Urban Residential Area Neighbourhood One Final Report. Government of Canada. Canadian Climate Normals Precipitation Data. (Accessed on: July 14, 2017) Retrieved from: Northwest Hydraulic Consultants. (2008). BC Ministry of Environment, Fraser River Hydraulic model update final report. Ministry of Forests, Lands and Natural Resource Operations. Freshet Information. (Accessed on: July 24, 2017). Retrieved from: Western University. Mission West Abbey IDF curves. (Accessed on: June 29, 2017). Retrieved from: APPENDICES Appendix A: Appendix B: Appendix C: Appendix D: Appendix E: Appendix F: Catchment Areas District of Mission IDF Curve Model Inputs Model Results Review of Q200 Design Flows Average Two-Year Design Velocities ii
 was requested by Ministry of Transportation and Infrastructure (MoTI) to carry out a 100% detailed design for widening a 3.13-km section of Highway 7 from Silverdale Avenue (Sta.")
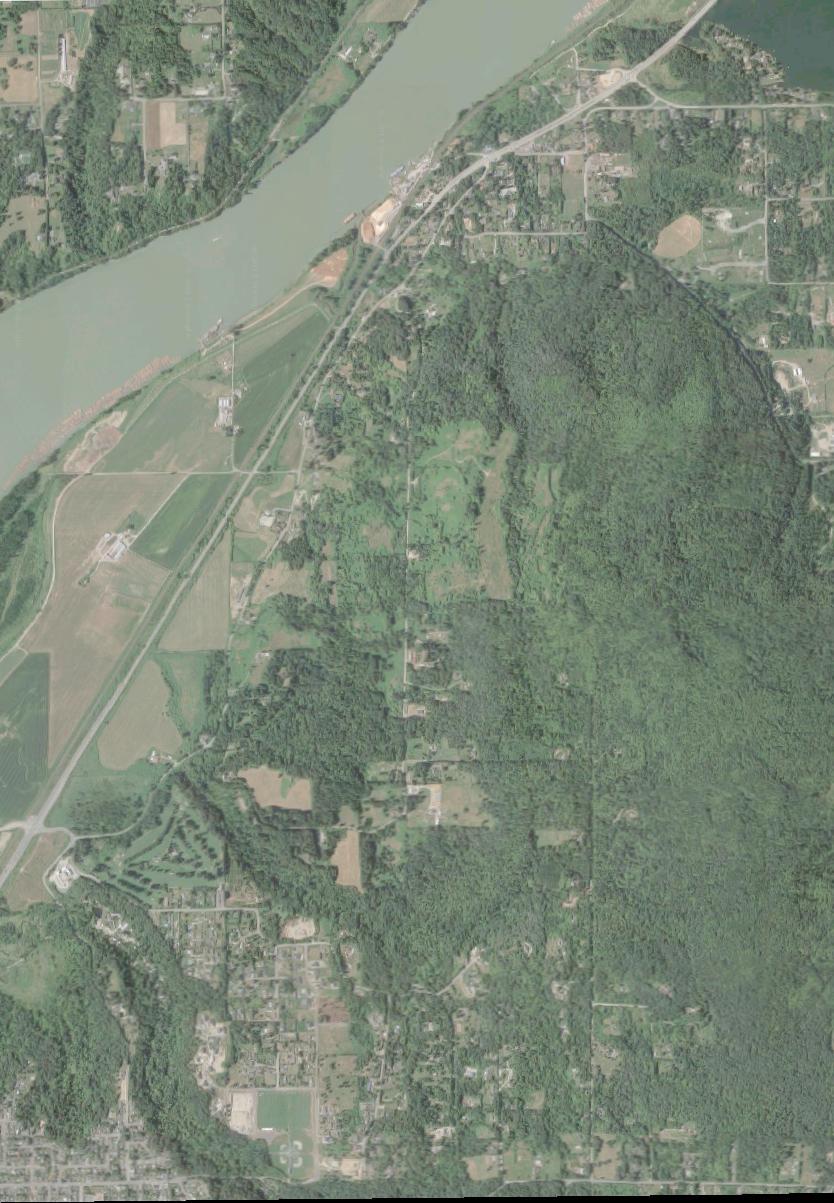
4 MINISTRY OF TRANSPORTATION AND INFRASTRUCTURE DRAINAGE REPORT HIGHWAY 7 FOUR LANING SILVERDALE AVENUE TO NELSON STREET 1 INTRODUCTION R.F. Binnie & Associates Ltd. (Binnie) was requested by Ministry of Transportation and Infrastructure (MoTI) to carry out a 100% detailed design for widening a 3.13-km section of Highway 7 from Silverdale Avenue (Sta ) to Nelson Street (Sta ) to four lanes. The project includes drainage design to upgrade the culverts crossing the highway to handle the peak flow for a Q100 event. The extent of the project is from Silverdale Avenue to Nelson Street as shown in Figure 1-1 below. N Project Area Figure 1-1: Project Location - Source: Google Maps The purpose of this report is to review the existing drainage patterns, determine catchment areas, calculate design flows, and document the detailed drainage design for the highway upgrade. The drainage design conforms to the BC Supplement to TAC Geometric Design Guide Section
5 MINISTRY OF TRANSPORTATION AND INFRASTRUCTURE DRAINAGE REPORT HIGHWAY 7 FOUR LANING SILVERDALE AVENUE TO NELSON STREET 2 EXISTING DRAINAGE AND SITE CHARACTERISTICS 2.1 Drainage Catchment Area The project is located within an area of Highway 7 with primarily forested land in the upper reaches of the catchment transitioning to open pasture and grasslands towards the Fraser River. Drainage basins for the catchment were identified using the District of Mission GIS, a contour map generated by LiDAR survey (provided by McElhanney), and available ground survey data adjacent to the highway (provided by Binnie). The drainage areas are shown in Appendix A, Figure 1. The typical drainage pattern for the total watershed area is from north to south, from a maximum elevation of 330 m to low lying ground discharging into the Fraser River. The Chester Creek drainage area (Catchment A) drains along the existing highway alignment toward the west, to an existing pump station with a total catchment area of 504 ha. There is an additional 136 ha (Catchment C) that drains into the Fraser River near Silverdale Avenue. Catchment B (63 ha) lies between these catchments and discharges into the bottom reach of Chester Creek via culverts at Sta and Sta before flowing towards the Fraser River. The south drainage boundary is marked by the existing Canadian Pacific Railway located to the south of Highway 7. The railway acts as a dike for the drainage. There is agricultural land south of the railway track that is protected from the Fraser River water levels by the Silverdale Dike. The Chester Creek drainage area naturally discharges into the Fraser River, except when the gates at the Chester Creek Pump Station are manually closed by the District of Mission, and the pump is operational. Typically, this occurs during spring freshet (May to July) or other Fraser River high water events. The pump operating levels are between elevations of 3.2 m to 3.5 m, with a maximum discharge of 1m 3 /s (Golder, 2017). 2.2 Existing Highway Ditches and Culvert Network Chester Creek converges into the northern highway ditch/creek at Sta and runs toward the west, collecting runoff and flow from several small tributaries. A backwater channel runs from Sta to Nelson Street along the northern boundary of the highway. The existing 450mm diameter culvert at Sta conveys flows from catchment A0 towards the backwater channel along the northern boundary of Highway 7. It is proposed to upgrade this culvert to a 750mm diameter pipe. At Sta an existing pipe arch farm access underpass runs beneath Highway 7. This acts as an overland flow path during peak flow events. It conveys excess flow into the southern highway ditch (Sta ), which also flows towards the west. It is proposed to replace this farm access underpass with a 1500-mm diameter culvert. There is an additional farm access underpass under the railway at approximately Sta which will convey peak flows towards the south. This overland flow path directs flows to the agricultural land located immediately south of the railway. 4
6 MINISTRY OF TRANSPORTATION AND INFRASTRUCTURE DRAINAGE REPORT HIGHWAY 7 FOUR LANING SILVERDALE AVENUE TO NELSON STREET The main Chester Creek channel flows west past the farm access underpasses along the northern edge of the highway. An existing 1500mm diameter pipe is located beneath Chester Street to convey flows in the northern highway ditch/ creek (catchments A0 to A1-8) towards the west. Approximately 420 m west of Chester Street (Sta ), an existing 1500-mm diameter cross culvert conveys Chester Creek and an additional tributary (catchments A0 to A1-9) across the highway to the southern highway ditch/creek. From there, it continues to flow toward the pump station located at Sta It is proposed that the existing culvert is upgraded to a 2400-mm diameter steel pipe, utilizing trenchless technology. Discharge from catchment A1-10 flows through an existing cross culvert at Sta (470-mm diameter). It is proposed to upgrade this to a 1200 mm cross culvert at Sta , utilizing trenchless technology. To the west of the pump station all runoff from Catchment B is conveyed along the north and south ditches/creek and across the highway at existing culverts (Sta mm diameter, Sta mm diameter and Sta mm diameter) into Chester Creek downstream of the pump station. It is proposed to replace these culverts with a 900-mm diameter culvert at Sta , a 900-mm diameter culvert at Sta and a 750-mm diameter culvert at Sta It is also proposed to have an additional 600-mm diameter cross culvert at Sta Runoff from Catchment C flows via an unnamed stream into the northern highway ditch before crossing the highway in an existing 900 mm culvert at Sta and an existing 900 mm culvert at Sta From here the two culverts discharge into Jameson Creek and flow toward the west before discharging into the Fraser River. No work is proposed for these culverts as part of this project. The drainage channels along the highway, both north and south are very flat with localized low spots with ponding and wetland areas. One larger wetland area is in the southern highway ditch starting near the farm underpass at Sta and ending at Sta Chester Creek Pump Station A summary report provided by Hirod Gill in 2012 outlines the available information on the Chester Creek pump station. The pump station is located adjacent to the highway at approximately Sta and has a current pumping capacity of 1.0m 3 /s which is supplemented by a 2m 2 flood gate. The pump station provides flood protection to approximately 60 ha of agricultural land upstream. The pump station flood gate is manually operated during freshet events and other high flow events in the Fraser River. It is generally operated in May and June. The District of Mission Public Works department confirmed that the gate is closed only during freshet in the Fraser River. The pump operates automatically during high flow events, turning on once the water level elevations reaches 3.5 m and turning off once the water elevation drops to 3.2 m. At the time of writing this report, it is understood that the District of Mission is in the process of commissioning an upgrade of the Chester Creek pump station. The timing of the upgrade work is currently unknown due to the potential future development of land in the upper catchments of Chester Creek. For this design and report it has been assumed that the pump station has not been upgraded, 5
7 MINISTRY OF TRANSPORTATION AND INFRASTRUCTURE DRAINAGE REPORT HIGHWAY 7 FOUR LANING SILVERDALE AVENUE TO NELSON STREET and no development of the land has been undertaken. It is recommended that the pump station be upgraded prior to future development to limit the potential of damage to upstream properties caused by flooding. In addition to upgrading the pump station, it is recommended that the operating periods and levels are reviewed to provide adequate drainage for Chester Creek and the adjacent highway ditches during large rainfall events. Sedimentation problems are known to occur along Chester Creek, with sediment and gravel accumulating at the pump station intake as well as downstream of the pump station. Ongoing maintenance work will likely be required along the highway ditches and around the pump station intake to ensure that the channels can convey the full design flow and allow the pump station to operate to its full capacity. No further work has been done regarding the Chester Creek pump station for this report and drainage design. 6
8 MINISTRY OF TRANSPORTATION AND INFRASTRUCTURE DRAINAGE REPORT HIGHWAY 7 FOUR LANING SILVERDALE AVENUE TO NELSON STREET 3 BACKGROUND STUDIES 3.1 Environmental Considerations Environmental assessments were done previously by ENKON Environmental Ltd. (ENKON) in 2013, with a recent update in 2017 by Golder Associates Ltd. (Golder). Both reports note that fish access is impeded by the closure of the pump station flood gate. Proposed modifications to Chester Creek and the highway ditches are within a riparian and in-stream fish habitat. The Golder report highlights mitigation measures for the proposed design. 3.2 Fraser River Outfall Conditions The BC Ministry of Environment Fraser River Hydraulic Model Update Final Report by Northwest Hydraulic Consultants in March 2008, has calculated the 200-year Fraser River elevation to be 8.48 m at Silverdale Creek. The Mission flood plan mapping (2007) includes a 0.6 m freeboard which increases flood protection level to 9.5 m for the 200-year event. Historic events suggest a maximum water level of 7.6 m above sea level at the Mission station. Peak water levels in the Fraser River are associated with spring freshet. The Chester Creek pump station is operated during the Fraser River freshet and restricts the outfall flow to the Fraser River. The Fraser River water level in Mission is typically lower in the fall and winter months, so the flood gate is left open. The drainage design model analysis has assessed the hydraulic conditions of the culverts during a Q100 event under free outfall conditions with both the pump station gate open as well as the surcharge hydraulic conditions in the ditch/channel during operation of the Chester Creek pump station. It was assumed that free normal conditions correlate to an outfall water elevation of 3.2 m. This outfall elevation has been based on an Urban Systems report highlighting a gravel deposit build up downstream of the pump station creating a surcharge depth 0.8 m above the base of the flood gate invert at 2.4 m elevation. 7
9 MINISTRY OF TRANSPORTATION AND INFRASTRUCTURE DRAINAGE REPORT HIGHWAY 7 FOUR LANING SILVERDALE AVENUE TO NELSON STREET 4 DESIGN CRITERIA 4.1 Design References The following regulations were used to develop design criteria for the project: Ministry of Transportation and Infrastructure Supplement to TAC Geometric Design Guide Water Sustainability Act (WSA) Ministry of Transportation and Infrastructure Technical Circular T15-06 Climate Change and Extreme Weather Event Preparedness and Resilience in Engineering Infrastructure Design District of Mission Development and Subdivision Control Bylaw The following guidance documents were also referenced to develop the drainage design: TAC Guide to Bridge Hydraulics Second Edition Guidelines Department of Fisheries and Oceans Land Development Guidelines Section 6 Fish Passage and Culverts 4.2 Design Return Period The culverts have been designed to pass the peak instantaneous design flows for the 100-year rainfall event, as per TAC Table 1010.A for culverts with a span under 3m within arterial roads and freeways. The culverts have also been assessed as per the WSA regulations. The culvert capacity is to be designed to the equivalent of the hydraulic capacity of the stream channel, or capable of passing the one in 200- year maximum daily flow without the water level at the culvert inlet exceeding the top of the culvert. In addition, the proposed culverts have also been designed as per the Land Development Guidelines for Fish Passage for Adult Fish. It requires fish bearing culverts to be sized to ensure the maximum guidance velocities are not exceeded for more than three consecutive days in an average year. 4.3 Culvert Design Life The project is located within a stretch of Highway 7 that sees high traffic volumes and therefore the culverts within the project are to be designed for a design life of 75 years. Existing water quality data from the site has been used to confirm corrugated steel pipe (CSP) culvert durability with aluminized coating or increased wall thicknesses are suitable for a design life of 75 years. Alternative culvert materials such as high-density polyethylene (HPDE) are also suitable for a design life of 75 years. 4.4 Climate A review of the average monthly rainfall data from the Canadian Climate Normals Station Data suggest maximum precipitation events typically occur during the fall and winter months of October to January. For the drainage design two scenarios have been assessed; the Q100 peak rainfall occurring outside of freshet and the Q100 peak rainfall occurring during freshet. The rainfall data used for this project is from the Mission West Abbey Station, ID: as analyzed by the District of Mission (attached in Appendix B). 8
10 MINISTRY OF TRANSPORTATION AND INFRASTRUCTURE DRAINAGE REPORT HIGHWAY 7 FOUR LANING SILVERDALE AVENUE TO NELSON STREET Climate Change Assessment The technical circular release by MoTI on June 22, 2015 details climate change and extreme weather preparedness. The document states that all MoTI projects must consider climate change when considering weather projections. Climate change projections have been assessed through to To determine the projected climate change for the project, the District of Mission IDF Curve has been assessed in conjunction with climate change. A predicted increase in rainfall for the 100-year, 24-hour storm event is from mm to mm, which is equivalent to a 24% increase in rainfall as determined by comparing with a Representative Concentration Pathway (RCP) 8.5 assessment using the IDF tools. RCP 8.5 is the worst-case scenario used for climate change assessment in BC. For the proposed design it has been assumed that majority of the culverts will need to be upsized to allow for increased runoff from climate change. All design flows were determined based on an average 24% increase in rainfall patterns to account for climate change Design Precipitation Climate change projections are included in the rainfall data projections. The design flows including climate change are shown below in Table 4-1. Table 4-1: Total Precipitation Amounts for Design Return Periods Including Climate Change Return Period Rainfall Duration 2-year 100-year 200-year 5 min 4.84 mm 9.92 mm mm 1 hour mm mm mm 24 hours mm mm mm 9
11 MINISTRY OF TRANSPORTATION AND INFRASTRUCTURE DRAINAGE REPORT HIGHWAY 7 FOUR LANING SILVERDALE AVENUE TO NELSON STREET 5 HYDROLOGIC AND HYDRAULIC DRAINAGE MODEL The hydrology and highway culvert hydraulics were calculated using the Autodesk Storm and Sanitary Analysis 2012 (SSA) tool, which follows the SCS TR-55 analysis for storage and hydrodynamic flow to model backflow conditions. Detailed SSA model input and results are included in Appendices C and D. 5.1 Drainage Model Inputs Below is a summary of model assumptions and input data for the proposed design including climate change: The SCS TR-55 method will be used to calculate peak runoff. A manning s roughness coefficient of 0.05 has been assumed for all open channels. A manning s roughness coefficient of has been assumed for all HDPE and steel pipes and assumed for all CSP pipes. Entrance and exit losses of have been assumed for all culverts based on the inlet and outlet structures. Rainfall intensity will be obtained from the Mission West Abbey (1963 to 2010) IDF Curve, as prepared by the District of Mission. The intensity includes a 24% climate change factor as predicted to 2100 for the design event. The SCS TR-55 method was used to determine the time of concentration. The hydraulic analysis has allowed overflow at high water events to flow through the farm underpasses, and outfall south of the railway, as per existing drainage conditions. The pump station was set to operate from an initial water level elevation of 3.5 m, until the water level drops to 3.2 m depth, with a maximum capacity of 1m 3 /s. Available ponding has been allowed at each node in the model to represent the flow remaining in the system and draining when there is available space in the system. All culvert lengths and locations are based on the proposed new locations. For the purpose of analyzing the major event, Q100, it is assumed there is little retentive benefit from the low ponding wetland areas in the north and south highway ditches, as they are assumed to already be filled with water during the Q100 event. All new culverts 900 mm and less are assumed to be HDPE. The culverts at Sta and Sta are steel pipes. The L300 cross culvert and the culvert at Sta are to be CSP. All new culverts less than 900-mm diameter are designed with no headwalls. Existing box or arch culverts have been modelled as such. The ditch/channel conduits were generally assumed to be trapezoidal, with the width and bottom of channel based on the average design widths and depths. Any narrow and deeper sections of the channel which are lower than the average ditch depths have not been included in the design model. 10
12 MINISTRY OF TRANSPORTATION AND INFRASTRUCTURE DRAINAGE REPORT HIGHWAY 7 FOUR LANING SILVERDALE AVENUE TO NELSON STREET The elevation inverts on the base model are based on the available survey information at the time of this report. Where survey data was unavailable, the channel dimensions were assumed based on LiDAR. Proposed culvert along the L700 line has not been included in the model as only a small proportion of flow from Catchment A0 will pass through the flow. The design flow has been calculated using the SCS TR55 method in a separate calculation. Curve numbers vary depending on the soil groups and the ground coverage. A review of the available aerial images has been used to assess the curve numbers. Refer to Table 5-1 below for a summary of the factors. Table 5-1: Curve Numbers and Soil Groups Land Coverage Soil Group CN Number Good wood coverage B 55 Good wood coverage B/C 63 Good wood coverage C n/a Good pasture or grassland B 61 Good pasture or grassland C 74 Fair pasture or grassland C 79 Fair pasture or grassland C/D 82 >75% grass cover, golf course B 61 2-acre lots, 12% impervious B 65 2-acre lots, 12% impervious C 77 1-acre lots, 20% impervious B 68 ¼ acre lots, 38% impervious B 75 Paved parking and roofs C Drainage Scenarios Two variations of the model have been run. The culvert sizes in the models have been designed to facilitate the hydraulics and maintain a maximum/total depth ratio less than one, where possible (i.e. water level less than the height of the culvert). A summary of the scenarios is outlined below: Scenario 1: Base model with climate change, assuming the pump station is under operating conditions, with a maximum capacity of 1 m 3. Scenario 2: The Chester Creek pump station gate is fully open allowing discharge into the Fraser River, via a 2 m 2 flood gate. Note: The water level elevation in the Fraser River Outfall is set to 3.2 m for all the above design events. The model used hydrodynamic flow routing, which allows for backwater and storage. During peak flow events the pump house located near the outlet of Chester Creek to the Fraser River restricts flow and causes water to back up through the highway ditches and culverts. The maximum HW/D at some of the 11
13 MINISTRY OF TRANSPORTATION AND INFRASTRUCTURE DRAINAGE REPORT HIGHWAY 7 FOUR LANING SILVERDALE AVENUE TO NELSON STREET culverts is a function of result of this backwater as opposed to the peak runoff flow from the associated catchment area. All peak flow results are based on this rainfall data with a 24% increase to account for climate change, and are based on assumptions and model rationale identified above, along with their implied published limitations. 5.3 Modeling Results The proposed culverts have been designed to pass the peak instantaneous design flows for the 100- year rainfall event with a HW/D less than one. As seen in the table below, the Chester Street culvert does not meet this criterion, however upgrading this culvert is outside the scope of work for this project and therefore the culvert has not been resized. The culvert design information is summarized in Table 5-2 below, for the Q100 design event. The model results are included in Appendix D. Table 5-2: Comparison of Q100 Design Flow and Culvert Capacity for Scenarios 1 and 2 Option 1 Option 2 Pipe Q100 Capacity HW/ Pipe Q100 Capacity HW/ Culvert ID Dia (m) (m 3 /s) (m 3 /s) D Dia (m) (m 3 /s) (m 3 /s) D Chester Street Culvert Cross Sta Cross Cross Cross Cross > Cross Culvert Sta to Sta FarmUnderPass@Sta Pr. Sta Pr. Sta Pump Station Gate n/a n/a n/a n/a 1x Cross L700 Sta The results indicate that the major difference between scenarios 1 and 2 is the depth of water throughout the channels and culverts. During scenario 2, only the L300 culvert is surcharged and the flow through the railway underpass is significantly reduced from 3.8m 3 /s to 0.6m 3 /s. Scenario 1 has been run with an increased pump capacity to reduce the culvert surcharging in all culverts except for the L300 culvert. To meet this requirement the pump station capacity would need to be increased to at least 4 m 3 /s. 12
14 MINISTRY OF TRANSPORTATION AND INFRASTRUCTURE DRAINAGE REPORT HIGHWAY 7 FOUR LANING SILVERDALE AVENUE TO NELSON STREET The agricultural land located to the north of the highway is located significantly lower than the CPR Rail line and the highway, with the majority of the land located between elevations of 4-5 m with some areas lower than 4 m in elevation. In the worst-case scenario (scenario 1) there is potential flooding along the northern channel from approximately Sta to Sta It is likely that the flooding depth could be decreased by removing/replacing the existing Chester Street culvert, implementing a storage pond with an increased invert depth at the existing Chester Street and Highway 7 intersection and increasing the capacity of the Chester Creek pump. 13
15 MINISTRY OF TRANSPORTATION AND INFRASTRUCTURE DRAINAGE REPORT HIGHWAY 7 FOUR LANING SILVERDALE AVENUE TO NELSON STREET 6 DRAINAGE DESIGN 6.1 Culvert Design The proposed culverts at Sta and Sta do not meet the HW/D less than one criteria during a 100-year rainfall intensity when the flood gate is closed, but do meet the criteria when the flood gate is open. The capacity of these pipes can pass the 200-year daily flow from the upstream channel without the water level at the culvert inlet exceeding the top of the culvert or over topping the road when the flood gate is closed as per the WSA. Based on this, it is considered a suitable size with the limiting factor within the overall network being the capacity of the pump as well as the elevations of the surrounding land north of the upstream channel. The proposed culvert at Sta does not meet the HW/D criteria during scenarios 1 and 2. However, it can pass the 200-year daily flows. This culvert does not convey large flows from upstream but rather enables the culvert and ditches to act as a storage system to contain the flow that ponds because of the pump station operation Culvert Fish Passage Design The roadside ditches and channels along the project are considered to be fish bearing, and have been designed to the Water Sustainability Regulations. Under the WSA Regulations, the culvert capacity is to be designed to the equivalent of the hydraulic capacity of the stream channel, or is to be capable of passing the one in 200-year maximum daily flow without the water level at the culvert inlet exceeding the top of the culvert. The model was run using the 200-year rainfall intensity of mm with a SCS Type 1A-24hour storm distribution. A peaking ration of two (based on the TAC Guide to Bridge Hydraulics Second Edition Guidelines) was used to estimate maximum daily flows from the modelled peak flows. Table 6-1 below, indicates that the maximum daily flow for the 200-year event is less than the 100-year peak instantaneous design flows for which the culverts have been designed. Therefore, the culverts are deemed to be adequately sized. Appendix D shows that the culverts that do not meet the HW/D less than one criteria for the 100- year event can pass the maximum daily flow for the 200-year event without surcharge. 14
16 MINISTRY OF TRANSPORTATION AND INFRASTRUCTURE DRAINAGE REPORT HIGHWAY 7 FOUR LANING SILVERDALE AVENUE TO NELSON STREET Table 6-1: Comparison of 200-year Daily Flows with 100-year Instantaneous Flows Option 1 Option 2 Q100 Q200 Q100 Q200 Culvert ID (m 3 /s) (m 3 /s) (m 3 /s) (m 3 /s) Chester Street culvert Cross Sta Cross Cross Cross Cross Cross Culvert Sta to Sta FarmUnderPass@Sta Pr Pr. Sta Pump station gate n/a n/a Cross L700 Sta Land Development Guidelines for Fish Passage for Adult Fish was consulted for additional fish passage design guidelines. The guidelines state that the velocity through fish bearing culverts cannot exceed 1.2 m/s for culverts less than 24.4 m and 0.9m/s for culverts greater than 24.4 m in length for more than three consecutive days in an average year. To check that these criteria are met, the model was analyzed for a two-year rainfall event. The average velocity over a three-day period was then assessed. Appendix E shows the average velocities for each of the culverts during scenario 1. The guidelines also recommend maximum lengths for fish passage culverts. The proposed culvert crossing the L300 line (Sta ) exceeds the recommended maximum culvert length for fish passage due to construction access constraints alongside the Canadian Pacific Railway corridor. It is expected that this culvert will be subject to approval by the Department of Fisheries and Oceans, and the Ministry of Forests, Lands and Natural Resource Operations as part of the overall project review. The large fish bearing culverts at Sta and Sta have been designed with slopes less than 1% to prevent large velocities through the culverts and to allow sedimentation build up along the base of the culverts with time. 15
17 MINISTRY OF TRANSPORTATION AND INFRASTRUCTURE DRAINAGE REPORT HIGHWAY 7 FOUR LANING SILVERDALE AVENUE TO NELSON STREET 6.2 Catch Basins and Spillways The project requires spillways and/or catch basins to manage pavement drainage for the project. The location and quantity of spillways/catch basins was determined in accordance with the BC MoTI Supplement to TAC. From Sta onwards, slotted concrete barriers have been installed to manage pavement drainage. However, due to the flat grade within this area of the project it is recommended that larger barrier openings are utilized every 50 m to allow for extra drainage capabilities if the slotted barriers become blocked. 6.3 Driveway Culverts The project requires one additional culvert to convey runoff under the L500 driveway located to the north of the project. This driveway culvert is designed to convey the peak 25-year return flow while maintaining a maximum HW/D of
18 MINISTRY OF TRANSPORTATION AND INFRASTRUCTURE DRAINAGE REPORT HIGHWAY 7 FOUR LANING SILVERDALE AVENUE TO NELSON STREET 7 CONCLUSIONS AND RECOMMENDATIONS Binnie is providing the Ministry of Transportation and Infrastructure with a 100% detail design for widening a 3.13 km section of Highway from Silverdale Avenue to Nelson into four lanes. This includes drainage design to upgrade the culverts crossing the highway. The report assumes that all Q100 peak flows are conveyed in the upstream catchment area without impediment, and therefore a hydraulic assessment of the upstream pipes, culverts, ditches, or creek channels has not been carried out. It is assumed that if the catchment lands are developed they will limit the runoff to pre-development levels for the peak Q100. The peak Q100 runoff values in this report assume an increase in rainfall due to climate change. This report is for the hydrology calculations and the hydraulic conditions of the culverts crossing the highway during Q100 events, for two different scenarios: (1) pump station operating at maximum capacity, (2) the gates open at the pump station allowing free outfall conditions to the Fraser River. The existing pump station restricts the drainage through Chester Creek causing back water effects and surcharging of the culverts and ditches upstream, and flooding of the adjacent agricultural land. For any future development in the area Binnie recommends that: The pump station capacity is upgraded to minimize backwater flooding effects and associated flooding of adjacent agricultural land. If the Chester Street culvert is to be removed, it should be replaced with suitable storage retention for high flow events, and to increase available riparian zones around the project. Maintenance work is routinely carried out along the channels and around the pump station intake to ensure that the existing pump can operate to its full capacity. 17

19
20 APPENDIX A CATCHMENT AREAS

21
22 APPENDIX B DISTRICT OF MISSION IDF CURVE

23
24 APPENDIX C MODEL INPUTS
25 Autodesk Storm and Sanitary Analysis Version (Build 1) ******************* Project Description ******************* File Name Option 1 _ Pump Station Operating _FINAL.SPF Description... P:\2016\ \05 - Design\Drainage\Drainage Study\ Design Base (for drainage figures).dwg **************** Analysis Options **************** Flow Units... cms Subbasin Hydrograph Method. SCS TR-55 Time of Concentration... SCS TR-55 Link Routing Method... Hydrodynamic Storage Node Exfiltration.. None Starting Date... AUG :00:00 Ending Date... AUG :00:00 Report Time Step... 00:05:00 ************* Element Count ************* Number of rain gages... 1 Number of subbasins Number of nodes Number of links **************** Subbasin Summary **************** Subbasin Total Area ID hectares {Ditch}.A {Ditch}.A {Ditch}.A1-10a 1.01
26 {Ditch}.A {Ditch}.A {Ditch}.A {Ditch}.A {Ditch}.A {Ditch}.A {Ditch}.A1-7a 3.02 {Ditch}.A {Ditch}.A1-8a 1.71 {Ditch}.A {Ditch}.A1-9a 1.08 {Ditch}.A {Ditch}.B {Ditch}.B1-1a 0.63 {Ditch}.B {Ditch}.B1-2b 1.11 {Ditch}.B {Ditch}.B1-3a 0.30 {Ditch}.B {Ditch}.B {Ditch}.C {Ditch}.Ca 0.39 A Sub ************ Node Summary ************ Node Element Invert Maximum Ponded External ID Type Elevation Elev. Area Inflow m m m² JUNCTION JUNCTION JUNCTION JUNCTION JUNCTION JUNCTION JUNCTION JUNCTION JUNCTION JUNCTION JUNCTION
27 12 JUNCTION JUNCTION JUNCTION JUNCTION JUNCTION JUNCTION JUNCTION JUNCTION JUNCTION JUNCTION JUNCTION a JUNCTION JUNCTION JUNCTION JUNCTION JUNCTION a JUNCTION Jun-57 JUNCTION Jun-60 JUNCTION Jun-61 JUNCTION Sta JUNCTION Sta JUNCTION Sta North JUNCTION Sta JUNCTION Sta JUNCTION Sta JUNCTION Sta JUNCTION Sta JUNCTION Sta JUNCTION Sta North JUNCTION Sta JUNCTION Sta North JUNCTION Sta JUNCTION Sta JUNCTION Sta JUNCTION Sta North JUNCTION FarmUnderpassOutfallOUTFALL OutfallSTA107 OUTFALL Out-Sta101 OUTFALL PumpStationOutfall OUTFALL ************ Link Summary
28 ************ Link From Node To Node Element Length Slope Manning's ID Type m % Roughness Chester Creek Tributary34 33 CHANNEL Chester Creek US of Highway32 Sta CHANNEL Chester Street CulvertSta Sta CONDUIT Cross Sta CONDUIT Cross Sta CONDUIT Cross 4 CONDUIT Cross 14 CONDUIT Cross 17 CONDUIT Cross 19 CONDUIT Cross Sta CONDUIT Cross Sta CONDUIT Culvert across Mclean Street6a Out-Sta101 CONDUIT Culvert from Sta to Sta CONDUIT Ex. Underpass_Bridge Sta 124Sta North Sta North CHANNEL Farm underpass to south ditch35 Sta CHANNEL FarmCrossingUnderPass@Sta a 35 CONDUIT L200 to Sta CHANNEL L300 line to Sta 124 (south)sta Sta CHANNEL Link-66 Jun-60 PumpStationOutfallCHANNEL Link-68 Jun-61 FarmUnderpassOutfallCONDUIT Link-69 Sta Sta North CHANNEL Link-70 Sta Sta CHANNEL Link-71 Sta Sta CHANNEL Overflow to farm underpass30a Sta North CHANNEL Pr. L CONDUIT Sta CONDUIT Pump Station to Fraser River20 Jun-60 CHANNEL Pump Station to Sta (south)Sta Sta CHANNEL Railway_underpassJun-61 Sta CONDUIT Sta to Mclean Street6 6a CHANNEL Sta to Sta DIRECT Sta 107 to Sta 107 outfall15 OutfallSTA107 CHANNEL Sta to Sta CHANNEL Sta 10740to Sta CHANNEL Sta to Sta CHANNEL Sta to DS pump station19 20 CHANNEL Sta to Tributaries21 22 CHANNEL Sta 114 to L300 line (south)sta Sta CHANNEL
29 Sta to Chester StreetSta Sta North CHANNEL Sta 119 to Chester StreetSta Sta CHANNEL Sta 119 to Sta 124Sta Sta North CHANNEL Sta 124 (South) Sta Sta CHANNEL Sta 124 (south) Overflow pondjun-57 Sta CHANNEL Sta to Sta127+80Sta Sta North CHANNEL Sta100+90toSta CHANNEL Sta101+35toSta CHANNEL Sta to Sta CHANNEL Sta to L CHANNEL Start of Chester Creek33 32 CHANNEL Pump-02 Sta TYPE4 PUMP ********************* Cross Section Summary ********************* Link Shape Depth/ Width No. of Cross Full Flow Design ID Diameter Barrels Sectional Hydraulic Flow Area Radius Capacity m m m² m cms Chester Creek Tributary TRAPEZOIDAL Chester Creek US of Highway TRAPEZOIDAL Chester Street Culvert CIRCULAR Cross Sta CIRCULAR Cross Sta CIRCULAR Cross CIRCULAR Cross CIRCULAR Cross CIRCULAR Cross CIRCULAR Cross CIRCULAR Cross CIRCULAR Culvert across Mclean Street CIRCULAR Culvert from Sta to Sta CIRCULAR Ex. Underpass_Bridge Sta 124 RECT_OPEN Farm underpass to south ditch TRAPEZOIDAL FarmCrossingUnderPass@Sta CIRCULAR L200 to Sta 107 TRAPEZOIDAL L300 line to Sta 124 (south) TRAPEZOIDAL Link-66 RECT_OPEN Link-68 HORIZ_ELLIPSE
30 Link-69 TRAPEZOIDAL Link-70 TRAPEZOIDAL Link-71 TRAPEZOIDAL Overflow to farm underpass TRAPEZOIDAL Pr. L200 CIRCULAR CIRCULAR Pump Station to Fraser River RECT_OPEN Pump Station to Sta (south) TRAPEZOIDAL Railway_underpass HORIZ_ELLIPSE Sta to Mclean Street TRAPEZOIDAL Sta to Sta DUMMY Sta 107 to Sta 107 outfall TRAPEZOIDAL Sta to Sta TRAPEZOIDAL Sta 10740to Sta 107 TRAPEZOIDAL Sta to Sta 107 TRAPEZOIDAL Sta to DS pump station TRAPEZOIDAL Sta to Tributaries TRAPEZOIDAL Sta 114 to L300 line (south) TRAPEZOIDAL Sta to Chester Street TRAPEZOIDAL Sta 119 to Chester Street TRAPEZOIDAL Sta 119 to Sta 124 TRAPEZOIDAL Sta 124 (South) RECT_OPEN Sta 124 (south) Overflow pond TRAPEZOIDAL Sta to Sta TRAPEZOIDAL Sta100+90toSta TRAPEZOIDAL Sta101+35toSta TRAPEZOIDAL Sta to Sta TRAPEZOIDAL Sta to L200 TRAPEZOIDAL Start of Chester Creek TRAPEZOIDAL ************************** Volume Depth Runoff Quantity Continuity hectare-m mm ************************** Total Precipitation Surface Runoff Continuity Error (%)
31 ************************** Volume Volume Flow Routing Continuity hectare-m Mliters ************************** External Inflow External Outflow Initial Stored Volume Final Stored Volume Continuity Error (%) ****************************************** Composite Curve Number Computations Report ****************************************** Subbasin {Ditch}.A Area Soil Soil/Surface Description (ha) Group CN > 75% grass cover, Good-Golfcourse B Pasture, grassland, or range, Fair C Pasture, grassland, or range, Fair 9.74 C/D Composite Area & Weighted CN Subbasin {Ditch}.A1-1 Area Soil Soil/Surface Description (ha) Group CN Woods, Good B/C Pasture, grassland, or range, Good 8.15 B Woods, Good B Composite Area & Weighted CN Subbasin {Ditch}.A1-10a -- Area Soil Soil/Surface Description (ha) Group CN Paved parking & roofs 1.01 C 98.00
32 Composite Area & Weighted CN Subbasin {Ditch}.A1-2 Area Soil Soil/Surface Description (ha) Group CN Woods,Good B/C Woods, Good B Composite Area & Weighted CN Subbasin {Ditch}.A1-3 Area Soil Soil/Surface Description (ha) Group CN Woods, Good B Composite Area & Weighted CN Subbasin {Ditch}.A1-4 Area Soil Soil/Surface Description (ha) Group CN Woods, Good B acre lots, 12% impervious 2.07 B Composite Area & Weighted CN Subbasin {Ditch}.A1-5 Area Soil Soil/Surface Description (ha) Group CN Pasture, grassland, or range, Good C Woods, Good B acre lots, 12% impervious B Composite Area & Weighted CN
33 Subbasin {Ditch}.A1-6 Area Soil Soil/Surface Description (ha) Group CN Woods, Good 5.77 B acre lots, 12% impervious 1.92 B acre lots, 12% impervious 2.88 C Pasture, grassland, or range, Good 8.65 C Composite Area & Weighted CN Subbasin {Ditch}.A1-7 Area Soil Soil/Surface Description (ha) Group CN Pasture, grassland, or range, Good 2.99 C Composite Area & Weighted CN Subbasin {Ditch}.A1-7a - Area Soil Soil/Surface Description (ha) Group CN Paved parking & roofs 3.02 C Composite Area & Weighted CN Subbasin {Ditch}.A1-8 Area Soil Soil/Surface Description (ha) Group CN acre lots, 12% impervious 5.16 B Woods, Good 8.61 B acre lots, 12% impervious C Pasture, grassland, or range, Good 8.61 C Composite Area & Weighted CN Subbasin {Ditch}.A1-8a
34 - Area Soil Soil/Surface Description (ha) Group CN Paved parking & roofs 1.71 C Composite Area & Weighted CN Subbasin {Ditch}.A1-9 Area Soil Soil/Surface Description (ha) Group CN Pasture, grassland, or range, Good 3.71 C Woods, Good 5.57 B Pasture, grassland, or range, Good B Composite Area & Weighted CN Subbasin {Ditch}.A1-9a - Area Soil Soil/Surface Description (ha) Group CN Paved parking & roofs 1.08 C Composite Area & Weighted CN Subbasin {Ditch}.A5-2 Area Soil Soil/Surface Description (ha) Group CN Pasture, grassland, or range, Good 7.00 C Composite Area & Weighted CN Subbasin {Ditch}.B1-1 Area Soil Soil/Surface Description (ha) Group CN Pasture, grassland, or range, Good 2.85 B Woods, Good B 55.00
35 Pasture, grassland, or range, Good 0.95 C Composite Area & Weighted CN Subbasin {Ditch}.B1-1a - Area Soil Soil/Surface Description (ha) Group CN Paved parking & roofs 0.63 C Composite Area & Weighted CN Subbasin {Ditch}.B1-2 Area Soil Soil/Surface Description (ha) Group CN Pasture, grassland, or range, Good B Woods, Good 2.27 B Composite Area & Weighted CN Subbasin {Ditch}.B1-2b - Area Soil Soil/Surface Description (ha) Group CN Paved parking & roofs 1.11 C Composite Area & Weighted CN Subbasin {Ditch}.B1-3 Area Soil Soil/Surface Description (ha) Group CN Woods, Good 3.65 B acre lots, 12% impervious 1.83 B Pasture, grassland, or range, Good B Composite Area & Weighted CN Subbasin {Ditch}.B1-3a
36 - Area Soil Soil/Surface Description (ha) Group CN Paved parking & roofs 0.30 C Composite Area & Weighted CN Subbasin {Ditch}.B1-4 Area Soil Soil/Surface Description (ha) Group CN /4 acre lots, 38% impervious 3.85 B Composite Area & Weighted CN Subbasin {Ditch}.B Area Soil Soil/Surface Description (ha) Group CN Pasture, grassland, or range, Good 5.40 C Composite Area & Weighted CN Subbasin {Ditch}.C1-1 Area Soil Soil/Surface Description (ha) Group CN Woods, Good-moderatelywelldrained B/C Pasture, grassland, or range, Good B/C acre lots, 20% impervious B Woods, Good B Pasture, grassland, or range, Good B Paved parking & roofs 1.20 B Composite Area & Weighted CN Subbasin {Ditch}.Ca Area Soil Soil/Surface Description (ha) Group CN
37 Paved parking & roofs 0.39 C Composite Area & Weighted CN Subbasin A Area Soil Soil/Surface Description (ha) Group CN Woods, Good 5.61 B Pasture, grassland, or range, Good 2.59 B Pasture, grassland, or range, Good 0.43 C Composite Area & Weighted CN Subbasin Sub Area Soil Soil/Surface Description (ha) Group CN Composite Area & Weighted CN *************************************************** SCS TR-55 Time of Concentration Computations Report *************************************************** Sheet Flow Equation Tc = (0.007 * ((n * Lf)^0.8)) / ((P^0.5) * (Sf^0.4)) Where: Tc = Time of Concentration (hrs) n = Manning's Roughness Lf = Flow Length (ft) P = 2 yr, 24 hr Rainfall (inches) Sf = Slope (ft/ft) Shallow Concentrated Flow Equation
38 V = * (Sf^0.5) (unpaved surface) V = * (Sf^0.5) (paved surface) V = 15.0 * (Sf^0.5) (grassed waterway surface) V = 10.0 * (Sf^0.5) (nearly bare & untilled surface) V = 9.0 * (Sf^0.5) (cultivated straight rows surface) V = 7.0 * (Sf^0.5) (short grass pasture surface) V = 5.0 * (Sf^0.5) (woodland surface) V = 2.5 * (Sf^0.5) (forest w/heavy litter surface) Tc = (Lf / V) / (3600 sec/hr) Where: Tc = Time of Concentration (hrs) Lf = Flow Length (ft) V = Velocity (ft/sec) Sf = Slope (ft/ft) Channel Flow Equation V = (1.49 * (R^(2/3)) * (Sf^0.5)) / n R = Aq / Wp Tc = (Lf / V) / (3600 sec/hr) Where: Tc = Time of Concentration (hrs) Lf = Flow Length (ft) R = Hydraulic Radius (ft) Aq = Flow Area (ft²) Wp = Wetted Perimeter (ft) V = Velocity (ft/sec) Sf = Slope (ft/ft) n = Manning's Roughness Subbasin {Ditch}.A Shallow Concentrated Flow Computations Subarea A Subarea B Subarea C Flow Length (m):
39 Slope (%): Surface Type: Grass pasture Unpaved Unpaved Velocity (m/sec): Computed Flow Time (minutes): Total TOC (minutes): Subbasin {Ditch}.A1-1 Shallow Concentrated Flow Computations Subarea A Subarea B Subarea C Flow Length (m): Slope (%): Surface Type: Woodland Unpaved Unpaved Velocity (m/sec): Computed Flow Time (minutes): Channel Flow Computations - Subarea A Subarea B Subarea C Manning's Roughness: Flow Length (m): Channel Slope (%): Cross Section Area (m²): Wetted Perimeter (m): Velocity (m/sec): Computed Flow Time (minutes): Total TOC (minutes): 72.98
40 -- Subbasin {Ditch}.A1-10a -- Sheet Flow Computations Subarea A Subarea B Subarea C Manning's Roughness: Flow Length (m): Slope (%): yr, 24 hr Rainfall (mm): Velocity (m/sec): Computed Flow Time (minutes): Channel Flow Computations - Subarea A Subarea B Subarea C Manning's Roughness: Flow Length (m): Channel Slope (%): Cross Section Area (m²): Wetted Perimeter (m): Velocity (m/sec): Computed Flow Time (minutes): Total TOC (minutes): 8.50 Subbasin {Ditch}.A1-2 Shallow Concentrated Flow Computations Subarea A Subarea B Subarea C Flow Length (m): Slope (%): Surface Type: Woodland Grass pasture Unpaved
41 Velocity (m/sec): Computed Flow Time (minutes): Channel Flow Computations - Subarea A Subarea B Subarea C Manning's Roughness: Flow Length (m): Channel Slope (%): Cross Section Area (m²): Wetted Perimeter (m): Velocity (m/sec): Computed Flow Time (minutes): Total TOC (minutes): Subbasin {Ditch}.A1-3 Shallow Concentrated Flow Computations Subarea A Subarea B Subarea C Flow Length (m): Slope (%): Surface Type: Woodland Unpaved Unpaved Velocity (m/sec): Computed Flow Time (minutes): Channel Flow Computations - Subarea A Subarea B Subarea C Manning's Roughness: Flow Length (m): Channel Slope (%): Cross Section Area (m²): Wetted Perimeter (m): Velocity (m/sec):
42 Computed Flow Time (minutes): Total TOC (minutes): Subbasin {Ditch}.A1-4 Shallow Concentrated Flow Computations Subarea A Subarea B Subarea C Flow Length (m): Slope (%): Surface Type: Woodland Grass pasture Unpaved Velocity (m/sec): Computed Flow Time (minutes): Channel Flow Computations - Subarea A Subarea B Subarea C Manning's Roughness: Flow Length (m): Channel Slope (%): Cross Section Area (m²): Wetted Perimeter (m): Velocity (m/sec): Computed Flow Time (minutes): Total TOC (minutes): 18.19
43 Subbasin {Ditch}.A1-5 Shallow Concentrated Flow Computations Subarea A Subarea B Subarea C Flow Length (m): Slope (%): Surface Type: Woodland Unpaved Unpaved Velocity (m/sec): Computed Flow Time (minutes): Channel Flow Computations - Subarea A Subarea B Subarea C Manning's Roughness: Flow Length (m): Channel Slope (%): Cross Section Area (m²): Wetted Perimeter (m): Velocity (m/sec): Computed Flow Time (minutes): Total TOC (minutes): Subbasin {Ditch}.A1-6 Channel Flow Computations - Subarea A Subarea B Subarea C Manning's Roughness: Flow Length (m): Channel Slope (%): Cross Section Area (m²): Wetted Perimeter (m):
44 Velocity (m/sec): Computed Flow Time (minutes): Total TOC (minutes): Subbasin {Ditch}.A1-7 Shallow Concentrated Flow Computations Subarea A Subarea B Subarea C Flow Length (m): Slope (%): Surface Type: Grass pasture Unpaved Unpaved Velocity (m/sec): Computed Flow Time (minutes): Total TOC (minutes): Subbasin {Ditch}.A1-7a - Sheet Flow Computations Subarea A Subarea B Subarea C Manning's Roughness: Flow Length (m): Slope (%): yr, 24 hr Rainfall (mm): Velocity (m/sec):
45 Computed Flow Time (minutes): Channel Flow Computations - Subarea A Subarea B Subarea C Manning's Roughness: Flow Length (m): Channel Slope (%): Cross Section Area (m²): Wetted Perimeter (m): Velocity (m/sec): Computed Flow Time (minutes): Total TOC (minutes): Subbasin {Ditch}.A1-8 Shallow Concentrated Flow Computations Subarea A Subarea B Subarea C Flow Length (m): Slope (%): Surface Type: Grass pasture Unpaved Unpaved Velocity (m/sec): Computed Flow Time (minutes): Total TOC (minutes): Subbasin {Ditch}.A1-8a
46 - Sheet Flow Computations Subarea A Subarea B Subarea C Manning's Roughness: Flow Length (m): Slope (%): yr, 24 hr Rainfall (mm): Velocity (m/sec): Computed Flow Time (minutes): Channel Flow Computations - Subarea A Subarea B Subarea C Manning's Roughness: Flow Length (m): Channel Slope (%): Cross Section Area (m²): Wetted Perimeter (m): Velocity (m/sec): Computed Flow Time (minutes): Total TOC (minutes): Subbasin {Ditch}.A1-9 Shallow Concentrated Flow Computations Subarea A Subarea B Subarea C Flow Length (m): Slope (%): Surface Type: Grass pasture Unpaved Unpaved Velocity (m/sec): Computed Flow Time (minutes):
47 Total TOC (minutes): Subbasin {Ditch}.A1-9a - Sheet Flow Computations Subarea A Subarea B Subarea C Manning's Roughness: Flow Length (m): Slope (%): yr, 24 hr Rainfall (mm): Velocity (m/sec): Computed Flow Time (minutes): Channel Flow Computations - Subarea A Subarea B Subarea C Manning's Roughness: Flow Length (m): Channel Slope (%): Cross Section Area (m²): Wetted Perimeter (m): Velocity (m/sec): Computed Flow Time (minutes): Total TOC (minutes): Subbasin {Ditch}.A5-2
48 Shallow Concentrated Flow Computations Subarea A Subarea B Subarea C Flow Length (m): Slope (%): Surface Type: Grass pasture Unpaved Unpaved Velocity (m/sec): Computed Flow Time (minutes): Total TOC (minutes): Subbasin {Ditch}.B1-1 Shallow Concentrated Flow Computations Subarea A Subarea B Subarea C Flow Length (m): Slope (%): Surface Type: Woodland Unpaved Unpaved Velocity (m/sec): Computed Flow Time (minutes): Total TOC (minutes): Subbasin {Ditch}.B1-1a - Sheet Flow Computations
49 Subarea A Subarea B Subarea C Manning's Roughness: Flow Length (m): Slope (%): yr, 24 hr Rainfall (mm): Velocity (m/sec): Computed Flow Time (minutes): Total TOC (minutes): Subbasin {Ditch}.B1-2 Shallow Concentrated Flow Computations Subarea A Subarea B Subarea C Flow Length (m): Slope (%): Surface Type: Woodland Unpaved Unpaved Velocity (m/sec): Computed Flow Time (minutes): Total TOC (minutes): Subbasin {Ditch}.B1-2b - Sheet Flow Computations
50 Subarea A Subarea B Subarea C Manning's Roughness: Flow Length (m): Slope (%): yr, 24 hr Rainfall (mm): Velocity (m/sec): Computed Flow Time (minutes): Total TOC (minutes): 8.57 Subbasin {Ditch}.B1-3 Shallow Concentrated Flow Computations Subarea A Subarea B Subarea C Flow Length (m): Slope (%): Surface Type: Grass pasture Unpaved Unpaved Velocity (m/sec): Computed Flow Time (minutes): Total TOC (minutes): Subbasin {Ditch}.B1-3a - Sheet Flow Computations Subarea A Subarea B Subarea C
51 Manning's Roughness: Flow Length (m): Slope (%): yr, 24 hr Rainfall (mm): Velocity (m/sec): Computed Flow Time (minutes): Total TOC (minutes): 3.59 Subbasin {Ditch}.B1-4 Shallow Concentrated Flow Computations Subarea A Subarea B Subarea C Flow Length (m): Slope (%): Surface Type: Grass pasture Unpaved Unpaved Velocity (m/sec): Computed Flow Time (minutes): Total TOC (minutes): Subbasin {Ditch}.B Shallow Concentrated Flow Computations Subarea A Subarea B Subarea C Flow Length (m):
52 Slope (%): Surface Type: Grass pasture Unpaved Unpaved Velocity (m/sec): Computed Flow Time (minutes): Total TOC (minutes): Subbasin {Ditch}.C1-1 Shallow Concentrated Flow Computations Subarea A Subarea B Subarea C Flow Length (m): Slope (%): Surface Type: Woodland Unpaved Unpaved Velocity (m/sec): Computed Flow Time (minutes): Channel Flow Computations - Subarea A Subarea B Subarea C Manning's Roughness: Flow Length (m): Channel Slope (%): Cross Section Area (m²): Wetted Perimeter (m): Velocity (m/sec): Computed Flow Time (minutes): Total TOC (minutes): 61.21
53 Subbasin {Ditch}.Ca Sheet Flow Computations Subarea A Subarea B Subarea C Manning's Roughness: Flow Length (m): Slope (%): yr, 24 hr Rainfall (mm): Velocity (m/sec): Computed Flow Time (minutes): Total TOC (minutes): Subbasin A Shallow Concentrated Flow Computations Subarea A Subarea B Subarea C Flow Length (m): Slope (%): Surface Type: Woodland Unpaved Unpaved Velocity (m/sec): Computed Flow Time (minutes): Total TOC (minutes): 19.21
54 Subbasin Sub Sheet Flow Computations Subarea A Subarea B Subarea C Manning's Roughness: Flow Length (m): Slope (%): yr, 24 hr Rainfall (mm): Velocity (m/sec): Computed Flow Time (minutes): Total TOC (minutes): *********************** Subbasin Runoff Summary *********************** -- Subbasin Total Total Peak Weighted Time of ID Precip Runoff Runoff Curve Concentration mm mm cms Number days hh:mm:ss -- {Ditch}.A :54:10 {Ditch}.A :12:58 {Ditch}.A1-10a :08:30 {Ditch}.A :55:47 {Ditch}.A :13:07 {Ditch}.A :18:11 {Ditch}.A :33:23 {Ditch}.A :17:33 {Ditch}.A :12:49 {Ditch}.A1-7a :54:17 {Ditch}.A :20:21 {Ditch}.A1-8a :52:20 {Ditch}.A :19:52
55 {Ditch}.A1-9a :35:12 {Ditch}.A :06:52 {Ditch}.B :20:28 {Ditch}.B1-1a :18:01 {Ditch}.B :15:00 {Ditch}.B1-2b :08:34 {Ditch}.B :09:04 {Ditch}.B1-3a :05:00 {Ditch}.B :05:27 {Ditch}.B :54:55 {Ditch}.C :01:12 {Ditch}.Ca :05:20 A :19:12 Sub :52:22 -- ****************** Node Depth Summary ****************** Node Average Maximum Maximum Time of Max Total Total Retention ID Depth Depth HGL Occurrence Flooded Time Time Attained Attained Attained Volume Flooded m m m days hh:mm ha-mm minutes hh:mm:ss : :00: : :00: : :00: : :00: : :00: : :00: : :00: : :00: : :00: : :00: : :00: : :00: : :00: : :00: : :00: : :00: : :00:00
56 : :00: : :00: : :00: : :00: : :00:00 30a : :00: : :00: : :00: : :00: : :00:00 6a : :00:00 Jun : :00:00 Jun : :00:00 Jun : :00:00 Sta : :00:00 Sta : :00:00 Sta North : :00:00 Sta : :00:00 Sta : :00:00 Sta : :00:00 Sta : :00:00 Sta : :00:00 Sta : :00:00 Sta North : :00:00 Sta : :00:00 Sta North : :00:00 Sta : :00:00 Sta : :00:00 Sta : :00:00 Sta North : :00:00 FarmUnderpassOutfall : :00:00 OutfallSTA : :00:00 Out-Sta : :00:00 PumpStationOutfall : :00:00 ***************** Node Flow Summary ***************** Node Element Maximum Peak Time of Maximum Time of Peak ID Type Lateral Inflow Peak Inflow Flooding Flooding Inflow Occurrence Overflow Occurrence
57 cms cms days hh:mm cms days hh:mm JUNCTION : JUNCTION : JUNCTION : :23 4 JUNCTION : JUNCTION : JUNCTION : JUNCTION : JUNCTION : JUNCTION : JUNCTION : JUNCTION : JUNCTION : JUNCTION : JUNCTION : JUNCTION : JUNCTION : JUNCTION : JUNCTION : JUNCTION : JUNCTION : JUNCTION : JUNCTION : a JUNCTION : JUNCTION : JUNCTION : JUNCTION : JUNCTION : a JUNCTION : Jun-57 JUNCTION : Jun-60 JUNCTION : Jun-61 JUNCTION : Sta JUNCTION : Sta JUNCTION : Sta North JUNCTION : Sta JUNCTION : Sta JUNCTION : Sta JUNCTION : :29 Sta JUNCTION : :24 Sta JUNCTION : Sta JUNCTION : Sta North JUNCTION : :21 Sta JUNCTION :
58 Sta North JUNCTION : :26 Sta JUNCTION : :22 Sta JUNCTION : :12 Sta JUNCTION : Sta North JUNCTION : :22 FarmUnderpassOutfall OUTFALL : OutfallSTA107 OUTFALL : Out-Sta101 OUTFALL : PumpStationOutfall OUTFALL : *********************** Outfall Loading Summary *********************** Outfall Node ID Flow Average Peak Frequency Flow Inflow (%) cms cms FarmUnderpassOutfall OutfallSTA Out-Sta PumpStationOutfall System ***************** Link Flow Summary ***************** Link ID Element Time of Maximum Length Peak Flow Design Ratio of Ratio of Total Reported Type Peak Flow Velocity Factor during Flow Maximum Maximum Time Condition Occurrence Attained Analysis Capacity /Design Flow Surcharged days hh:mm m/sec cms cms Flow Depth minutes Chester Creek Tributary CHANNEL 0 08: Calculated Chester Creek US of Highway CHANNEL 0 08: Calculated
59 Chester Street Culvert CONDUIT 0 09: > CAPACITY Cross Sta CONDUIT 0 08: Calculated Cross Sta CONDUIT 0 08: Calculated Cross CONDUIT 0 08: Calculated Cross CONDUIT 0 08: Calculated Cross CONDUIT 0 08: Calculated Cross CONDUIT 0 08: Calculated Cross CONDUIT 0 08: Calculated Cross CONDUIT 0 09: SURCHARGED Culvert across Mclean Street CONDUIT 0 08: Calculated Culvert from Sta to Sta CONDUIT 0 08: Calculated Ex. Underpass_Bridge Sta 124 CHANNEL 0 08: FLOODED Farm underpass to south ditch CHANNEL 0 10: Calculated FarmCrossingUnderPass@Sta CONDUIT 0 10: > CAPACITY L200 to Sta 107 CHANNEL 0 08: Calculated L300 line to Sta 124 (south) CHANNEL 0 10: Calculated Link-66 CHANNEL 0 08: Calculated Link-68 CONDUIT 0 15: Calculated Link-69 CHANNEL 0 08: FLOODED Link-70 CHANNEL 0 10: FLOODED Link-71 CHANNEL 0 10: Calculated Overflow to farm underpass CHANNEL 0 10: FLOODED
60 Pr. L200 CONDUIT 0 08: Calculated CONDUIT 0 08: SURCHARGED Pump Station to Fraser River CHANNEL 0 08: Calculated Pump Station to Sta (south) CHANNEL 0 10: Calculated Railway_underpass CONDUIT 0 15: Calculated Sta to Mclean Street CHANNEL 0 08: Calculated Sta to Sta DIRECT 0 08: Sta 107 to Sta 107 outfall CHANNEL 0 08: Calculated Sta to Sta CHANNEL 0 08: Calculated Sta 10740to Sta 107 CHANNEL 0 08: Calculated Sta to Sta 107 CHANNEL 0 08: Calculated Sta to DS pump station CHANNEL 0 08: Calculated Sta to Tributaries CHANNEL 0 08: Calculated Sta 114 to L300 line (south) CHANNEL 0 08: Calculated Sta to Chester Street CHANNEL 0 09: Calculated Sta 119 to Chester Street CHANNEL 0 09: FLOODED Sta 119 to Sta 124 CHANNEL 0 09: FLOODED Sta 124 (South) CHANNEL 0 10: Calculated Sta 124 (south) Overflow pond CHANNEL 0 10: Calculated Sta to Sta CHANNEL 0 08: FLOODED Sta100+90toSta CHANNEL 0 08: Calculated Sta101+35toSta CHANNEL 0 08: Calculated Sta to Sta CHANNEL 0 08:
61 Calculated Sta to L200 CHANNEL 0 08: Calculated Start of Chester Creek CHANNEL 0 08: Calculated Pump-02 PUMP 0 09: ******************************** Highest Flow Instability Indexes ******************************** Link Cross (70) Link Sta to DS pump station (70) Link Cross Sta (61) Link Link-68 (39) Link Railway_underpass (37) WARNING 107 : Initial water surface elevation defined for Junction Jun-61 is below junction invert elevation. Assumed initial water surface elevation equal to invert elevation. WARNING 116 : Conduit inlet invert elevation defined for Conduit Farm underpass to south ditch is below upstream node invert elevation. Assumed conduit inlet invert elevation equal to upstream node invert elevation. WARNING 117 : Conduit outlet invert elevation defined for Conduit Pump Station to Sta (south) is below downstream node invert elevation. Assumed conduit outlet invert elevation equal to downstream node invert elevation. WARNING 004 : Minimum elevation drop used for Conduit Sta to Sta WARNING 004 : Minimum elevation drop used for Conduit Sta 124 (south) Overflow pond. WARNING 002 : Max/rim elevation (depth) increased to account for connecting conduit height dimensions for Node 3. WARNING 002 : Max/rim elevation (depth) increased to account for connecting conduit height dimensions for Node 4. WARNING 002 : Max/rim elevation (depth) increased to account for connecting conduit height dimensions for Node 5. WARNING 002 : Max/rim elevation (depth) increased to account for connecting conduit height dimensions for Node 8. WARNING 002 : Max/rim elevation (depth) increased to account for connecting conduit height dimensions for Node 9. WARNING 002 : Max/rim elevation (depth) increased to account for connecting conduit height dimensions for Node 10. WARNING 002 : Max/rim elevation (depth) increased to account for connecting conduit height dimensions for Node 15. WARNING 002 : Max/rim elevation (depth) increased to account for connecting conduit height dimensions for Node 19.
62 WARNING 002 : Max/rim elevation (depth) increased to account for connecting conduit height dimensions for Node 20. WARNING 002 : Max/rim elevation (depth) increased to account for connecting conduit height dimensions for Node 21. WARNING 002 : Max/rim elevation (depth) increased to account for connecting conduit height dimensions for Node 32. WARNING 002 : Max/rim elevation (depth) increased to account for connecting conduit height dimensions for Node 33. WARNING 002 : Max/rim elevation (depth) increased to account for connecting conduit height dimensions for Node 35. WARNING 002 : Max/rim elevation (depth) increased to account for connecting conduit height dimensions for Node Jun-61. WARNING 002 : Max/rim elevation (depth) increased to account for connecting conduit height dimensions for Node Sta WARNING 002 : Max/rim elevation (depth) increased to account for connecting conduit height dimensions for Node Sta WARNING 002 : Max/rim elevation (depth) increased to account for connecting conduit height dimensions for Node Sta WARNING 002 : Max/rim elevation (depth) increased to account for connecting conduit height dimensions for Node Sta WARNING 002 : Max/rim elevation (depth) increased to account for connecting conduit height dimensions for Node Sta WARNING 002 : Max/rim elevation (depth) increased to account for connecting conduit height dimensions for Node Sta WARNING 002 : Max/rim elevation (depth) increased to account for connecting conduit height dimensions for Node Sta North. WARNING 002 : Max/rim elevation (depth) increased to account for connecting conduit height dimensions for Node Sta WARNING 002 : Max/rim elevation (depth) increased to account for connecting conduit height dimensions for Node Sta North. WARNING 002 : Max/rim elevation (depth) increased to account for connecting conduit height dimensions for Node Sta WARNING 002 : Max/rim elevation (depth) increased to account for connecting conduit height dimensions for Node Sta WARNING 002 : Max/rim elevation (depth) increased to account for connecting conduit height dimensions for Node Sta North. Analysis began on: Fri Nov 10 10:17: Analysis ended on: Fri Nov 10 10:18: Total elapsed time: 00:00:10
63 APPENDIX D MODEL RESULTS
64 SCENARIO 1 Element Length Inlet Outlet Total Average Pipe Pipe Pipe Manning's Entrance Exit/Bend Additional Initial Peak Time of Max Travel Design Max Flow / Max Total Max Reported ID Invert Invert Drop Slope Shape Diameter Width Roughness Losses Losses Losses Flow Flow Peak Flow Time Flow Design Flow Flow Depth / Time Flow Condition Elevation Elevation or Height Flow Velocity Capacity Ratio Total Depth Surcharged Depth Occurrence Ratio (m) (m) (m) (m) (%) (mm) (mm) (cms) (cms) (days hh:mm) (m/sec) (min) (cms) (min) (m) Chester Street Culvert CIRCULAR : > CAPACITY Cross Sta CIRCULAR : Calculated Cross CIRCULAR : Calculated Cross CIRCULAR : Calculated Cross CIRCULAR : Calculated Cross CIRCULAR : SURCHARGED Cross CIRCULAR : SURCHARGED Culvert from Sta to Sta CIRCULAR : Calculated FarmCrossingUnderPass@Sta CIRCULAR : > CAPACITY Pr. L CIRCULAR : Calculated CIRCULAR : SURCHARGED Railway_underpass Horizontal Ellipse : Calculated
65 Element Length Inlet Outlet Total Average Channel Channel Channel Left Channel Right Entrance Exit/Bend Additional Lengthening Peak Time of Max Travel Design Max Flow / Max Total Max Reported ID Invert Invert Drop Slope Type Height Width Overbank Manning's Overbank Losses Losses Losses Factor Flow Peak Flow Time Flow Design Flow Flow Depth / Time Flow Condition Elevation Elevation Manning's Roughness Manning's Flow Velocity Capacity Ratio Total Depth Surcharged Depth Roughness Roughness Occurrence Ratio (m) (m) (m) (m) (%) (m) (m) (cms) (days hh:mm) (m/sec) (min) (cms) (min) (m) Chester Creek Tributary Trapezoidal : Calculated Chester Creek US of Highway Trapezoidal : Calculated Ex. Underpass_Bridge Sta Rectangular : FLOODED Farm underpass to south ditch Trapezoidal : Calculated L200 to Sta Trapezoidal : Calculated L300 line to Sta 124 (south) Trapezoidal : Calculated Link Rectangular : Calculated Link Trapezoidal : FLOODED Link Trapezoidal : FLOODED Link Trapezoidal : Calculated Overflow to farm underpass Trapezoidal : FLOODED Pump Station to Fraser River Rectangular : Calculated Pump Station to Sta (south) Trapezoidal : Calculated Sta to Mclean Street Trapezoidal : Calculated Sta 107 to Sta 107 outfall Trapezoidal : Calculated Sta to Sta Trapezoidal : Calculated Sta 10740to Sta Trapezoidal : Calculated Sta to Sta Trapezoidal : Calculated Sta to DS pump station Trapezoidal : Calculated Sta to Tributaries Trapezoidal : Calculated Sta 114 to L300 line (south) Trapezoidal : Calculated Sta to Chester Street Trapezoidal : Calculated Sta 119 to Chester Street Trapezoidal : FLOODED Sta 119 to Sta Trapezoidal : FLOODED Sta 124 (South) Rectangular : Calculated Sta 124 (south) Overflow pond Trapezoidal : Calculated Sta to Sta Trapezoidal : FLOODED Sta100+90toSta Trapezoidal : Calculated Sta101+35toSta Trapezoidal : Calculated Sta to Sta Trapezoidal : Calculated Sta to L Trapezoidal : Calculated Start of Chester Creek Trapezoidal : Calculated
66 SN Element X Coordinate Y Coordinate Description Invert Boundary Flap Fixed Peak Peak Maximum Maximum ID Elevation Type Gate Water Inflow Lateral HGL Depth HGL Elevation Elevation Inflow Attained Attained (m) (m) (cms) (cms) (m) (m) 1 FarmUnderpassOutfall NORMAL NO OutfallSTA NORMAL NO Out-Sta NORMAL NO PumpStationOutfall FIXED NO
67 SN Element Invert Ground/Rim Ground/Rim Initial Initial Surcharge Surcharge Ponded Minimum Peak Peak Maximum Maximum Maximum Minimum Average Average Time of Time of Total Total ID Elevation (Max) (Max) Water Water Elevation Depth Area Pipe Cover Inflow Lateral HGL HGL Surcharge Freeboard HGL HGL Maximum Peak Flooded Time Elevation Offset Elevation Depth Inflow Elevation Depth Depth Attained Elevation Depth HGL Flooding Volume Flooded Attained Attained Attained Attained Attained Occurrence Occurrence (m) (m) (m) (m) (m) (m) (m) (m²) (mm) (cms) (cms) (m) (m) (m) (m) (m) (m) (days hh:mm) (days hh:mm) (ha-mm) (minutes) : : : : : : : : : : : : : : : : : : : : : : : : : : : : : : : : : : : : : : : : : : : : a : : : : : : : : : : a : : : : : : : : Sta : : Sta : : Sta North : : Sta : : Sta : : Sta : : Sta : : Sta : : Sta : : Sta North : : Sta : : Sta North : : Sta : : Sta : : Sta : : Sta North : :
68 SN Element Description Area Drainage Weighted Rain Gage Total Total Peak Time ID Node ID Curve ID Precipitation Runoff Runoff of Number Concentration (ha) (mm) (mm) (cms) (days hh:mm:ss) 1 {Ditch}.A Sta Rain Gage :54:10 2 {Ditch}.A1-1 UpperChesterCreekCatchment Rain Gage :12:58 3 {Ditch}.A1-10a Rain Gage :08:30 4 {Ditch}.A1-2 UpperChesterCreekCatchment Rain Gage :55:47 5 {Ditch}.A Rain Gage :13:07 6 {Ditch}.A Rain Gage :18:11 7 {Ditch}.A Sta Rain Gage :33:23 8 {Ditch}.A Sta Rain Gage :17:33 9 {Ditch}.A Sta North Rain Gage :12:49 10 {Ditch}.A1-7a 3.02 Sta North Rain Gage :54:17 11 {Ditch}.A Sta Rain Gage :20:21 12 {Ditch}.A1-8a 1.71 Sta Rain Gage :52:20 13 {Ditch}.A Sta North Rain Gage :19:52 14 {Ditch}.A1-9a 1.08 Sta North Rain Gage :35:12 15 {Ditch}.A Sta Rain Gage :06:52 16 {Ditch}.B Rain Gage :20:28 17 {Ditch}.B1-1a Rain Gage :18:01 18 {Ditch}.B Rain Gage :15:00 19 {Ditch}.B1-2b Rain Gage :08:34 20 {Ditch}.B Rain Gage :09:04 21 {Ditch}.B1-3a Rain Gage :05:00 22 {Ditch}.B Rain Gage :05:27 23 {Ditch}.B Rain Gage :54:55 24 {Ditch}.C Rain Gage :01:12 25 {Ditch}.Ca Rain Gage :05:20 26 A Rain Gage :19:12 27 Sub Sta Rain Gage :52:22
69 SCENARIO 2 Element Length Inlet Outlet Total Average Pipe Pipe Pipe Manning's Entrance Exit/Bend Additional Initial Flap Lengthening Peak Design Max Total Max Reported ID Invert Invert Drop Slope Shape Diameter Width Roughness Losses Losses Losses Flow Gate Factor Flow Flow Flow Depth / Time Flow Condition Elevation Elevation or Height Capacity Total Depth Surcharged Depth Ratio (m) (m) (m) (m) (%) (mm) (mm) (cms) (cms) (cms) (min) (m) Chester Street Culvert CIRCULAR NO > CAPACITY Cross Sta CIRCULAR NO Calculated Cross CIRCULAR NO Calculated Cross CIRCULAR NO Calculated Cross CIRCULAR NO Calculated Cross CIRCULAR NO Calculated Cross CIRCULAR NO Calculated Culvert from Sta to Sta CIRCULAR NO Calculated FarmCrossingUnderPass@Sta CIRCULAR NO > CAPACITY Pr. L CIRCULAR NO Calculated CIRCULAR NO SURCHARGED
70 Element Length Inlet Outlet Total Average Channel Channel Channel Left Channel Right Entrance Exit/Bend Additional Initial Flap Lengthening Peak Time of Max Travel Design Max Flow / Max Total Max Reported ID Invert Invert Drop Slope Type Height Width Overbank Manning's Overbank Losses Losses Losses Flow Gate Factor Flow Peak Flow Time Flow Design Flow Flow Depth / Time Flow Condition Elevation Elevation Manning's Roughness Manning's Flow Velocity Capacity Ratio Total Depth Surcharged Depth Roughness Roughness Occurrence Ratio (m) (m) (m) (m) (%) (m) (m) (cms) (cms) (days hh:mm) (m/sec) (min) (cms) (min) (m) Chester Creek Tributary Trapezoidal NO : Calculated Chester Creek US of Highway Trapezoidal NO : Calculated Ex. Underpass_Bridge Sta Rectangular NO : FLOODED Farm underpass to south ditch Trapezoidal NO : Calculated Floodgate Rectangular NO : > CAPACITY L200 to Sta Trapezoidal NO : Calculated L300 line to Sta 124 (south) Trapezoidal NO : Calculated Link Rectangular NO : Calculated Link Trapezoidal NO : FLOODED Link Trapezoidal NO : Calculated Link Trapezoidal NO : Calculated Overflow to farm underpass Trapezoidal NO : FLOODED Pump Station to Fraser River Rectangular NO : Calculated Pump Station to Sta (south) Trapezoidal NO : Calculated Sta to Mclean Street Trapezoidal NO : Calculated Sta 107 to Sta 107 outfall Trapezoidal NO : Calculated Sta to Sta Trapezoidal NO : Calculated Sta 10740to Sta Trapezoidal NO : Calculated Sta to Sta Trapezoidal NO : Calculated Sta to DS pump station Trapezoidal NO : Calculated Sta to Tributaries Trapezoidal NO : Calculated Sta 114 to L300 line (south) Trapezoidal NO : Calculated Sta to Chester Street Trapezoidal NO : Calculated Sta 119 to Chester Street Trapezoidal NO : FLOODED Sta 119 to Sta Trapezoidal NO : FLOODED Sta 124 (South) Rectangular NO : Calculated Sta 124 (south) Overflow pond Trapezoidal NO : Calculated Sta to Sta Trapezoidal NO : FLOODED Sta100+90toSta Trapezoidal NO : Calculated Sta101+35toSta Trapezoidal NO : Calculated Sta to Sta Trapezoidal NO : Calculated Sta to L Trapezoidal NO : Calculated Start of Chester Creek Trapezoidal NO : Calculated
71 SN Element Invert Boundary Flap Fixed Peak Peak Maximum Maximum ID Elevation Type Gate Water Inflow Lateral HGL Depth HGL Elevation Elevation Inflow Attained Attained (m) (m) (cms) (cms) (m) (m) 1 FarmUnderpassOutfall 2.83 NORMAL NO OutfallSTA NORMAL NO Out-Sta NORMAL NO PumpStationOutfall 2.00 FIXED NO
72 SN Invert Ground/Rim Ground/Rim Initial Initial Surcharge Surcharge Ponded Minimum Peak Peak Maximum Maximum Maximum Minimum Average Average Time of Time of Total Total Elevation (Max) (Max) Water Water Elevation Depth Area Pipe Cover Inflow Lateral HGL HGL Surcharge Freeboard HGL HGL Maximum Peak Flooded Time Elevation Offset Elevation Depth Inflow Elevation Depth Depth Attained Elevation Depth HGL Flooding Volume Flooded Attained Attained Attained Attained Attained Occurrence Occurrence (m) (m) (m) (m) (m) (m) (m) (m²) (mm) (cms) (cms) (m) (m) (m) (m) (m) (m) (days hh:mm) (days hh:mm) (ha-mm) (minutes) : : : : : : : : : : : : : : : : : : : : : : : : : : : : : : : : : : : : : : : : : : : : : : : : : : : : : : : : : : : : : : : : : : : : : : : : : : : : : : : : : : : : : : : : : : : : : :
73 SN Element Description Area Drainage Weighted Rain Gage Total Total Peak Time ID Node ID Curve ID Precipitation Runoff Runoff of Number Concentration (ha) (mm) (mm) (cms) (days hh:mm:ss) 1 {Ditch}.A Sta Rain Gage :54:10 2 {Ditch}.A1-1 UpperChesterCreekCatchment Rain Gage :12:58 3 {Ditch}.A1-10a Rain Gage :08:30 4 {Ditch}.A Rain Gage :20:28 5 {Ditch}.A1-2 UpperChesterCreekCatchment Rain Gage :55:47 6 {Ditch}.A Rain Gage :13:07 7 {Ditch}.A Rain Gage :18:11 8 {Ditch}.A Sta Rain Gage :33:23 9 {Ditch}.A Sta Rain Gage :17:33 10 {Ditch}.A Sta North Rain Gage :12:49 11 {Ditch}.A1-7a 3.02 Sta North Rain Gage :54:17 12 {Ditch}.A Sta Rain Gage :20:21 13 {Ditch}.A1-8a 1.71 Sta Rain Gage :52:20 14 {Ditch}.A Sta North Rain Gage :19:52 15 {Ditch}.A1-9a 1.08 Sta North Rain Gage :35:12 16 {Ditch}.A Sta Rain Gage :06:52 17 {Ditch}.B Rain Gage :15:00 18 {Ditch}.B1-1a Rain Gage :18:01 19 {Ditch}.B Rain Gage :09:04 20 {Ditch}.B1-2b Rain Gage :08:34 21 {Ditch}.B Rain Gage :05:27 22 {Ditch}.B1-3a Rain Gage :05:00 23 {Ditch}.B Rain Gage :54:55 24 {Ditch}.C Rain Gage :01:12 25 {Ditch}.Ca Rain Gage :05:20 26 A * :19:12 27 Sub Sta Rain Gage :52:22
74 APPENDIX E REVIEW OF Q200 DESIGN FLOWS
75
76
77 APPENDIX F AVERAGE TWO-YEAR DESIGN VELOCITIES

78 Table 1: Velocity summary table for culverts greater than 24.4 m in length
******************* Project Description ******************* File Name... NAAF Stormwater Improvement Project 11_21_2014.SPF
 Autodesk Storm and Sanitary Analysis 2014 - Version 8.1.62 (Build 1) ----------------- *** Project Description *** File Name... NAAF Stormwater Improvement Project 11_21_2014.SPF Analysis Options Flow
Section 4: Model Development and Application
 Section 4: Model Development and Application The hydrologic model for the Wissahickon Act 167 study was built using GIS layers of land use, hydrologic soil groups, terrain and orthophotography. Within
STREUVER FIDELCO CAPPELLI, LLC YONKERS DOWNTOWN DEVELOPMENT PHASE 1. DRAFT ENVIRONMENTAL IMPACT STATEMENT For: PALISADES POINT
 STREUVER FIDELCO CAPPELLI, LLC YONKERS DOWNTOWN DEVELOPMENT PHASE 1 DRAFT ENVIRONMENTAL IMPACT STATEMENT For: PALISADES POINT Prepared by: PAULUS, SOKOLOWSKI & SARTOR STORMWATER MANAGEMENT 1. Methodology
LOCATED IN INDIAN RIVER COUNTY PREPARED FOR S.J.R.W.M.D. AND F.W.C.D. DECEMBER, 2003 Updated 2007 Updated May 2014 PREPARED BY
 FELLSMERE WATER CONTROL DISTRICT EAST MASTER DRAINAGE PLAN AND STORMWATER HYDROLOGIC ANALYSIS OF THE GRAVITY DRAINAGE SYSTEM LOCATED BETWEEN THE EAST BOUNDARY, LATERAL U, THE MAIN CANAL, AND DITCH 24 LOCATED
INFLOW DESIGN FLOOD CONTROL SYSTEM PLAN 40 C.F.R. PART PLANT YATES ASH POND 2 (AP-2) GEORGIA POWER COMPANY
 GEORGIA POWER COMPANY") INFLOW DESIGN FLOOD CONTROL SYSTEM PLAN 40 C.F.R. PART 257.82 PLANT YATES ASH POND 2 (AP-2) GEORGIA POWER COMPANY EPA s Disposal of Coal Combustion Residuals from Electric Utilities Final Rule (40 C.F.R.
INFLOW DESIGN FLOOD CONTROL SYSTEM PLAN 40 C.F.R. PART 257.82 PLANT YATES ASH POND 2 (AP-2) GEORGIA POWER COMPANY EPA s Disposal of Coal Combustion Residuals from Electric Utilities Final Rule (40 C.F.R.
Project Description. Project Options. End Analysis On... Apr 26, :00:00. Rainfall Details
 Project Description File Name... 323 - Att Pond 3 East PIPES ONLY.SPF Project Options Flow Units... Elevation Type... Hydrology Method... EPA SWMM Infiltration Method... Link Routing Method... Enable Overflow
CITY OF CAPE CORAL STORMWATER MASTER PLAN PHASE II - PART 1 BASINS 4, 10, & 14 SUB-BASIN DRAINAGE IMPROVEMENTS HYDRAULIC ANALYSIS SUMMARY
 CITY OF CAPE CORAL STORMWATER MASTER PLAN PHASE II - PART 1 BASINS 4, 10, & 14 SUB-BASIN DRAINAGE IMPROVEMENTS HYDRAULIC ANALYSIS SUMMARY Cape Coral, FL Prepared for: The City of Cape Coral Public Works
City of Thornton Attn: Tim Semones Development Engineeering 9500 Civic Center Dr. Thornton, CO 80229
 Development Engineering Land Surveying Construction Administration District Services October 20, 2017 City of Thornton Attn: Tim Semones Development Engineeering 9500 Civic Center Dr. Thornton, CO 80229
APPENDIX B DRAINAGE REPORT
 APPENDIX B DRAINAGE REPORT B-1 South Lamar Blvd. Transportation Corridor Study Drainage Report Prepared for: City of Austin and HDR, Inc. Prepared by: and Services, Inc. Final 07-09-2015 Michael C. Meriwether,
Chapter 5 CALIBRATION AND VERIFICATION
 Chapter 5 CALIBRATION AND VERIFICATION This chapter contains the calibration procedure and data used for the LSC existing conditions model. The goal of the calibration effort was to develop a hydraulic
Drainage Analysis. Appendix F
 Drainage Analysis Appendix F Golden View Drive Elizabeth Street LMORE CREEK Ricky Road Rabbit Creek Road LITTLE RABBIT CREEK East 156th Avenue MOA Project #10-026 Golden View Drive Intersection
Continuing Education Course #101 Drainage Design with WinTR-55
 1 of 5 Continuing Education Course #101 Drainage Design with WinTR-55 1. WinTR-55 uses the Kinematic Wave method for calculating storm runoff rates and volumes. 2. According to the Velocity Method, the
Stormwater Capacity Analysis for Westover Branch Watershed
 Stormwater Capacity Analysis for Westover Branch Watershed Pimmit Run Little Pimmit Run, Mainstem Stohman's Run Gulf Branch Pimmit Run Tributary Little Pimmit Run, W. Branch Little Pimmit Run, E. Branch
B805 TEMPORARY EROSION AND SEDIMENT CONTROL MEASURES - OPSS 805
 B805 MEASURES - OPSS 805 805.1 GENERAL Construction activities frequently remove protective cover and expose soil to accelerated rates of erosion. Sediments generated thereby can be conveyed via runoff
Hydrology and Hydraulics Design Report. Background Summary
 To: National Park Services Montezuma Castle National Monument Richard Goepfrich, Facility Manager From: Multicultural Technical Engineers Date: Tuesday - February 13, 2018 Subject: 30% Hydrology and Hydraulics
ARTICLE 5 (PART 2) DETENTION VOLUME EXAMPLE PROBLEMS
 DETENTION VOLUME EXAMPLE PROBLEMS") ARTICLE 5 (PART 2) DETENTION VOLUME EXAMPLE PROBLEMS Example 5.7 Simple (Detention Nomograph) Example 5.8 Offsite and Unrestricted Areas (HEC-HMS) Example 5.9 Ponds in Series w/ Tailwater (HEC-HMS) Example
ARTICLE 5 (PART 2) DETENTION VOLUME EXAMPLE PROBLEMS Example 5.7 Simple (Detention Nomograph) Example 5.8 Offsite and Unrestricted Areas (HEC-HMS) Example 5.9 Ponds in Series w/ Tailwater (HEC-HMS) Example
Stormwater Guidelines and Case Studies. CAHILL ASSOCIATES Environmental Consultants West Chester, PA (610)
") Stormwater Guidelines and Case Studies CAHILL ASSOCIATES Environmental Consultants West Chester, PA (610) 696-4150 www.thcahill.com Goals and Challenges for Manual State Stormwater Policy More Widespread
Stormwater Guidelines and Case Studies CAHILL ASSOCIATES Environmental Consultants West Chester, PA (610) 696-4150 www.thcahill.com Goals and Challenges for Manual State Stormwater Policy More Widespread
Stage Discharge Tabulation for Only Orifice Flow
 Stage Discharge Tabulation for Only Orifice Flow DEPTH STAGE DISCHARGE (meters) (feet) (meters) (feet) (m 3 /s) (ft 3 /s) 0 0.20 0.40 0.60 0.80 1.00 1.20 1.40 1.60 1.80 2.00 0.7 1.3 2.0 2.6 3.3 3.9 4.6
Submitted to: St. Johns River Power Park New Berlin Road Jacksonville, FL 32226
 RUN-ON/RUN-OFF CONTROL SYSTEM PLAN RUN-ON AND RUN-OFF CONTROL SYSTEM PLAN St. Johns River Power Park Byproduct Storage Area B Phase I Development Submitted to: St. Johns River Power Park 11201 New Berlin
BRANDON LAKES AVENUE PRE AND POST CONDITIONS DRAINAGE REPORT
 BRANDON LAKES AVENUE PRE AND POST CONDITIONS DRAINAGE REPORT Hillsborough County Public Works County Center, 22nd Floor 601 E. Kennedy Blvd. Tampa, FL 33602 BRANDON LAKES AVENUE DRAINAGE IMPROVEMENTS Capital
FHWA - HIGHWAY HYDROLOGY
 The unit peak discharge is computed with Equation 5.6 by interpolating c 0, c, and c Table 5.5 using a type II distribution. The peak discharge is also calculated as follows. from Variable SI Unit U Unit.5444
EROSION CONTROL NARRATIVE
 EROSION CONTROL NARRATIVE Erosion and sediment control has been designed for the Willow Bend Phase I Subdivision according to UDFCD and the City of Thornton criteria, in order to minimize erosion and sediment
9. PROBABLE MAXIMUM PRECIPITATION AND PROBABLE MAXIMUM FLOOD
 9. PROBABLE MAXIMUM PRECIPITATION AND PROBABLE MAXIMUM FLOOD 9.1. Introduction Due to the size of Watana Dam and the economic importance of the Project to the Railbelt, the Probable Maximum Flood (PMF)
STORMWATER REPORT FRITO LAY SUBDIVISION NO. 3
 STORMWATER REPORT FRITO LAY SUBDIVISION NO. 3 May 2018 STORMWATER REPORT I. Subdivision Data a. The parcel is adjacent to the existing Frito Lay property in Topeka; and the subject plat application encompasses
September 6, City of Thornton 9500 Civic Center Drive Thornton, CO (303) RE: Maverik Thornton, CO - Drainage Report
 RE: Maverik Thornton, CO - Drainage Report") September 6, 2016 City of Thornton 9500 Civic Center Drive Thornton, CO 80229 (303) 538-7295 RE: Maverik Thornton, CO - Drainage Report As per your request, we are submitting to you the drainage report
September 6, 2016 City of Thornton 9500 Civic Center Drive Thornton, CO 80229 (303) 538-7295 RE: Maverik Thornton, CO - Drainage Report As per your request, we are submitting to you the drainage report
PRELIMINARY CULVERT ANALYSIS REPORT FOR CULVERT NO. 008-C OREGON AVENUE OVER PINEHURST CREEK
 PRELIMINARY CULVERT ANALYSIS REPORT FOR CULVERT NO. 008-C OREGON AVENUE OVER PINEHURST CREEK Prepared for The District of Columbia Department of Transportation Washington, D.C. Prepared by Parsons Transportation
Appendix E Guidance for Shallow Flooding Analyses and Mapping
 Appendix E Guidance for Shallow Flooding Analyses and Mapping E.1 Introduction Different types of shallow flooding commonly occur throughout the United States. Types of flows that result in shallow flooding
D.M. Wills Associates Limited PARTNERS IN ENGINEERING. Stormwater Management Report. City of Peterborough
 Stormwater Management Report City of Peterborough P-20-12 Parkway Corridor Class Environmental Assessment Jackson Park Parkhill Road West to Chemong Road D.M. Wills Project No. 12-5061 D.M. Wills Associates
PENNSYLVANIA DEPARTMENT OF TRANSPORTATION ENGINEERING DISTRICT 3-0
 PENNSYLVANIA DEPARTMENT OF TRANSPORTATION ENGINEERING DISTRICT 3-0 LYCOMING COUNTY S.R.15, SECTION C41 FINAL HYDROLOGIC AND HYDRAULIC REPORT STEAM VALLEY RUN STREAM RELOCATION DATE: June, 2006 REVISED:
Pressure Head: Pressure head is the height of a column of water that would exert a unit pressure equal to the pressure of the water.
 Design Manual Chapter - Stormwater D - Storm Sewer Design D- Storm Sewer Sizing A. Introduction The purpose of this section is to outline the basic hydraulic principles in order to determine the storm
Hydrology Study Report
 Hafeez Consulting www.hafeezconsulting.com Civil/ Structural Engineering, Design & Construction 1451 S. Hacienda St. Anaheim CA 92804 (714) 225-4565 Fax (714)917-2977 engineer@hafeezconsulting.com Hydrology
Attachment B to Technical Memorandum No.2. Operations Plan of Ross Valley Detention Basins
 Attachment B to Technical Memorandum No.2 Operations Plan of Ross Valley Detention Basins Operations Plan of Ross Valley Detention Basins Stetson Engineers Inc. January 26, 2011 1.0 Introduction Achieving
Chapter 10 - Sacramento Method Examples
 Chapter 10 Sacramento Method Examples Introduction Overview This chapter presents two example problems to demonstrate the use of the Sacramento method. These example problems use the SACPRE and HEC-1 computer
WELCOME Lake Wabukayne OPEN HOUSE
 WELCOME Lake Wabukayne Sediment Removal Project OPEN HOUSE We are here to: Update you, the community, on recent developments and activities at Lake Wabukayne Present the preferred alternative and receive
Hydrologic Forecast Centre. Manitoba Infrastructure. Winnipeg, Manitoba FEBRUARY FLOOD OUTLOOK REPORT FOR MANITOBA.
 Page 1 of 20 Hydrologic Forecast Centre Manitoba Infrastructure Winnipeg, Manitoba FEBRUARY FLOOD OUTLOOK REPORT FOR MANITOBA February 28, 2019 Overview The February Outlook Report prepared by the Hydrologic
SERVICING BRIEF & STORMWATER MANAGEMENT REPORT Colonial Road Sarsfield (Ottawa), Ontario. Report No June 15, 2017
, Ontario. Report No June 15, 2017") SERVICING BRIEF & STORMWATER MANAGEMENT REPORT 2980 Colonial Road Sarsfield (Ottawa), Ontario Report No. 16033 June 15, 2017 D. B. G R A Y E N G I N E E R I N G I N C. Stormwater Management - Grading &
SERVICING BRIEF & STORMWATER MANAGEMENT REPORT 2980 Colonial Road Sarsfield (Ottawa), Ontario Report No. 16033 June 15, 2017 D. B. G R A Y E N G I N E E R I N G I N C. Stormwater Management - Grading &
Preliminary Hydraulic Report
 Tarrant County, Texas Preliminary Hydraulic Report Prepared for: Texas Department of Transportation Fort Worth District Prepared by: AECOM Corporation Scott C. Williams, P.E. No. 101334, Date 2009 This
APPENDIX G APPENDIX G SEDIMENT CONTAINMENT SYSTEM DESIGN RATIONALE
 APPENDIX G SEDIMENT CONTAINMENT SYSTEM DESIGN RATIONALE March 18, 2003 This page left blank intentionally. March 18, 2003 G-2 FIGURES Page # Figure G.1 Estimated Runoff from Precipitation Over Different
PRELIMINARY DRAFT FOR DISCUSSION PURPOSES
 Memorandum To: David Thompson From: John Haapala CC: Dan McDonald Bob Montgomery Date: February 24, 2003 File #: 1003551 Re: Lake Wenatchee Historic Water Levels, Operation Model, and Flood Operation This
Determination of Urban Runoff Using ILLUDAS and GIS
 Texas A&M University Department of Civil Engineering Instructor: Dr. Francisco Olivera CVEN689 Applications of GIS to Civil Engineering Determination of Urban Runoff Using ILLUDAS and GIS Tae Jin Kim 03.
ENGINEERING HYDROLOGY
 ENGINEERING HYDROLOGY Prof. Rajesh Bhagat Asst. Professor Civil Engineering Department Yeshwantrao Chavan College Of Engineering Nagpur B. E. (Civil Engg.) M. Tech. (Enviro. Engg.) GCOE, Amravati VNIT,
INTRODUCTION TO HEC-HMS
 INTRODUCTION TO HEC-HMS Hydrologic Engineering Center- Hydrologic Modeling System US Army Corps of Engineers Hydrologic Engineering Center HEC-HMS Uses Schematics Enter properties: watershed, rivers (reaches),
INTRODUCTION TO HYDROLOGIC MODELING USING HEC-HMS
 INTRODUCTION TO HYDROLOGIC MODELING USING HEC-HMS By Thomas T. Burke, Jr., PhD, PE Luke J. Sherry, PE, CFM Christopher B. Burke Engineering, Ltd. October 8, 2014 1 SEMINAR OUTLINE Overview of hydrologic
Bushkill Creek 3 rd Street Dam Removal Analysis
 Bushkill Creek 3 rd Street Dam Removal Analysis HEC HMS Runoff and Routing Model Stephen Beavan, Melanie DeFazio, David Gold, Peter Mara and Dan Moran CE 421: Hydrology Fall 2010 December 15, 2010 Contents
Coal Combustion Residuals Unit Inflow Design Flood Control System Plan
 Coal Combustion Residuals Unit Inflow Design Flood Control System Plan Virginia Electric and Power Company Chesterfield Power Station Upper (East) Pond Chesterfield County, Virginia GAI Project Number:
Fish Passage at Road Crossings
 Fish Passage at Road Crossings 1 Crossing Design Workshop Outline 1:00 to 2:00 Intro, Design Overview, Channel Width 2:00 to 2:15 Break 2:15 to 3:15 No-Slope, Stream Simulation Design 3:15 to 3:30 Break
6.4 Sensitivity Tests
 6.4 Sensitivity Tests 6.4.1 Sensitivity of Floodplain Inundation to Width of Dry Culvert The preliminary design for the Expressway based on consideration of possible future climate effects to 2090 assumed
12 SWAT USER S MANUAL, VERSION 98.1
 12 SWAT USER S MANUAL, VERSION 98.1 CANOPY STORAGE. Canopy storage is the water intercepted by vegetative surfaces (the canopy) where it is held and made available for evaporation. When using the curve
Results of Intensity-Duration- Frequency Analysis for Precipitation and Runoff under Changing Climate
 Results of Intensity-Duration- Frequency Analysis for Precipitation and Runoff under Changing Climate Supporting Casco Bay Region Climate Change Adaptation RRAP Eugene Yan, Alissa Jared, Julia Pierce,
2017 Fall Conditions Report
 2017 Fall Conditions Report Prepared by: Hydrologic Forecast Centre Date: November 15, 2017 Table of Contents TABLE OF FIGURES... ii EXECUTIVE SUMMARY... 1 BACKGROUND... 4 SUMMER AND FALL PRECIPITATION...
The effectiveness of the Natural Resource Conservation Service (NRCS) and Huff rainfall distribution methods for use in detention basin design
 and Huff rainfall distribution methods for use in detention basin design") Scholars' Mine Masters Theses Student Theses and Dissertations Spring 2010 The effectiveness of the Natural Resource Conservation Service (NRCS) and Huff rainfall distribution methods for use in detention
Scholars' Mine Masters Theses Student Theses and Dissertations Spring 2010 The effectiveness of the Natural Resource Conservation Service (NRCS) and Huff rainfall distribution methods for use in detention
Opportunities to Improve Ecological Functions of Floodplains and Reduce Flood Risk along Major Rivers in the Puget Sound Basin
 Opportunities to Improve Ecological Functions of Floodplains and Reduce Flood Risk along Major Rivers in the Puget Sound Basin Christopher Konrad, US Geological Survey Tim Beechie, NOAA Fisheries Managing
STORMWATER DESIGN CALCULATIONS
 STORMWATER DESIGN CALCULATIONS REF : C7011-2390 AT 19a-23 MEMORIAL AVENUE BLACKWALL FOR MR KERR Contents 1.0 Detention System Requirements 1.1 Storage-Area calcs. 1.2 Data Files for Pre & Post Developed
IJESRT INTERNATIONAL JOURNAL OF ENGINEERING SCIENCES & RESEARCH TECHNOLOGY
 IJESRT INTERNATIONAL JOURNAL OF ENGINEERING SCIENCES & RESEARCH TECHNOLOGY Use of Digital Elevation Model to compute Storm Water Drainage Network Manisha Desai *1, Dr. J. N. Patel 2 *1 Ph. D. Student of
DRAINAGE REPORT FOR THORNTON SELF STORAGE THORNTON, COLORADO
 DRAINAGE REPORT FOR THORNTON SELF STORAGE THORNTON, COLORADO Prepared by: Bowman Consulting 603 Park Point Dr. Suite 100 Golden, CO 80401 (303)-801-2900 June 29, 2015 Revised August 14, 2015 CERTIFICATE
2017 January Conditions Report Manitoba Hydrologic Forecasting and Coordination Branch Manitoba Infrastructure
 2017 January Conditions Report Manitoba Hydrologic Forecasting and Coordination Branch Manitoba Infrastructure 1/30/2017 Page 1 of 22 Hydrologic Forecast Centre Manitoba Infrastructure and Transportation
Conceptual Model of Stream Flow Processes for the Russian River Watershed. Chris Farrar
 Conceptual Model of Stream Flow Processes for the Russian River Watershed Chris Farrar Several features of creeks affect the interactions between surface and groundwater. This conceptual model uses the
Rucker Pond. Background
 Rucker Pond Background The Rucker Basin consists of two subbasins (East and West) that drain to a single area known as Rucker Pond. Both subbasins have the same hydraulic parameters, but have different
 Red River Flooding June 2015 Caddo and Bossier Parishes Presented by: Flood Technical Committee Where the Rain Falls Matters I-30 versus I-20 I-20 Backwater and Tributary Floods (Localized) 2016 Flood
Objectives: After completing this assignment, you should be able to:
 Data Analysis Assignment #1 Evaluating the effects of watershed land use on storm runoff Assignment due: 21 February 2013, 5 pm Objectives: After completing this assignment, you should be able to: 1) Calculate
The last three sections of the main body of this report consist of:
 Threatened and Endangered Species Geological Hazards Floodplains Cultural Resources Hazardous Materials A Cost Analysis section that provides comparative conceptual-level costs follows the Environmental
WATER MANAGEMENT REPORT FOR PAGE ESTATES
 WATER MANAGEMENT REPORT FOR PAGE ESTATES SLB Consulting of SW Florida, LLC PO Box 2826 Bonita Springs, FL. 34133 Phone: 239-948-9566 sandra@slbconsult.com C.O.A. # 25395 September 1, 2014 Sandra L. Bottcher
Basic Hydraulics June 2007
 Basic Hydraulics www.concrete-pipe.org June 2007 2007 Overview Open Channel Flow Manning Equation Basic Culvert Design Sanitary Sewer Design Flow, Velocity Stormwater Sewer Design Flow, Velocity 2 Open
STORMWATER MANAGEMENT COMPUTATIONS. Mount Prospect
 STORMWATER MANAGEMENT COMPUTATIONS Mount Prospect MHG PROJECT No. 2011.173.11 November 6, 2014 Prepared for: Piney Meetinghouse Investments c/o Mr. Dennis Fling 14801 Clopper Road Boyds, MD 20841 (301)
Technical Memorandum No
 Pajaro River Watershed Study in association with Technical Memorandum No. 1.2.10 Task: Evaluation of Four Watershed Conditions - Sediment To: PRWFPA Staff Working Group Prepared by: Gregory Morris and
HOTEL KANATA 160 HEARST WAY KANATA, ONTARIO SERVICING REPORT. Prepared for: David Johnston Architect. Prepared By:
 HOTEL KANATA 160 HEARST WAY KANATA, ONTARIO SERVICING REPORT Prepared for: David Johnston Architect Prepared By: BaseTech Consulting Inc. 309 Roywood Crescent Newmarket, Ontario L3Y 1A6 BCI Project No.
Final Drainage Report
 Final Drainage Report Expo Rail Operations and Maintenance Facility Santa Monica, California Prepared for: Exposition Metro Line Construction Authority Prepared by: W2 Design, Inc. 50 S. De Lacey Avenue
Executive Summary. Climate Change Engineering Vulnerability Assessment. B.C. Yellowhead Highway 16 Between Vanderhoof and Priestly Hill
 Executive Summary Climate Change Engineering Vulnerability Assessment Rev 3 March 27, 2011 Rev 3 Apr 27, 2011 Page 2 of 12 1 Introduction The Ministry of Transportation and Infrastructure, Province of
Phillips Ditch Drainage Study
 Phillips Ditch Drainage Study By: David L. McCormick, PE, D. WRE McCormick Engineering, LLC For: St. Joseph County, Indiana Revision Date: March 29, 2017 Table of Contents 1. INTRODUCTION... 1 1.1. Review
2016 Fall Conditions Report
 2016 Fall Conditions Report Prepared by: Hydrologic Forecast Centre Date: December 13, 2016 Table of Contents TABLE OF FIGURES... ii EXECUTIVE SUMMARY... 1 BACKGROUND... 5 SUMMER AND FALL PRECIPITATION...
Gully Erosion Part 1 GULLY EROSION AND ITS CAUSES. Introduction. The mechanics of gully erosion
 Gully Erosion Part 1 GULLY EROSION AND ITS CAUSES Gully erosion A complex of processes whereby the removal of soil is characterised by incised channels in the landscape. NSW Soil Conservation Service,
How to integrate wetland processes in river basin modeling? A West African case study
 How to integrate wetland processes in river basin modeling? A West African case study stefan.liersch@pik-potsdam.de fred.hattermann@pik-potsdam.de June 2011 Outline Why is an inundation module required?
STORMWATER MANAGEMENT REPORT
 STORMWATER MANAGEMENT REPORT THE FAIRWAYS AT EDGEWOOD LOTS 5 & 6, BLOCK 1201 TOWNSHIP OF RIVER VALE BERGEN COUNTY, NEW JERSEY PREPARED BY: DAPHNE A. GALVIN PROFESSIONAL ENGINEER LICENSE NO. 24GE03434900
Report for Area Drainage Studies for 1320 MW (2x660 MW) THERMAL POWER PROJECT AT MIRZAPUR, U.P.
 THERMAL POWER PROJECT AT MIRZAPUR, U.P.") Report for Area Drainage Studies for 1320 MW (2x660 MW) THERMAL POWER PROJECT AT MIRZAPUR, U.P. 1. Introduction M/s Welspun Energy Uttar Pradesh Ltd. (WEUPL) is putting up 1320 MW (2 x 660 MW) coal fired
Report for Area Drainage Studies for 1320 MW (2x660 MW) THERMAL POWER PROJECT AT MIRZAPUR, U.P. 1. Introduction M/s Welspun Energy Uttar Pradesh Ltd. (WEUPL) is putting up 1320 MW (2 x 660 MW) coal fired
Standards for Soil Erosion and Sediment Control in New Jersey May 2012
 STANDARD FOR SEDIMENT BASIN Definition A barrier, dam, excavated pit, or dugout constructed across a waterway or at other suitable locations to intercept and retain sediment. Basins created by construction
Illinois State Water Survey Division
 Illinois State Water Survey Division SURFACE WATER SECTION SWS Miscellaneous Publication 108 SEDIMENT YIELD AND ACCUMULATION IN THE LOWER CACHE RIVER by Misganaw Demissie Champaign, Illinois June 1989
Appendix O. Sediment Transport Modelling Technical Memorandum
 Appendix O Sediment Transport Modelling Technical Memorandum w w w. b a i r d. c o m Baird o c e a n s engineering l a k e s design r i v e r s science w a t e r s h e d s construction Final Report Don
L OWER N OOKSACK R IVER P ROJECT: A LTERNATIVES A NALYSIS A PPENDIX A: H YDRAULIC M ODELING. PREPARED BY: LandC, etc, LLC
 L OWER N OOKSACK R IVER P ROJECT: A LTERNATIVES A NALYSIS A PPENDIX A: H YDRAULIC M ODELING PREPARED BY: LandC, etc, LLC TABLE OF CONTENTS 1 Introduction... 1 2 Methods... 1 2.1 Hydraulic Model... 1 2.2
Stream Geomorphology. Leslie A. Morrissey UVM July 25, 2012
 Stream Geomorphology Leslie A. Morrissey UVM July 25, 2012 What Functions do Healthy Streams Provide? Flood mitigation Water supply Water quality Sediment storage and transport Habitat Recreation Transportation
PONDNET.WK1 - Flow and Phosphorus Routing in Pond Networks
 PONDNET.WK1 - Flow and Phosphorus Routing in Pond Networks Version 2.1 - March 1989 William W. Walker, Jr. Ph.D., Environmental Engineer 1127 Lowell Road, Concord, Massachusetts 01742 508-369-8061 PONDNET.WK1
A GIS-based Approach to Watershed Analysis in Texas Author: Allison Guettner
 Texas A&M University Zachry Department of Civil Engineering CVEN 658 Civil Engineering Applications of GIS Instructor: Dr. Francisco Olivera A GIS-based Approach to Watershed Analysis in Texas Author:
Sediment Trap. A temporary runoff containment area, which promotes sedimentation prior to discharge of the runoff through a stabilized spillway.
 Sediment Trap SC-15 Source: Caltrans Construction Site Best Management Practices Manual, 2003. Description A temporary runoff containment area, which promotes sedimentation prior to discharge of the runoff
Highland Lake Bathymetric Survey
 Highland Lake Bathymetric Survey Final Report, Prepared For: The Town of Highland Lake 612 Lakeshore Drive Oneonta, AL 35121 Prepared By: Tetra Tech 2110 Powers Ferry Road SE Suite 202 Atlanta, GA 30339
CASE STUDIES. Introduction
 Introduction The City of Winston-Salem faces the challenge of maintaining public infrastructure (e.g., water and sewer lines, storm drains, roads, culverts and bridges) while minimizing the potential impacts
City of Columbia BMP Manual. Detailed Unified Sizing Criteria Example Wet Pond Design
 City of Columbia BMP Manual Detailed Unified Sizing Criteria Example Wet Pond Design April 17, 2013 Wet Pond Example: Unified Sizing Criteria Methodology Base Data Location: Rome, GA Site Drainage Area
APPENDIX B: HYDROTECHNICAL ASSESSMENT
 Sheep Paddocks Trail Alignment Analysis APPENDIX B: HYDROTECHNICAL ASSESSMENT LEES+Associates -112- 30 Gostick Place North Vancouver, BC V7M 3G3 604.980.6011 www.nhcweb.com 300217 15 August 2013 Lees +
Caledon Villas Corporation
 Caledon Villas Corporation Functional Servicing Report Caledon Villas Residential Subdivision Town of Caledon Project No. L11-557 April 2014 Caledon Villas Corporation Town of Caledon Caledon Villas Residential
Climate Adaptation Challenges for Boston s Water and Sewer Systems
 National Association of Flood & Stormwater Management Agencies Climate Adaptation Challenges for Boston s Water and Sewer Systems John P Sullivan P.E. October 15,2014 Boston 1630 Boston 1630-2012 Boston
Solutions to Flooding on Pescadero Creek Road
 Hydrology Hydraulics Geomorphology Design Field Services Photo courtesy Half Moon Bay Review Solutions to Flooding on Pescadero Creek Road Prepared for: San Mateo County Resource Conservation District
D. MATHEMATICAL MODEL AND SIMULATION
 D. MATHEMATICAL MODEL AND SIMULATION D - i TABLE OF CONTENTS D.1 Objective of Model Development... D - 1 D.2 Selection of Software... D - 1 D.3 General Steps of Simulation by MOUSE... D - 1 D.4 Cases of
PW 001 SNOW REMOVAL AND SANDING FOR ROADWAYS AND SIDEWALKS October 6, 2014 (#223-14) Original October 19, 2015; October 15, 2018 Public Works
 Original October 19, 2015; October 15, 2018 Public Works") Policy Statement: The Village of Kitscoty will provide snow and ice control on municipal streets and sidewalks according to determined priorities. Purpose: To provide direction and information to employees
Policy Statement: The Village of Kitscoty will provide snow and ice control on municipal streets and sidewalks according to determined priorities. Purpose: To provide direction and information to employees
Technical Memorandum No Sediment Model
 Pajaro River Watershed Study in association with Technical Memorandum No. 1.2.9 Sediment Model Task: Development of Sediment Model To: PRWFPA Staff Working Group Prepared by: Gregory Morris and Elsie Parrilla
Culvert and Pipe Phasing
 Culvert and Pipe Phasing Barney Blackburn, PE, CPESC, CPSWQ NCDOT Roadside Environmental Unit Soil & Water Engineering Section Supervisor NCDOT Culvert Phasing Process Hydraulics Unit: Culvert Survey Report
Continuing Education Associated with Maintaining CPESC and CESSWI Certification
 Continuing Education Associated with Maintaining CPESC and CESSWI Certification Module 2: Stormwater Management Principles for Earth Disturbing Activities Sponsors: ODOTs Local Technical Assistance Program
In-channel coarse sediment trap Best Management Practice
 In-channel coarse sediment trap Best Management Practice By Henry R. Hudson July 2002 Environmental Management Associates Ltd., Christchurch Complexity Environmental Value Cost Low Moderate High Low Moderate
APPENDIX B DESIGN CRITERIA FOR TEMPORARY WATER QUALITY BMPS USED DURING CONSTRUCTION
 APPENDIX B DESIGN CRITERIA FOR TEMPORARY WATER QUALITY BMPS USED DURING CONSTRUCTION This Appendix presents design criteria and example calculations for the following temporary water quality BMPs for use
Hydrologic Modelling of the Upper Malaprabha Catchment using ArcView SWAT
 Hydrologic Modelling of the Upper Malaprabha Catchment using ArcView SWAT Technical briefs are short summaries of the models used in the project aimed at nontechnical readers. The aim of the PES India
2015 Fall Conditions Report
 2015 Fall Conditions Report Prepared by: Hydrologic Forecast Centre Date: December 21 st, 2015 Table of Contents Table of Figures... ii EXECUTIVE SUMMARY... 1 BACKGROUND... 2 SUMMER AND FALL PRECIPITATION...
The key natural hazards relevant to the Project area relate to seismic activity and flood risk.
 21. NATURAL HAZARDS Overview The key natural hazards relevant to the Project area relate to seismic activity and flood risk. Seismic activity, including ground shaking and liquefaction, is a significant
Pompton Lakes Dam Downstream Effects of the Floodgate Facility. Joseph Ruggeri Brian Cahill Michael Mak Andy Bonner
 Pompton Lakes Dam Downstream Effects of the Joseph Ruggeri Brian Cahill Michael Mak Andy Bonner ASFPM 2013: Overview Page 2 Overview Page 3 Overview Page 4 Overview Page 5 Overview - Historical Pompton