Practical I ArcGIS (10.0) Basics
|
|
|
- Avice Hubbard
- 5 years ago
- Views:
Transcription

 data, as well as for the")


1 Author: A.Priki Practical I ArcGIS (10.0) Basics AIM: In this workshop we will introduce one of the most commonly used GIS software, ESRI s ArcGIS. You will get a chance to familiarise yourselves with some of its features and functionalities, as well as try out some basic GIS analysis. What is ArcGIS? ArcGIS is a suite of software tools for GIS analysis. It contains a number of software compartments, the most important of which is ArcMap, which is used for display and analysis of spatial (geographical) data, as well as for the production of maps. Other compartments include ArcCatalog, which is most used for handling, organising, and linking data, ArcScene for visualising spatial data in 3D, etc. Key concepts of a GIS software: The main concept of every GIS software is based on their ability to bring together different kinds of information under one interface, as long as they all share a common characteristic, namely location information. Therefore, as you will notice in the following practical, we will be dealing with different layers of information, overlaid on top of each other in a common geographic coordinate system environment. This allows for (realistic) visualisation of things or features and other properties on the Earth s surface, and therefore, for investigation of patterns across the Earth s surface, analysis of several factors of an area and their effects, queries (in the form of what?, where?, how far?, how steep? etc. questions) and many more. 1
 VECTOR DATA Each vector layer (or vector data file) can either contain points, or lines, or polygons.")

2 Two main data models are used in a GIS software to represent the Earth s surface: a) Vector (.shp files), and b) Raster (.jpg,.tif etc.) VECTOR DATA Each vector layer (or vector data file) can either contain points, or lines, or polygons. Each point, or line, or polygon in a data file is drawn on the map according to its x,y,(z) coordinates using map symbols and at the same time corresponds to one record in the data file s Attribute table, where all the information about this point/line/polygon is stored (see below). 2
 or even a thematic (classified) surface.")
.")
3 Attribute table of a vector data file: RASTER DATA Raster data files are usually in the form of image data. They usually represent a surface in the form of a colour or black-and-white image (e.g. satellite image or aerial photograph) or even a thematic (classified) surface. Each pixel in a raster data file has a specified size (i.e. depending on the image resolution), x,y,(z) coordinates, and a pixel value which represents one property of the Earth s surface (e.g. reflectance, elevation, land use, etc.). In a single ArcMap document (map) you can display and overlay both vector and raster layers together, but each type will usually require different tools for processing. 3
4 For this practical: Consider the data files outlined below and try to answer the questions while going through the practical. Data to be used (found in the WaterDROP_GISTraining-DATA folder You will need to unzip the folder in order to use the files): Cyprus Administrative Areas: o Paphos-Limassol_districts (Vector polygons in GCS_ETRS_1989 coordinate system) o Paphos-Limassol_municipalities (Vector polygons in WGS1984_UTM_Zone_36N coordinate system) Cyprus Coastline (Vector lines in WGS1984_UTM_Zone_36N) Paphos-Limassol Roads (Vector lines in WGS1984_UTM_Zone_36N) Paphos-Limassol Forests (Vector polygons in WGS1984_UTM_Zone_36N) Paphos-Limassol Geology (Vector polygons in WGS1984_UTM_Zone_36N) Paphos-Limassol Habitats (Vector polygons in WGS1984_UTM_Zone_36N) Paphos-Limassol CORINE Land-cover 2006 (Vector polygons in WGS1984_UTM_Zone_36N) Paphos-Limassol NATURA2000 sites (Vector polygons in WGS1984_UTM_Zone_36N) Cyprus DEM (Raster Digital Elevation Model in GCS_ETRS_1989) Ezousa & Kouris watersheds layers (provided by the Cyprus Water Development Department): o River water bodies (Vector lines in WGS1984_UTM_Zone_36N) o Lakes/dams (Vector polygons in WGS1984_UTM_Zone_36N) o Watersheds (Vector polygons in WGS1984_UTM_Zone_36N) o Watersheds_subdivisions (Vector polygons in WGS1984_UTM_Zone_36N) o Groundwater monitoring stations (Vector points in WGS1984_UTM_Zone_36N) o Lake monitoring stations (Vector points in WGS1984_UTM_Zone_36N) o River monitoring stations (Vector points in WGS1984_UTM_Zone_36N) o Protected boreholes (Vector points in WGS1984_UTM_Zone_36N) o Borehole protection zones 1-3a (Vector polygon files in WGS1984_UTM_Zone_36N) o Drinking water reservoir Close Protection Zones (Vector polygons in WGS1984_UTM_Zone_36N) o Drinking water reservoir Distant Protection Zones (Vector polygons in WGS1984_UTM_Zone_36N) o KYE_irrigation_boundaries (Vector polygons in CGRS_1993_Cyprus_LTM) o Water supply Limassol (Vector polygons in CGRS_1993_Cyprus_LTM) o Water supply Paphos (Vector polygons in CGRS_1993_Cyprus_LTM) o ezousa_boreholesmonitoringpoints (Excel table containing time-series of water quantity/quality measurements at 29 borehole monitoring points in the Ezousa catchment. The x-y coordinates of the points are given in the WGS1984_UTM_Zone36N coordinate system) o ezousa1_monitoringpoints (Excel table containing time-series of water quality measurements at 9 borehole/river monitoring points in the Ezousa catchment. The x-y coordinates of the points are given in the WGS1984_UTM_Zone36N coordinate system) 4

5 ArcGIS Practical Part 1 (ArcCatalog) Organising your data: Creating a Geodatabase Create a folder on the D:\ Drive (or in your usb drive if you have one with you) named after you and copy the WaterDROP_GISTraining-DATA folder in there. Unzip the folder if you have not done so, so that you can use the files in it for the rest of the practical. Open ArcCatalog which is under ArcGIS in the All Programs menu in the Start menu. The ArcCatalog compartment of the ArcGIS suite provides a catalogue window that is used to organize, search&find and manage your geographic datasets for ArcGIS Desktop. ArcCatalog presents this information in a tree view of file directories and allows you to select a GIS item, view its properties, and to access tools to operate on the selected item(s). Click on the file directory where you have just created your folder (i.e. the D:\ drive or your usb) if you can see it on your display, otherwise click the Connect to Folder icon to locate it. Navigate to your folder and then the WaterDROP_GISTraining-DATA folder. You should see these files as shown below: 5

6 From the Contents window you can click on the different data folders we have provided and explore them to see what GIS files they contain. Clicking on a data file, you can then click on the Preview tab on top to see how this data will look like when it is displayed in ArcMap. You can navigate back to the main folders using either the catalog tree on the left or the Up one level button. Currently the data is stored as shapefiles, raster files and.xls (Excel) files. Whilst this is one way of storing data it is more convenient and organised to store data in a Geodatabase. ESRI help defines a Geodatabase as a collection of geographic datasets of various types held in a common file system folder. This means that it can store a number of different data types, for example, vector data, raster data and tables in a single file for effective file management. Reopen the WaterDROP_GISTraining-DATA folder by clicking on it in the catlog tree and then right click on it. Click New > and Personal Geodatabase and a new file will appear in your display. Name it WaterDROP_GISTraining and then your name. This file is a Geodatabase. As you may have noticed when creating the Geodatabase there are two types, File and Personal. A File Geodatabase can hold an unlimited amount of data and can be altered simultaneously on numerous computers by different users whereas a Personal Geodatabase can hold 500MB of information and can only be altered by a single user. For the purpose of this practical and since you will be the only user altering the files, a Personal Geodatabase will be suitable. After creating a Geodatabase you then normally need to add your data in it. (For the purpose of the Beginner s Practical you do not really need to add all the data in the geodatabase, but you can try a few just to see how it s done). See below for further details. After adding all the data you want in a geodatabase you can then close ArcCatalog. 6
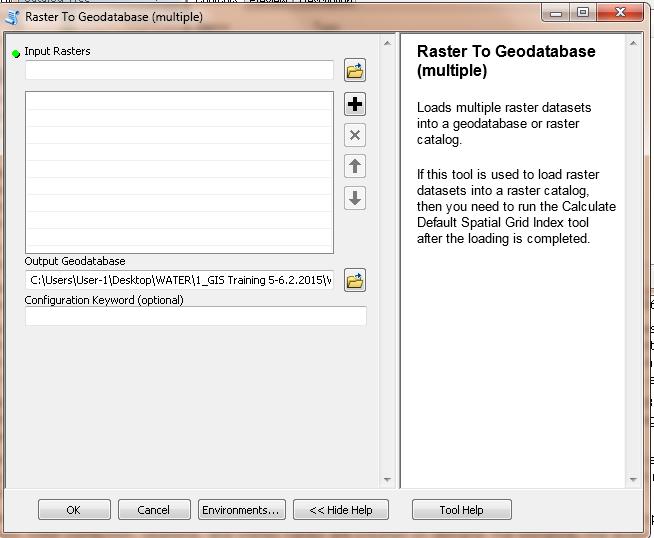
 into a geodatabase: Right click on the shapefile or the table spreadsheet you want to add, click Export and then click To Geodatabase (Single) for shapefiles, or To dbase (single) for tabular files.")
7 Adding Vector data (shapefiles) and Table data (.xls,.csv, etc.) into a geodatabase: Right click on the shapefile or the table spreadsheet you want to add, click Export and then click To Geodatabase (Single) for shapefiles, or To dbase (single) for tabular files. (Note: tabular data is added into ArcGIS as single tables, so you need to select the specific spreadsheet within an Excel file that you want to add, e.g. by double-clicking on the excel file in the directory and selecting the specific spreadsheet from inside it) [Alternatively, you can navigate to your Geodatabase instead to Import a shapefile or table spreadsheet in there. Double-click on geodatabase to open it > then right-click on the empty space inside it > Import > Feature Class (Single) for shapefile, or Table (Single) for a table.] This will bring up the following menus: For Vector: For table: The Input Features / Input Rows box displays the location of the selected file. For the Output Location select your Geodatabase by navigating to it using the button to the right of the box, selecting it (by clicking on it once) and then pressing Add. The Output Feature Class / Output Table box is the name of the file, type the name of the Shapefile or table that you are exporting, e.g. Paphos-Limassol_municipalities (shapefile) or Points (spreadsheet from the ezousa1_monitoringpoints table), and then press OK. When this finishes processing you can navigate to your geodatabase from the catalog tree and see that it contains new files which are now called Personal Geodatabase Feature Classes instead of Shapefiles and Personal Geodatabase Table instead of Excel table. Adding Raster data into a geodatabase: In a similar way of importing vector and tables in a geodatabase, you can Import rasters. Navigate to your Geodatabase, double-click on it to open > then right-click on the empty space inside it > Import > Raster Datasets. This will bring up the menu below. In the Input Rasters browse to the raster file(s) you want to import, e.g. CyDEM and click add. The Output Geodatabase should already be filled with the directory of your geodatabase. Click OK. When this finishes processing you will see new raster (or image) file(s) appearing in the geodatabase. 7
8 8
9 (ArcMap) Starting up ArcMap Go to Start button > All Programs > ArcGIS > ArcMap For a new project select a Blank map and click OK. The main ArcMap window interface should look something like this: Main Menu Standard tool bar Main Toolbar ArcToolbox -contains a lot of the ArcMap s analytical functionality Layers window (Legend window or Table of Contents) -shows a legend of the data layers Map Window -displays the data and layers Data view Layout view Refresh Displays coordinates Main Toolbar explained: Zoom in/out cursors Fixed zoom in/out Pan cursor Zoom to Full extent (of the data) Select Feature cursor Clear selected features Select elements cursor Identify cursor (brings up info for selected features) Find Go to x,y coordinate Measure tool 9
10 Setting up ArcMap for practical sessions (Activate any Extensions you will need) Customize > Extensions > [make sure any extensions you will need are checked e.g. Spatial Analyst, Tracking Analyst, Geostatistical Analyst, 3D Analyst, etc.] (Make any Toolbars you will need visible) Customize > Toolbars > [make sure any toolbars you will need are checked e.g. Tools, Editor, Georeferencing, etc.] (Set the Data Frame properties, e.g. the Coordinate System, to match your project s purpose) A data frame is the most fundamental element in a map document and in the ArcMap user interface. When you create a map, it contains a default data frame listed in the table of contents as Layers. The properties of a data frame define the context for the data with which you work; these include the coordinate system, measurement units, scale, the drawing order of layers, and so on. So, let s say you want your map to be in the WGS1984 UTM Zone 36N coordinate system which projects the area of Cyprus quite well. There are two ways in doing that. You can either right-click on the data frame ( Layers ) in the Table of contents and click on Properties, or you can click on Data Frame Properties from the View menu at the top. View > Data Frame Properties > click on the Coordinate system tab > in the Select a coordinate system box expand the 'Predefined' folder click on Projected Coordinate Systems then UTM then WGS 1984 then Northern Hemisphere and then double click on WGS 1984 UTM Zone 36N. Click OK. Any data you will now add in the map document (provided it contains spatial reference) will be projected to the WGS 1984 UTM Zone 36N system, even if the data is recorded in a different coordinate system. Adding data in ArcMap (Adding a Basemap from ArcGIS Online) click the small arrow next to the AddData button > from the drop-down list click Add Basemap > in the window that opens there is a selection of basemaps provided by ArcGIS Online which you can use as a background in your map document. The Imagery can be useful in many applications. Click on it and then click Add. (Provided you are connected to the internet, the basemap will appear in both the data window and the legend window, as a map and as a legend respectively.) (Adding data from a folder) click the AddData button > [navigate to the unzipped folder where the above datafiles are, to add data layers (e.g. the CyCoastline layer)] > click on it and Add. (The data layer will appear in both the data window and the legend window, as a map and as a legend respectively.) If you cannot find the directory you are looking for try the connect to folder button. If you still cannot see the folder look in the Look-in drop-down list to locate it. 10
11 Note1: usually one dataset (e.g. for roads) is made up of several files e.g. roads.dbf, roads.sbn, roads.sbx, roads.shp, roads.shx, etc, but only spatial and attribute data layers can be opened in ArcMap. Vector data layers are usually in.shp file format and have a point, line or polygon icon. Raster layers can be in.tif,.bil, etc, and have a grid icon. Attribute/tabular data files can be in.xls (Excel or earlier) file format, and have a table icon. (Tabular data will only appear in the legend window, not on the map, until you display its x-y information if existent, or join it to a related vector file.) Note2: When adding a vector or tabular dataset, if a window appears asking whether to create a unique ID field for the data you can click YES. This is useful when the data records do not have a unique name/number/code, since each vector feature should be able to be uniquely identified. When adding a raster dataset, if a window appears asking whether to build Pyramids you can click YES. This is a compression system and will make the application run faster. Question: Try to add the Paphos-Limassol_districts, Paphos-Limassol_municipalities and CyDEM datasets to ArcMap. Do you get any warnings about some of the layers having different Coordinate system? (Don t worry about this now, you can transform a dataset s coordinate system if needed later). What data model is each of these datasets using? Can you notice the difference between vector and raster datasets (e.g. in how they appear in the data view and table of contents)? Viewing vector data layers and their attribute tables Through the Layer Window, you can switch on and off layers (by checking / un-checking them) according to which ones you want to view in the Data Window. To see the whole extent of a data layer in the Data Window right-click on it > and then click Zoom to layer. You can also drag and drop them up and down to change their order (make sure the List by Drawing Order tab is selected at the top of the contents table). The topmost layer will appear in front of other layers in the Data Window. To view a vector layer s attribute table select the layer in the Layer Window > right-click > Open Attribute Table. You can see that it is made up of Fields and Records and that each record has an FID (Feature ID) that is a unique number identifying each of the features in the dataset, i.e. line segments /points /polygons. Right-clicking on the heading of one field gives several options, like sorting the records according to that field etc., more like in an excel table. The number of records (i.e. features) in the data layer is displayed at the bottom of the window. To select/deselect a record (i.e. a feature) click on the tab to the left of the record. You can see that it is highlighted and if you see the Data Window it is also highlighted on the map. To deselect click the Selection on the Main Menu bar > Clear Selected Features, or click the Clear Selected Features button in the main toolbar. Question: Try to view the attribute table of Paphos-Limassol_municipalities. What information does it hold for each municipality? How many municipalities exist in Paphos and Limassol? Can you find where the municipality of Choulou is located on the map? 11
12 Adding a new field in a layer s attribute table (make sure you are out of an editing session) > looking at the attribute table you want to edit, click on Table Options > Add Field > Name: [give the new field an appropriate name] > Type: [specify the type of data you are going to add to this field, e.g. short integer, long integer, float, text, etc.] > OK. (you will see a new field(column) appear on the table.) To be able to edit the field you need to turn on an editing session: Editor toolbar > Editor > Start Editing > double click in the record of the field you want to edit and enter the attribute data. When finished: click Editor > Stop Editing > Save? : Yes. Question: What would you do if you wanted to add population figures for each municipality? How to find statistical information of attribute data? Open attribute table of the vector layer you are interested in > click on a field you want to know statistical information about, e.g. municipality shape area, > right-click on the field title and you can see that a number of options exist there (e.g. you can sort the features ascending or descending according to the field s value, you can produce Statistics for the whole column, etc.) > Statistics > (a number of statistical information about the selected features are given). Question: What is the mean Area size of all municipalities of Limassol? Which is the biggest in area municipality and which is the smallest? How to find statistical information of selected features? click the Select Features button on the Main toolbar > (make sure you select from the correct layer) > select features (by holding down the SHIFT key you can select multiple) [Alternatively individual features can be selected from the layer s attribute table] > then click on Selection in the main menu > Statistics > (make sure you are looking at the correct layer > select the field that you would like some statistics on > (a number of statistical information about the selected features are given). To clear selection: Selection > Clear selected features [or click the button in the main toolbar]. Joining a table of information to an existing attribute table To add it to ArcMap: click Add data button > navigate to the table/database with the required info (it should be a.dbf or.xls file) > (table name will appear in the legend widow but this is not yet assigned to any spatial information) > you can right-click on it and Open to see what information it contains. > To join this data to its corresponding spatial data a field/column containing unique identifiers for each record, that exists in both the spatial layer s attribute table and the new attribute table is needed (in other words the two tables must have at least one field that contains common information). 12
13 To join it to a layer: right-click on the layer you want to join the table to > select Joins and Relates > Join > Join attributes from a table > select the field/column of the existing attribute table on which we will base the join > select the table you will join/add > select the field/column of the new table on which the join will be based on > OK. (if you open again the attribute table of the spatial layer it should have the data of the new table as well). Displaying x-y data from a table (Sometimes you may not have a shapefile of certain locations of interest but if their x-y coordinates are given in a table data file, you can still display them on the map.) Add the table spreadsheet with the x-y information in ArcMap. (Note: The x-coordinates should be listed in a separate column from the y-coordinates in the table for this function to work. Also, the coordinate system in which the locations were recorded, e.g. WGS84 UTM Zone36N, should be known, and the listed x-y coordinates in the table should be in the correct field data type, i.e. number values without including letters so , but not E , N ) In the table of contents the spreadsheet should appear under the List by Source list. Right click on it and then click the Display XY data option. In the menu that opens change the X Field box to the name of the column in the table that includes the x- coordinates and the Y Field box to the one that includes the y-coordinates. Under the Coordinate System box click the Edit button and then choose the coordinate system that the data was recorded in. > Click OK. > Click OK again and the points will display on the map. These points are currently temporary. This means that they will be removed when the computer is shut down. In order to make them permanent you need to export them. Right click on the Events layer that was created and select Data and then Export Data. Use the browse button and navigate into the folder you want to save the new point shapefile. Name the file and click Save and then OK. Click Yes when prompted about adding the data to the display. You can then remove the Events and table data from the display. Question: Try adding the Points spreadsheet of the ezousa1_monitoringpoints table to ArcMap and displaying the 9 monitoring points listed in it. The coordinates are recorded in the WGS84 UTM Zone 36N system. Can you see the points on the map? (Hint: Zoom to layer) Try exporting these events in a new shapefile and add it to the map. 13

14 Changing the symbology of data layers Select a layer name in the table of contents > right-click > Properties > Symbology tab > here you can set a number of parameters to determine how your data will be displayed on the map [e.g. the symbols, colours, and hierarchy based on an attribute field for vector, or the RGB composite, brightness stretch or classes for raster]. The various symbology options are listed on the left side of the symbology window (i.e. in the Show: window). Vector: For a vector layer these include the following data display options: Feature Draw all features using the same symbol (you can choose a symbol by clicking on the symbol icon) Categories Assign symbology based on unique values (e.g. district name) (you can specify the Value Field, e.g. the Name field, from which to use values for each feature and thus Add all values and choose an appropriate colour ramp to display a different colour for each value/category) Quantities graduated colors, graduated/proportional symbols, and dot maps for representing continuous values (e.g. annual rainfall or population in each area) Chart used to create pie and bar charts Multiple attributes used to show more than one attribute Question: Try to change the symbology of Paphos-Limassol_municipalities so that they are shown in unique colours according to which District the lie in. (Tip: it is always useful to check the information stored in the vector s attribute table before setting the parameters of symbology) How many colours is your data displayed in? Question: Try to change the symbology of Paphos-Limassol_municipalities again so that they are shown on a graduated colour ramp according to their shape Area size, e.g. with big municipalities being darker coloured and smaller ones lighter. Can you see the biggest municipalities? 14


15 Raster (1-band and multi-band): For a raster layer the options are slightly different and include displaying the pixel values based on an RGB composite or a Stretched colour ramp if the raster is multi-band, or based on Unique values, classed values, stretched colour ramp, or discrete colour if the raster has 1 band only. Mult-band raster: Single-band raster: For example, here the default symbolization is Stretched, in which a continuous colour or grey-scale is used to show map values ranging from lowest to highest. In other words, the colours are stretched from low to high. Perhaps a stretched symbology is not effective and you would prefer to group elevations into distinct ranges. This is done using the Classified option in the symbology window. (When you try this, you might get a message asking to compute the image histogram answer OK.) Question: Try to display the CyDEM as classified elevation areas using 10 classes. Then try to display it using stretched symbology and choosing another colour ramp than gray-scale. Which symbology looks more convenient to you? 15
16 Changing the transparency of a layer (You may need to make a layer transparent so that you can see the underlying layers too. This is especially the case where you have a raster layer in front, since you cannot make it hollow, unlike vector, to see underlying layers.) Right-click on the layer you want to make transparent > Properties > Display tab > set Transparency to a convenient % > OK. Task: Experiment with both vector and raster layers in your map to see the effect. Labelling features Right-click on layer > Properties > Labels tab > check Label features in this Layer > Label Field: [select the field that contains the information you want to label on the data, for example Name ] > you can also set other properties of the text like font, colour etc. > OK. Then right-click on the layer in the table of contents again > tick Label Features. Question: Try to add more data files from your folder, e.g. the CorineLC06, forests, Ezousa&Kouris watersheds and watershed subdivisions. Explore the attribute tables of the layers and then experiment with their symbology trying to display them in a more useful way. Can you show the names of the two watersheds on the map? Identifying information from the map click the Identify button on the main toolbar > click on any feature on the map and it will bring up all its associated information from the attribute table. From the Identify window you can specify the layer from which to identify features, using the drop-down list. 16

17 Selecting specific features from a map: Selecting by attribute (Sometimes we need to select features that satisfy some attribute criteria. Select by attribute' allows us to make simple queries on the dataset, e.g. select all cities whose population is more than ) open Attribute table of layer of interest > click on Table options > Select by Attributes [Alternatively you can click on Selection from the main menu and then Select by Attributes ] > Method: [select Create a new selection] > define a query or rule for the selection in the box below, e.g. select from municipalities layer where Shape_Length <= to write this query double click on Shape length in the box above > click <= > click Get Unique Values to get the specific values that exist under that field > select a value you are interested in by double-clicking it, or just type a number you want > click Apply > Close. (the selected features will be highlighted on the attribute table and on the map.) Question: Can you find out how many municipalities in the Paphos and Limassol districts have an area larger or equal to 25,000,000sqm? (Hint: check the bottom of the attribute table to see how many records/features have been selected) Selecting by query using structured query language (SQL) (the most powerful interaction with the attribute table we can have in ArcGIS) Selection > Select by Attributes > create a textual query using the field names, relation signs, and field categories you are interested in. (you can also make Boolean queries, e.g. using AND, OR, NOT statements. 17
18 Selecting by location click on Selection in the main menu > Select by location > Selection method [Select Features from] > target layers [select the layer(s) you want to select the features from] > Spatial selection method [you can choose the type of query from a list of operations, e.g. intersect, are within a distance of, completely contain, etc.] > source layer [specify the layer you want the query to be based on] > OK > Apply > Close. Question: Select the Ezousa watershed from the attribute table of the watersheds_main layer. Then try to select the municipalities that intersect the Ezousa watershed. Can you find out how many municipalities intersect? (Hint: check the bottom of the municipalities attribute table to see how many records/features have been selected) Exporting selected features to another shapefile right-click on the layer where the selected data is > click Data > Export Data > Export : [Selected features] > Use the same coordinate system as : [this layer s source data] > navigate to a place/directory to put this data and give the new shapefile an appropriate name > OK. > Add new data to the map? : Yes. Question: Try to export the municipalities that intersect the Ezousa watershed (selected above) to a new vector shapefile and add it in the map. Can you see the new shapefile? Check its attribute table. Is all the information there? Manually digitising features in a new vector layer Create a vector shapefile: open ArcCatalog > navigate to the location/directory you want to store the new shapefile > click File > New > Shapefile > Name: [give it a name] > Feature type: [select point/line/polygon] > Description: [give the shapefile a spatial reference] click Edit > New > Projected > Name: [give it a name, e.g. WGS1984_UTM_Zone_36N] > Select coordinate system, e.g. WGS1984_UTM_Zone_36N > OK > OK > OK (a.shp file appears in the directory). Add the new shapefile in ArcMap: click AddData button > navigate to the new shapefile > Add. Create the data: Switch on the Editor toolbar: Customize > Toolbars > check Editor > click Editor drop-down list on editor toolbar > select Start Editing > Task: [select Create New Features] > Target: [select the shapefile to store them in, i.e. the new shapefile created] > click the edit tool (arrow icon) > start digitising: left-click the mouse on a starting point along the polygon we want to digitise and continue clicking along, at the last point you can double-click to close the polygon. (if you make a mistake : right click on it > click undo.) You can create as many polygons as you want. Once you finish with the digitisation: click Editor > Stop Editing > Do you want to save your edits? : click Yes. (If you want to see your features details: click on the new shapefile layer > right click > Open Attribute table > you can see the records of the polygons created. By selecting a record you can see which polygon it belongs to on the map since that will be highlighted.) 18

19 Defining a projection (or spatial reference system) for a layer (Layers must be mapped using a common spatial reference system! We need to tell ArcGIS the type of projection the data was recorded in so that it can map them correctly. If the coordinate system for a dataset is unknown or incorrect, you can use the Define Projection tool to specify the correct coordinate system provided that you know the correct coordinate system of the dataset.) To do this go to ArcToolBox button > Data Management tools > Projections and Transformations > double-click Define Projections (for the datasets) > Input Dataset or Feature class navigate to data you want to project > Coordinate system will show the current projection of the selected data > to change it or set it click the browse button to select from a number of already defined projections > You can Select from a library of predefined projections, or Import a coordinate system from an existing dataset e.g. the WGS84 UTM projection from the municipalities layer > click Add > details of the projection will appear in the window which should look something like the one below > click OK > click Close when it s done > OK again. (Note that a.prj file will appear in the data folder for each dataset that is projected.) Note: Even though two datasets may be in different projection if the GIS software knows their projections it can re-project one over the other on the fly, unless we force it to use their original projections! To do that right-click on Layers (the data frame in the layers window) > Properties > Coordinate System > Clear any particular projection used. to reselect a specific projection right-click on layer frame > Properties > Coordinate System > Layers > select a dataset with the desired projection > select projection > OK. 19
: Switch on the Georeferencing toolbar (Customize > check Georeferencing) Right-click the layer in the Legend Window that you want to georeference > Zoom to layer > click the Add Control")
20 Georeferencing a dataset with control points if it does not have any spatial reference (if the dataset is a scanned map or image that has a square grid with numbers on it i.e. northings and eastings): Switch on the Georeferencing toolbar (Customize > check Georeferencing) Right-click the layer in the Legend Window that you want to georeference > Zoom to layer > click the Add Control Points button from the Georeferencing toolbar > Zoom to one of the corners of the grid squares where it is easy to point at one clearly seen point of the dataset (see illustration below) > left-click on the corner > then right-click > Input X and Y > X : [input the easting number written at the end of the vertical line of the grid that passes from that corner e.g ] > Y : [input the northing number written at the end of the horizontal line passing through that corner e.g ] > OK. Repeat this for other corners where you can read their scanned coordinates (have at least 4 reference points, preferably spread throughout the layer) in order to have a more trusted reprojection. > if you want to delete a control point that you have taken click the View Link Table tab from the Georeferencing toolbar (this will show you the list of points you have taken with their x,y coordinates) > Highlight the last point and click the x button on the right. > When you finish with your control points click Georeferencing drop-down list > and Update Georeferencing. (This will save the new reference of the dataset and you will notice that in your directory of the previously unreferenced dataset appears a.rrd file.) (if, however, a grid with clues (eastings and northings) is not provided you can georeference such dataset to another dataset with a known coordinate projection): Again using the Georeferencing tool click Add Control Points button > Zoom to layer of the non-georeferenced dataset > find a point that is fine and geographically distinguishable (for example a sharp corner or a cape on the map, e.g. Cape Greco on the Cyprus map) > Zoom to that point > then make sure u are using the Add Control Points cursor and left-click on that point > then go to the Layers Window, right-click the dataset with the known coordinate system 20

21 and Zoom to layer > find the same point on that map e.g. the Cape Greco point and left click again (the Add Control Points cursor should still be in use. You will notice that the two points are matched in the Data Window. > Repeat this at least with 3 more points until the unreferenced map matches the referenced map more accurately > click Georeferencing dropdown list > and Update Georeferencing. How to make a map output? The image below shows typical contents of a map. (Source: ESRI ArcGIS ) click on the Layout view icon (A4 paper icon on the bottom-left of the map view window) (the map view is selected by the Globe icon). This superimposes the map view displayed in the map window on a sheet of paper, i.e. an A4 paper layout, and allows you to add title, legend, north arrow, scale bar, etc, so that you can have a more printable or presentable map. Insert a North arrow: Insert > North arrow > select one from an option of different styles > OK > you can drag and drop it on the map to place it where you want. Insert a Scale bar: Insert > Scale bar > select one from an option of different styles > OK > you can drag and drop it on the map to place it where you want. (the scale bar automatically shows distances in the units used by the map reference system of the data frame, e.g. meters). Add a grid/graticule: View > Data Frame Properties > Grids > New Grid > select from different types, e.g. Measured Grid divides the map into a grid of map units (e.g. meters) > Grid name : [give the grid a name] > Next > Appearance : [select preferred style, e.g. Grid and labels] > Intervals : [select axis intervals for x and y, e.g. 30meters] > Next > choose axes and label styles > Next > tick for borders if needed > select either a static or updating grid > Finish > OK. (a grid will appear on the map). Insert a title: Insert > Title > type title and place it to a suitable position. Insert a legend: Insert > Legend > choose the layers you want to include in the legend, by clicking on them and using the arrows to move them to the right box > Preview if you want to check it > Finish > drag and drop. Insert information of how the map was created: Insert > Text > type info about data sources, e.g. Data compiled from the Digimap Historic Collection, projection e.g. Projected using an 21
22 Aitoff projection and OSGB1936 datum, digitisation e.g. Digitisation was undertaken by (name) on (date), and other footnotes about the map. > you can double-click the text box to arrange further properties of the text. > place the text at a suitable position. Save map: File > Save. or Export map: File > Export Map > navigate to directory, give a name, and select from a number of available graphic file types to save it as, e.g..jpg. > you can then print it as well. Question: Try to make a map layout of the Ezousa and Kouris waatersheds adding a number of map contents you think are necessary. Saving an ArcMap document File > Save > navigate to a directory where you want to save the work & give the ArcMap Document (.mxd map document) file a name. Note1: This will save the map information e.g. reference system, scale, links to the data, etc and symbology NOT THE SHAPEFILES (i.e. actual spatial data)! Note2: Also if you rename or change the location of the shapefiles during a session ArcMap may not be able to link to them with the saved map document. A (!) symbol next to a data layer checkbox means that the data was not found. 22
![PART 2 Further ArcGIS operations Converting from vector to raster data ArcToolbox > Conversion Tools > To Raster > Feature to Raster > Input features: [navigate to vector shapefile] > Field: [select](/docs-images/88/115463813/images/23-0.jpg "the field/attribute by which to classify features to convert them into raster values] > Output cell size: [type the distance on the ground (in meters) which a cell/pixel will represent on the map] >")
23 PART 2 Further ArcGIS operations Converting from vector to raster data ArcToolbox > Conversion Tools > To Raster > Feature to Raster > Input features: [navigate to vector shapefile] > Field: [select the field/attribute by which to classify features to convert them into raster values] > Output cell size: [type the distance on the ground (in meters) which a cell/pixel will represent on the map] > Output Raster: [browse to a directory to save the new raster file] > OK. (a new raster dataset will appear on the legend window). (A coarse conversion may result in stepped boundaries and topological errors!) Converting raster to vector data ArcToolbox > Conversion Tools > From Raster > Raster to Point/Polygon/Polyline > Input Raster: [navigate to raster file] > Field: [select attribute on which the conversion will be based] > Output Geometry type: [select either point, line, or polygon] > tick Generalize lines to smooth out the steppy effect of the raster boundaries > Output features: [browse to a directory and name the new vector file] > OK. (such conversions are prone to topological problems, loss of data with coarse conversions, different/unrealistic polygons appear when we generalise lines, redundant data with too high resolution, etc.) How to create overlays? click ArcToolBox button > Analysis Tools > Overlay (There are two types of Overlay: intersect & union ) Intersect > Input Features [select the feature layers that you want to overlay] > these will then be displayed in the list below > Output feature Class [select an output directory and name for the new layer] > Join Attributes (this defines which attributes from the input layers will be transferred to the output layer) [you can select ALL if you want all fields of the attribute tables to be transferred] > (Ignore cluster tolerance options) > Output type (this defines if the output layer will contain point/line or polygon data) [by selecting Input it will be in the same type as the input layers] > OK. 23
![Union > Input Features [select the feature layers that you want to overlay] > these will then be displayed in the list below > Output feature Class [select an output directory and name for the new](/docs-images/88/115463813/images/24-0.jpg "layer] > Join Attributes (this defines which attributes from the input layers will be transferred to the output layer) [you can select ALL if you want all fields of the attribute tables to be")
![transferred] > (Ignore cluster tolerance options) > OK. Creating buffers? (Sometimes it is necessary to define an area of a specified distance around features from a layer, e.g. to define protection areas of boreholes.](/docs-images/88/115463813/images/24-1.jpg ".. Buffers create polygon areas around point/line or polygon features based on a user-specified radius.")
24 Union > Input Features [select the feature layers that you want to overlay] > these will then be displayed in the list below > Output feature Class [select an output directory and name for the new layer] > Join Attributes (this defines which attributes from the input layers will be transferred to the output layer) [you can select ALL if you want all fields of the attribute tables to be transferred] > (Ignore cluster tolerance options) > OK. Creating buffers? (Sometimes it is necessary to define an area of a specified distance around features from a layer, e.g. to define protection areas of boreholes... Buffers create polygon areas around point/line or polygon features based on a user-specified radius.) click ArcToolBox button > Analysis Tools > Proximity Analysis > double click Buffer > Input Features [select the layer you want to put the buffer around] > Output Feature Class [define the directory and filename for the buffer layer you will create] > Distance [enter the distance/radius around the features that the buffer will cover, e.g. 2 kilometers] > scroll down > Dissolve type [you can select ALL to dissolve overlaps between buffer zones] > OK. Question: Add the Natura shapefile as well. Suppose there was a plan to build a new waste water treatment plant, which should not lie within any Natura sites or within the areas near Natura. How could you do this? Try to create a buffer of 500meters around Natura sites. 24
Data Structures & Database Queries in GIS
 Data Structures & Database Queries in GIS Objective In this lab we will show you how to use ArcGIS for analysis of digital elevation models (DEM s), in relationship to Rocky Mountain bighorn sheep (Ovis
In this exercise we will learn how to use the analysis tools in ArcGIS with vector and raster data to further examine potential building sites.
 GIS Level 2 In the Introduction to GIS workshop we filtered data and visually examined it to determine where to potentially build a new mixed use facility. In order to get a low interest loan, the building
The Geodatabase Working with Spatial Analyst. Calculating Elevation and Slope Values for Forested Roads, Streams, and Stands.
 GIS LAB 7 The Geodatabase Working with Spatial Analyst. Calculating Elevation and Slope Values for Forested Roads, Streams, and Stands. This lab will ask you to work with the Spatial Analyst extension.
(THIS IS AN OPTIONAL BUT WORTHWHILE EXERCISE)
") PART 2: Analysis in ArcGIS (THIS IS AN OPTIONAL BUT WORTHWHILE EXERCISE) Step 1: Start ArcCatalog and open a geodatabase If you have a shortcut icon for ArcCatalog on your desktop, double-click it to start
PART 2: Analysis in ArcGIS (THIS IS AN OPTIONAL BUT WORTHWHILE EXERCISE) Step 1: Start ArcCatalog and open a geodatabase If you have a shortcut icon for ArcCatalog on your desktop, double-click it to start
Task 1: Start ArcMap and add the county boundary data from your downloaded dataset to the data frame.
 Exercise 6 Coordinate Systems and Map Projections The following steps describe the general process that you will follow to complete the exercise. Specific steps will be provided later in the step-by-step
Tutorial 8 Raster Data Analysis
 Objectives Tutorial 8 Raster Data Analysis This tutorial is designed to introduce you to a basic set of raster-based analyses including: 1. Displaying Digital Elevation Model (DEM) 2. Slope calculations
Learning ArcGIS: Introduction to ArcCatalog 10.1
 Learning ArcGIS: Introduction to ArcCatalog 10.1 Estimated Time: 1 Hour Information systems help us to manage what we know by making it easier to organize, access, manipulate, and apply knowledge to the
MERGING (MERGE / MOSAIC) GEOSPATIAL DATA
 GEOSPATIAL DATA") This help guide describes how to merge two or more feature classes (vector) or rasters into one single feature class or raster dataset. The Merge Tool The Merge Tool combines input features from input
This help guide describes how to merge two or more feature classes (vector) or rasters into one single feature class or raster dataset. The Merge Tool The Merge Tool combines input features from input
Overlay Analysis II: Using Zonal and Extract Tools to Transfer Raster Values in ArcMap
 Overlay Analysis II: Using Zonal and Extract Tools to Transfer Raster Values in ArcMap Created by Patrick Florance and Jonathan Gale, Edited by Catherine Ressijac on March 26, 2018 If you have raster data
GIS Workshop UCLS_Fall Forum 2014 Sowmya Selvarajan, PhD TABLE OF CONTENTS
 TABLE OF CONTENTS TITLE PAGE NO. 1. ArcGIS Basics I 2 a. Open and Save a Map Document 2 b. Work with Map Layers 2 c. Navigate in a Map Document 4 d. Measure Distances 4 2. ArcGIS Basics II 5 a. Work with
Working with ArcGIS: Classification
 Working with ArcGIS: Classification 2 Abbreviations D-click R-click TOC Double Click Right Click Table of Content Introduction The benefit from the use of geographic information system (GIS) software is
INTRODUCTION TO GIS. Practicals Guide. Chinhoyi University of Technology
 INTRODUCTION TO GIS Practicals Guide Chinhoyi University of Technology Lab 1: Basic Visualisation You have been requested to make a map of Zimbabwe showing the international boundary and provinces. The
Introduction to ArcMap
 Introduction to ArcMap ArcMap ArcMap is a Map-centric GUI tool used to perform map-based tasks Mapping Create maps by working geographically and interactively Display and present Export or print Publish
How to Create Stream Networks using DEM and TauDEM
 How to Create Stream Networks using DEM and TauDEM Take note: These procedures do not describe all steps. Knowledge of ArcGIS, DEMs, and TauDEM is required. TauDEM software ( http://hydrology.neng.usu.edu/taudem/
Outline. Chapter 1. A history of products. What is ArcGIS? What is GIS? Some GIS applications Introducing the ArcGIS products How does GIS work?
 Outline Chapter 1 Introducing ArcGIS What is GIS? Some GIS applications Introducing the ArcGIS products How does GIS work? Basic data formats The ArcCatalog interface 1-1 1-2 A history of products Arc/Info
Downloading GPS Waypoints
 Downloading Data with DNR- GPS & Importing to ArcMap and Google Earth Written by Patrick Florance & Carolyn Talmadge, updated on 4/10/17 DOWNLOADING GPS WAYPOINTS... 1 VIEWING YOUR POINTS IN GOOGLE EARTH...
GIS IN ECOLOGY: ANALYZING RASTER DATA
 GIS IN ECOLOGY: ANALYZING RASTER DATA Contents Introduction... 2 Raster Tools and Functionality... 2 Data Sources... 3 Tasks... 4 Getting Started... 4 Creating Raster Data... 5 Statistics... 8 Surface
Using the Stock Hydrology Tools in ArcGIS
 Using the Stock Hydrology Tools in ArcGIS This lab exercise contains a homework assignment, detailed at the bottom, which is due Wednesday, October 6th. Several hydrology tools are part of the basic ArcGIS
Spatial Data Analysis in Archaeology Anthropology 589b. Kriging Artifact Density Surfaces in ArcGIS
 Spatial Data Analysis in Archaeology Anthropology 589b Fraser D. Neiman University of Virginia 2.19.07 Spring 2007 Kriging Artifact Density Surfaces in ArcGIS 1. The ingredients. -A data file -- in.dbf
Outline Anatomy of ArcGIS Metadata Data Types Vector Raster Conversion Adding Data Navigation Symbolization Methods Layer Files Editing Help Files
 UPlan Training Lab Exercise: Introduction to ArcGIS Outline Anatomy of ArcGIS Metadata Data Types Vector Raster Conversion Adding Data Navigation Symbolization Methods Layer Files Editing Help Files Anatomy
Introduction to ArcGIS 10.2
 Introduction to ArcGIS 10.2 Francisco Olivera, Ph.D., P.E. Srikanth Koka Lauren Walker Aishwarya Vijaykumar Keri Clary Department of Civil Engineering April 21, 2014 Contents Brief Overview of ArcGIS 10.2...
caused displacement of ocean water resulting in a massive tsunami. II. Purpose
 I. Introduction The Great Sumatra Earthquake event took place on December 26, 2004, and was one of the most notable and devastating natural disasters of the decade. The event consisted of a major initial
2G1/3G4 GIS TUTORIAL >>>>>>>>>>>>>>>>>>>>>>>>>>>>>>>>>>>>>>>>>>>>>>>>>>>>>>>>>>>>>>>>>>>>>>>>>>>>>>>>
 > University of Michigan >Taubman College of Architecture > ARCH 552, Perimeter @ Work Out [T]here, Fall 2009 >September 24, 2009 2G1/3G4 GIS TUTORIAL >>>>>>>>>>>>>>>>>>>>>>>>>>>>>>>>>>>>>>>>>>>>>>>>>>>>>>>>>>>>>>>>>>>>>>>>>>>>>>>>
Watershed Modeling Orange County Hydrology Using GIS Data
 v. 10.0 WMS 10.0 Tutorial Watershed Modeling Orange County Hydrology Using GIS Data Learn how to delineate sub-basins and compute soil losses for Orange County (California) hydrologic modeling Objectives
Delineation of Watersheds
 Delineation of Watersheds Adirondack Park, New York by Introduction Problem Watershed boundaries are increasingly being used in land and water management, separating the direction of water flow such that
Automatic Watershed Delineation using ArcSWAT/Arc GIS
 Automatic Watershed Delineation using ArcSWAT/Arc GIS By: - Endager G. and Yalelet.F 1. Watershed Delineation This tool allows the user to delineate sub watersheds based on an automatic procedure using
Popular Mechanics, 1954
 Introduction to GIS Popular Mechanics, 1954 1986 $2,599 1 MB of RAM 2017, $750, 128 GB memory, 2 GB of RAM Computing power has increased exponentially over the past 30 years, Allowing the existence of
Task 1: Open ArcMap and activate the Spatial Analyst extension.
 Exercise 10 Spatial Analyst The following steps describe the general process that you will follow to complete the exercise. Specific steps will be provided later in the step-by-step instructions component
GEOREFERENCING, PROJECTIONS Part I. PRESENTING DATA Part II
 Week 7 GEOREFERENCING, PROJECTIONS Part I PRESENTING DATA Part II topics of the week Georeferencing Coordinate systems Map Projections ArcMap and Projections Geo-referencing Geo-referencing is the process
CE 365K Exercise 1: GIS Basemap for Design Project Spring 2014 Hydraulic Engineering Design
 CE 365K Exercise 1: GIS Basemap for Design Project Spring 2014 Hydraulic Engineering Design The purpose of this exercise is for you to construct a basemap in ArcGIS for your design project. You may execute
In order to follow this exercise you need to have completed exercise 1.
 In order to follow this exercise you need to have completed exercise 1. Contents of Exercise 2: Derive new datasets from inputs and carry out Multicriteria analysis in order to Part 1: Use Spatial Analysis
Determining the Location of the Simav Fault
 Lindsey German May 3, 2012 Determining the Location of the Simav Fault 1. Introduction and Problem Formulation: The issue I will be focusing on involves interpreting the location of the Simav fault in
Global Atmospheric Circulation Patterns Analyzing TRMM data Background Objectives: Overview of Tasks must read Turn in Step 1.
 Global Atmospheric Circulation Patterns Analyzing TRMM data Eugenio Arima arima@hws.edu Hobart and William Smith Colleges Department of Environmental Studies Background: Have you ever wondered why rainforests
Vector Analysis: Farm Land Suitability Analysis in Groton, MA
 Vector Analysis: Farm Land Suitability Analysis in Groton, MA Written by Adrienne Goldsberry, revised by Carolyn Talmadge 10/9/2018 Introduction In this assignment, you will help to identify potentially
Handling Raster Data for Hydrologic Applications
 Handling Raster Data for Hydrologic Applications Prepared by Venkatesh Merwade Lyles School of Civil Engineering, Purdue University vmerwade@purdue.edu January 2018 Objective The objective of this exercise
GIS CONCEPTS ARCGIS METHODS AND. 2 nd Edition, July David M. Theobald, Ph.D. Natural Resource Ecology Laboratory Colorado State University
 GIS CONCEPTS AND ARCGIS METHODS 2 nd Edition, July 2005 David M. Theobald, Ph.D. Natural Resource Ecology Laboratory Colorado State University Copyright Copyright 2005 by David M. Theobald. All rights
Lecture 2. Introduction to ESRI s ArcGIS Desktop and ArcMap
 Lecture 2 Introduction to ESRI s ArcGIS Desktop and ArcMap Outline ESRI What is ArcGIS? ArcGIS Desktop ArcMap Overview Views Layers Attribute Tables Help! Scale Tips and Tricks ESRI Environmental Systems
v Prerequisite Tutorials GSSHA WMS Basics Watershed Delineation using DEMs and 2D Grid Generation Time minutes
 v. 10.1 WMS 10.1 Tutorial GSSHA WMS Basics Creating Feature Objects and Mapping Attributes to the 2D Grid Populate hydrologic parameters in a GSSHA model using land use and soil data Objectives This tutorial
NR402 GIS Applications in Natural Resources
 NR402 GIS Applications in Natural Resources Lesson 1 Introduction to GIS Eva Strand, University of Idaho Map of the Pacific Northwest from http://www.or.blm.gov/gis/ Welcome to NR402 GIS Applications in
Spatial Analysis using Vector GIS THE GOAL: PREPARATION:
 PLAN 512 GIS FOR PLANNERS Department of Urban and Environmental Planning University of Virginia Fall 2006 Prof. David L. Phillips Spatial Analysis using Vector GIS THE GOAL: This tutorial explores some
Within this document, the term NHDPlus is used when referring to NHDPlus Version 2.1 (unless otherwise noted).
.") Exercise 7 Watershed Delineation Using ArcGIS Spatial Analyst Last Updated 4/6/2017 Within this document, the term NHDPlus is used when referring to NHDPlus Version 2.1 (unless otherwise noted). There
Exercise 7 Watershed Delineation Using ArcGIS Spatial Analyst Last Updated 4/6/2017 Within this document, the term NHDPlus is used when referring to NHDPlus Version 2.1 (unless otherwise noted). There
Environmental Systems Research Institute
 Introduction to ArcGIS ESRI Environmental Systems Research Institute Redlands, California 2 ESRI GIS Development Arc/Info (coverage model) Versions 1-7 from 1980 1999 Arc Macro Language (AML) ArcView (shapefile
Displaying Latitude & Longitude Data (XY Data) in ArcGIS
 in ArcGIS") Displaying Latitude & Longitude Data (XY Data) in ArcGIS Created by Barbara Parmenter and updated on 2/15/2018 If you have a table of data that has longitude and latitude, or XY coordinates, you can view
Displaying Latitude & Longitude Data (XY Data) in ArcGIS Created by Barbara Parmenter and updated on 2/15/2018 If you have a table of data that has longitude and latitude, or XY coordinates, you can view
How do I do that in Quantum GIS: illustrating classic GIS tasks Edited by: Arthur J. Lembo, Jr.; Salisbury University
 How do I do that in Quantum GIS: illustrating classic GIS tasks Edited by: Arthur J. Lembo, Jr.; Salisbury University How do I do that in Quantum GIS Page 1 Introduction from the editor:... 4 Database
GIS IN ECOLOGY: ANALYZING RASTER DATA
 GIS IN ECOLOGY: ANALYZING RASTER DATA Contents Introduction... 2 Tools and Functionality for Raster Data... 2 Data Sources... 3 Tasks... 4 Getting Started... 4 Creating Raster Data... 5 Summary Statistics...
ArcGIS 9 ArcGIS StreetMap Tutorial
 ArcGIS 9 ArcGIS StreetMap Tutorial Copyright 2001 2008 ESRI All Rights Reserved. Printed in the United States of America. The information contained in this document is the exclusive property of ESRI. This
Lab 2: Projecting Geographic Data
 Lab 2: Projecting Geographic Data What you ll Learn: Basic methods for map projections in ArcMap. What You ll Produce: A map of Minnesota in three different statewide projections, a map of reprojected
ENV101 EARTH SYSTEMS
 ENV101 EARTH SYSTEMS Practical Exercise 2 Introduction to ArcMap and Map Projections 1. OVERVIEW This practical is designed to familiarise students with the use of ArcMap for visualising spatial data and
GIS Software. Evolution of GIS Software
 GIS Software The geoprocessing engines of GIS Major functions Collect, store, mange, query, analyze and present Key terms Program collections of instructions to manipulate data Package integrated collection
The data for this lab comes from McDonald Forest. We will be working with spatial data representing the forest boundary, streams, roads, and stands.
 GIS LAB 6 Using the Projection Utility. Converting Data to Oregon s Approved Lambert Projection. Determining Stand Size, Stand Types, Road Length, and Stream Length. This lab will ask you to work with
Today: GEOL 452/552 - GIS for Geoscientists I. Lecture 3 - Chapter 1. GIS vector Data (review) Let s annotate this layer (draw on paper)
 Let s annotate this layer (draw on paper)") Today: GEOL 452/552 - GIS for Geoscientists I Lecture 3 - Chapter 1 GIS vector data - review raster data history: ArcView/ArcINFO - ArcGIS types of GIS data files Lab: finish Ch. 1 tutorial and HW1 Please
Today: GEOL 452/552 - GIS for Geoscientists I Lecture 3 - Chapter 1 GIS vector data - review raster data history: ArcView/ArcINFO - ArcGIS types of GIS data files Lab: finish Ch. 1 tutorial and HW1 Please
Lecture 2. A Review: Geographic Information Systems & ArcGIS Basics
 Lecture 2 A Review: Geographic Information Systems & ArcGIS Basics GIS Overview Types of Maps Symbolization & Classification Map Elements GIS Data Models Coordinate Systems and Projections Scale Geodatabases
Performing Map Cartography. using Esri Production Mapping
 AGENDA Performing Map Cartography Presentation Title using Esri Production Mapping Name of Speaker Company Name Kannan Jayaraman Agenda Introduction What s New in ArcGIS 10.1 ESRI Production Mapping Mapping
GIS CONCEPTS ARCGIS METHODS AND. 3 rd Edition, July David M. Theobald, Ph.D. Warner College of Natural Resources Colorado State University
 GIS CONCEPTS AND ARCGIS METHODS 3 rd Edition, July 2007 David M. Theobald, Ph.D. Warner College of Natural Resources Colorado State University Copyright Copyright 2007 by David M. Theobald. All rights
Geography 281 Map Making with GIS Project Four: Comparing Classification Methods
 Geography 281 Map Making with GIS Project Four: Comparing Classification Methods Thematic maps commonly deal with either of two kinds of data: Qualitative Data showing differences in kind or type (e.g.,
1. Double-click the ArcMap icon on your computer s desktop. 2. When the ArcMap start-up dialog box appears, click An existing map and click OK.
 Module 2, Lesson 1 The earth moves In this activity, you will observe worldwide patterns of seismic activity (earthquakes) and volcanic activity (volcanoes). You will analyze the relationships of those
WORKING WITH DMTI DIGITAL ELEVATION MODELS (DEM)
") WORKING WITH DMTI DIGITAL ELEVATION MODELS (DEM) Contents (Ctrl-Click to jump to a specific page) Manipulating the DEM Step 1: Finding the DEM Tiles You Need... 2 Step 2: Importing the DEM Tiles into ArcMap...
WORKING WITH DMTI DIGITAL ELEVATION MODELS (DEM) Contents (Ctrl-Click to jump to a specific page) Manipulating the DEM Step 1: Finding the DEM Tiles You Need... 2 Step 2: Importing the DEM Tiles into ArcMap...
Working with Digital Elevation Models and Digital Terrain Models in ArcMap 9
 Working with Digital Elevation Models and Digital Terrain Models in ArcMap 9 1 TABLE OF CONTENTS INTRODUCTION...3 WORKING WITH DIGITAL TERRAIN MODEL (DTM) DATA FROM NRVIS, CITY OF KITCHENER, AND CITY OF
GEOG 487 Lesson 7: Step-by-Step Activity
 GEOG 487 Lesson 7: Step-by-Step Activity Part I: Review the Relevant Data Layers and Organize the Map Document In Part I, we will review the data and organize the map document for analysis. 1. Unzip the
These modules are covered with a brief information and practical in ArcGIS Software and open source software also like QGIS, ILWIS.
 Online GIS Training and training modules covered are: 1. ArcGIS, Analysis, Fundamentals and Implementation 2. ArcGIS Web Data Sharing 3. ArcGIS for Desktop 4. ArcGIS for Server These modules are covered
EnvSci 360 Computer and Analytical Cartography
 EnvSci 360 Computer and Analytical Cartography Lecture 7 Mapping Images, Surfaces, and 3-D Data Brief Overview of Imagery What is Imagery? A spatial data model that defines space as an array of equally
Geography 281 Map Making with GIS Project Eight: Comparing Map Projections
 Geography 281 Map Making with GIS Project Eight: Comparing Map Projections In this activity, you will do a series of projection comparisons using maps at different scales and geographic extents. In this
Exercise 4. Watershed and Stream Network Delineation
 Exercise 4. Watershed and Stream Network Delineation GIS in Water Resources, Fall 2014 Prepared by David G Tarboton and David R. Maidment Purpose The purpose of this exercise is to illustrate watershed
Exercise 6: Using Burn Severity Data to Model Erosion Risk
 Exercise 6: Using Burn Severity Data to Model Erosion Risk Document Updated: November 2009 Software Versions: ERDAS Imagine 9.3 and ArcGIS 9.3, Microsoft Office 2007 Introduction A common use of burn severity
Using a GIS to Calculate Area of Occupancy. Part 1: Creating a Shapefile Grid
 Using a GIS to Calculate Area of Occupancy Part 1: Creating a Shapefile Grid By Ryan Elliott California Natural Diversity Database, A NatureServe network program December 2008 This document describes the
Urban Canopy Tool User Guide `bo`
 Urban Canopy Tool User Guide `bo` ADMS Urban Canopy Tool User Guide Version 2.0 June 2014 Cambridge Environmental Research Consultants Ltd. 3, King s Parade Cambridge CB2 1SJ UK Telephone: +44 (0)1223
ST-Links. SpatialKit. Version 3.0.x. For ArcMap. ArcMap Extension for Directly Connecting to Spatial Databases. ST-Links Corporation.
 ST-Links SpatialKit For ArcMap Version 3.0.x ArcMap Extension for Directly Connecting to Spatial Databases ST-Links Corporation www.st-links.com 2012 Contents Introduction... 3 Installation... 3 Database
WlLPEN L. GORR KRISTEN S. KURLAND. Universitats- und Landesbibliothek. Bibliothek Architektur und Stadtebau ESRI
 hj WlLPEN L. GORR KRISTEN S. KURLAND Universitats- und Landesbibliothek Darmstadt Bibliothek Architektur und Stadtebau ESRI Contents Acknowledgments Preface xvii XV GIS Tutorial 1 Introduction Launch ArcMap
Working with Digital Elevation Models and Spot Heights in ArcMap
 Working with Digital Elevation Models and Spot Heights in ArcMap 10.3.1 1 TABLE OF CONTENTS INTRODUCTION... 3 WORKING WITH SPOT HEIGHTS FROM NRVIS, CITY OF KITCHENER, AND CITY OF TORONTO...4 WORKING WITH
Lauren Jacob May 6, Tectonics of the Northern Menderes Massif: The Simav Detachment and its relationship to three granite plutons
 Lauren Jacob May 6, 2010 Tectonics of the Northern Menderes Massif: The Simav Detachment and its relationship to three granite plutons I. Introduction: Purpose: While reading through the literature regarding
Lab 1: Importing Data, Rectification, Datums, Projections, and Coordinate Systems
 Lab 1: Importing Data, Rectification, Datums, Projections, and Coordinate Systems Topics covered in this lab: i. Importing spatial data to TAS ii. Rectification iii. Conversion from latitude/longitude
IMPERIAL COUNTY PLANNING AND DEVELOPMENT
 IMPERIAL COUNTY PLANNING AND DEVELOPMENT GEODATABASE USER MANUAL FOR COUNTY BUSINESS DEVELOPMENT GIS June 2010 Prepared for: Prepared by: County of Imperial Planning and Development 801 Main Street El
Lesson Plan 2 - Middle and High School Land Use and Land Cover Introduction. Understanding Land Use and Land Cover using Google Earth
 Understanding Land Use and Land Cover using Google Earth Image an image is a representation of reality. It can be a sketch, a painting, a photograph, or some other graphic representation such as satellite
Esri UC2013. Technical Workshop.
 Esri International User Conference San Diego, California Technical Workshops July 9, 2013 CAD: Introduction to using CAD Data in ArcGIS Jeff Reinhart & Phil Sanchez Agenda Overview of ArcGIS CAD Support
Introduction INTRODUCTION TO GIS GIS - GIS GIS 1/12/2015. New York Association of Professional Land Surveyors January 22, 2015
 New York Association of Professional Land Surveyors January 22, 2015 INTRODUCTION TO GIS Introduction GIS - GIS GIS 1 2 What is a GIS Geographic of or relating to geography the study of the physical features
Presenting Tree Inventory. Tomislav Sapic GIS Technologist Faculty of Natural Resources Management Lakehead University
 Presenting Tree Inventory Tomislav Sapic GIS Technologist Faculty of Natural Resources Management Lakehead University Suggested Options 1. Print out a Google Maps satellite image of the inventoried block
EXERCISE 12: IMPORTING LIDAR DATA INTO ARCGIS AND USING SPATIAL ANALYST TO MODEL FOREST STRUCTURE
 EXERCISE 12: IMPORTING LIDAR DATA INTO ARCGIS AND USING SPATIAL ANALYST TO MODEL FOREST STRUCTURE Document Updated: December, 2007 Introduction This exercise is designed to provide you with possible silvicultural
Watershed Delineation
 Watershed Delineation Jessica L. Watkins, University of Georgia 2 April 2009 Updated by KC Love February 25, 2011 PURPOSE For this project, I delineated watersheds for the Coweeta synoptic sampling area
Exercise 4 Estimating the effects of sea level rise on coastlines by reclassification
 Exercise 4 Estimating the effects of sea level rise on coastlines by reclassification Due: Thursday February 1; at the start of class Goal: Get familiar with symbolizing and making time-series maps of
GIS Boot Camp for Education June th, 2011 Day 1. Instructor: Sabah Jabbouri Phone: (253) x 4854 Office: TC 136
 x 4854 Office: TC 136") GIS Boot Camp for Education June 27-30 th, 2011 Day 1 Instructor: Sabah Jabbouri Phone: (253) 833-9111 x 4854 Office: TC 136 Email: sjabbouri@greenriver.edu http://www.instruction.greenriver.edu/gis/ Summer
GIS Boot Camp for Education June 27-30 th, 2011 Day 1 Instructor: Sabah Jabbouri Phone: (253) 833-9111 x 4854 Office: TC 136 Email: sjabbouri@greenriver.edu http://www.instruction.greenriver.edu/gis/ Summer
Studying Topography, Orographic Rainfall, and Ecosystems (STORE)
") Studying Topography, Orographic Rainfall, and Ecosystems (STORE) Introduction Basic Lesson 3: Using Microsoft Excel to Analyze Weather Data: Topography and Temperature This lesson uses NCDC data to compare
Studying Topography, Orographic Rainfall, and Ecosystems (STORE) Introduction Basic Lesson 3: Using Microsoft Excel to Analyze Weather Data: Topography and Temperature This lesson uses NCDC data to compare
INTRODUCTION TO ARCGIS Version 10.*
 Week 3 INTRODUCTION TO ARCGIS Version 10.* topics of the week Overview of ArcGIS Using ArcCatalog Overview of ArcGIS Desktop ArcGIS Overview Scalable desktop applications ArcView ArcEditor ArcInfo ArcGIS
Studying Topography, Orographic Rainfall, and Ecosystems (STORE)
") Introduction Studying Topography, Orographic Rainfall, and Ecosystems (STORE) Lesson: Using ArcGIS Explorer to Analyze the Connection between Topography, Tectonics, and Rainfall GIS-intensive Lesson This
Introduction Studying Topography, Orographic Rainfall, and Ecosystems (STORE) Lesson: Using ArcGIS Explorer to Analyze the Connection between Topography, Tectonics, and Rainfall GIS-intensive Lesson This
Create Satellite Image, Draw Maps
 Create Satellite Image, Draw Maps 1. The goal Using Google Earth, we want to create and import a background file into our Adviser program. From there, we will be creating paddock boundaries. The accuracy
SIE 509 Principles of GIS Exercise 5 An Introduction to Spatial Analysis
 SIE 509 Principles of GIS Exercise 5 An Introduction to Spatial Analysis Due: Oct. 31, 2017 Total Points: 50 Introduction: The Governor of Maine is asking communities to look at regionalization for major
Exercise 3: GIS data on the World Wide Web
 Exercise 3: GIS data on the World Wide Web These web sites are a few examples of sites that are serving free GIS data. Many other sites exist. Search in Google or other search engine to find GIS data for
Electric Fields and Equipotentials
 OBJECTIVE Electric Fields and Equipotentials To study and describe the two-dimensional electric field. To map the location of the equipotential surfaces around charged electrodes. To study the relationship
Acknowledgments xiii Preface xv. GIS Tutorial 1 Introducing GIS and health applications 1. What is GIS? 2
 Acknowledgments xiii Preface xv GIS Tutorial 1 Introducing GIS and health applications 1 What is GIS? 2 Spatial data 2 Digital map infrastructure 4 Unique capabilities of GIS 5 Installing ArcView and the
Brief Overview of Geodatabases. Procedure IT GEOGRAPHIC INFORMATION SYSTEMS LAB 9 GEODATABASE AND DIGITIZING SHAPEFILED
 Developing entirely new maps using on-screen digitizing to create spatial features (such as points, lines, and polygons) is a vital GIS capability. ArcGIS provides a useful, but proprietary, spatial data
ArcGIS Pro: Essential Workflows STUDENT EDITION
 ArcGIS Pro: Essential Workflows STUDENT EDITION Copyright 2018 Esri All rights reserved. Course version 6.0. Version release date August 2018. Printed in the United States of America. The information contained
How to Make or Plot a Graph or Chart in Excel
 This is a complete video tutorial on How to Make or Plot a Graph or Chart in Excel. To make complex chart like Gantt Chart, you have know the basic principles of making a chart. Though I have used Excel
Working with Digital Elevation Models in ArcGIS 8.3
 Working with Digital Elevation Models in ArcGIS 8.3 The homework that you need to turn in is found at the end of this document. This lab continues your introduction to using the Spatial Analyst Extension
Esri EADA10. ArcGIS Desktop Associate. Download Full Version :
 Esri EADA10 ArcGIS Desktop Associate Download Full Version : http://killexams.com/pass4sure/exam-detail/eada10 Question: 85 Which format is appropriate for exporting map documents that require vector layers
SCHOOL OF ENGINEERING AND TECHNOLOGY COMPUTER LAB
 PHASE 1_6 TH SESSION ARCGIS TRAINING AT KU GIS LABS: INTRODUCTION TO GIS: EXPLORING ARCCATALOG AND ARCGIS TOOLS 6 TH SESSION REPORT: 3 RD -5 TH SEPTEMBER 2014 SCHOOL OF ENGINEERING AND TECHNOLOGY COMPUTER
Exercise 6: Working with Raster Data in ArcGIS 9.3
 Exercise 6: Working with Raster Data in ArcGIS 9.3 Why Spatial Analyst? Grid query Grid algebra Grid statistics Summary by zone Proximity mapping Reclassification Histograms Surface analysis Slope, aspect,
Building a Hydrologic Base Map Prepared by David R. Maidment Waterways Centre for Freshwater Research University of Canterbury
 Building a Hydrologic Base Map Prepared by David R. Maidment Waterways Centre for Freshwater Research University of Canterbury 14 March 2018 Goals of the Exercise This exercise shows how to develop a hydrologic
Session 2: Exploring GIS
 EMB/RTC-GIS/Event 2/Session 2/1 Session 2: Exploring GIS Map Production - Exploring various GIS functions Objectives: 1. To create a map layer Air Pollution Index (API) and its attribute table 2. To symbolize
Compilation of GIS data for the Lower Brazos River basin
 Compilation of GIS data for the Lower Brazos River basin Francisco Olivera, Ph.D., P.E. Srikanth Koka Lauren Walker Aishwarya Vijaykumar Department of Civil Engineering December 5, 2011 Contents Brief
Week 8 Cookbook: Review and Reflection
 : Review and Reflection Week 8 Overview 8.1) Review and Reflection 8.2) Making Intelligent Maps: The map sheet as a blank canvas 8.3) Making Intelligent Maps: Base layers and analysis layers 8.4) ArcGIS
Creating Watersheds from a DEM
 Creating Watersheds from a DEM These instructions enable you to create watersheds of specified area using a good quality Digital Elevation Model (DEM) in ArcGIS 8.1. The modeling is performed in ArcMap